Abstract
This paper deals with the problem that actual building regulations do not reflect the climate targets set by the Paris Agreement. To address this, a benchmark was developed for greenhouse gas (GHG) emissions of buildings on the basis of the Emissions Gap Report. We first applied an equal allocation of the GHG emission limit for 2030 among the forecasted population to calculate a virtual personal GHG emission limit. We took a proportion of this personal limit for the purpose of housing and extrapolated it for the whole building based on the number of occupants. We also undertook a case study of an actual multifamily residential building and compared its standard design to the benchmark using a simplified life cycle assessment (LCA) method in line with the national SBToolCZ method. The results showed that the assessed residential house exceeded the emission requirement by a factor of 2.5. Based on the assessment, six sets of saving measures were proposed to reduce the operational and embodied GHG emissions. The saving measures included change in temperature zoning, improvement of the U-values of the building envelope, exchange of construction materials for reduced embodied GHG emissions, exchange of heat source for biomass boiler, introduction of light-emitting diode (LED) lighting, use of mechanical ventilation with heat recovery, addition of vacuum solar collectors, and the addition of photovoltaic (PV) panels. Finally, the variants were compared and their suitability in the Czech conditions was examined.
1. Introduction
Climate change is one of the greatest challenges facing humankind. The amount of greenhouse gas (GHG) emissions that society releases into the atmosphere has to be reduced significantly and quickly. Otherwise, there is a risk of unprecedented changes in the atmosphere and consequently in the biosphere and the living conditions for people [1]. Bold actions are therefore needed across all scales and areas of human activities [2,3].
The construction sector, together with the operation of the existing building stock, is a significant emitter of GHG emissions. According to the European Commission, buildings are responsible for approximately 40% of energy consumption and 36% of CO2 emissions in the European Union (EU) [4]. At the same time, the potential for delivering significant and cost-effective reductions of GHG emissions in buildings is the highest [5]. To unleash this potential, the EU has implemented the Energy Performance of Buildings Directive (EPBD), which prescribes the energy efficiency levels for new buildings and renovations. The directive has been a significant impetus for recent improvements in energy efficiency of newly designed buildings and retrofitting. However, in the light of climate goals and actions needed to achieve carbon neutrality around 2050, this improvement is still not sufficient. The main problem with the directive is that the performance levels for buildings were set applying a bottom-up approach by tightening the energy efficiency benchmarks that were in place before. The requirement to move towards the climatic goals set by the Paris Agreement [6] is therefore not ensured.
A body of literature has investigated paths to the low- or zero-emission (or carbon-neutral) operation of the building stock of various countries. In 2007, Boardman [7] looked at measures that would reduce the GHG emissions of the UK building stock by 60%. Koo et al. [8] developed an integrated, multiobjective optimization model for establishing a low-carbon scenario to achieve the national carbon emission reduction target for South Korea’s residential building sector. Bürger et al. [9,10] investigated the German building stock and its possible pathways to zero-carbon operation by 2050. Lupíšek [11] reviewed proposed deep energy retrofitting scenarios of the Czech building stock and compared the resulting GHG emission savings with the national carbon budget.
There are studies available that optimize the building design in order to significantly reduce the energy demand and related GHG emissions [12] as well as papers that propose ways to design zero-emission buildings [13,14]. This might already be feasible in some locations or specific boundary conditions, but it is not yet the case for the regular construction market. Therefore, benchmarks using a top-down approach that come from the planetary boundaries [15,16] (or carbon budget) to individual buildings need to be derived and tested in real cases so that policymakers can integrate them into national regulatory systems.
This proposal is not new, with benchmarks for construction in Switzerland already being proposed by Zimmermann et al. back in 2005 [17]. However, the problem has gained traction with the increasing focus on climate change. Hoxha [18] followed it up in 2016, and resolving this issue is now one of the main objectives of the ongoing “Annex 72: Assessing life cycle related environmental impacts caused by buildings” of the International Energy Agency’s Energy in Buildings and Communities Programme [19]. Hollberg et al. [16] combined the top-down approach, deriving climate benchmarks from the Paris Agreement, with a bottom-up approach based on statistics to create a tool for the optimization of embodied GHG emission in the early building design stages. The topic was discussed in June 2019 at the 71st LCA Forum [20], and it was one of the intensively discussed topics of the Sustainable Built Environment D-A-CH Conference 2019 in Graz. One of the keynote speakers, Head of the Department of Building, Construction Industry and Federal Buildings at the German Federal Ministry of the Interior, Building and Community, Fehn Krestas, mentioned that the German climate sector goals “could be interpreted as the remaining CO2-eq. budget for real estate utilization” [21]. Later on, Chandrakumar et al. [22] introduced top-down targets for New Zealand, and Hollberg et al. [23] showed how to utilize the carbon budget in decision-making in the building design process.
Such a study has been missing for the conditions of Czechia so far, so the main objective of the work presented in this paper was to (i) draft a benchmark in terms of GHG emissions for new buildings, focusing on residential buildings as the largest building segment; (ii) make a case study to compare usual building design with the benchmark; (iii) draft design improvements leading to compliance with the set benchmark; and (iv) evaluate whether the levels of GHG emissions required to fulfill the targets set by the Paris Agreement are workable in the Czech conditions or whether they represent improvements to building design that are too radical and more systemic changes are thus needed in the way we design and construct residential buildings nowadays.
The main contributions of this paper are as follows: (i) promoting the actual idea that some kind of GHG benchmarks at a building level will be needed in the very near future if states want to achieve the climate goals set by the Paris Agreement; (ii) providing an example of how these benchmarks can be set; (iii) presenting a case study showing how we can work with the GHG goals in Czechia; and (iv) discussing how a typical design of a multifamily residential building can be modified to meet the 2030 targets.
This article is based on an MSc thesis by David Pálenský [24], where more details can be found (publicly available but in Czech language only).
2. Materials and Methods
This section describes the setting of the benchmark, the building selected for the case study, the boundary conditions, the procedure of evaluation of the original building design, and the strategy applied to design improvements to comply with the benchmark.
2.1. Setting the Benchmark
As described in the introduction, the objective of the work was to draft a top-down benchmark that would reflect the global GHG emission targets set by the Paris Agreement. As a starting step, we worked with the Emissions Gap Report 2018 (EGR) [25], which dealt with various scenarios of future development of global GHG emissions. It set maximum amounts of global GHG emissions that can be emitted in 2030 so that the rise of the global mean surface temperature still stays below the 2 or 1.5 °C target compared to the preindustrial era. In Table 3.1 on page 19, the EGR states the maximum global amount of GHG emissions in 2030 as 40 Gt CO2e for the 2 °C target and only 24 Gt CO2e to stay below 1.5 °C temperature rise (both with 66% chance), which represents a reduction by approximately one-quarter and more than one-half, respectively, compared to annual GHG emissions.
In order to set the benchmark, the 2030 emissions from the global figure needed to be allocated to individual buildings in Czechia. Debate surrounding which allocation principles of carbon budget or emission allowances should be applied to ensure fairness or which burden-sharing mechanisms should be applied is still ongoing [26,27,28,29]. For the purpose of this work, we used equal per capita distribution using the forecast of the world population in 2030 [30]. Once we divided the 2030 annual allowances, i.e., 40 and 24 Gt CO2e, by the forecasted population of 8.55 billion, we got the personal annual allowances of 4.68 and 2.81 t CO2e per capita, respectively.
Finally, as a proxy, we used a figure of 23.35%, which represented an estimated share of the residential building stock on the national CO2 emissions in 2014 [31] (the calculation behind the figure is presented in [11], which updated the figures slightly for 2015). By multiplying the personal allowance by 23.35%, we arrived at an annual personal 2030 allowance for housing of 1.09 t CO2e for the 2 °C target and 0.66 t for the 1.5 °C target, which could then be extrapolated to an allowance for a residential building by multiplying the figures by the planned number of building occupants.
2.2. Description of the Case Study Building
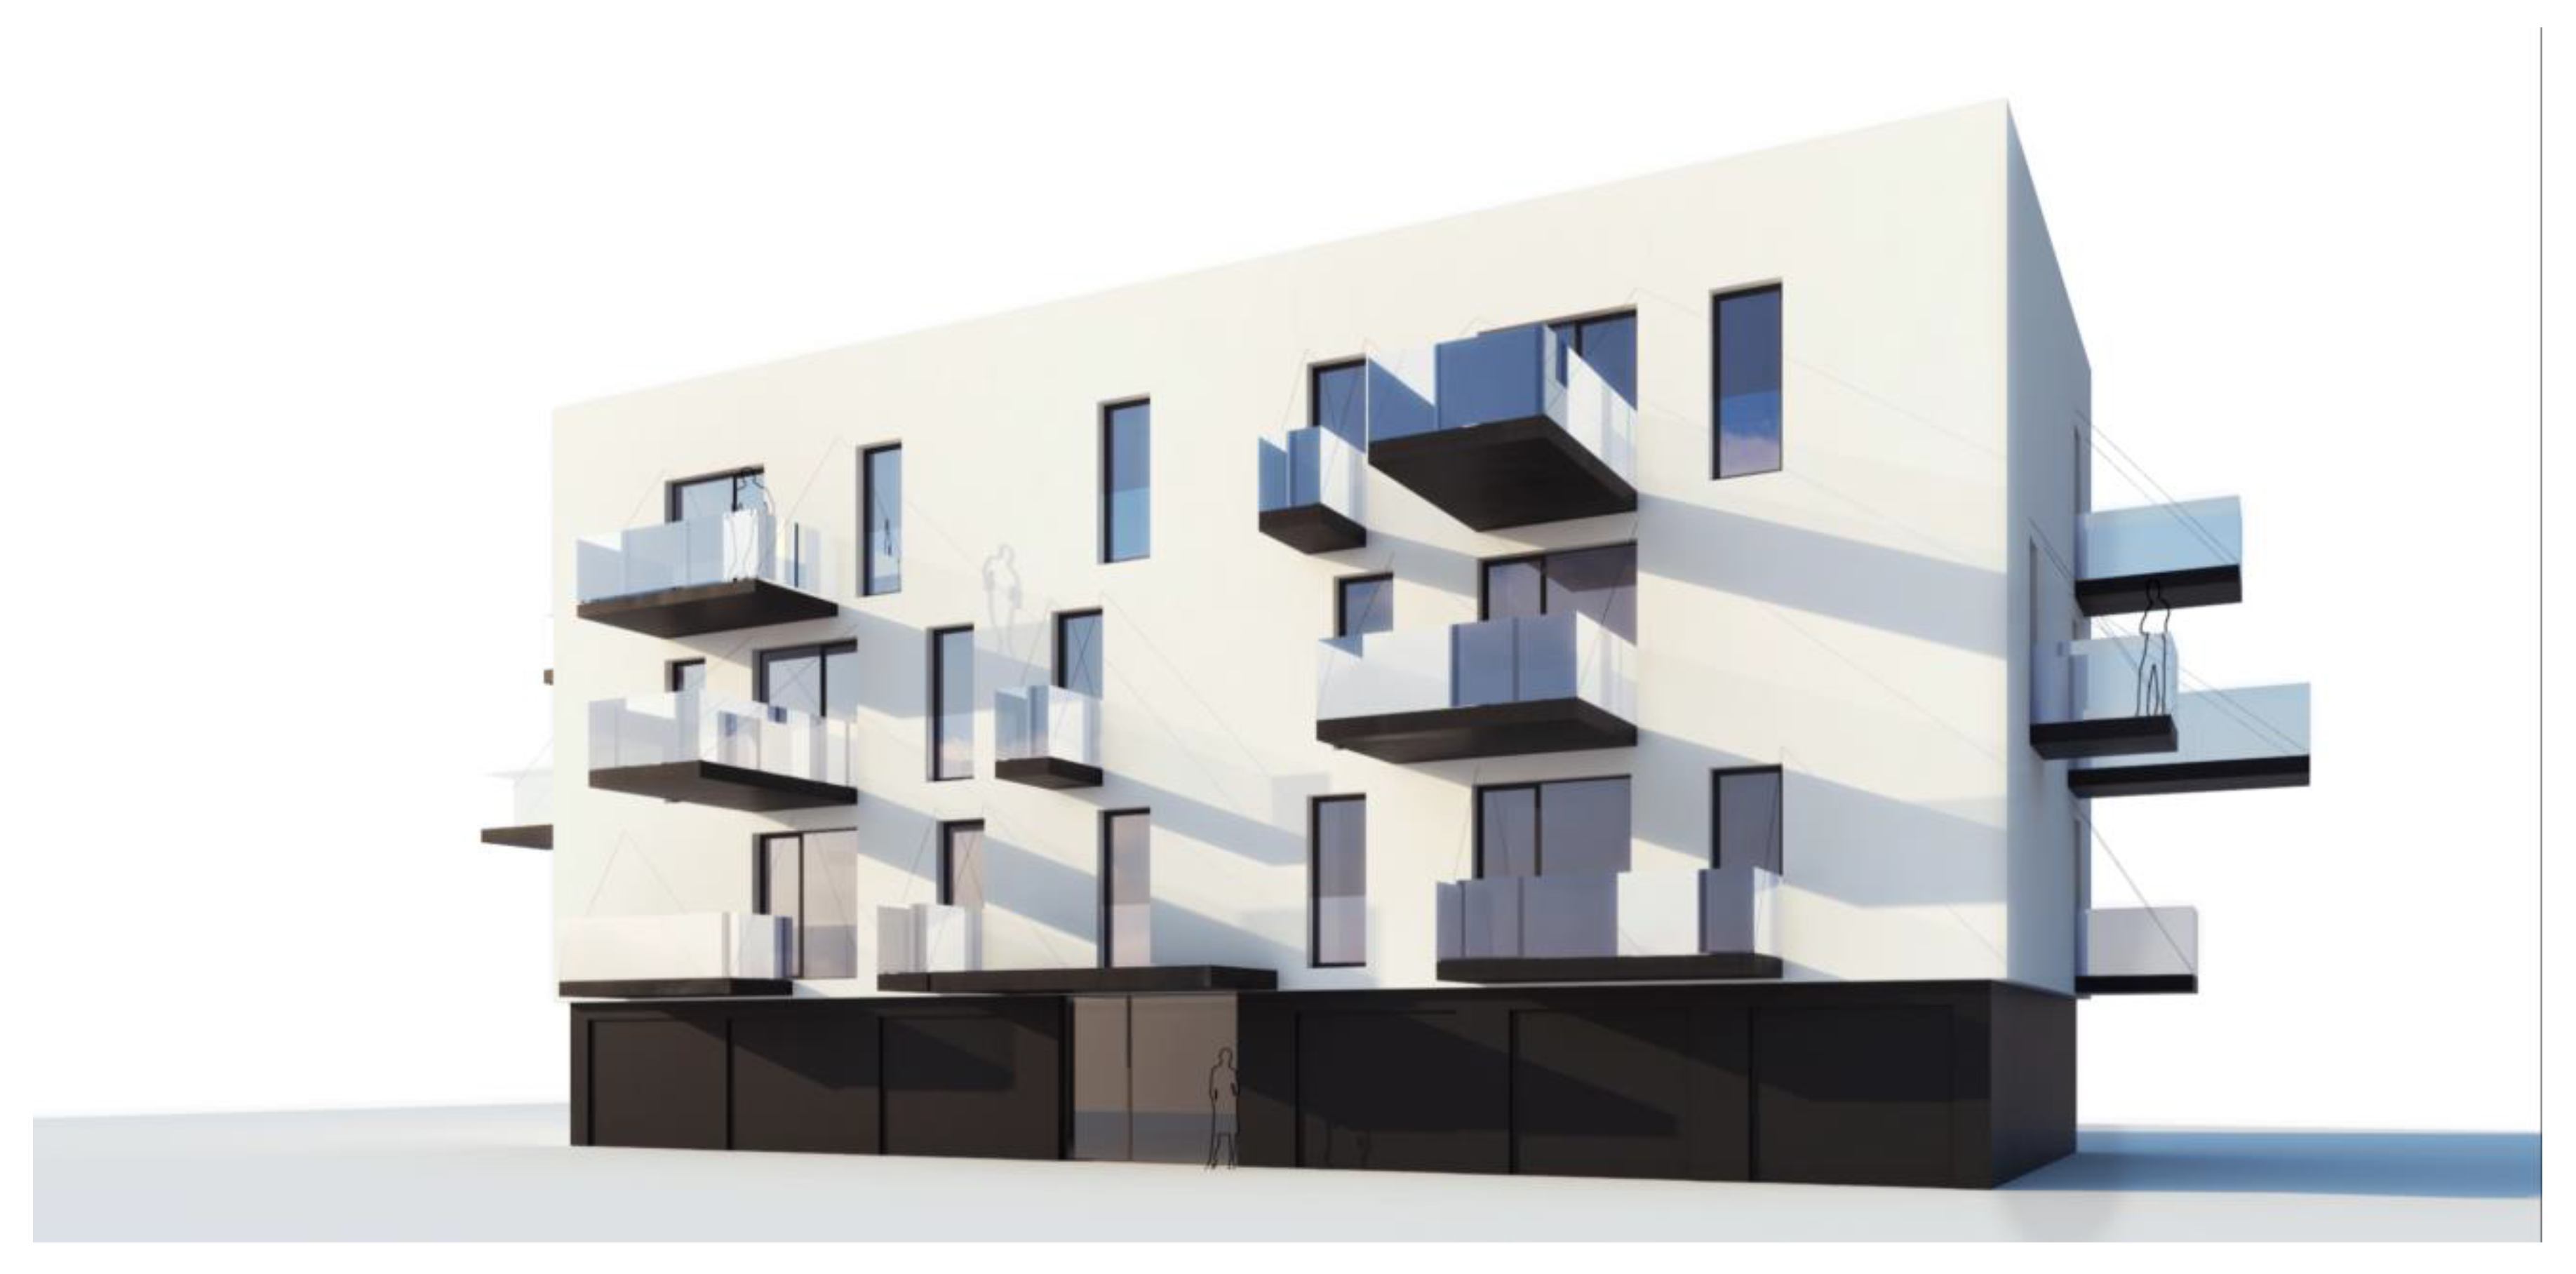
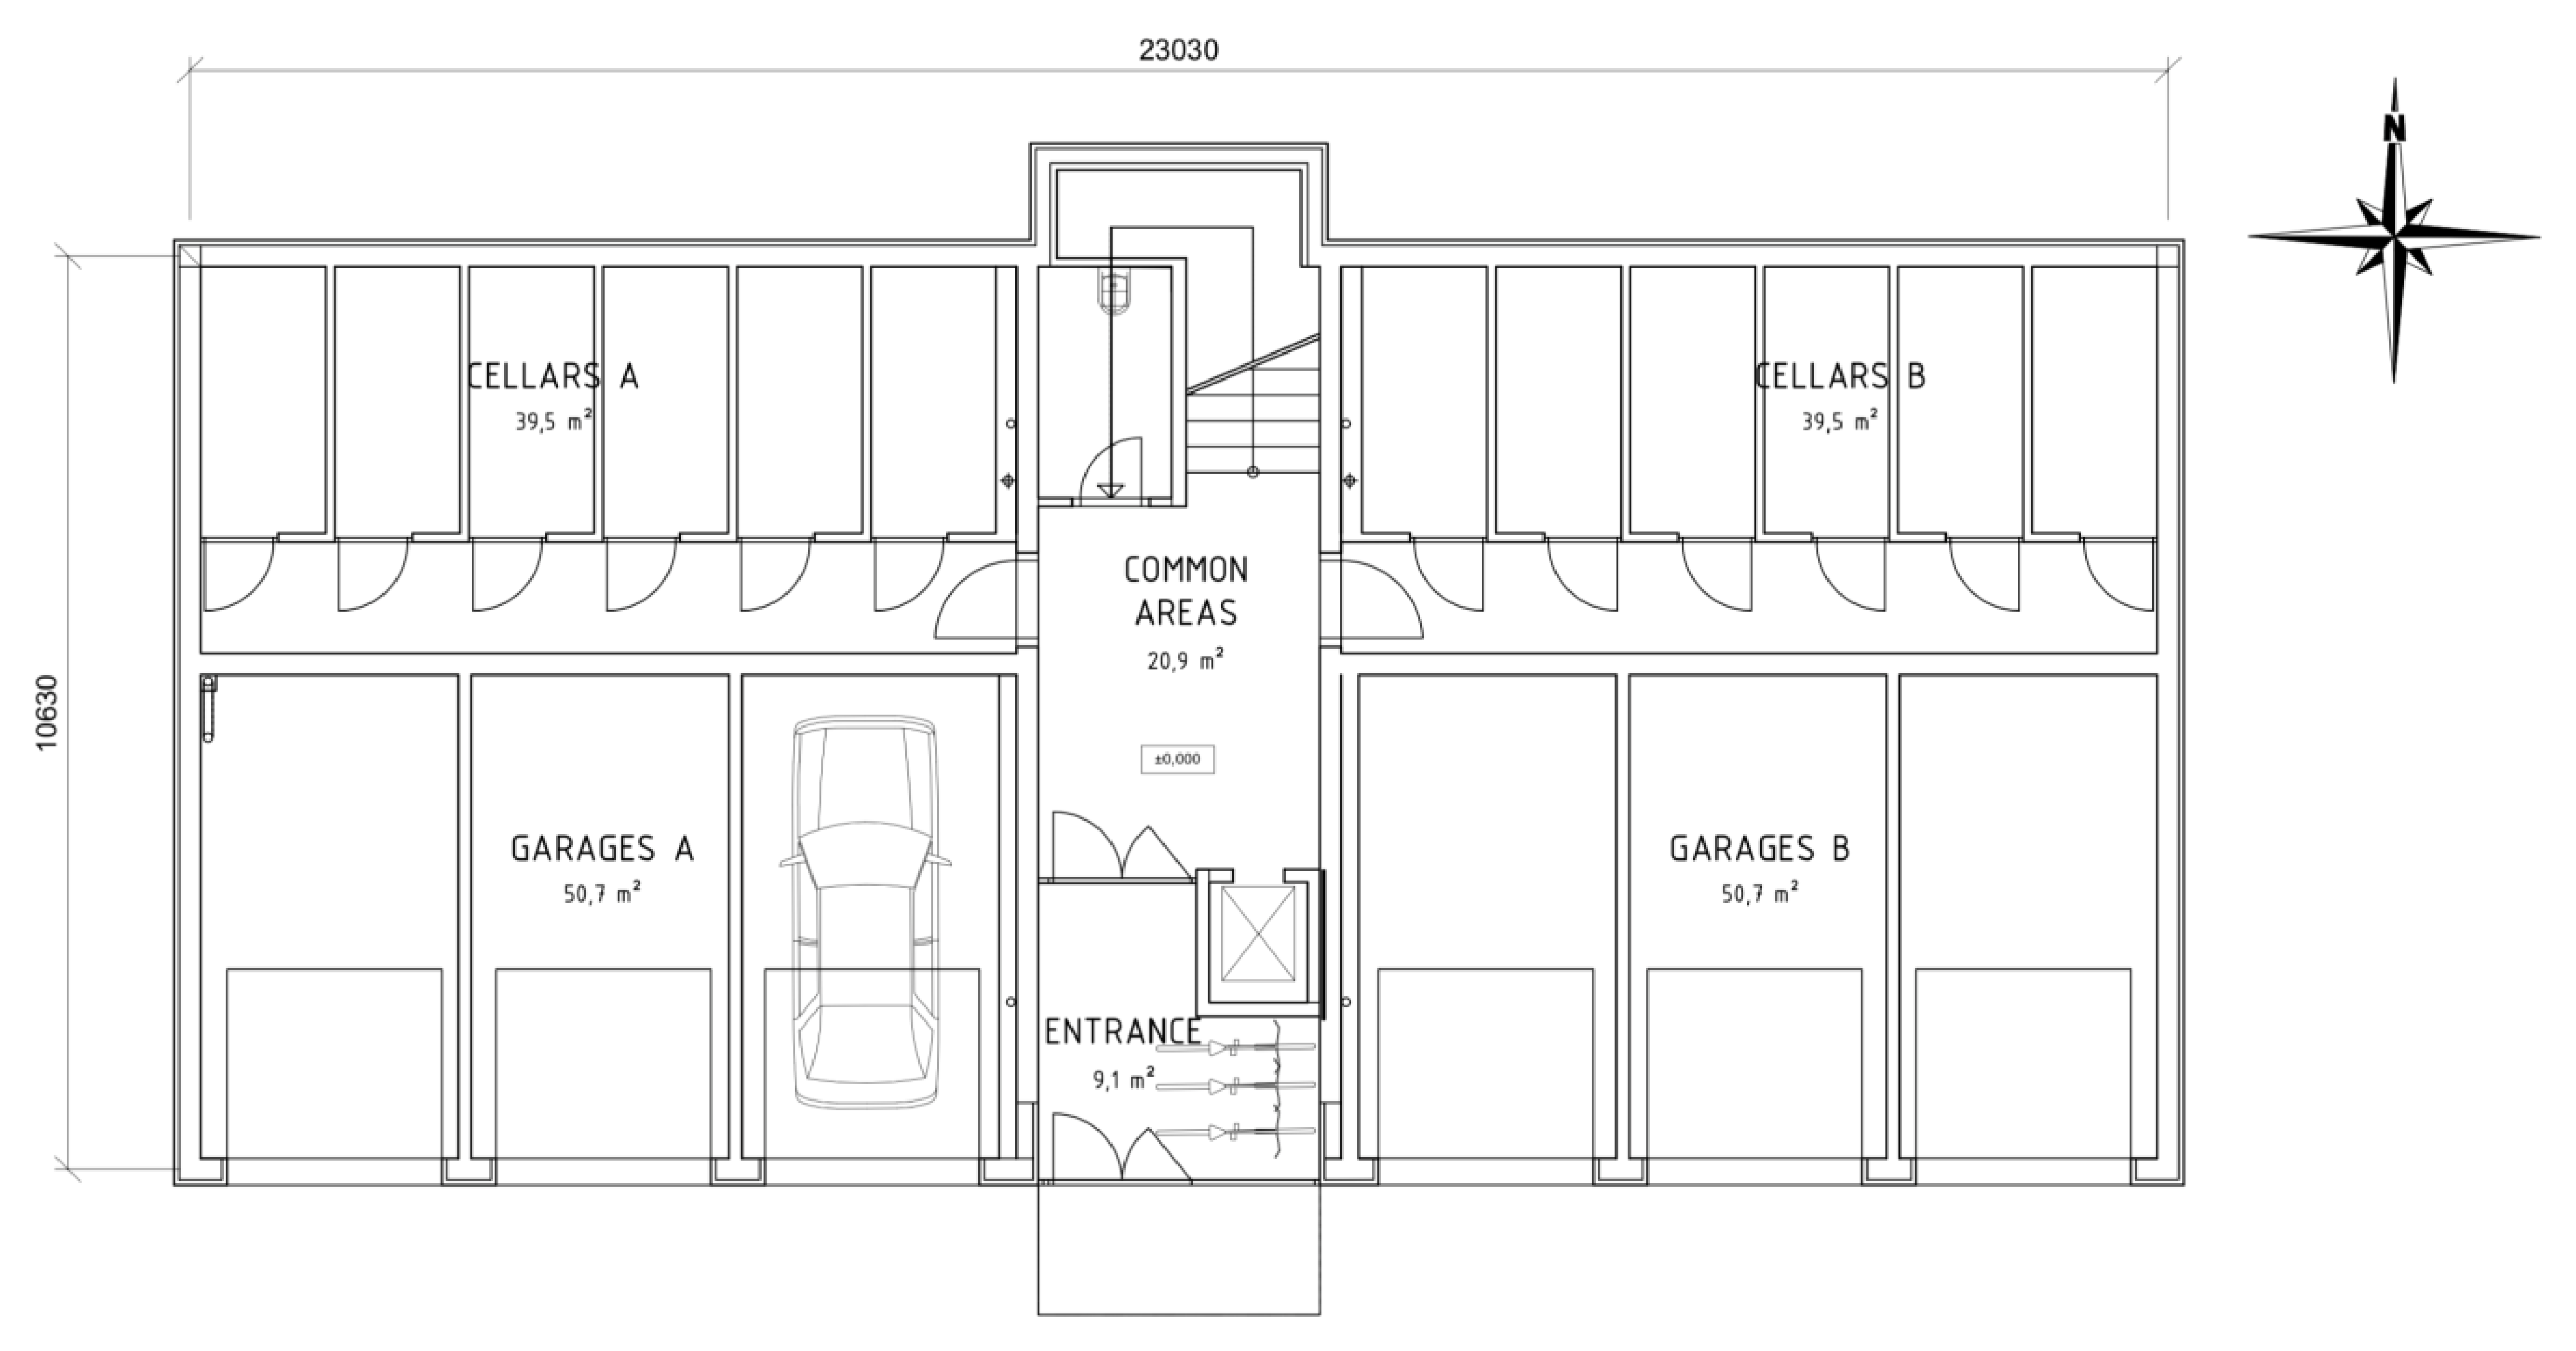
The building taken for the purpose of this case study was a four-storey residential building with a single rectangular shape and flat roof (see Figure 1, Figure 2 and Figure 3). The total net floor area of the building was 1045 m2, and it had 11 flats for 26 occupants in the above-ground floors; the total volume of the building calculated from the external dimensions was 3572 m3. The ground floor housed a technical room, parking lots, and storage rooms for flats.

Figure 1.
The case study building. Design and visualization by Jan Růžička.
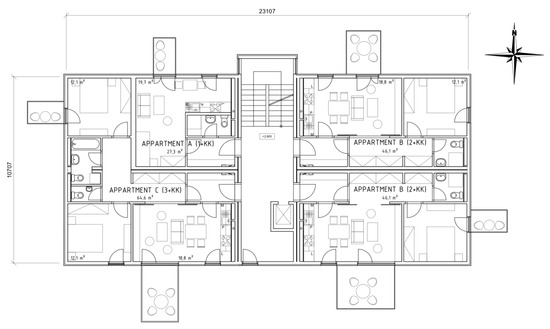
Figure 2.
Layout of a typical floor (dimensions in mm).
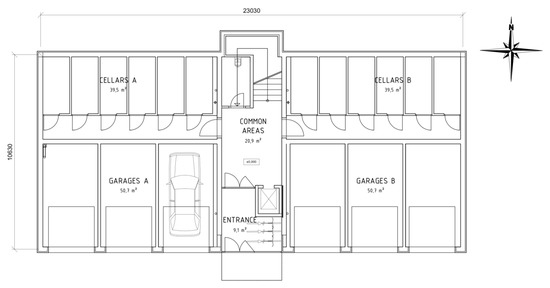
Figure 3.
Layout of the ground floor (dimensions in mm).
The original design, which represented the common standard for new apartment buildings in the Czech market, had a structural masonry wall made of ceramic hollow brick blocks and floor structures made of 230 mm thick ceramic panels. The structure of the double roof with a ventilated cavity was made from massive timber elements. The indoor partition walls were made of hollow bricks and plaster. The structures of staircases were made from reinforced concrete, and the structures of balconies were made of steel. The external walls were insulated by 160 mm thick external thermal insulation composite system made of expanded polystyrene with thin external plaster, and the roof was insulated by 260 mm of glass wool within the timber structure. The mean U-value was 0.47 W/m2K.
The heating system consisted of a condensing gas boiler, which heated a central storage tank with a capacity of 750 L, and was coupled with a two-pipe counterflow heat distribution system with panel radiators. The overall ventilation concept was based on natural ventilation, and vacuum ventilation was installed only in rooms with the largest production of pollutants, such as the toilet, bathroom, and kitchen. The air supply was provided by ventilation slots in the windows and peripheral walls. Cooling was not needed.
2.3. Calculation Method for GHG Emissions and Boundary Conditions
For the purpose of this study, we applied a method described in the assessment guidelines of the national sustainability certification scheme SBToolCZ for residential buildings [32,33]. The indicator E.02 global warming potential defines a calculation procedure of the total annual CO2e emissions that comes from a simplified life cycle assessment (LCA) that includes annual operational emissions as well as annualized embodied emissions from life cycle stages A1–A3 and B4. The specific embodied GHG emissions were taken from the ecoinvent database.
The operational emissions of GHG were calculated on the basis of energy modeling and simulations, and the emission factors were determined from the calculated energy consumption and energy carriers. The energy modeling was made using the Czech software Energie 2017 by SVOBODA SOFTWARE according to the national methodology of the Ministry of Industry and Trade Decree No. 78/2013 Coll., which provides a monthly calculation method for energy demand in line with the national standard ČSN 730540-2 and international standards EN ISO 13790, EN ISO 13789, and EN ISO 13370. It includes energy consumption for heating, ventilation, air conditioning, preparation of domestic hot water (DHW), lighting, and auxiliary energy. Consumption of home appliances was not included in the calculation. The production of the energy from the solar collectors was calculated by method B from EN 15316-4-3.
Czechia has an eastern continental climate with cold winters and hot, dry summers. The energy demand for heating was calculated using the monthly average temperatures. The values of total solar irradiation were used for the calculation of the solar gains. Both temperatures and irradiations were taken from the national standard ČSN 73 0331-1 and represented country average data (see Table 1).

Table 1.
External temperatures and total solar irradiations used for the calculation of energy demand for heating in each month (months 1–12 are January–December, respectively).
The indoor temperature for the living areas was considered as 21 °C. The staircase with adjacent corridors was not considered as heated, but as it gained heat from the apartments, the considered temperature was 16 °C. The ground level with garages was not heated at all and had insulated ceiling; the temperature for this zone was considered 5 °C.
For ventilation, rates of 0.3 h−1 (455 m3/h of fresh air for the whole building) were used. For mechanical ventilation, the calculated efficiency of the heat recovery was 77%. The indoor heat gains from occupants were considered as 2.0 W/m2 (70% of time) and from appliances as 3.0 W/m2 (20% of time). Specific energy consumption for lighting in the base variant was 4.4 kWh/m2, and the figure was 1.9 kWh/m2 in the improved variants considering light-emitting diode (LED) lighting.
The calculation of the energy for DHW preparation was considered as 35.0 L per person and day, which totaled 332.2 m3 of the DHW per year (heated from 10 to 55 °C). Auxiliary energy included the energy of pumps and monitoring and control systems of the heating system. The gas condensing boiler and the pellet boiler had a calculated efficiency of 95% and 86%, respectively.
The emission factors for the energy carriers were taken from the SBToolCZ assessment guidelines [32]: electricity 207.4 g CO2e/MJ, natural gas 87.1 g CO2e/MJ, and wood pellets 9.2 g CO2e/MJ (in Czechia, biomass from wood waste is regarded as renewable source of energy, fulfilling the carbon neutrality criteria by the Intergovernmental Panel on Climate Change (IPCC)).
The basis of the evaluation of embodied GHG emission was a compilation of the bill of quantities of major building elements. Values of GHG emissions for the materials and building products used were obtained from the catalogue of physical and environmental profiles of construction elements for new buildings and reconstructions (envimat.cz) [34]. In line with the assessment guidelines, the following elements were included in the calculations:
- foundation,
- waterproofing layers,
- compacted fill, backfill material (imported from the place outside the building),
- vertical and horizontal construction elements, including overhanging structures,
- roof construction,
- roof deck,
- staircase,
- railing,
- internal partitions,
- nonbearing cladding,
- finishes,
- final floor covering,
- windows and doors,
- thermal and acoustic insulation.
On the other hand, small finishing elements (laths, metal elements, handles, and others) and building service systems were not included.
The reference study period for the simplified LCA was 50 years, and the modeled service lives of the building elements followed the recommendations listed in the assessment guidelines for each category of materials or products. At the end of the calculation, all embodied emissions were summed up and divided by 50 years to get the annualized embodied value.
3. Results
3.1. GHG Emissions of the Case Study Building Designed in the Usual Fashion
The calculated total annual energy consumption of the case study building designed in the usual fashion was 101.7 MWh. More than two-thirds of the energy was used for heating (69.9 MWh/a), slightly more than one-quarter was used for preparation of DHW (28.4 MWh/a), 2.8 MWh/a was used for lighting, and 0.6 MWh/a was used for auxiliary energy consumption. Most of the modeled energy consumption was delivered by natural gas (98.3 MWh/a), and only 3.4 MWh/a was supplied in electricity.
3.2. Measures Proposed to Reduce GHG Emissions of the Initial Design
The following measures were proposed to reduce embodied and operational GHG emissions:
- M1: Change in temperature zoning—nonresidential premises converted to unheated or only semiheated.
- M2a: Reduction of heat losses—thermal insulation of external structure based on the U-values required for passive houses by ČSN 730540 (external walls 0.18 W/m2K, roof 0.15 W/m2K, windows 0.71 W/m2K, doors 1.50 W/m2K), optimization of thermal couplings (0.02 W/m2K).
- M2b: Reduction of heat losses—thermal insulation of external structure based on the U-values recommended for passive houses by ČSN 730540 (external walls 0.12 W/m2K, roof 0.10 W/m2K, windows 0.55 W/m2K, doors 1.50 W/m2K), maximum optimization of thermal couplings (0.02 W/m2K).
- M3a: Reduction of embodied emissions—choice of environmentally friendly products and materials (sand–lime bricks for wall structures and reinforced concrete prestressed hollow panels for ceiling structures).
- M3b: Reduction of embodied emissions—choice of environmentally friendly products and materials (timber structure: two-by-four system).
- M4: Low-emission heat—choice of low-emission source/energy carrier (wood biomass boiler).
- M5: Lighting—installation of energy-saving fluorescent and LED luminaires.
- M6: Mechanical ventilation with heat recovery (efficiency 77%)—reduction of heat losses by ventilation, utilization of waste heat.
- M7: Vacuum solar collectors—use of solar energy for preheating of DHW (80 m2).
- M8a: Photovoltaic panels—use of solar energy to cover electricity demand (30 m2), 5.4 kWp, system efficiency 15%, south-facing 35°.
- M8b: Photovoltaic panels—use of solar energy to cover electricity demand (50 m2), 9.0 KWp, system efficiency 15%, south-facing 35°.
3.3. Variant Sets of the Improvement Measures
The following six variant sets of the improvement measures were designed (a summary of the sets is provided in Table 2):
Table 2.
Overview of the six sets of greenhouse gas (GHG) emission-saving measures.
- S1 (M1, M4, M5): S1 was a combination of basic measures with minimum changes in the functioning of the building or changes in the design (biomass boiler, efficient LED lighting, and decrease of the internal temperature in the main corridors). The measures were aimed at reducing the amount of operational GHG emissions.
- S2 (M1, M3a, M4, M5, M7): S2 complemented the previous option S1, with an emphasis on reducing the share of embodied GHG emissions using a construction system in the form of sand–lime bricks for wall structures and reinforced concrete prestressed cavity panels for ceiling structures. The variant was also supplemented by a system of vacuum solar collectors used for the preparation of DHW (80 m2, south facing 35°, combined with accumulation tank 4500 L).
- S3 (M1, M2a, M3b, M4, M5, M6, M7): S3 combined the proposed measures with an emphasis on the low-energy performance of the building. All constructions met the required heat transfer coefficient values for passive buildings; thermal couplings and bridges were optimized to minimum values. The technical systems were supplemented by a forced equilibrium ventilation system with heat recovery. The construction system was newly designed as a timber building in a two-by-four system in the form of a prefabricated wooden frame filled with thermal insulation. The ceiling construction was a wooden beamed ceiling.
- S4 (M1, M2a, M3b, M4, M5, M6, M7, M8a): S4 was based on a combination of the measures mentioned in S3. In addition, a system of photovoltaic panels was used for reducing electricity consumption that would be increased by forced ventilation systems and solar collector pumps.
- S5 (M1, M2a, M3b, M4, M6, M7, M8a): S5 was based on a combination of the measures mentioned in S4, with the difference that the heat source was the original gas condensing boiler.
- S6 (M1, M2b, M3b, M5, M6, M7, M8b): S6 was built on S5 to meet the emission requirement while maintaining the original heat source in the form of a gas condensing boiler (S5 did not meet the emission requirement). The combination of measures was based on S5 with a few fundamental differences. The envelope structures were designed for the lowest values of the recommended values Upas,20 for passive buildings according to ČSN 73 0540-2. The thermal couplings were reduced as much as possible. The photovoltaic (PV) modules were used to cover the consumption of electrical energy for the operation of forced ventilation, auxiliary energy, lighting, and parts of the hot water production. The surpluses were fed to the energy grid (although we did not consider these surpluses in the operating emission balance). Compared to the previous variants, the total area of the panels increased to 50 m2.
3.4. GHG Emissions of the Proposed Variants
A breakdown of the embodied emissions and the modeled energy consumption and GHG emissions of the proposed sets are summarized in Table 3.
Table 3.
Modeled embodied GHG emissions, energy consumptions, and GHG emissions of the original building (business as usual) and proposed sets of improvements S1–S6.
Set S1 included replacement of the condensation gas boiler with a biomass boiler, installation of efficient LED lighting, and reduction in the internal temperature in the main corridors. These measures contributed to a significant drop in the operational GHG emissions due to savings in electricity consumption and the low-emission factor of the biomass, i.e., 9.2 g CO2e/MJ (compared to the electricity emission factor 207.4 g CO2e/MJ). On the other hand, it increased the total consumption of energy due to the reduced energy efficiency of the boiler (pellet boiler 86%, original gas boiler 95%), the efficiency of heat distribution (pellet boiler 85%, original gas boiler 98%), and reduced internal heat gains from lighting.
Set S2 built upon S1 and reduced embodied GHG emissions by replacing the structural wall material made of standard brick blocks to sand–lime bricks and prestressed hollow concrete panels. The achieved reduction was 72.3 t CO2e. This set also benefited from the addition of the vacuum solar collectors, which delivered 12.3 MWh of clean energy.
Set S3 combined the measures applied in S2 with significant improvement in the U-values of the building envelope, the addition of mechanical ventilation with heat recovery, and use of timber structure for construction. The improved U-values led to a significant reduction of heat consumption, while the introduction of mechanical ventilation caused a significant increase in the consumption of electricity, which resulted in high operational GHG emissions due to the high emission factor. The transformation of the design to a timber structure reduced the total embodied GHG emissions by another 71.7 t CO2e.
Set S4 was similar to S3 but also took advantage of the PV system (5.3 kWp), which delivered an additional 3.2 MWh of clean electricity. Thus, it enabled the reduction of operational GHG emissions by 2.05 t CO2e.
Set S5 was a reaction to a situation where a biomass boiler could not be used due to local particular matter emission regulation. It had all the features of S4 but used gas condensing boiler instead of pellet boiler. In this variant, the building was compliant with the 2 °C emission target but not with the 1.5 °C target.
Set S6 included measures that were needed to achieve the 1.5 °C emission target, i.e., further improvement of the U-values of the building envelope and further extension of the PV system, which achieved the limits of the roof surface area. As a result, the operational emissions decreased to 10.45 t CO2e, which enabled achievement of the target.
4. Discussion
4.1. GHG Benchmarks for Buildings
In an ideal world, GHG benchmarks would not be needed because all environmental externalities of human activities would be included in the price of every product so that consumers and investors get price signals that signify behavior that is favorable for society. Another solution would be a global carbon tax or global emission trading scheme that would include human activities and thus modify the economic system in such a way that only sustainable behavior is profitable. However, at present, this is not happening in the world. Therefore, we need some kind of regulation for the building sector, and such regulation could be based on GHG benchmarks.
The presented GHG benchmark for residential buildings suffered from various simplifications, imperfections, and uncertainties. The main simplification lies in the fact that we used an equal allocation of the remaining carbon budget (and thus allowance for annual GHG emissions). As mentioned in the introduction, the debate around which kind of allocation should be used is still ongoing, and the preferred allocation principle might be revised in the future in either direction. The carbon budget allocated to people living in Czechia might be greater because our current per capita is high, and reducing it massively in just a few years would cause a shock. However, it might also be lower because Czechia (and former Bohemia within the Austrian Empire and Czechoslovakia) has been a highly industrialized country since the beginning of the 20th century, so the country has historically contributed to climate change relatively more than developing countries, which should have the right to develop. The result of this debate remains to be seen, and therefore we opted for equal per capita allocation.
Another source of uncertainty is in the remaining carbon budget itself as it changes over time, and the pace of its depletion is variable. Knowledge of climate change also evolves over time, and continuous adjustments would be needed.
There is also uncertainty related to the share of the Czech residential building stock in the total national emissions as the underlying study was based on an estimation based on a model of the Czech building stock that suffers from uncertainties. Furthermore, total national emissions are statistical figures that suffer from some level of uncertainty.
However, even given these uncertainties, we still believe that the exercise was worthwhile because it highlighted the huge gap between the common building design of the construction practice and the practice that needs to be adopted to achieve climate goals.
4.2. Uncertainties in the Case Study
The case study suffered from standard uncertainties of a simplified LCA: uncertainties in the underlying data on materials, emission factors, modeled scenarios, approach to annualization of embodied emissions based on the reference study period as well as uncertainties related to energy modeling using the monthly method.
The calculation of the energy balance of the photovoltaic system and its usability was simplified. For more accurate calculations, it would be necessary to use specialized software with regard to the surplus electricity generated from the PV, which was fed back to the energy grid. When a more detailed simulation is made, the question arises as to whether or not emission balance is to be considered and which emission factor is to be applied (real energy mix and, thus, the emission factor varies in time).
The energy rating of the building did not include the consumption of electricity for standard and nonstandard appliances. Due to the high emission factor of electricity in Czechia, this consumption can have a significant impact on the value of the total operational emissions.
4.3. Applicability of the GHG Emission Reduction Strategies from the Case Study
The applied GHG emission reduction strategies followed two principles: providing energy from sources with a low emission factor and reducing energy consumption. Therefore, we first tried to make minimum changes to the original design, simply swapping the gas boiler for the pellet boiler. In terms of GHG emissions, this would help a lot (given that there is a sustainable source of wood). However, the pellet boiler has reduced efficiency, which would lead to increased energy consumption. At the same time, in many Czech municipalities, there is problem with air pollution. Therefore, installing pellet boilers, a particular source of pollution, would not even be allowed. Therefore, we set up the other sets of measures, which would be widely applicable but would represent more significant changes to the design of a building. Even these variants might suffer from another kind of limitation. In some locations, large PV systems with limited grid capacity would not be allowed to be connected to the grid, and some kind of on-site electricity accumulation would therefore be needed.
Furthermore, in the study, when proposing the variant sets of measures, some of the properties of the original building were not fully considered—for instance, fire resistance or acoustic parameters of the proposed solutions were not calculated or compared to the building in its original state.
5. Conclusions
This paper presented a possible approach to the application of top-down GHG emission benchmarks on residential buildings in Czechia set on the basis of the Emissions Gap Report, equal allocation of limits to GHG emissions for 2030 among the forecasted population, and the share of residential buildings on national emissions.
An actual design of a multifamily residential building was used to compare GHG emissions from a common building design to the benchmark using a simplified LCA method in line with the national SBToolCZ method. The results showed that the assessed residential house designed in a standard fashion exceeded the emission limit by a factor of 2.5. Based on the assessment, six sets of saving measures were proposed to reduce the operational and embodied GHG emissions. The saving measures included change in temperature zoning, improvement of U-values of the building envelope, exchange of construction materials for reduced embodied GHG emissions, exchange of heat source for biomass boiler, introduction of LED lighting, use of mechanical ventilation with heat recovery, addition of vacuum solar collectors, and the addition of PV panels. Finally, the variants were compared and their suitability in the Czech conditions was examined.
The presented principles are applicable to situations in other countries as well, even though there are still many sources of uncertainties.
Author Contributions
Conceptualization, A.L.; methodology, A.L. and D.P.; investigation, D.P.; writing—original draft preparation, A.L. and D.P.; writing—A.L. and D.P.; supervision, A.L.
Funding
This work was supported by the Ministry of Education, Youth and Sports within the National Sustainability Programme I, project No. LO1605 and within project INTER-EXCELLENCE No. LTT19022.
Acknowledgments
The authors would like to express gratitude for numerous technical discussions within IEA EBC Annex 72: Assessing Life Cycle Related Environmental Impacts Caused by Buildings, which inspired the work presented in this paper. The broad expertise of colleagues and friends from the group and their support and willingness to share their knowledge is invaluable. Annex 72—we do it for you!
Conflicts of Interest
The authors declare no conflict of interest.
References
- Masson-Delmotte, V.; Zhai, P.; Pörtner, H.-O.; Roberts, D.; Skea, J.; Shukla, P.R.; Pirani, A.; Moufouma-Okia, W.; Péan, C.; Pidcock, R.; et al. Global Warming of 1.5 °C An IPCC Special Report on the Impacts of Global Warming of 1.5 °C Above Pre-industrial Levels and Related Global Greenhouse Gas Emission Pathways, in the Context of Strengthening the Global Response to the Threat of Climate Change, Sustainable Development and Efforts to Eradicate Poverty Summary for Policymakers; Science Officer Science Assistant Graphics Officer Working Group I Technical Support Unit, Ed.; Intergovernmental Panel on Climate Change: Geneva, Switzerland, 2018; ISBN 978-92-9169-151-7. [Google Scholar]
- Rogelj, J.; Popp, A.; Calvin, K.V.; Luderer, G.; Emmerling, J.; Gernaat, D.; Fujimori, S.; Strefler, J.; Hasegawa, T.; Marangoni, G.; et al. Scenarios towards limiting global mean temperature increase below 1.5 °C. Nat. Clim. Chang. 2018, 8, 325–332. [Google Scholar] [CrossRef]
- OECD/IEA. Perspectives for the Energy Transition: The Role of Energy Efficiency; International Energy Agency: Paris, France, 2018. Available online: https://www.iea.org/publications/freepublications/publication/Perspectives%20for%20the%20Energy%20Transition%20-%20The%20Role%20of%20Energy%20Efficiency.pdf (accessed on 1 October 2019).
- European Commission Buildings. Available online: https://ec.europa.eu/energy/en/topics/energy-efficiency/buildings (accessed on 10 April 2018).
- United Nations. Buildings and Climate Change: Summary for Decision Makers; UNEP DTIE: Paris, France, 2009. [Google Scholar]
- United Nations. The Paris Agreement; United Nations/Framework Convention on Climate Change: Paris, France, 2015. [Google Scholar]
- Boardman, B. Examining the carbon agenda via the 40% House scenario. Build. Res. Inf. 2007, 35, 363–378. [Google Scholar] [CrossRef]
- Koo, C.; Hong, T.; Kim, J.; Kim, H. An integrated multi-objective optimization model for establishing the low-carbon scenario 2020 to achieve the national carbon emissions reduction target for residential buildings. Renew. Sustain. Energy Rev. 2015, 49. [Google Scholar] [CrossRef]
- Bürger, V.; Hesse, T.; Quack, D.; Palzer, A.; Köhler, B.; Herkel, S.; Engelmann, P. Klimaneutraler Gebäudebestand 2050; Umweltbundesamt: Dessau-Roßlau, Germany, 2016. [Google Scholar]
- Bürger, V.; Köhler, B.; Engelmann, P.; Palzer, A. German Energiewende–different visions for a (nearly) climate neutral building sector in 2050. Energy Effic. 2017, 12, 1271–1281. [Google Scholar] [CrossRef]
- Lupíšek, A. Carbon Dioxide Emissions from Operation of Czech Building Stock and Potential for Their Reduction. IOP Conf. Ser. Earth Environ. Sci. 2019, 290. [Google Scholar] [CrossRef]
- Zacà, I.; D’Agostino, D.; Congedo, P.M.; Baglivo, C. Assessment of cost-optimality and technical solutions in high performance multi-residential buildings in the Mediterranean area. Energy Build. 2015, 102, 250–265. [Google Scholar] [CrossRef]
- Haase, M.; Andresen, I.; Gustavsen, A.; Dokka, T.H.; Grete Hestnes, A. Zero Emission Building Concepts in Office Buildings in Norway. Int. J. Sustain. Build. Technol. Urban Dev. 2011, 2, 150–156. [Google Scholar] [CrossRef]
- Moschetti, R.; Brattebø, H.; Sparrevik, M. Exploring the pathway from zero-energy to zero-emission building solutions: A case study of a Norwegian office building. Energy Build. 2019, 188–189, 84–97. [Google Scholar] [CrossRef]
- Lützkendorf, T.; Hájek, P.; Lupíšek, A.; Immendörfer, A.; Nibel, S.; Häkkinen, T. New trends in sustainability assessment systems-based on top-down approach and stakeholders needs. Int. J. Sustain. Build. Technol. Urban Dev. 2012, 3. [Google Scholar] [CrossRef]
- Hollberg, A.; Lützkendorf, T.; Habert, G. Top-down or bottom-up?—How environmental benchmarks can support the design process. Build. Environ. 2019, 153, 148–157. [Google Scholar] [CrossRef]
- Zimmermann, M.; Althaus, H.-J.; Haas, A. Benchmarks for sustainable construction: A contribution to develop a standard. Energy Build. 2005, 37, 1147–1157. [Google Scholar] [CrossRef]
- Hoxha, E.; Jusselme, T.; Brambilla, A.; Cozza, S.; Andersen, M.; Rey, E. Impact Targets as Guidelines Towards Low Carbon Buildings: Preliminary Concept; PLEA: Los Angeles, CA, USA, 2016. [Google Scholar]
- IEA EBC Annex 72-Assessing Life Cycle Related Environmental Impacts Caused by Buildings. Available online: http://annex72.iea-ebc.org/ (accessed on 19 October 2019).
- ETH Zürich 71st LCA Forum—Environmental Benchmarks for Buildings: Needs, Challenges and Solutions. Available online: https://video.ethz.ch/events/lca/2019/spring/71st.html (accessed on 19 October 2019).
- Fehn, K.L. Supporting, Challenging, Advising: Building Policy in the Light of Climate Change. In Sustainable Built Environment D-A-CH Conference 2019 in Graz-Book of Abstracts; Passer, A., Lützkendorf, T., Habert, G., Kromp-Kolb, H., Monsberger, M., Eds.; Verlag der Technischen Universität Graz: Graz, Austria, 2019. [Google Scholar]
- Chandrakumar, C.; McLaren, S.J.; Dowdell, D.; Jaques, R. A top-down approach for setting climate targets for buildings: The case of a New Zealand detached house. IOP Conf. Ser. Earth Environ. Sci. 2019, 323, 012183. [Google Scholar] [CrossRef]
- Hollberg, A.; Lützkendorf, T.; Habert, G. Using a budget approach for decision-support in the design process. IOP Conf. Ser. Earth Environ. Sci. 2019, 323, 012026. [Google Scholar] [CrossRef]
- Pálenský, D. Klimaticky Neutrální Bytový Dům; Czech Technical University in Prague: Prague, Czech Republic, 2019. [Google Scholar]
- UN Environment. Emissions Gap Report 2018; United Nations Environment Programme: Nairobi, Kenya, 2018; ISBN 978-92-807-3726-4. [Google Scholar]
- Bastianoni, S.; Pulselli, F.M.; Tiezzi, E. The problem of assigning responsibility for greenhouse gas emissions. Ecol. Econ. 2004, 49, 253–257. [Google Scholar] [CrossRef]
- Höhne, N.; den Elzen, M.; Escalante, D. Regional GHG reduction targets based on effort sharing: A comparison of studies. Clim. Policy 2014, 14, 122–147. [Google Scholar] [CrossRef]
- Steininger, K.; Lininger, C.; Droege, S.; Roser, D.; Tomlinson, L.; Meyer, L. Justice and cost effectiveness of consumption-based versus production-based approaches in the case of unilateral climate policies. Glob. Environ. Chang. 2014, 24, 75–87. [Google Scholar] [CrossRef]
- Steininger, K.W.; Lininger, C.; Meyer, L.H.; Muñoz, P.; Schinko, T. Multiple carbon accounting to support just and effective climate policies. Nat. Clim. Chang. 2016, 6, 35–41. [Google Scholar] [CrossRef]
- Statista World Population-Forecast until 2100. Available online: https://www.statista.com/statistics/262618/forecast-about-the-development-of-the-world-population/ (accessed on 1 October 2019).
- Lupíšek, A. Potenciál Úspor Emisí Skleníkových Plynů ČR Pomocí Rekonstrukcí Budov; Cezch Technical University in Prague – University Centre for Energy Efficent Buildings: Buštěhrad, Czechia, 2016. [Google Scholar]
- Vonka, M.; Bureš, M.; Hájek, P.; Havlík, F.; Hodková, J.; Křelinová, V.; Lupíšek, A.; Mančík, Š.; Pavlů, T.; Pečman, J.; et al. SBToolCZ Pro Bytové Domy, 1st ed.; Czech Technical University in Prague—Faculty of Civil Engineering: Prague, Czech Republic, 2013; ISBN 978-80-01-05125-2. [Google Scholar]
- Vonka, M.; Hajek, P.; Lupisek, A. SBToolCZ: Sustainability rating system in the Czech Republic. Int. J. Sustain. Build. Technol. Urban Dev. 2013, 4, 46–52. [Google Scholar] [CrossRef]
- Hodková, J.; Lupíšek, A.; Mančík, Š.; Vochoc, L.; Žd’ára, T. Envimat.cz-Online Database of Environmental Profiles of Building Materials and Structures. In Environmental Software Systems: Frameworks of Environment; Springer: Berlin, Heidelberg, 2011; pp. 272–279. [Google Scholar]

© 2019 by the authors. Licensee MDPI, Basel, Switzerland. This article is an open access article distributed under the terms and conditions of the Creative Commons Attribution (CC BY) license (http://creativecommons.org/licenses/by/4.0/).