Article

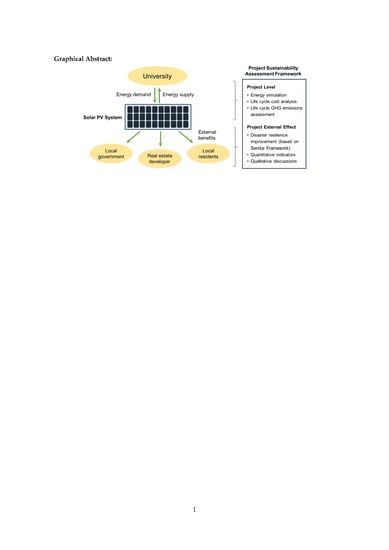
Incorporating External Effects into Project Sustainability Assessments: The Case of a Green Campus Initiative Based on a Solar PV System

1
Graduate Program in Sustainability Science—Global Leadership Initiative (GPSS-GLI), Division of Environmental Studies, Graduate School of Frontier Sciences, The University of Tokyo, 332 Building of Environmental Studies, 5-1-5 Kashiwanoha, Kashiwa City, Chiba 277-8563, Japan
2
Waseda Research Institute for Science and Engineering, Waseda University, 3-4-1 Okubo, Shinjuku-ku, Tokyo 169-8555, Japan
*
Author to whom correspondence should be addressed.
Sustainability 2019, 11(20), 5786; https://doi.org/10.3390/su11205786
Submission received: 30 August 2019 / Revised: 8 October 2019 / Accepted: 14 October 2019 / Published: 18 October 2019

Abstract

:
We demonstrated that a green campus initiative can reduce the carbon footprint of a university and improve the disaster resilience of the local community. A project sustainability assessment framework was structured to support the initiative. First, an on-campus solar photovoltaic (PV) system was designed. The project performance in terms of financial cost and greenhouse gas (GHG) emissions was assessed using life cycle cost analysis (LCC) and a life cycle assessment (LCA), respectively. Then, we explored the incorporation of positive social impacts on the local community in the context of natural disaster-prone Japan. Indicators for improving the disaster resilience of the residents were defined based on the Sendai Framework. Our results showed that the proposed solar PV system could provide an electricity self-sufficiency rate of 31% for the campus. Greenhouse gas emissions of 0.0811 kg CO2-eq/kWh would decrease the annual emissions from campus electricity use by 27%. Considering the substituted daytime electricity purchase, a payback period of 12.9 years was achievable. This solar PV system could serve as an emergency power source to 4666–8454 nearby residents and 8532 smart city residents. This external effect would encourage stakeholders like local government and developers to participate in the project.

Graphical Abstract

1. Introduction

Universities often play leading roles in society. Recent growing concerns about climate change has been putting pressure on campuses to improve their environmental sustainability, also known as the green campus movement [1,2]. A priority of the movement is to reduce the carbon footprint of campuses. Although energy savings measures can be implemented, the electricity demand of research facilities tends to be large and unavoidable. Substituting fossil fuel-based electricity with localized renewable energy such as solar photovoltaic (PV) power represents a potential solution for reducing the carbon footprint without compromising the functionality of campuses.
Transitioning to an on-campus renewable energy system requires enough funding as well as policy support backed by a scientifically sound assessment. Life cycle sustainability assessment tools [3] can inform decision making in an interdisciplinary setting. For instance, the project carbon footprint and financial cost can be evaluated using established methodologies such as the life cycle assessment (LCA) [4] and life cycle cost analysis (LCC) [5], respectively. The social impact, however, is often difficult to assess, and the relevant stakeholders are difficult to identify. This is because social impact is usually treated as an external effect to the project as the prospective impact on the community is beyond the original intention. In this study, we attempted to incorporate such external effects into our assessment framework, reflecting the broader implication of renewable energy in the Japanese context.
Japan is a country prone to natural disasters such as earthquakes, tsunamis, and typhoons. These disasters cause stoppage of the power supply and disruptions to society. For instance, during the widely known 311 Tohoku Earthquake, millions of citizens across the Kanto area of Japan experienced blackouts for as long as seven days due to the shutdown of the grid-connected Fukushima Nuclear Power Plant [6]. It is therefore important for Japan to be prepared and to mitigate the disruption to society in times of disaster [7]. For a local community, building an alternative renewable energy system is a promising countermeasure to improve energy security and disaster resilience.
Following the above context, this study investigated a green campus initiative that showcased a megawatt-scale on-campus solar PV system. The main objective was to demonstrate a project sustainability assessment framework that assesses not only the carbon footprint and life cycle cost of the project, but also the external effect on the local community from a disaster resilience perspective. We highlight that the latter part of the assessment is especially meaningful in practical decision making as it widens the scope of stakeholders, subsequently drawing more support for the implementation of the project.

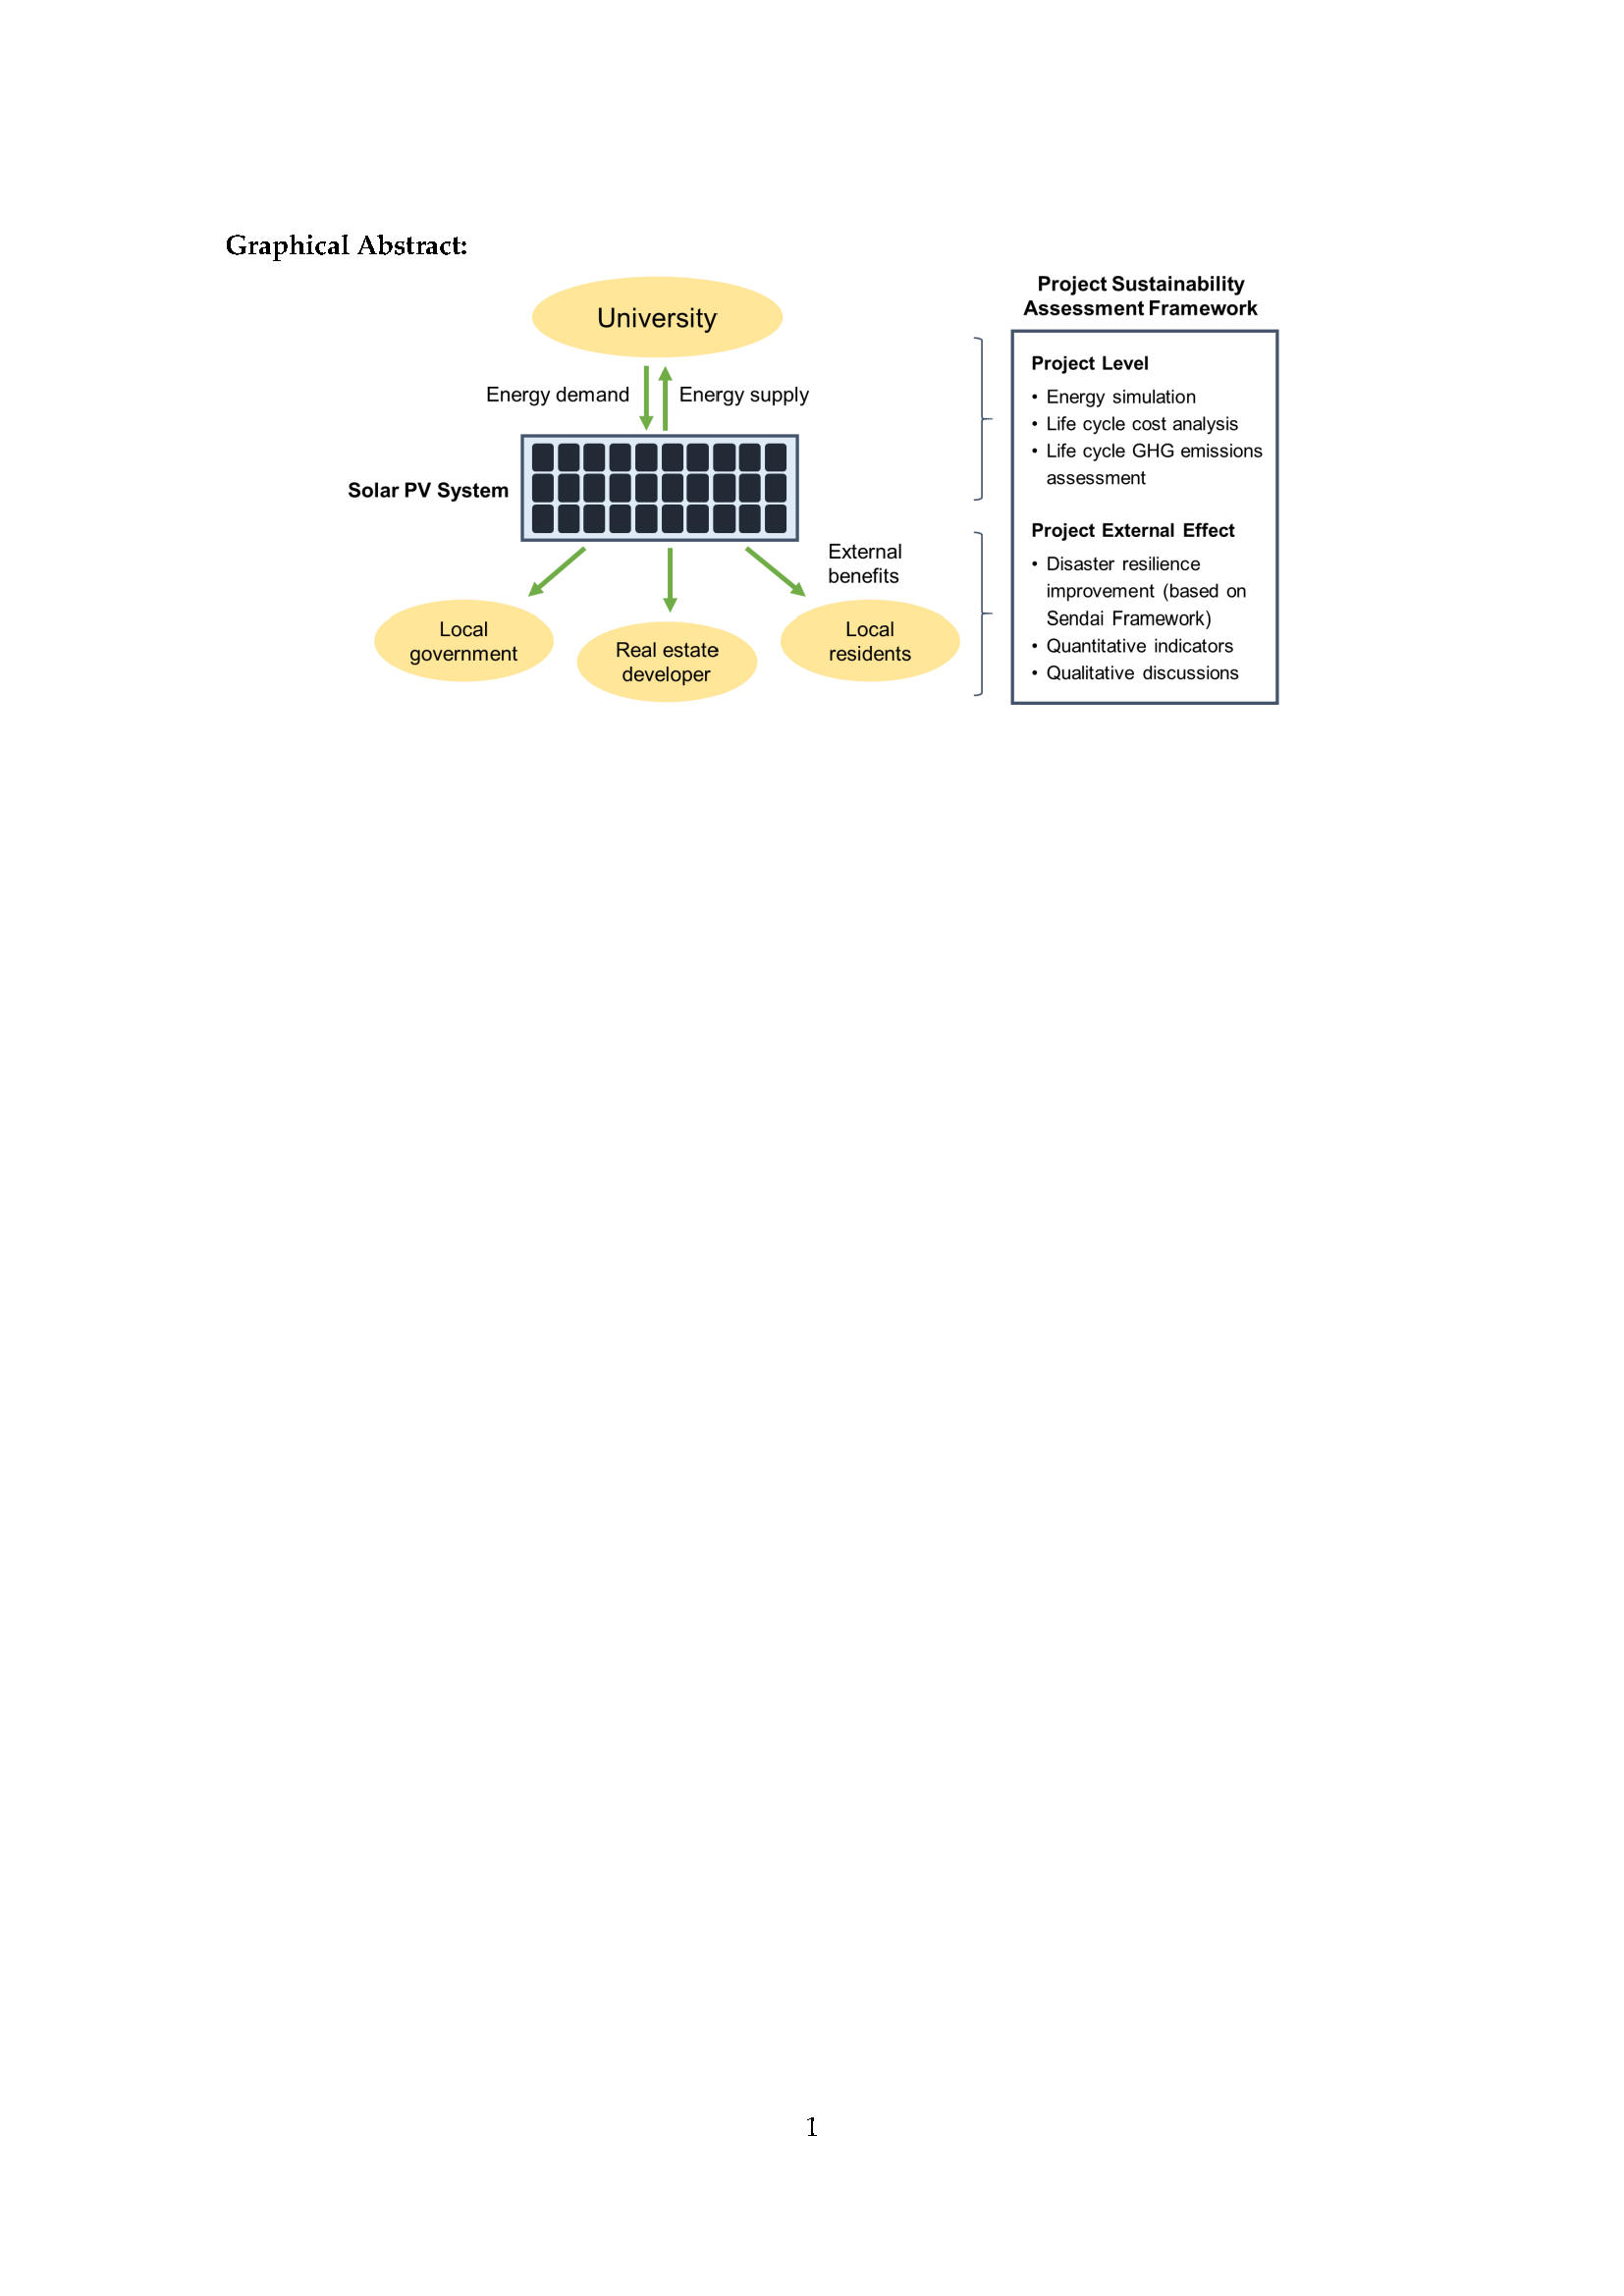
2. Materials and Methods

The green campus initiative is a students’ proposal from the “Global Field Exercise” at the University of Tokyo. The course requires graduate students to conduct site surveys and propose solutions to improve sustainability in a chosen local community. Here, the Kashiwa Campus and its neighborhood including an on-going township development project, Kashiwanoha Smart City, were studied.
  • The Kashiwa Campus is one of the new campuses of the University of Tokyo. It was established around 2000 and consists of ten graduate schools and research institutes. Apart from classroom usage, intensive electricity consumption was observed in laboratory activities, including the operation of super computers. A goal to cut the campus CO2 emissions by 50% at 2030 relative to the level of 2012 was set in an action plan, known as the Todai Sustainable Campus Project [8].
  • The neighborhood of Kashiwa Campus is composed of industrial sites, a recreational park, and a residential area (see Supplementary Materials: Figure S1) [9]. In addition, Kashiwanoha Smart City is located approximately 2 km from the campus. The smart city has an area of 127,000 m2 and has a plan to expand to 3 million m2 by 2030 [10]. This ambitious project is led by a domestically reputed real estate developer, Mitsui Fudosan; the University of Tokyo is involved as an academic partner in different stages of the development plan.
An important feature of the smart city is the installed smart grid system that consists of several small-scale wind and solar generation facilities and two stationery battery energy storage systems. The current capacity of the wind and solar power is trivial due to the limited space for installation. The battery storage saves energy costs by following an energy arbitrage strategy that stores low-price nighttime electricity for daytime use [11]. A portion of the energy storage is dedicated to emergency power in case of power outages.
The proposed solar PV system leveraged the abundant spaces available at the campus to achieve a megawatt-scale generation capacity. The solar power plant can then be connected to the smart city grid to enhance the emergency power system. Guided by the broad Sustainable Development Goals (SDGs) [12], the solar PV introduction would contribute to the increase of renewable energy in the energy mix (SDG 7). An external effect that would spill over into the community is the reduction of damages or losses caused by the disruption of the centralized grid system. This improves the resilience of the city in face of disaster, thereby contributing to SDG 11.
Figure 1 shows the project sustainability assessment framework applied in this study. At the project level, the solar PV system was designed based on the energy demand and supply simulation. Then, the life cycle cost analysis and life cycle greenhouse gas (GHG) emissions assessments were conducted to assess the project performance. Beyond the project level, we investigated the project’s external effects based on the United Nations Sendai Framework for Disaster Risk Reduction 2015–2030 [13].

2.1. Design of the On-Campus Solar Photovoltaic System

The project was designed to generate solar power to partially fulfill the energy demand of the campus. First, the hourly energy demand was estimated. Then, the hourly solar energy supply was simulated. The designed capacity was determined at the point where maximum solar irradiance occurred, i.e., 632 W/m2 from 12:00 to 13:00 in the spring season. The designed capacity was capped at the average energy demand during the designated time. The idea was to ensure that the solar power supply will not exceed the energy demand. Therefore, we could avoid solar power curtailment or energy wastage. This assumed that insufficient power was still being drawn from the existing electrical grid, and no energy storage system was installed because of cost considerations.
For the estimation of energy demand, campus-wide electricity consumption in year 2017 was selected as a reference. We assumed the energy demand was constant to simplify the preliminary design. We did not account for the future expansion of campus facilities. We collected data from the Todai Sustainable Campus Project [8], which provides a real-time monitoring of electricity usage in the campus since April 2008. Figure S2 (see Supplementary Materials: Figure S2) illustrates the campus electricity usage in an hourly electricity consumption manner following the changes in four seasons.
We used Equation (1) to simulate energy supply from the designed solar panels on an hourly basis [14].
PW = I × η × Ftemp × Finv × Fother
where PW is the electricity produced, I is the hourly solar irradiance (W/m2), η is the conversion efficiency of the solar panel, and Ftemp, Finv, and Fother are the efficiencies of the temperature, inverter, and other factors, respectively.
We collected the reference for I from the local meteorological station (see Supplementary Materials: Table S1) [15]; η from a major Japanese solar panel producer, Sharp Corporation [16]; Ftemp, Finv, and Fother from the literature investigating relevant issues in Japan [14]. Table 1 summarizes the parameters applied to the simulation.
For the designed capacity of the solar PV system, we assumed the potential hourly solar energy supply, PW, in the noon during spring matched the average campus electricity demand at the time. Then, we obtained the required active surface area of the solar panels. Following the assumption in Reference [17], we assumed that a solar panel surface of 3 kWp required 20.3 m2. We then calculated the peak power supply, kWp, of the PV system using this ratio.
We considered the degradation of the solar panels due to the fact of normal wear and tear. Equation (2) shows the calculation of electricity generation (Et) at year t [18].
Et = E0 × (1 − d)t
where E0 is the initial annual electricity generation and d is the degradation rate. We assumed a 0.8% annual degradation rate which was within the typical range [18]. The operating period of the solar panels was assumed to be 30 years.

2.2. Assessment of the Solar Photovoltaic System

A renewable energy project often involves an intensive initial investment and a subsequent payback over a longer period. To objectively evaluate the cost and GHG emissions, we conducted the assessments from a project life cycle perspective.

2.2.1. Life Cycle Cost Analysis

Life cycle cost estimates and monitoring the costs of a project are done by accounting for the contributions from all product stages. Following the International Renewable Energy Agency [19], we calculated the total cost of the solar PV project (Ctotal) using Equations (3) and (4).
Ctotal = Cinstalled + COM
Cintstalled = CBoS + Cmod + Cinv
where Cinstalled is the initial installation cost that consists of the balance of system (CBoS), PV modules (Cmod), and inverters (Cinv); COM is the operation and maintenance cost.
We collected secondary data from the International Renewable Energy Agency [19]. The CBOS and Cmod for utility-scale solar power plants in Japan are available in the report. The Cinv and COM were estimated from a global average dataset [19] and a source from the United States [18], respectively. Table 2 summarizes the cost factors for setting up a one kW unit of a solar PV plant applied in this study. Table S2 (see Supplementary Materials: Table S2) breakdowns the cost of the balance of system, which includes hardware, installation, and soft costs.
In addition, we took the time preference for money into account. For instance, the value of money spent initially (Cinstalled) would be worth more than the money spent annually in the subsequent years (COM) from a borrowed money viewpoint. We followed a conventional assumption in economic analysis—the money required to finance an alternative is considered to be obtained from a bank or a firm at an interest rate [20]. The real value of Cinstalled is therefore represented in Equation (5).
Cinstalled,n,r = Cinstalled,0 × (1 + r)n
where Cinstalled,n,r is the future value of Cinstalled with n years of loan at an interest rate r, Cinstalled,o is the present value of the Cinstalled. We assumed n was 20 and r was 1.7% or 3.2% based on local conditions in Japanese communities [21].
Next, we applied the levelized cost of electricity (LCOE) to compare the cost performance of renewable and fossil fuel energy [22]. The LCOE showed the average cost of generating one kWh of electricity over the lifetime of the solar PV project, as represented in Equation (6).
LCOEproject = (Cinstalled,n,r + COM)/(∑Et)
where Cinstalled,n,r is the total installation cost described in Equation (5), COM is the total operation and maintenance cost, and Et is the generated energy estimated from Equation (2).
Finally, we estimated the payback period that would breakeven on the investment. We assumed that an equal amount of electricity from the grid would be substituted by the solar power, thus a net savings was achieved by reducing electricity bills.
Payback period = (Cinstalled,n,r + COM)/(∑Et/t × Cavoided)
where Cavoided is the cost of avoided electricity which was assumed to be 0.16 USD/kWh, which represented a higher electricity price during the daytime in Japan [23].

2.2.2. Life Cycle GHG Emissions Assessment

Life cycle assessment is a tool to systematically assess the environmental impact of a product by quantifying the pollutants released into environment in all product stages [5,24]. Following the ISO LCA [4], goal and scope definition, inventory analysis, impact assessment, and interpretation were conducted. The goal was to assess the GHG reduction as a result of introducing the solar PV project. The scope included raw material acquisition and production of the solar PV. Maintenance and end-of-life treatment of facility were excluded due to the lack of information. Based on the project design (Section 3.1.), the functional unit was defined as an on-campus solar power plant with 14,851 kWp installed capacity.
The inventory of material and energy inputs for setting up the solar PV project was estimated based on reference studies reported in the Ecoinvent v3.4, an academically reputed LCA database [25]. The dataset contained detailed information for roof-top and utility-scale PV systems. Table S3 (see Supplementary Materials: Table S3) shows the estimated requirements of energy and materials for producing the inverter, mounting system, solar panels, and electric installation.
Emissions of GHG were estimated for the material acquisition and production. We extracted information from the database [26]; then, we characterized the global warming potential of the GHG using the Intergovernmental Panel on Climate Change (IPCC) 2013 method (GWP100, represents, in kg, CO2-eq) [27]. The above calculation and modelling were performed in an open-source LCA software, OpenLCA v1.7, developed by GreenDelta [28].
To show the contribution to GHG reduction, we compared the emissions of electricity generation from the proposed solar PV system to conventional grid power. The power plants in Japan are mostly fossil fuel-based after the shutdown of nuclear power plants in 2011. The GHG emissions for grid power was obtained from the database [17], which was 0.7935 kg CO2-eq/kWh.

2.3. Assessment of External Effect: Disaster Resilience Improvement

In general, external effects are defined as a project’s consequential impacts on a community. Stakeholders are defined as community members affected by the external effects, positively or negatively. The identified stakeholders, then, can be included in the decision-making process of the project. In doing so, the external effects are said to be internalized [29]. The proposed project’s external effect was identified as a benefit—improving the disaster resilience of the local community. The stakeholders were nearby residents, local government, and the real estate developer. Utilizing the United Nations’ Sendai Framework for Disaster Risk Reduction 2015–2030 [13], we assessed the external effect using quantitative indicators adopted from the Sendai Framework and qualitatively discussed the anticipated roles of the stakeholders.

2.3.1. Indicators for Disaster Resilience and Preparedness

The Global Target D of the Sendai Framework aims to significantly reduce disaster damage to critical infrastructure and disruptions of basic services [30]. In our case, access to electricity is essential for the proper functioning of critical infrastructures and provision of basic services. The continuation of electricity supply would minimize the disruptions to commercial activities as well as the daily lives of the local community.
However, the indicator suggested in the Sendai Framework is defined broadly as “number of disruptions to basic services attributed to disasters” ([30], p. 7/41). From a project perspective, we redefined this indicator to include only the people who would be affected by the project. We hereby determined that the number of people who would have access to emergency power as a result of the proposed project as the indicator for disaster resilience and preparedness.
In the event of a power outage, two ways of accessing the solar power was expected from our observations. First, the campus may serve as an emergency relief center where nearby residents could visit and access the electricity supply on-site. We assumed that residents living within a 2 km travel distance from the campus would be benefited. As the campus itself spans about 1 km in length, we estimated the lower and higher range of affected residents based on the distance to the center and to the edge of the campus, respectively. We acquired the statistics as of January 2018 from the local government [31]. Distance from the campus was calculated based on the city map available at the local government website (see Supplementary Materials: Figure S2).
Second, the solar power can be partially transmitted to the smart grid in the Kashiwanoha Smart City. The smart city had originally installed an 1800 kWh NaS battery and a 500 kWh Li-ion battery, to provide approximately three days of emergency power. If the proposed solar PV system were connected, excess power could be used to recharge and sustain the emergency power. The emergency power is primarily for essential lighting and elevator access to higher floors. This is critical to support high-floor residents who may have difficulties in climbing the stairs, especially the elderly, learning from the previous 311 disasters. We obtained statistics regarding residents who are connected to the smart grid from the developer.

2.3.2. Anticipated Roles for Stakeholders

The external effect must be recognized by the relevant stakeholders to fully realize its potential. For example, if the proposed project was limited to on-campus consumption but not connected to the smart grid, the benefit cannot be extended to the smart city. Conversely, if the relevant stakeholders acknowledged the benefits, they would be encouraged to contribute to the project.
The Sendai Framework is helpful in stakeholder engagement as it lays out four priorities that are interconnected and critical to improve disaster resilience [13]. First, it calls for a clear recognition of the disaster risk for stakeholders. Then, it calls for public–private collaboration in terms of service provision and financial investment. As a result, the disaster preparedness measurements can be implemented.
We identified the potential contributions and anticipated benefits from the stakeholders by conducting workshop-style discussions with representatives from the Kashiwa City Government and Mitsui Fudosan, the local real estate developer. The discussions were conducted in October 2017 and January 2018.

3. Results

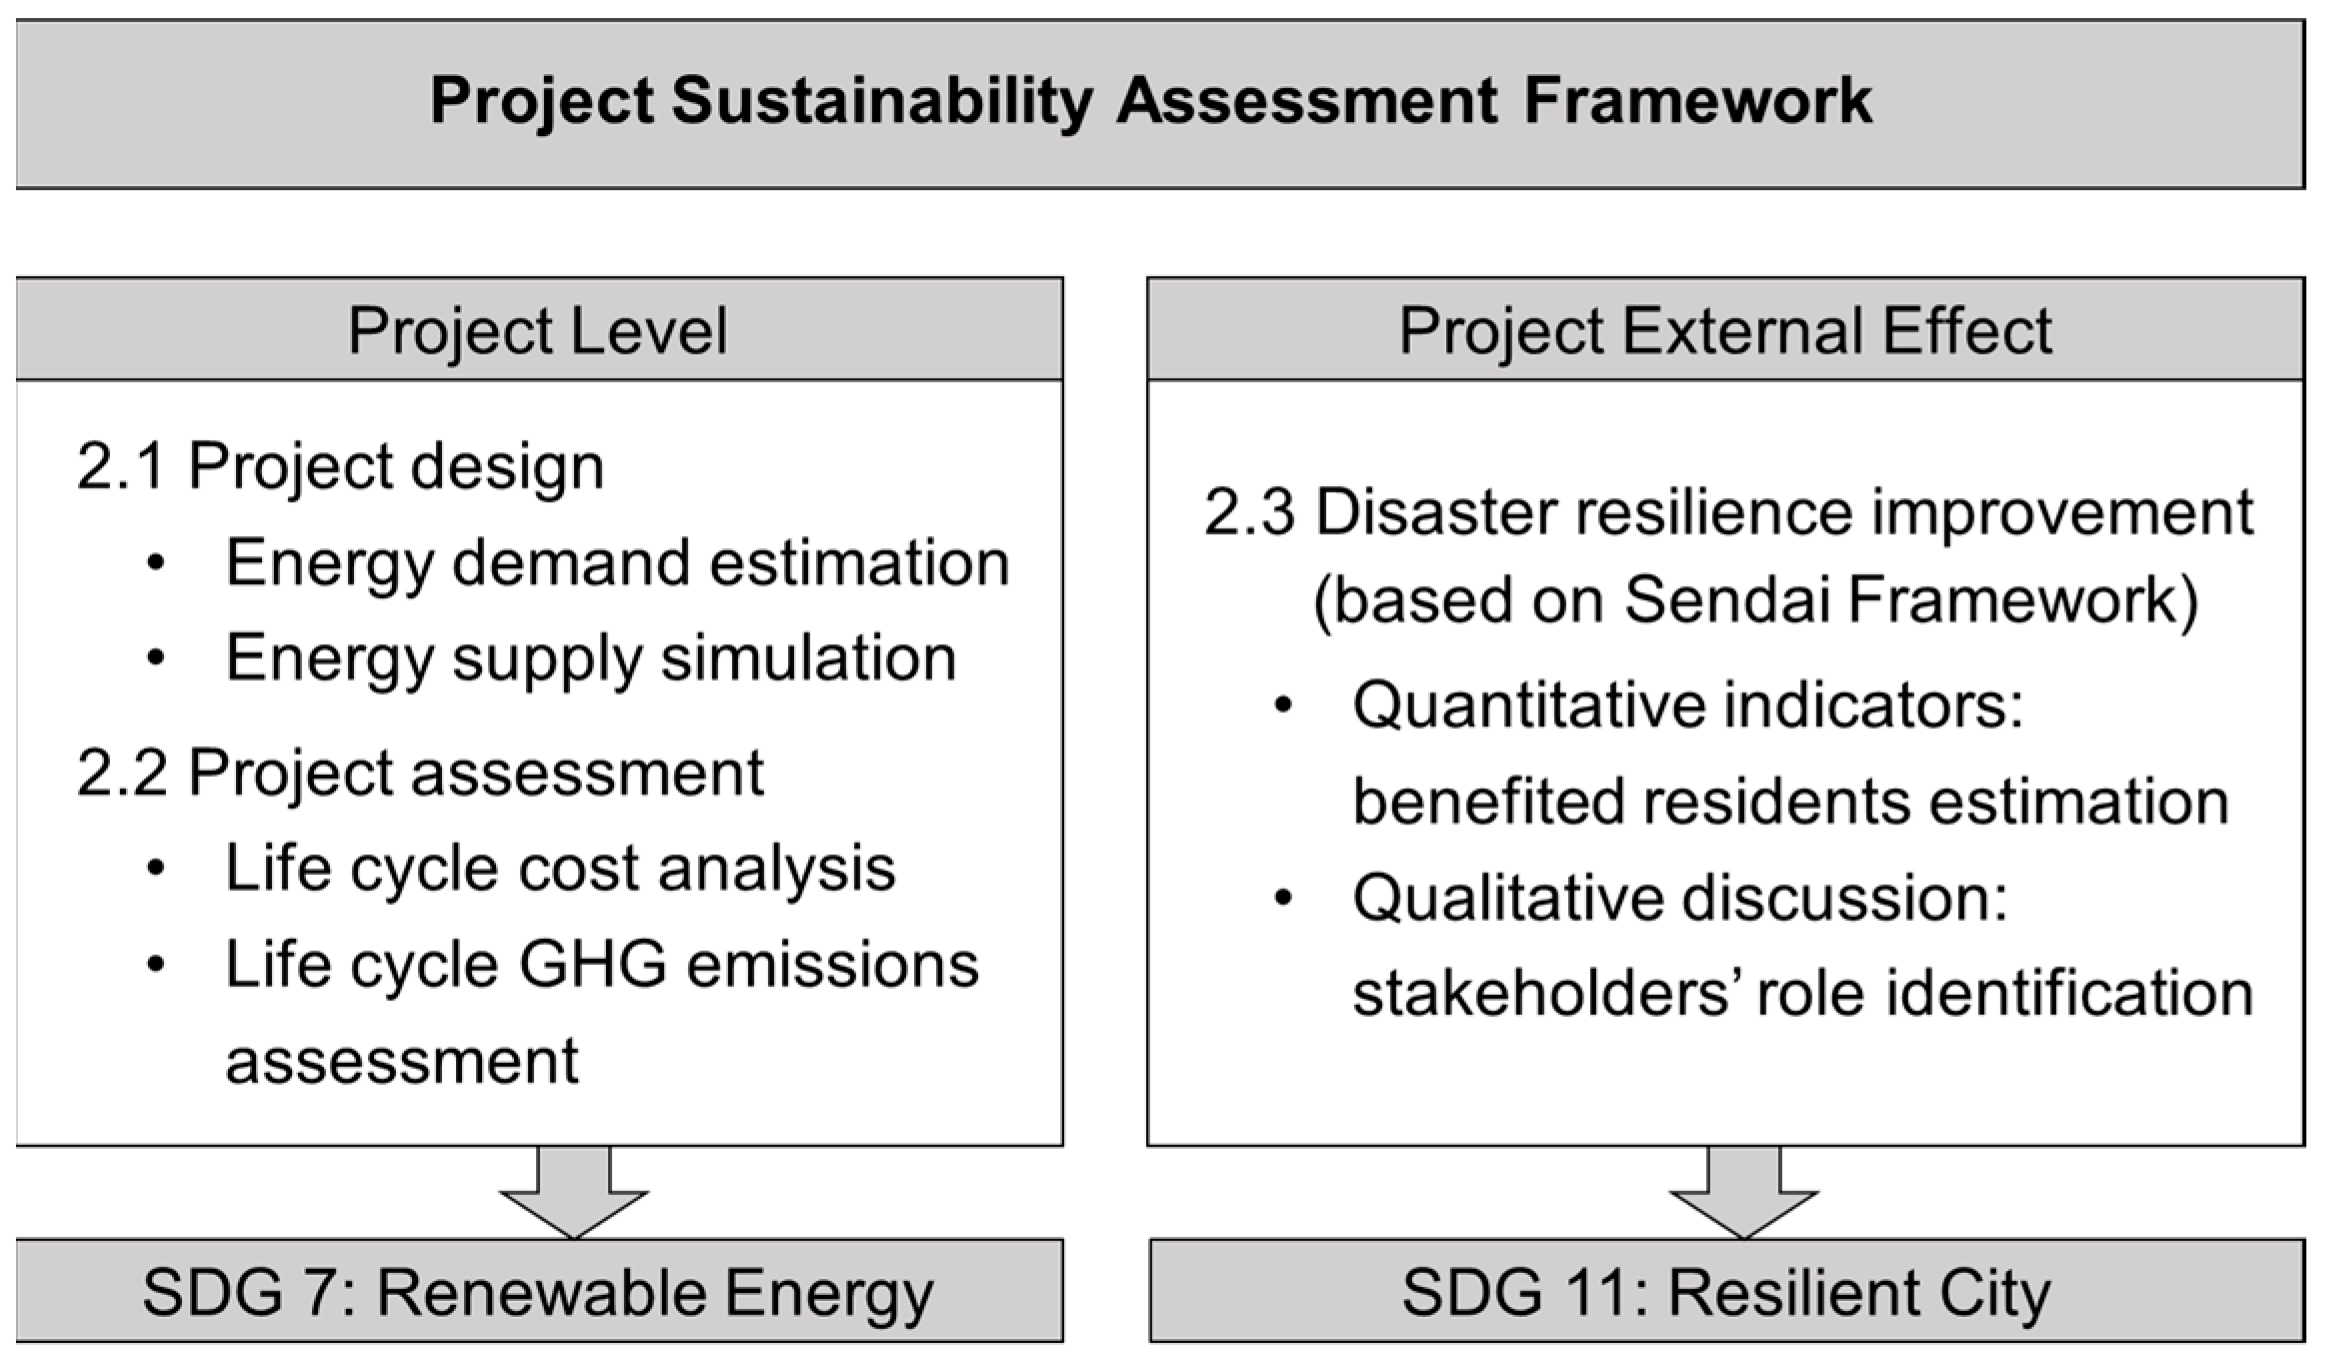
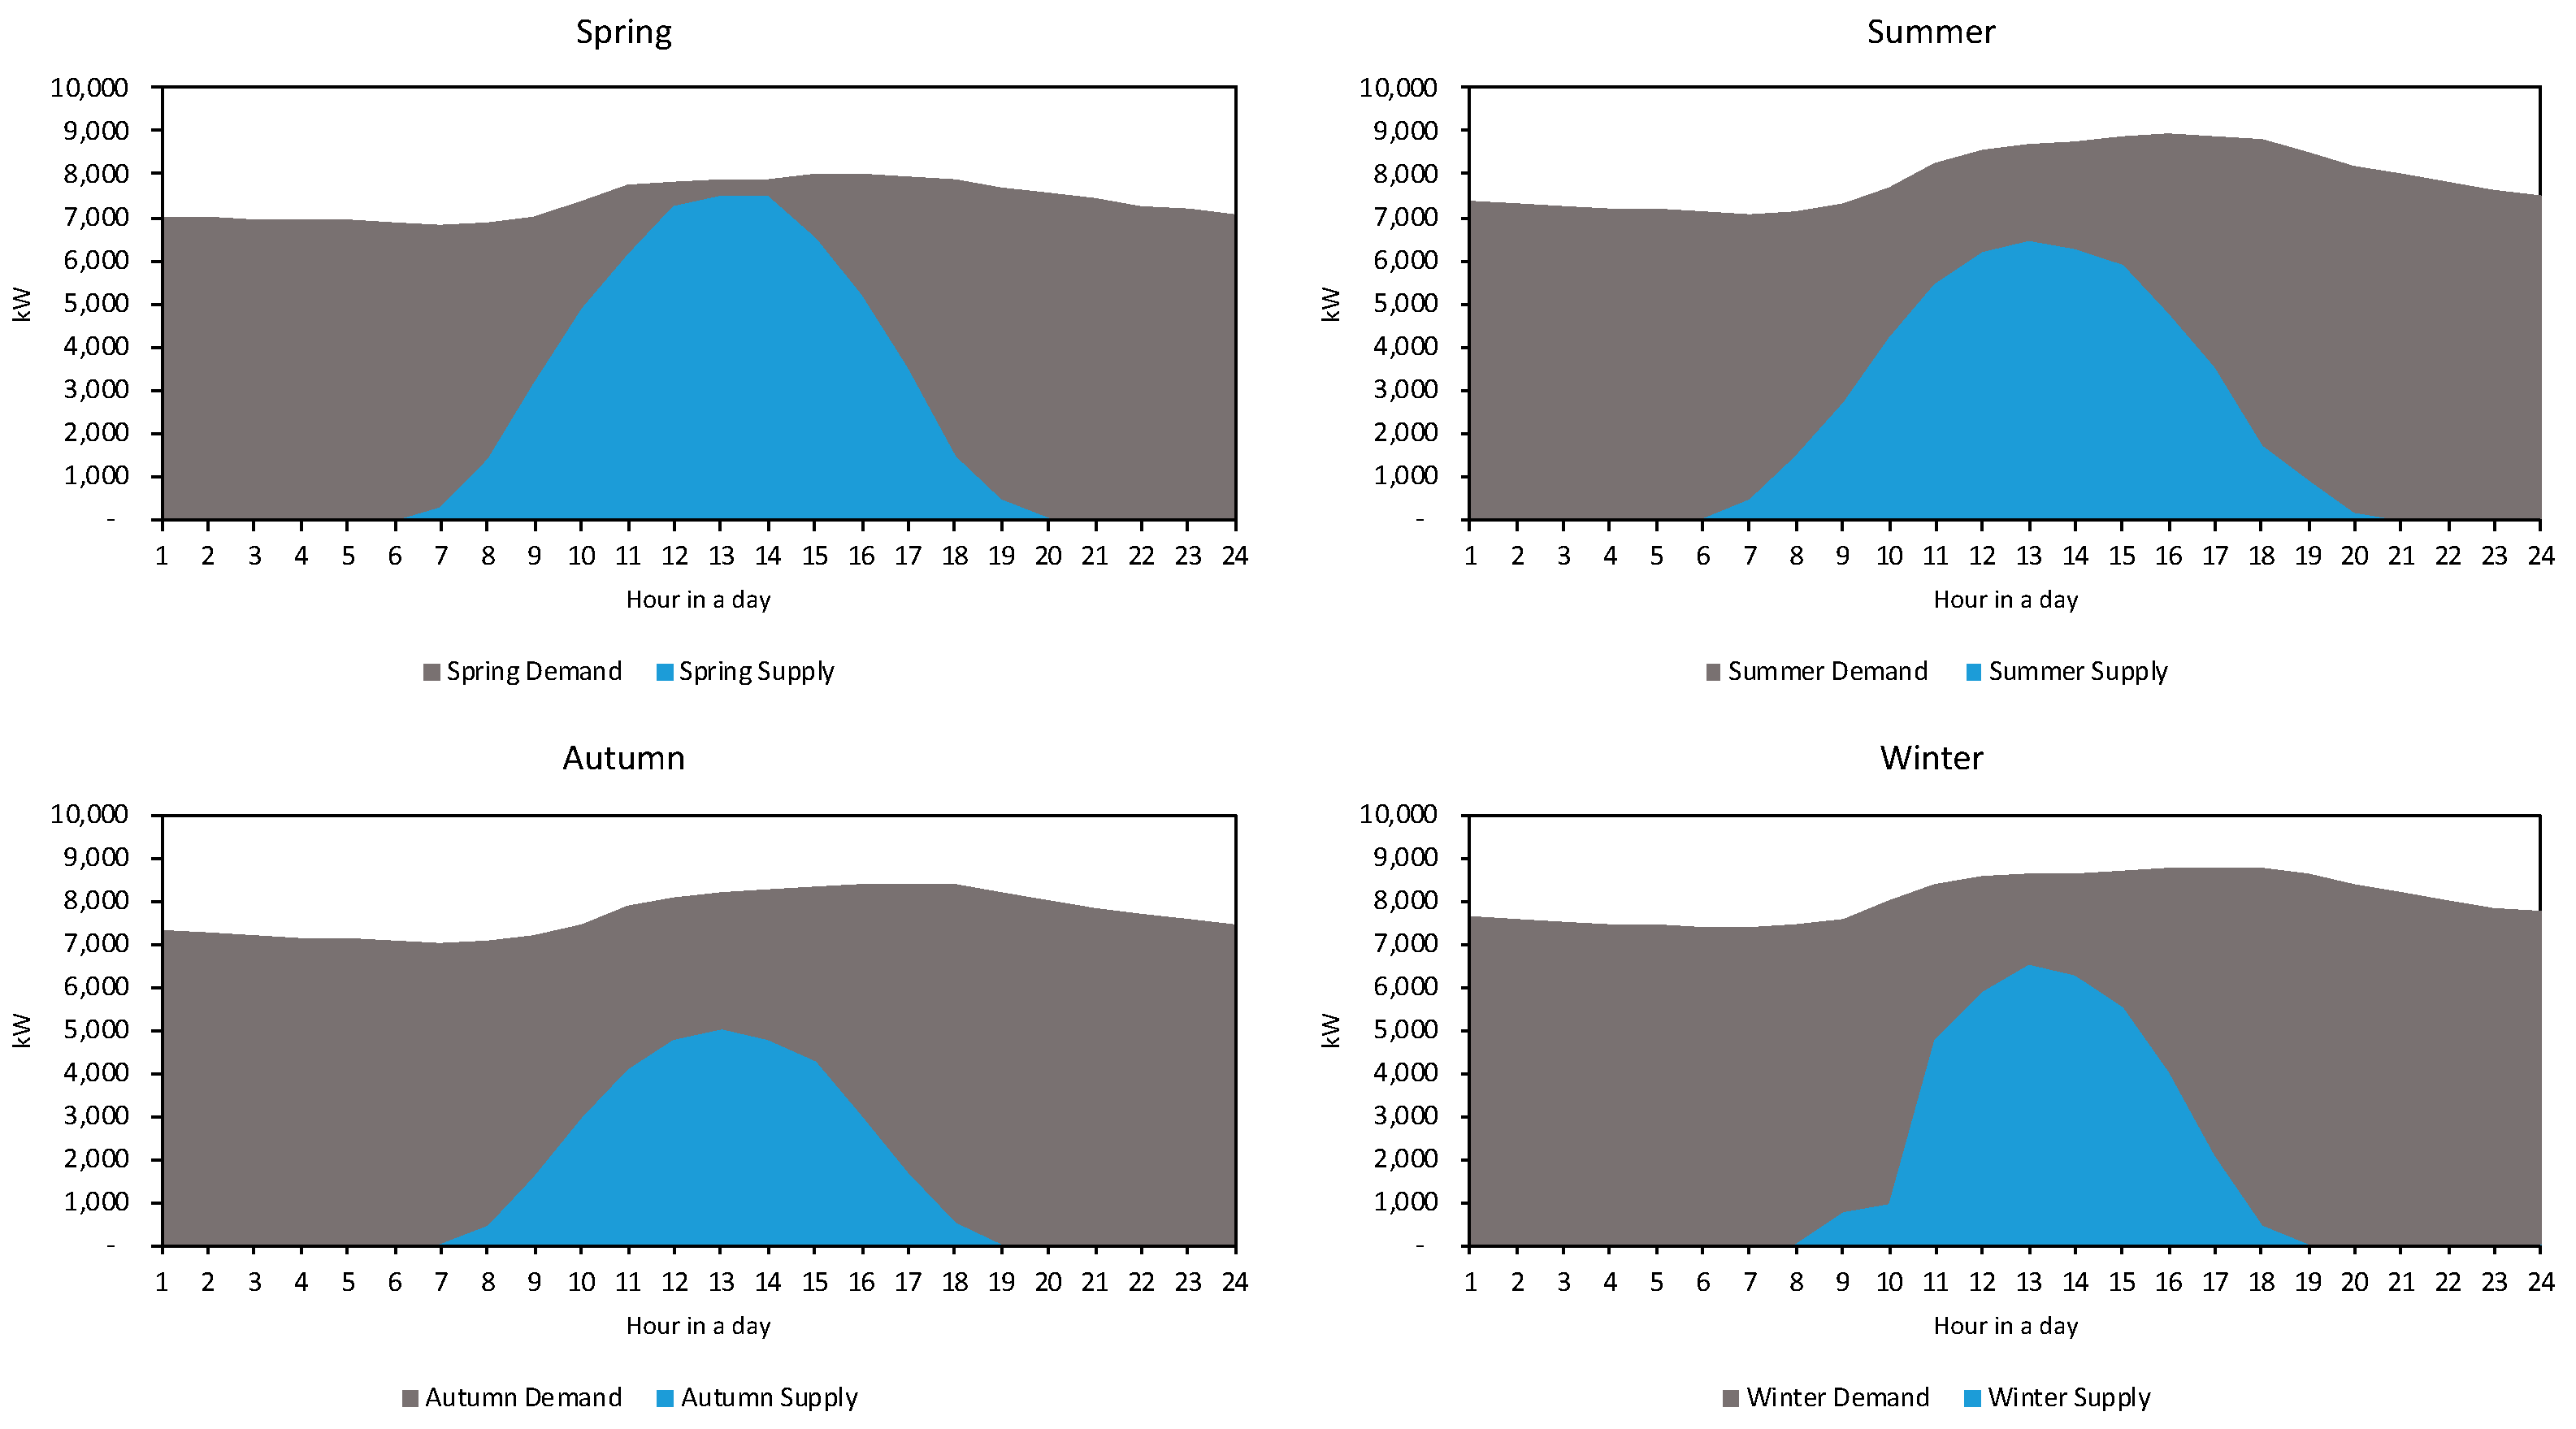
3.1. Capacity of the On-Campus Solar Photovoltaic System

The designed solar PV system could partially substitute the electricity from the grid system. The installed capacity was capped at 14,851 kWp, or approximately a 100,000 m2 active surface of solar panels to minimize excessive power generation. Figure 2 shows the simulated solar energy supply overlaid on the campus energy demand in four seasons. Overall, spring provided more solar energy due to the better weather conditions and a suitable temperature for operation. The self-sufficiency rates were 0.31, 0.26, 0.18, and 0.19 for spring, summer, autumn, and winter, respectively, measured by the total generation over total consumption.

3.2. Project Level Assessment

3.2.1. Life Cycle Cost

The project was estimated to cost 22.26 million USD which consisted of an 88% installation cost and 12% O&M cost. The cost of installing solar PV is relatively high in Japan and about three times higher than in China in cost for balance of system. This is most likely due to the expensive labor and a high profit margin for corporations in Japan [19].
Taking into consideration the time preference of money (for initial installation), investments of $29.83 million and $39.97 million USD were required, estimated at 1.7% and 3.2% interest rates, respectively. The latter interest rate was a more conservative figure reported earlier in the year; the former was more realistic due to the low interest rate policy in Japan [21]. Both cases assumed a 20 year loan period.
The LCOEs of the solar-generated electricity were 0.07 and 0.09 USD/kWh in the case of 1.7% and 3.2% interest rates, respectively. As a reference, the global weighted-average LCOE in 2018 was 0.085 USD/kWh (with 5th and 95th percentiles of 0.058–0.219 USD/kWh) [32]. These figures were lower than the 0.16 USD/kWh daytime electricity rate offered by the power company [23]. The project therefore would be profitable by substituting partial energy supply to the generated solar power and, thus, saving on electricity bills. Our results showed that the payback periods were 12.9 and 16.8 years, respectively (Figure 3). Net savings of $39.5 and $29.4 million USD were projected in the 30 year operation period, respectively.

3.2.2. Life Cycle GHG Emissions

The life cycle GHG emissions associated with the solar PV project was 35 million kg CO2-eq. The main contributor was the manufacture of multi-silicon solar cells in the solar panel production. This was followed by aluminum and steel in the mounting system. The balance of system, including inverter and electric installation, had relatively less impact. Table 3 summarizes the global warming potential and the overall contribution of each component in the proposed system.
The electricity generated from the project was estimated to be 0.0811 kg CO2-eq/kWh based on a 30 year operation. As a reference, a recent review of the literature showed that the life cycle GHG emissions for multi-crystalline PV had a mean of 0.0736 kg CO2-eq/kWh (with a range of 0.0094–0.250 kg CO2-eq/kWh) [33]. The value was about 10 times less than the fossil fuel-intensive grid system in Japan, which was 0.7935 CO2-eq/kWh. Subsequently, the project would be able to mitigate a total of 308 million kg CO2-eq emissions by reducing consumption from the grid energy.

3.3. External Effect on Local Community

Although the original purpose of the project was to substitute on-campus electricity for renewable solar power, in the event of a natural disaster and massive power outage it could serve as an emergency power facility. We found that between 4666 to 8454 nearby residents would be able to access the on-site electricity if the campus was made into a relief center in the event of a disaster. Table S4 (see Supplementary Materials: Table S4) shows the city districts included in our study. For a higher estimation, all listed districts were included. For a lower estimation, we excluded Kashiwanoha 6-chome and Midoridai 1-chome, 2-chome, and 3-chome. Note that residents who live in an area excluded in our scenarios can still access the electricity if they choose to travel to the campus. The calculation was based on the statistics of Kashiwa City only. As shown in Figure S1, a part of the neighborhood is under the jurisdiction of another city, Nagareyama City, which was excluded in this study. Therefore, our results are likely an underestimation.
Currently, there are five high-rise apartment buildings that are connected to the smart grid. As we can only obtain the number of units in each building, we assumed that each unit consists of a three-person household. Our estimation found that there are 8532 smart city residents connected to the smart grid (see Supplementary Materials: Table S4). These residents are expected to have a substantial improvement in energy security, in addition to the three days of emergency power originally in place. As the smart city is planned to expand in near future, more residents are expected to benefit from the project.
In addition to the smart city developer, we recognized that more stakeholders at the local level are relevant to the project as mutual benefits could be achieved. Table 4 summarizes the potential contribution and anticipated benefits for the various stakeholders in our study.
Coincidentally, the Sendai Framework includes a resolution that calls for stakeholders’ voluntary commitment [34]. Collaborative stakeholder initiatives that would contribute to disaster risk reduction are encouraged; and their projects should be submitted to the Sendai Framework Voluntary Commitment online platform [35]. At present, Japan ranks second in terms of the number of voluntary commitments submitted, i.e., three. If the proposed solar PV project is accepted as a voluntary commitment, the various stakeholders, as identified in Table 4, would be expected to receive additional benefits, such as publicity for good practices, realization of corporate social responsibility, etc. This additional incentive would be useful in encouraging the local government to join and support the proposed project.

4. Discussion

4.1. Design of the Renewable Energy System

The designed project represents an introductory stage of implementing a renewable energy system in which only a relatively small share of renewable energy was present [36]. Therefore, the overall impact on the grid’s stability was trivial and was ignored in this study. As the current design only aimed to partially substitute the energy source, this would minimize the cost and the GHG emissions by (a) avoiding a pricier electricity rate during the daytime and (b) mitigating the need for CO2-intense peaking power plants in Japan. If the solar PV system were to be expanded in the future, a corresponding energy storage system such as Li-ion or lead-acid stationery batteries must be included. Such a design may provide an ideal 100% self-sufficiency scenario; however, the battery system would be much more expansive than the grid electricity at the present state of development [37].

4.2. Sustainability Performance of the Project

The proposal was very positive in terms of cost and environmental performance at the project level—project cost could be recouped in 12.9 years and a net 39.5 million USD saving over the 30 year operating period; a total of 27% CO2 emissions from electricity usage could be mitigated. However, this assessment is subject to constraints and uncertainty discussed below.
  • As mentioned in Section 4.1., the current design did not include an energy storage system, thus it completely relies on the grid system to adjust the intermittency of solar power. An additional battery storage system would impact the performance greatly.
  • Publicly available information on the cost of renewable energy systems is very limited. The data for this study was primarily acquired from a third party, the International Renewable Energy Agency [9], which may slightly differ from local conditions.
  • The assumption of the avoided electricity rate, 0.16 USD/kWh, based on a utility-scale higher daytime rate was sensitive to the payback time and net savings estimation. This rate might be subject to change in the future.
  • The monetary value of the net savings did not necessarily mean a positive income for the university, as the power was intended for on-campus consumption. Meanwhile, there was no feed-in tariff policy in place at present, particularly for utility-scale solar power generation.
Nevertheless, we determined the project as economically viable and environmentally friendly after careful assessment (e.g., using a conservative estimation for the solar degradation rate, consideration of a time preference for money). We did not expect the overall outcome to be overturned as a result of the uncertainty.
Our assessment framework showed that project sustainability can be enhanced by incorporating external effects at the local level. Further, stakeholders who are relevant to decision making were easily identified and can be brought into the discussions more readily. Utilizing the Sendai Framework, we determined the external benefit in our case. Disaster resilience and preparedness is critical to Japanese residents in the wake of the 311 Tohoku Earthquake event. An unsophisticated indicator, the number of benefited residents, was used to demonstrate the possibility of including such a concern. At this stage, this would be enough to communicate with the local government and the developer, since they will have their own consideration to judge whether investing in such a project to protect the given number of residents is worthwhile.
The external benefits, if unrealized, represent a problem of positive externalities. Recognizing the potential contributions and benefits for the various stakeholders is an important first step to solving the problem. The summary in Table 4 was a preliminary result that did not mean to be comprehensive; if the proposal was accepted, more detailed cost and benefit analyses for each stakeholder could be performed. Our assessment suggests that further negotiation among the stakeholders are expected to achieve mutually agreeable and beneficial outcomes.
In conclusion, a green campus initiative based on the introduction of a solar PV system was designed and assessed using a project sustainability assessment framework that not only takes a life cycle perspective, but also incorporates external effects in order to effectively engage stakeholders. Our assessment highlighted a holistic and practical approach—considering the unique local conditions, with an emphasis on disaster resilience—to support a transition to renewable energy.

Supplementary Materials

The following are available online at https://www.mdpi.com/2071-1050/11/20/5786/s1, Figure S1: Map showing the surrounding area of Kashiwa Campus of the University of Tokyo. The green-shaded area represents the campus area; the blue-shaded area represents nearby residential area; the aqua-shaded area represents the current area of the Kashiwanoha Smart City, Figure S2: The estimated campus-wide energy demand in a day, showing in annual and seasonal average, based on the actual electricity consumption data in previous year, Table S1: The average hourly sun irradiance at the designated location in 2017 based on the Kashiwa Meteorological Center [15], Table S2: The balance of system cost for a utility scale solar plants in Japan at 2015 [19], Table S3: Inventory data of setting up a 14,851 kWp solar photovoltaic system on campus that is estimated based on the dataset in Ecoinvent v3. (A negative value represents an output of by-product.), Table S4: Residents living within 2 km walking distance from Kashiwa Campus and smart city residents connected to smart grid.

Author Contributions

Conceptualization, H.S.T., Q.Y., M.O. and H.Y.T.; Methodology, H.S.T., Q.Y. and H.Y.T.; Formal Investigation, Q.Y.; Writing–Original Draft Preparation, H.S.T.; Supervision, M.O. and H.Y.T.; Funding Acquisition, H.Y.T.

Funding

The article processing charges were sponsored by Waseda Research Institute for Science and Engineering.

Acknowledgments

This project was conducted during the course Global Fieldwork Exercise (GFE) in GPSS-GLI, the University of Tokyo, 2018. We appreciate the in-class contributions from Ruth Anne Gonocruz, Muhammad Uswah Pawara, and Nikolaos Iliopoulos, and support from the class instructors Takashi Mino and Giles Bruno Sioen, and the support from the Mitsui Fudosan, the smart city developer, and representatives from the Kashiwa City Government. In addition, we thank the anonymous reviewers for the constructive comments which improved the manuscript.

Conflicts of Interest

The authors declare no conflict of interest.

Abbreviations

GHGGreenhouse gas
GWPGlobal Warming Potential
IPCCIntergovernmental Panel on Climate Change
ISOInternational Organization for Standardization
LCALife cycle assessment
LCCLife cycle cost analysis
LCOELevelized cost of electricity
PVPhotovoltaic
SDGSustainable Development Goal

References

  1. Alshuwaikhat, H.M.; Abubakar, I. An integrated approach to achieving campus sustainability: Assessment of the current campus environmental management practices. J. Clean Prod. 2008, 16, 1777–1785. [Google Scholar] [CrossRef]
  2. Tan, H.; Chen, S.; Shi, Q.; Wang, L. Development of green campus in China. J. Clean Prod. 2014, 64, 646–653. [Google Scholar] [CrossRef]
  3. Finkbeiner, M.; Schau, E.M.; Lehmann, A.; Traverso, M. Towards life cycle sustainability assessment. Sustainability 2010, 2, 3309–3322. [Google Scholar] [CrossRef]
  4. Finkbeiner, M.; Inaba, A.; Tan, R.; Christiansen, K.; Klüppel, H.J. The new international standards for life cycle assessment: ISO 14040 and ISO 14044. Int. J. Life Cycle Assess. 2006, 11, 80–85. [Google Scholar] [CrossRef]
  5. Matthews, H.S.; Hendrickson, C.T.; Matthews, D.H. Life Cycle Assessment: Quantitative Approaches for Decisions that Matter. 2015. Available online: https://www.lcatextbook.com/ (accessed on 20 September 2019).
  6. Takahashi, H. The Lessons of the Great Tohoku Earthquake and Its Effects on Japan’s Economy’. Fujitsu Research Institute. 2012. Available online: https://www.fujitsu.com/jp/group/fri/en/column/message/2012/2012-01-10.html (accessed on 20 September 2019).
  7. Fukushima, Y.; Kikuchi, Y.; Kajikawa, Y.; Kubota, M.; Nakagaki, T.; Matsukata, M.; Kato, Y.; Koyama, M. Tackling power outages in Japan: The earthquake compels a swift transformation of the power supply. J. Chem. Eng. Jpn. 2011, 44, 365–369. [Google Scholar] [CrossRef]
  8. Todai Sustainable Campus Project (TSCP). Available online: http://www.tscp.u-tokyo.ac.jp/en (accessed on 28 August 2019).
  9. Kashiwa City Planning Map. Available online: http://www.machi-info.jp/machikado/kashiwa_city2/index.jsp (accessed on 20 September 2019). (In Japanese).
  10. Kashiwanoha Smart City. Available online: https://www.kashiwanoha-smartcity.com/en (accessed on 28 August 2019).
  11. Battke, B.; Schmidt, T.S.; Grosspietsch, D.; Hoffmann, V.H. A review and probabilistic model of lifecycle costs of stationary batteries in multiple applications. Renew. Sustain. Energy Rev. 2013, 25, 240–250. [Google Scholar] [CrossRef]
  12. United Nations. Sustainable Development Goals Knowledge Platform. Available online: https://sustainabledevelopment.un.org/ (accessed on 20 September 2019).
  13. UNISDR. Sendai Framework for Disaster Risk Reduction 2015–2030; United Nations Office for Disaster Risk Reduction (UNISDR): Geneva, Switzerland, 2015. [Google Scholar]
  14. Esteban, M.; Zhang, Q.; Utama, A. Estimation of the energy storage requirement of a future 100% renewable energy system in Japan. Energy Policy 2012, 47, 22–31. [Google Scholar] [CrossRef]
  15. Monitoring Station in Chiba. Available online: http://air.taiki.pref.chiba.lg.jp/ (accessed on 28 August 2019). (In Japanese).
  16. Sharp Solar Panels. Available online: http://www.sharp-world.com/solar/en/ (accessed on 28 August 2019).
  17. Jungbluth, N. Life cycle assessment of crystalline photovoltaics in the Swiss ecoinvent database. Prog. Photovolt. Res. Appl. 2005, 13, 429–446. [Google Scholar] [CrossRef] [Green Version]
  18. Bolinger, M.; Seel, J. Utility Scale Solar 2015; Lawrence Berkeley National Laboratory: Berkeley, CA, USA, 2016. [Google Scholar]
  19. International Renewable Energy Agency (IRENA). The Power to Change: Solar and Wind Cost Reduction Potential to 2025; IRENA: Abu Dhabi, UAE, 2016. [Google Scholar]
  20. Newnan, D.G.; Eschenbach, T.; Lavelle, J.P.; Wheeler, E. Engineering Economic Analysis, 13th ed.; Oxford University Press: New York, NY, USA, 2017. [Google Scholar]
  21. Briano, J.I.; Baez, M.J.; Morales, R.M. PV Grid Parity Monitor: Residential Sector 3rd Issue; CREARA: Madrid, Spain, 2015. [Google Scholar]
  22. Peake, S. Renewable Energy: Power for a Sustainable Future, 4th ed.; Oxford University Press: Oxford, UK, 2017. [Google Scholar]
  23. TEPCO Electricity Price for Contract above 500 kW. Available online: http://www.tepco.co.jp/ep/corporate/plan_h/plan03.html (accessed on 28 August 2019). (In Japanese).
  24. Guinée, J. Handbook on life cycle assessment—Operational guide to the ISO standards. Int. J. Life Cycle Assess. 2001, 6, 255. [Google Scholar] [CrossRef]
  25. Jungbluth, N.; Stucki, M.; Flury, K.; Frischknecht, R.; Büsser, S. Life Cycle Inventories of Photovoltaics; 2012 Version; ESU-services Ltd.: Uster, Switzerland, 2012; Available online: http://esu-services.ch/fileadmin/download/publicLCI/jungbluth-2012-LCI-Photovoltaics.pdf (accessed on 28 August 2019).
  26. Ecoinvent. Available online: https://www.ecoinvent.org/home.html (accessed on 28 August 2019).
  27. Myhre, G.; Shindell, D.; Bréon, F.-M.; Collins, W.; Fuglestvedt, J.; Huang, J.; Koch, D.; Lamarque, J.-F.; Lee, D.; Mendoza, B.; et al. Anthropogenic and Natural Radiative Forcing. In Climate Change 2013: The Physical Science Basis. Contribution of Working Group I to the Fifth Assessment Report of the Intergovernmental Panel on Climate Change; Stocker, T.F., Qin, D., Plattner, G.-K., Tignor, M., Allen, S.K., Boschung, J., Nauels, A., Xia, Y., Bex, V., Midgley, P.M., Eds.; Cambridge University Press: Cambridge, UK; New York, NY, USA, 2013; pp. 659–740. [Google Scholar]
  28. OpenLCA Software. Available online: http://www.openlca.org/ (accessed on 28 August 2019).
  29. Barnett, A.H.; Yandle, B. The end of the externality revolution. Soc. Philos. Policy 2009, 26, 130–150. [Google Scholar] [CrossRef]
  30. UN General Assembly. Report of the Open-Ended Intergovernmental Expert Working Group on Indicators and Terminology Relating to Disaster Risk Reduction (A/71/644); United Nations General Assembly: New York, NY, USA, 2016. [Google Scholar]
  31. Statistics of Population in Kashiwanoha. Available online: http://www.city.kashiwa.lg.jp/soshiki/020800/p009116.html (accessed on 28 August 2019). (In Japanese).
  32. IRENA. Renewable Power Generation Costs in 2018; International Renewable Energy Agency: Abu Dhabi, UAE, 2019. [Google Scholar]
  33. Kommalapati, R.; Kadiyala, A.; Shahriar, M.; Huque, Z. Review of the life cycle greenhouse gas emissions from different photovoltaic and concentrating solar power electricity generation systems. Energies 2017, 10, 350. [Google Scholar] [CrossRef]
  34. UNDRR. Sendai Framework Voluntary Commitments Synthesis and Analysis Report 2019; United Nations Office for Disaster Risk Reduction (UNDRR): Geneva, Switzerland, 2019. [Google Scholar]
  35. UNDRR Sendai Framework Voluntary Commitments (SFVC) Online Platform. Available online: https://sendaicommitments.unisdr.org/ (accessed on 28 August 2019).
  36. Lund, H. Renewable Energy Systems: A Smart Energy Systems Approach to the Choice and Modeling of 100% Renewable Solutions, 2nd ed.; Academic Press: Waltham, MA, USA; Oxford, UK, 2014. [Google Scholar]
  37. IRENA. Electricity Storage and Renewables: Costs and Markets to 2030; International Renewable Energy Agency: Abu Dhabi, UAE, 2017. [Google Scholar]
Figure 1. An overview of the project sustainability assessment framework. The project-level aspects show the design, financial feasibility, and environmental performance; the project’s external effects show the disaster resilience improvement of the local community. SDG = Sustainable Development Goals.
Sustainability 11 05786 g001
Figure 2. Simulated hourly solar energy supply and estimated hourly energy demand in a day, showing the average value for four seasons.
Sustainability 11 05786 g002
Figure 3. The estimated project costs at 1.7% and 3.2% interest rates and the avoided electricity cost (due to the substitution of the generated solar power to the purchased grid electricity) over the 30 year operation period. Payback times are the intersections of project costs and avoided costs; net profit (saving) regions are the areas above the project costs after the payback times.
Sustainability 11 05786 g003
Table 1. Parameters for simulating hourly solar power generation.
ParameterSymbolValue
Conversion efficiencyη15.5%
Efficiency of temperatureFtemp, sping, autumn85%
Ftemp, summer80%
Ftemp, winter90%
Efficiency of inverterFinv95%
Efficiency of other factorsFother95%
Table 2. Cost factors of the utility-scale solar photovoltaic (PV) project applied in this study [19].
Cost ComponentsAmountUnit
Total installed cost2518USD/kW
- Balance of System1678USD/kW
- Module700USD/kW
- Inverter140USD/kW
Operation/Maintenance15USD/kW/year
Table 3. Life cycle impact of setting up the proposed 14,851 kWp solar photovoltaic system.
Global Warming Potential (kg CO2-eq)Overall Contribution (%)
Solar Panel24,477,67469.6
Mounting system7,010,59219.9
Inverter2,885,3458.2
Electric installation772,0612.2
Electricity use9600.003
Total35,146,632100
Table 4. Potential contribution and anticipated benefits of the stakeholders involved in this study.
StakeholdersPotential ContributionAnticipated Benefits
The universityProvide rooftop area and open space for the solar panels; fund the projectReduce the carbon footprint from intensive energy demand
Nearby residentsWilling to incur additional expenses for the emergency power supplyAccess to emergency power in the event of massive power outage
Kashiwa City GovernmentFacilitate the project; provide policy support; fund the projectImprove the disaster resilience and preparedness of the region
Mitsui Fudosan (Developer)Connect the project to existing smart city infrastructure; fund the projectIncrease the value of developed properties by highlighting the improved energy security

