Environmental Sustainability of Food Consumption in Asia
Abstract
1. Introduction
2. Materials and Methods
- Cereals, which consist of wheat, rice, barley, maize, rye, oats, and sorghum, and all other products derived from it. Millet, buckwheat, canary seeds, and bran were aggregated into rice, due to lack of inventory data;
- Root vegetables, which consist of cassava and potatoes. Sweet potatoes, yams, and other tubers were also aggregated into potatoes;
- Legumes, nuts, and oilseeds, which consist of beans, pulses (broad beans, horse beans, chick peas, cow peas, pigeon peas, Bambara beans, vetches, lupins, pulses, sesame seeds and other oilcrops), peas, nuts, soybeans, ground nuts, sunflower seeds, rapeseed (aggregated with mustard seed), coconuts, and olives. Beans and pulses were aggregated into a single food item, due to lack of inventory data;
- Oils, which consist of soybean, groundnut, cottonseed, palm kernel, palm, coconut, rice bran, and maize germ oils. Sesame seed oil, olive oil, and oil derived from other sources were grouped with soybean oil;
- Vegetables, which consist of tomatoes and products, onions, aubergine, cabbage, and carrots. Leafy vegetables, such as lettuce spinach, cauliflower, were grouped into cabbages. “Other vegetables” from the FAO balance sheets were distributed evenly into these five items;
- Fruits, which consist of oranges and mandarins, citrus fruits (lemons, limes, and their products), banana and plantains, apples, pineapples, dates, grapes, and their corresponding products. “Other fruits” from the FAO balance sheets were distributed evenly into these seven items
- Coffee and tea, which consists of coffee, tea, and their corresponding products. Cocoa is grouped into coffee, due to lack of inventory data;
- Meat, which consists of bovine, mutton and goat, pig, and poultry meat. Offals and meat from horse, ass, mule, camel, snail, rabbit, and other rodents are aggregated into bovine meat
- Fish and seafood, where fish, crustaceans, cephalopods, Mollusca, and other aquatic plants and animals are aggregated together;
- Animal products, which consists of butter and ghee, cream, raw animal fats (including fish body oil, and fish liver oil), eggs, and milk;
- Sugar and confectionary, which consists of sugarcane and sugar. Sugar (non-centrifugal), sugar (raw equivalent), sugar from sugarcane, sweeteners, and honey are aggregated into sugar;
- Alcoholic beverages, which consists of wine and beer. Other fermented alcoholic drinks are aggregated into beer.
3. Results and Discussion
3.1. Food Consumption Patterns
3.2. Environmental Impacts of Asian Food Consumption Patterns
3.3. Environmental Impacts of Food Consumption and Calorie Intake Analysis
3.4. Environmental Impacts of Food Consumption under Different Modeling Choices
3.5. Policy Recommendations toward Sustainable Food Consumption in Asia
4. Conclusions
Supplementary Materials
Author Contributions
Funding
Acknowledgments
Conflicts of Interest
References
- Akenji, L.; Bengtsson, M. Making Sustainable Consumption and Production the Core of Sustainable Development Goals. Sustainability 2014, 6, 513–529. [Google Scholar] [CrossRef]
- Edenhofer, O. Climate Change 2014: Mitigation of Climate Change; Cambridge University Press: Cambridge, UK, 2015; Volume 3, ISBN 110705821X. [Google Scholar]
- Steinfeld, H.; Gerber, P.; Wassenaar, T.D.; Castel, V.; Rosales, M.; Rosales, M.; de Haan, C. Livestock’s Long Shadow: Environmental Issues and Options; Food & Agriculture Organization: Rome, Italy, 2006; ISBN 9251055718. [Google Scholar]
- Tilman, D.; Clark, M. Global diets link environmental sustainability and human health. Nature 2014, 515, 518–522. [Google Scholar] [CrossRef] [PubMed]
- Baroni, L.; Cenci, L.; Tettamanti, M.; Berati, M. Evaluating the environmental impact of various dietary patterns combined with different food production systems. Eur. J. Clin. Nutr. 2007, 61, 279–286. [Google Scholar] [CrossRef] [PubMed]
- Galli, A.; Iha, K.; Halle, M.; El Bilali, H.; Grunewald, N.; Eaton, D.; Capone, R.; Debs, P.; Bottalico, F. Mediterranean countries’ food consumption and sourcing patterns: An Ecological Footprint viewpoint. Sci. Total Environ. 2017, 578, 383–391. [Google Scholar] [CrossRef] [PubMed]
- Heller, M.C.; Keoleian, G.A.; Willett, W.C. Toward a Life Cycle-Based, Diet-level Framework for Food Environmental Impact and Nutritional Quality Assessment: A Critical Review. Environ. Sci. Technol. 2013, 47, 12632–12647. [Google Scholar] [CrossRef] [PubMed]
- Notarnicola, B.; Tassielli, G.; Renzulli, P.A.; Castellani, V.; Sala, S. Environmental impacts of food consumption in Europe. J. Clean. Prod. 2017, 140, 753–765. [Google Scholar] [CrossRef]
- Sáez-Almendros, S.; Obrador, B.; Bach-Faig, A.; Serra-Majem, L. Environmental footprints of Mediterranean versus Western dietary patterns: Beyond the health benefits of the Mediterranean diet. Environ. Health 2013, 12, 118. [Google Scholar] [CrossRef] [PubMed]
- Tukker, A.; Goldbohm, R.A.; De Koning, A.; Verheijden, M.; Kleijn, R.; Wolf, O.; Pérez-Domínguez, I.; Rueda-Cantuche, J.M. Environmental impacts of changes to healthier diets in Europe. Ecol. Econ. 2011, 70, 1776–1788. [Google Scholar] [CrossRef]
- ISO Environmental Management—Life Cycle Assessment—Principles and Framework; ISO 14040; ISO: Geneva, Switzerland, 2006.
- ISO Environmental Management—Life Cycle Assessment—Requirements and Guidelines; ISO 14044; ISO: Geneva, Switzerland, 2006.
- The World Bank. Population, Total. Available online: https://data.worldbank.org/indicator/SP.POP.TOTL (accessed on 12 October 2019).
- The World Bank. Surface Area (sq. km). Available online: https://data.worldbank.org/indicator/AG.SRF.TOTL.K2 (accessed on 12 October 2019).
- The World Bank. Urban Population. Available online: https://data.worldbank.org/indicator/SP.URB.TOTL (accessed on 12 October 2019).
- The World Bank. Population Density (People per sq. km of Land Area). Available online: https://data.worldbank.org/indicator/EN.POP.DNST (accessed on 12 October 2019).
- The World Bank. GDP (Current US$). Available online: https://data.worldbank.org/indicator/NY.GDP.MKTP.CD (accessed on 12 October 2019).
- The World Bank. GDP per Capita (Current US$). Available online: https://data.worldbank.org/indicator/NY.GDP.PCAP.CD (accessed on 12 October 2019).
- FAOSTAT (Food and Agriculture Organization of the United Nations, Statistics Division). Forestry Production and Trade. Available online: http://www.fao.org/faostat/en/#data/FO (accessed on 4 April 2019).
- Durlinger, B.; Koukouna, E.; Broekema, R.; Passen, M.; Scholten, J. Agri-Footprint 4.0. Part 1: Methodology and Basic Principles; Blonk Consultants: Gouda, The Netherlands, 2017. [Google Scholar]
- Moreno Ruiz, E. Documentation of Changes Implemented in Ecoinvent Database v3.3; Ecoinvent: Zurich, Switzerland, 2016. [Google Scholar]
- Muñoz, I.; Milà I Canals, L.; Fernández-Alba, A.R. Life cycle assessment of the average Spanish diet including human excretion. Int. J. Life Cycle Assess. 2010, 15, 794–805. [Google Scholar] [CrossRef]
- Sonnemann, G.; Vigon, B.; Rack, M.; Valdivia, S. Global guidance principles for life cycle assessment databases: Development of training material and other implementation activities on the publication. Int. J. Life Cycle Assess. 2013, 18, 1169–1172. [Google Scholar] [CrossRef]
- Huijbregts, M.A.J.; Steinmann, Z.J.N.; Elshout, P.M.F.; Stam, G.; Verones, F.; Vieira, M.; Zijp, M.; Hollander, A.; van Zelm, R. ReCiPe2016: A harmonised life cycle impact assessment method at midpoint and endpoint level. Int. J. Life Cycle Assess. 2017, 22, 138–147. [Google Scholar] [CrossRef]
- Li, Y.C.; Jiang, B.; Zhang, M.; Huang, Z.J.; Deng, Q.; Zhou, M.G.; Zhao, Z.P.; Wang, Y.F.; Wang, L.M. Vegetable and Fruit Consumption among Chinese Adults and Associated Factors: A Nationally Representative Study of 170,847 Adults. Biomed. Environ. Sci. 2017, 30, 863–874. [Google Scholar] [PubMed]
- Energy and Protein Requirements: Report of a Joint FAO/WHO/UNU Expert Consultation [Held in Rome from 5 to 17 October 1981]; WHO: Geneva, Switzerland, 1985.
- Wang, S.-S.; Lay, S.; Yu, H.-N.; Shen, S.-R. Dietary Guidelines for Chinese Residents (2016): Comments and comparisons. J. Zhejiang Univ. Sci. B 2016, 17, 649–656. [Google Scholar] [CrossRef]
- Lei, L.; Shimokawa, S. Promoting dietary guidelines and environmental sustainability in China. China Econ. Rev. 2017. [Google Scholar] [CrossRef]
- Choi, M.Y.; Didham, R.J. Pathways for Promoting Sustainable Consumption: How governments can initiate effective Education for Sustainable Consumption. In Sustainable Production and Consumption in the Asia-Pacific Region; Institute for Global Environmental Strategies (IGES): Kanagawa, Japan, 2010; pp. 47–68. ISBN 978-4-88788-058-0. [Google Scholar]
- Huang, J.; Yang, G. Understanding recent challenges and new food policy in China. Glob. Food Secur. 2017, 12, 119–126. [Google Scholar] [CrossRef]
- Kasem, S.; Thapa, G.B. Sustainable Development Policies and Achievements in the Context of the Agriculture Sector in Thailand. Sustain. Dev. 2012, 114, 98–114. [Google Scholar] [CrossRef]


| No. | Parameters | Countries | ||||
|---|---|---|---|---|---|---|
| Thailand | India | China | Japan | Saudi Arabia | ||
| 1 | Population (thousands) | 68,143 | 1,279,000 | 1,357,000 | 127,445 | 29,944 |
| 2 | Surface area (sq. km) | 513,120 | 3,287,260 | 9,562,950 | 377,962 | 2,149,690 |
| 3 | Urbanized population (% of total) | 47.94% | 32% | 53.17% | 92.49% | 82.72% |
| 4 | Population density (people per sq. km) | 133.38 | 430.03 | 144.58 | 349.59 | 13.93 |
| 5 | GDP (billion US$) | 420.53 | 1,857 | 9,607 | 5,156 | 746.65 |
| 6 | GDP per capita (US$) | 15,293 | 5,251 | 12,368 | 38,974 | 51,265 |
| No. | Food Group | Per Capita Consumption (kg/Capita-Year) | ||||
|---|---|---|---|---|---|---|
| Thailand | India | China | Japan | Saudi Arabia | ||
| 1 | Cereals | 136 | 148 | 150 | 115 | 154 |
| 2 | Root Vegetables | 23 | 31 | 68 | 31 | 24 |
| 3 | Legumes, nuts, and oilseeds | 17 | 24 | 12 | 12 | 11 |
| 4 | Oils | 8 | 9 | 7 | 15 | 20 |
| 5 | Vegetables | 52 | 89 | 348 | 102 | 105 |
| 6 | Fruits | 103 | 56 | 94 | 53 | 92 |
| 7 | Coffee and tea | 2 | 1 | 1 | 6 | 6 |
| 8 | Meat | 30 | 4 | 65 | 52 | 68 |
| 9 | Fish and seafood | 26 | 5 | 45 | 50 | 13 |
| 10 | Animal products | 42 | 90 | 54 | 93 | 94 |
| 11 | Sugar and confectionery | 101 | 33 | 7 | 27 | 32 |
| 12 | Alcoholic beverages | 41 | 2 | 45 | 47 | 0 |
| TOTAL | 581 | 492 | 896 | 603 | 618 | |
| Total calorie intake (kcal/capita-day) | 2785 | 2454 | 3112 | 2747 | 3255 | |
| Scenarios | Description |
|---|---|
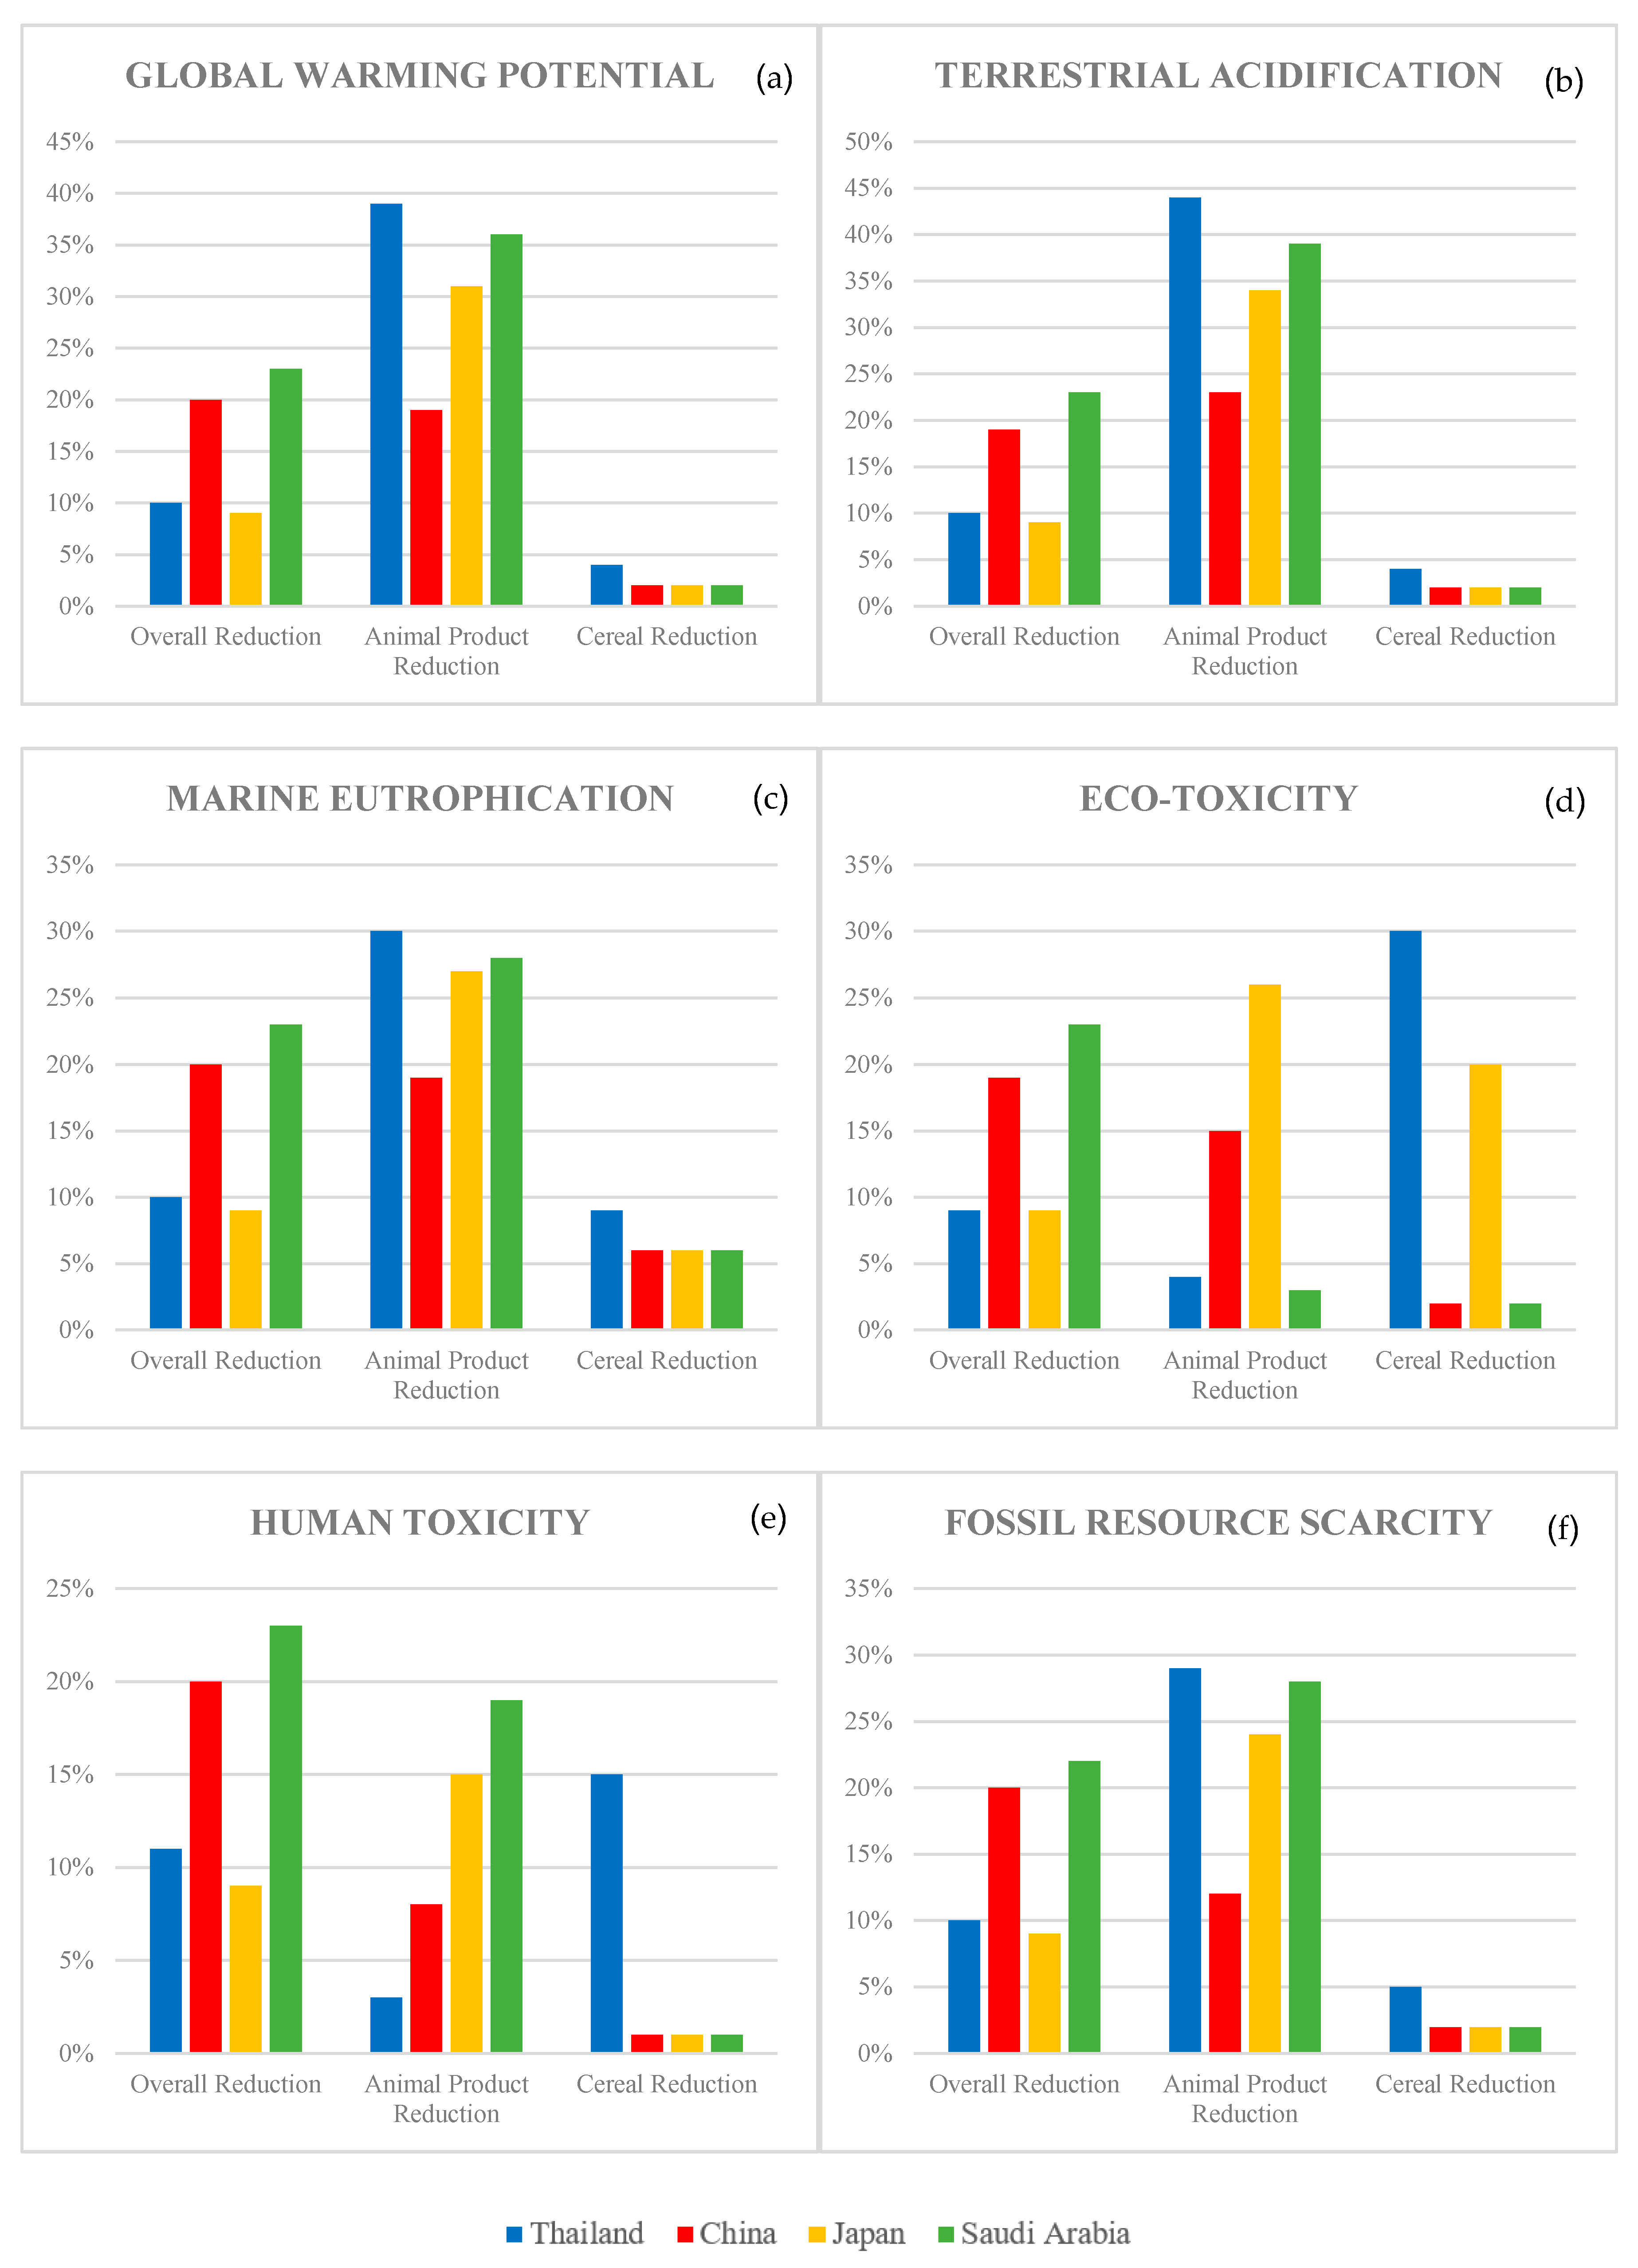
| TH1_Overall reduction | This scenario adjusts the total calorie intake of the food consumption pattern in Thailand (TH) from 2785 to 2500 kcal/capita/day by reducing overall consumption of each food group by 10%. |
| TH2_ Animal product reduction | This scenario adjusts the total calorie intake of the food consumption pattern in Thailand from 2785 to 2500 kcal/capita/day by reducing meat and animal product consumption by 80%. |
| TH3_Cereal reduction | This scenario adjusts the total calorie intake of the food consumption pattern in Thailand from 2785 to 2500 kcal/capita/day by reducing cereal consumption by 22%. |
| CN1_Overall reduction | This scenario adjusts the total calorie intake of the food consumption pattern in China (CN) from 3112 to 2500 kcal/capita/day by reducing overall consumption of each food group by 20%. |
| CN2_ Animal product reduction | This scenario adjusts the total calorie intake of the food consumption pattern in China from 3112 to 2500 kcal/capita/day by reducing meat and animal product consumption by 40%. |
| CN3_Cereal reduction | This scenario adjusts the total calorie intake of the food consumption pattern in China from 3112 to 2500 kcal/capita/day by reducing cereal consumption by 17%. |
| JP1_Overall reduction | This scenario adjusts the total calorie intake of the food consumption pattern in Japan (JP) from 2747 to 2500 kcal/capita/day by reducing overall consumption of each food group by 9%. |
| JP2_Animal product reduction | This scenario adjusts the total calorie intake of the food consumption pattern in Japan from 2747 to 2500 kcal/capita/day by reducing meat and animal consumption by 52%. |
| JP3_Cereal reduction | This scenario adjusts the total calorie intake of the food consumption pattern in Japan from 2747 to 2500 kcal/capita/day by reducing cereal consumption by 25%. |
| SA1_Overall reduction | This scenario adjusts the total calorie intake of the food consumption pattern in Saudi Arabia (SA) from 3255 to 2500 kcal/capita/day by reducing overall consumption of each food group by 23%. |
| SA2_Animal product reduction | This scenario adjusts the total calorie intake of the food consumption pattern in Saudi Arabia from 3255 to 2500 kcal/capita/day by reducing meat and animal consumption by 55%. |
| SA3_Cereal reduction | This scenario adjusts the total calorie intake of the food consumption pattern in Saudi Arabia from 3255 to 2500 kcal/capita/day by reducing cereal consumption by 20%. |
| Attributional Life Cycle Assessment (ALCA) | ||||||
| Impact Category | Unit | Thailand | India | China | Japan | Saudi Arabia |
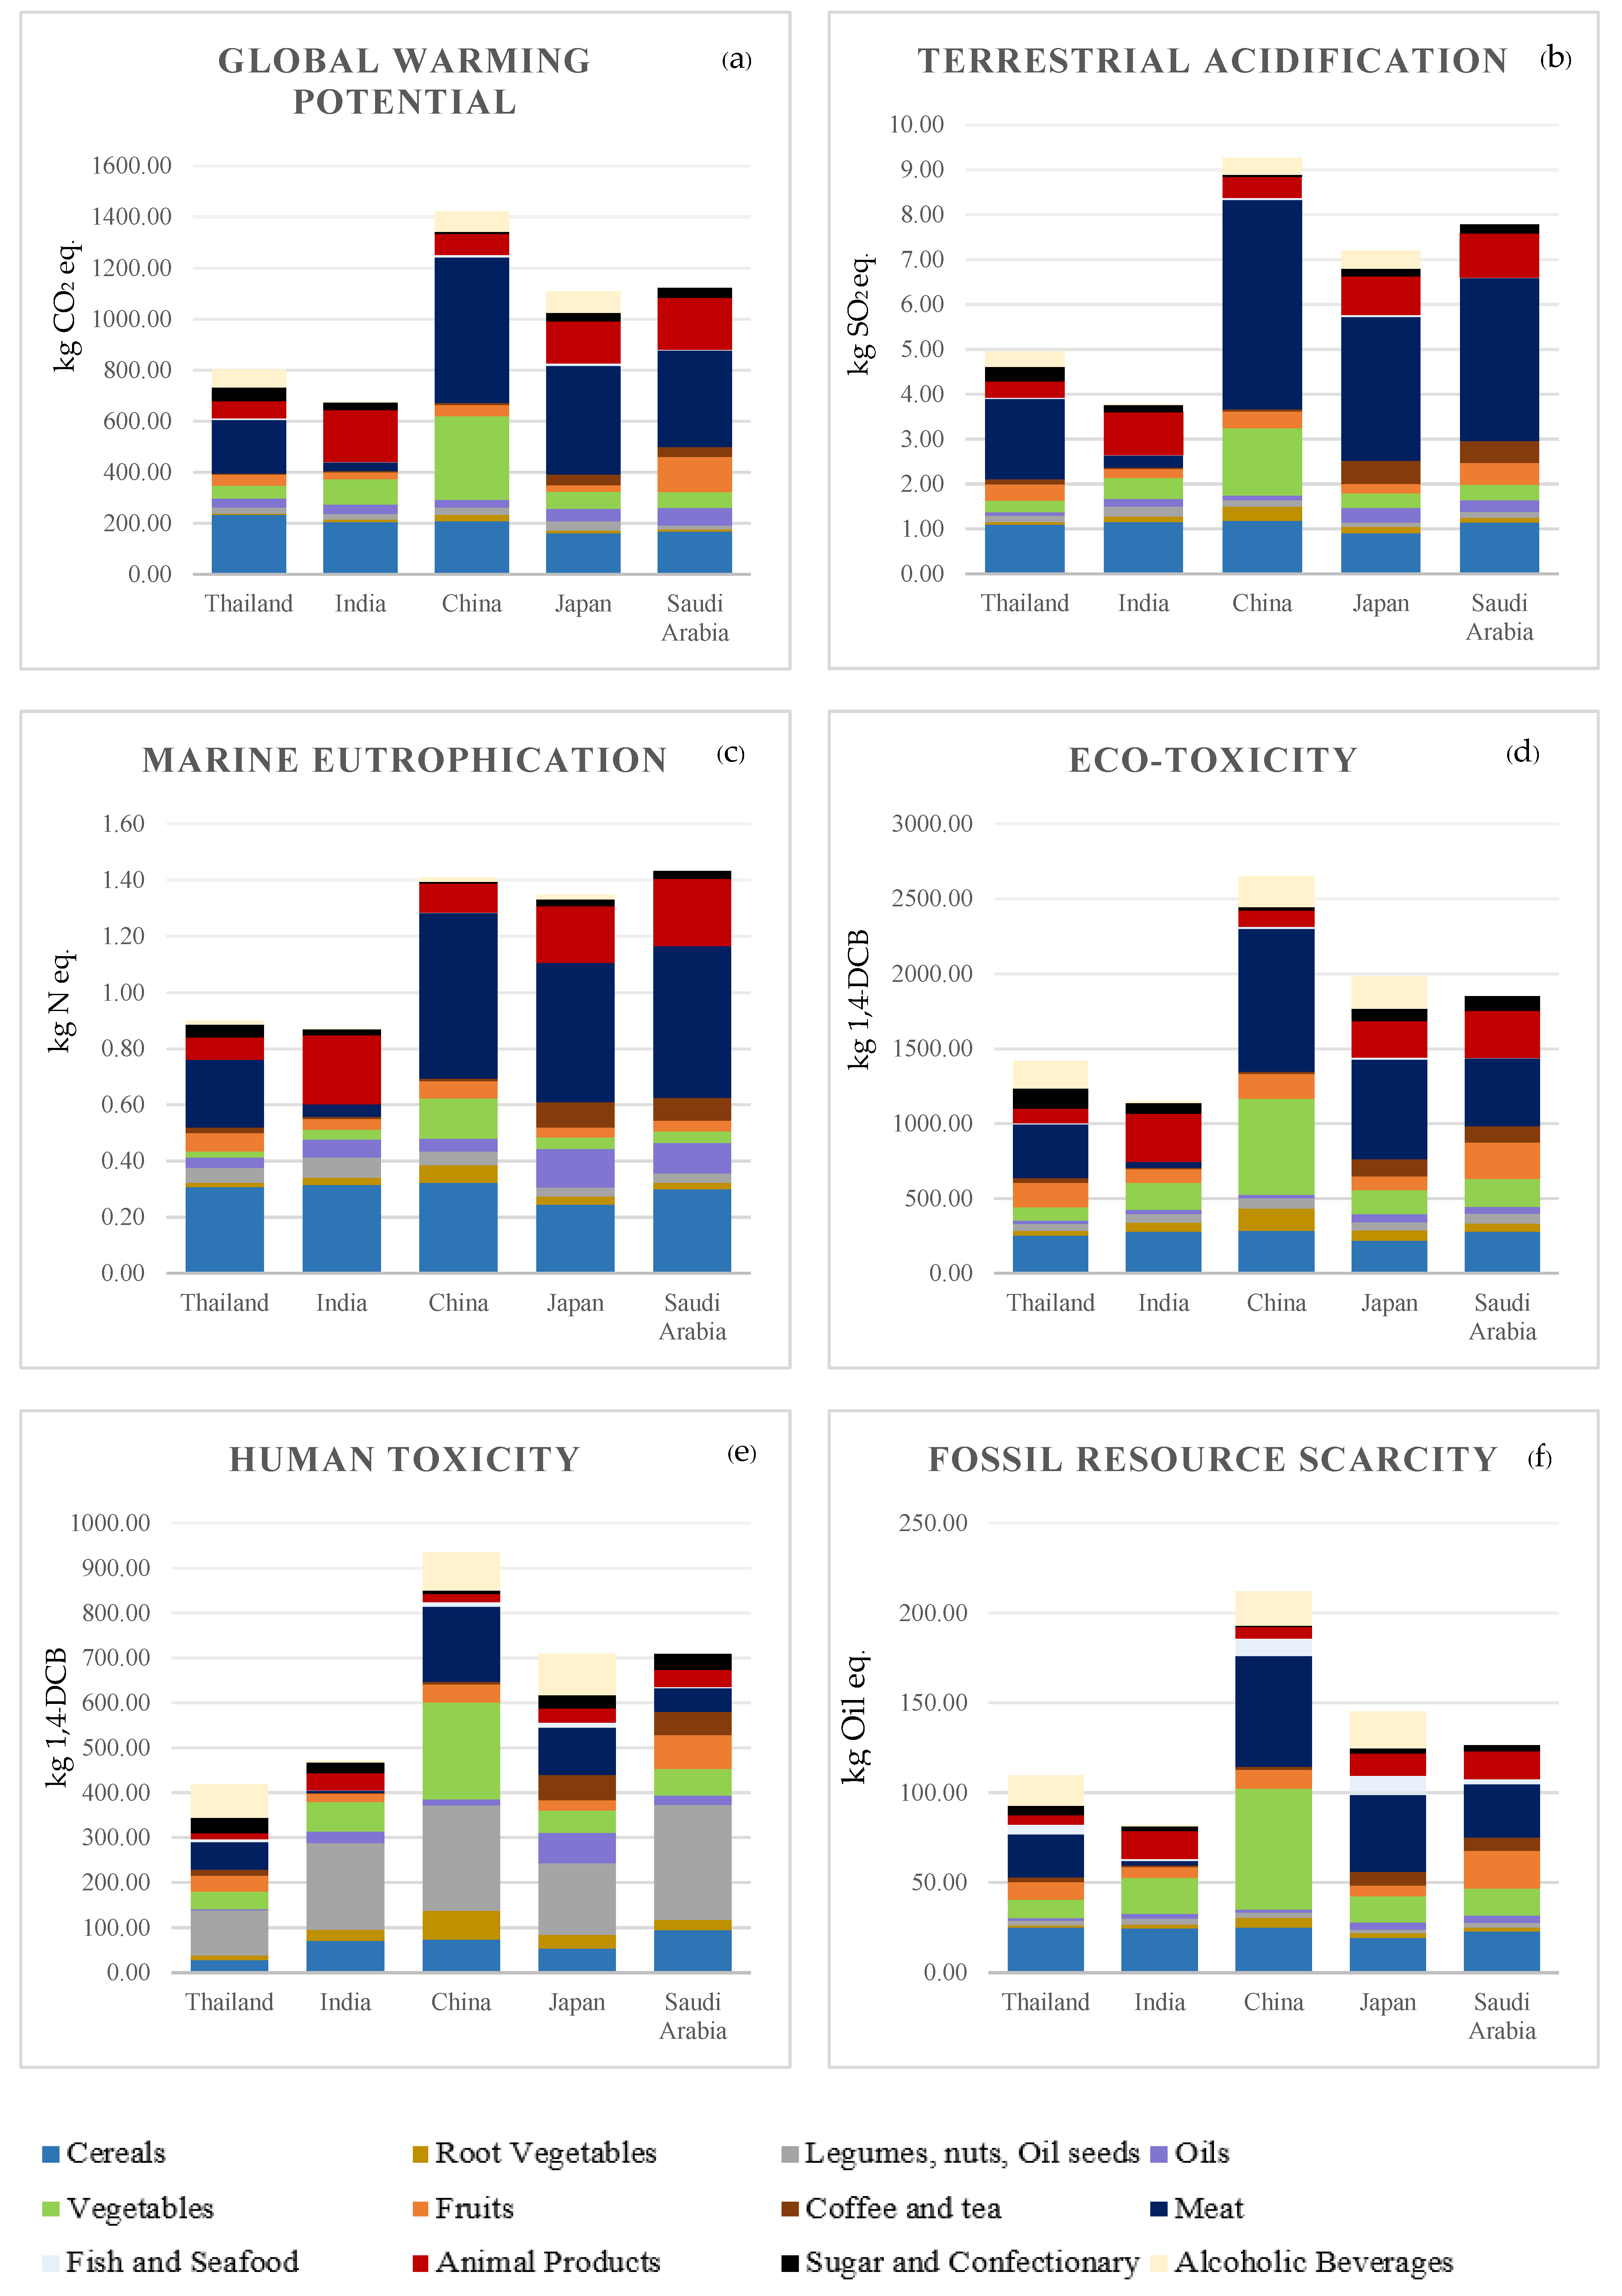
| Global warming | kg CO2 eq | 811.44 | 675.96 | 1420.55 | 1109.13 | 1122.47 |
| Terrestrial acidification | kg SO2 eq | 4.96 | 3.79 | 9.27 | 7.21 | 7.78 |
| Marine eutrophication | kg N eq | 0.91 | 0.87 | 1.41 | 1.35 | 1.44 |
| Eco-toxicity | kg 1,4-DCB | 1417.67 | 1147.77 | 2651.19 | 1987.24 | 1850.08 |
| Human toxicity | kg 1,4-DCB | 419.20 | 471.71 | 935.56 | 708.82 | 709.11 |
| Fossil resource scarcity | kg oil eq | 109.78 | 82.07 | 212.14 | 145.22 | 126.52 |
| Consequential Life Cycle Assessment (CLCA) | ||||||
| Impact Category | Unit | Thailand | India | China | Japan | Saudi Arabia |
| Global warming | kg CO2 eq | 685.14 | 552.60 | 1032.11 | 884.10 | 814.53 |
| Terrestrial acidification | kg SO2 eq | 3.72 | 3.40 | 5.89 | 5.58 | 5.24 |
| Marine eutrophication | kg N eq | 0.89 | 0.98 | 1.23 | 1.23 | 1.38 |
| Eco-toxicity | kg 1,4-DCB | 1690.26 | 1373.50 | 2928.53 | 2221.32 | 1908.94 |
| Human toxicity | kg 1,4-DCB | 145.46 | 442.45 | 622.33 | 500.53 | 696.92 |
| Fossil resource scarcity | kg oil eq | 93.01 | 56.85 | 170.15 | 130.74 | 92.90 |
© 2019 by the authors. Licensee MDPI, Basel, Switzerland. This article is an open access article distributed under the terms and conditions of the Creative Commons Attribution (CC BY) license (http://creativecommons.org/licenses/by/4.0/).
Share and Cite
Adhikari, B.; Prapaspongsa, T. Environmental Sustainability of Food Consumption in Asia. Sustainability 2019, 11, 5749. https://doi.org/10.3390/su11205749
Adhikari B, Prapaspongsa T. Environmental Sustainability of Food Consumption in Asia. Sustainability. 2019; 11(20):5749. https://doi.org/10.3390/su11205749
Chicago/Turabian StyleAdhikari, Biraj, and Trakarn Prapaspongsa. 2019. "Environmental Sustainability of Food Consumption in Asia" Sustainability 11, no. 20: 5749. https://doi.org/10.3390/su11205749
APA StyleAdhikari, B., & Prapaspongsa, T. (2019). Environmental Sustainability of Food Consumption in Asia. Sustainability, 11(20), 5749. https://doi.org/10.3390/su11205749


