Abstract
The European Union (EU) ensures the conservation of biodiversity through the Natura 2000 Network, which establishes the classification and selection of protected areas at European level. Unfortunately, member countries cannot make the best zoning decisions for biodiversity conservation because there are no clear and uniform parameters to designate Natura 2000 sites. Due to this, it is convenient to evaluate the importance of the criteria for biodiversity conservation through a general assessment, which could establish relevant criteria that can be analysed through geostatistical methods combined in multicriteria analysis. This paper aims to consider biodiversity importance values taking into account land use, so that it is possible to develop a zoning proposal which verifies or corrects the suitability of the designated areas for the Natura 2000 Network in Castilla y León, Andalucía and Madrid (Spain). The choice of these regions allows us to compare areas with a high variability of population density, making possible to compare the potential protected areas with respect to the population living in each area. This assessment has been performed using basic and easily adaptable criteria of biodiversity conservation, so it could be applied in other European territories. In this way, clear and uniform parameters for zoning will be used, being possible to detect the best protected areas. One of the most important purposes of the Natura 2000 Network is to increase connectivity between territories; our work proposes new areas that could be linked to currently protected territories, to favour the achievement of this purpose of the Natura 2000 Network.
1. Introduction
Protected areas are essential for biodiversity conservation [1], as a consequence several initiatives and agreements at national, European and international level have emerged to combat the loss of biodiversity recorded since the mid-twentieth century [2]. In the context of European integration, joint systems are becoming increasingly important in both social and ecological sense [3]. One of these initiatives at European level is the Natura 2000 Network, which is the largest conservation effort in Europe, created with the approval of the Habitats Directive [4,5], which also planned the incorporation to this network of some designated spaces under the Directive 79/409/EEC on the conservation of wild birds (currently Directive 2009/147/EEC) [5]. Systematic conservation planning provides a structured, target-driven approach to ensure the long-term maintenance of biodiversity [6]. In order to achieve successful conservation strategies protected areas should be associated with local communities [7].
Ecological networks are based on landscape ecological principles and consist of core areas, corridor zones, buffer zones and, if needed, nature rehabilitation areas for the reestablishment of nature [8]. The Natura 2000 Network is based on the designation of a “coherent ecological network” of protected areas [9] under the basis of biological criteria, choosing on one hand places that contribute significantly to the maintenance of habitats and species of Community interest, and on the other hand more suitable spaces for the maintenance and recovery of all wild bird species depending on their needs for food or breeding areas.
Conflicts between the conservation of biodiversity and other human activities have been and continue to be of increasing concern in the European Union, often having important political, economic and environmental repercussions [10]. The Natura 2000 Network is the main instrument for nature conservation in the European Union, as it guarantees in the long term the survival of the most threatened species and habitats in Europe and halts the loss of biodiversity caused by the adverse impact of human activities [11].
Relatively homogeneous territories (named as biogeographic regions) compose the base to the designation of Sites of Community Interest (SCIs) within the scope of the Habitats Directive and Special Protection Areas for Birds (SPAs) of the Birds Directive (Figure 1). These biogeographic regions are intended to facilitate the identification process of places and the evaluation of proposals submitted by Member States by the European Commission [12].
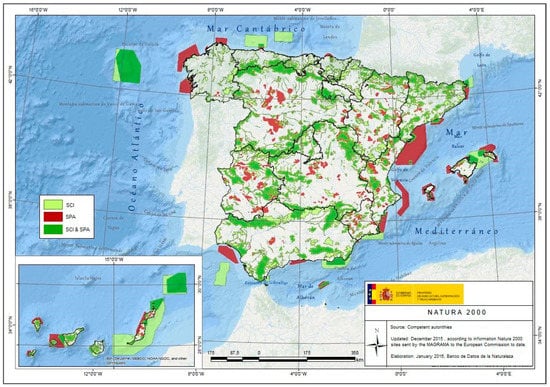
Figure 1.
Sites of Community Interest (SCIs) and Special Protection Areas for Birds (SPAs) in Spain. Source: Ministry of Environment. Spain (2018).
The proper location of spaces to be protected is essential to achieve the conservation objectives suggested by the Natura 2000 Network. Regional conservation strategies go through the establishment of natural reserves [13,14,15]. The loss of biodiversity is combated with the establishment of biological reserves in habitats [16,17]. Unfortunately, there are no clear and homogeneous criteria at European, national and regional level to guide the selection of these spaces.
At the international and national levels, some optimisation methods have been implemented. These initiatives try to select protected areas, which identify sets of natural reserves that maximize the representation of diversity [18,19,20,21,22]. Due to the importance of protected sites, determining their effectiveness in representing and maintaining biodiversity is a core issue in conservation biology [23]. An applied study has been developed in Crete (Greece) that examines the effectiveness of designated sites within the Natura 2000 Network as Special Conservation Areas (SACs) at the regional level, in terms of representativeness of plant biodiversity [24,25]. These studies have shown that the satisfactory representation of the biodiversity of the regional flora is not guaranteed by the presence of SACs included in the Natura 2000 Network, due to the lack of well-defined criteria in the process of designation of protected sites.
Connectivity is considered an essential part of the conservation of biodiversity. As a consequence, many connectivity studies have been developed through the last years. We can highlight the case of systematic evaluation of conservation to improve connectivity [26,27,28,29,30], and the lack of parameters and methods to select natural spaces together with non-explicit legislation which establishes the best way to preserve them. A clear assessment is needed which proposes the necessary measures to implement their protection.
The lack of parameters and methods to select natural spaces together with non-explicit legislation which establishes the best way to preserve natural spaces. It is needed a clear assessment which proposes the necessary measures to implement their protection [31].
Although several methods have been developed to select conservation sites for the protection of bird species, the European Commission has not presented formal criteria for the selection of these areas [32]. The European Court of Justice (ECJ) validated a series of ornithological criteria developed by Birdlife International, and on which the Important Bird Areas (IBA) method is based, which is one of the most worldwide recognised methods [32]. These criteria are globally threatened species, restricted-range species, groups of species linked to a habitat type (biome), concentrations of global importance, concentrations of European importance, species with unfavourable conservation status in Europe, species status favourable conservation more than 50% of the world population in Europe and areas of importance in the European Union for the species and subspecies of Annex I to the Birds Directive. A number of places with a high ornithological value can be obtained by the application of these criteria [33].
Since the main objective of ecological assessment is to provide criteria and information that can be used to identify conservation priorities [34], it is absolutely essential to define concrete criteria for the conservation of biodiversity in order to select protected sites [35]. Therefore, the process of decision-making in the conservation of nature is supported through an optimal selection of spaces to be protected [36,37].
It is necessary to emphasize that the definitions and requirements imposed by the Directive 92/43/EEC for the consideration of a habitat as of Community interest are carried out at European level, so it is understandable that there are discrepancies in the protection of certain habitats.
Due to the commented context, in order to improve management protection and conservation management at European level, it is absolutely necessary to define clear criteria that allow the Member States to optimally select protected areas [38]. The objective of this work is to verify the suitability of the current Natura 2000 sites in the studied regions, providing an optimal zoning proposal through a specific assessment of biodiversity. Finally, the aim is to unify the criteria for the assignment of protected areas in the Natura 2000 Network, creating a clear, uniform and applicable assessment for every country in the European Union.
2. Material and Methods
2.1. Study Area
The study area is focused in the regions of Castilla y León, Madrid and Andalucía, in Spain. Castilla y León has an approximate area of 94,222 km2, being the biggest Spanish region and one of the largest in Europe; Madrid has 8030 km2 and Andalucía has 87,268 km2 (Figure 2). The region of Castilla y León, whose capital is Valladolid, is divided into 9 provinces with an estimated population of 2.5 million people. Madrid has a population of 6.5 million inhabitants and Andalucía 8.4 million divided into 8 provinces. Taking into account this data, we obtain a population density of 26.74 in Castilla y León, 809.11 in Madrid and 96.35 in Andalucía [39]. From this data it can be inferred that there are different population densities on these three regions: one low, another intermediate and the largest one in Spain.
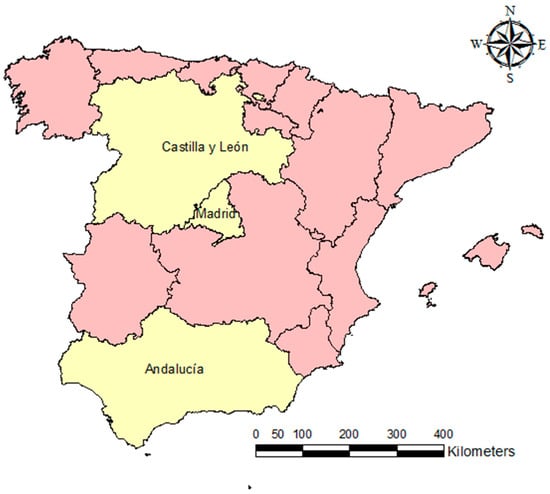
Figure 2.
Study Area: Regions of Castilla y León, Madrid and Andalucía, Spain.
With respect to the Natura 2000 sites of the study area, Castilla y León protects 25% of its surface under Natura 2000 Network, is Madrid ~40% and is Andalucía close to 30%, including maritime zones.
2.2. Methods
Based on the work of Velázquez [40], the goodness for the conservation of biodiversity in different regions has been evaluated. The methodology developed in this research has been adapted in order to be applied to different zones, very variable among them, which allows to assess the suitability of the current Natura 2000 areas in all the territories of the European Union.
As explained in the above section, the selected areas are the two largest regions in Spain, and the region with the largest urbanized territory with respect to its total area; thus, it will allow to be adapted to all types of territories. This general assessment includes the most updated data sources, so the results are closer to reality.
The importance of following this general assessment is that it allows evaluating the current protected areas making possible to incorporate new areas into the Natura 2000 network, the main objective of this study. Thanks to the combination of valuation and application of land uses, new protected sites can be defined quickly and easily.
The proposed assessment is based on three general phases (Figure 3). With this assessment we aim to achieve a proper evaluation of biodiversity within selected regions, allowing appropriate selection of protected sites (determined by certain criteria) which will improve biodiversity conservation by means of those protected sites [40].
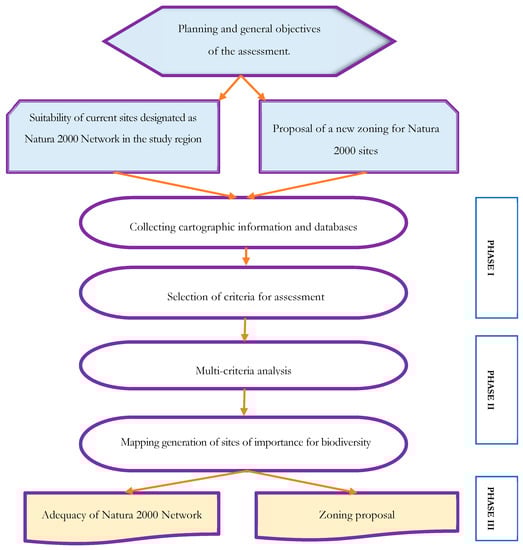
Figure 3.
General assessment for the analysis of the adequacy of the Natura 2000 Network.
Through these criteria we will rate biodiversity, based in a defined scale whose final aim is to provide a qualified selection of protected places to include in Natura 2000 Network. The methodological phases are:
- Phase I: Criteria selection and Information for the assessment.
- Phase II: Analysis and study of areas of importance for biodiversity.
- Phase III: Study of the adequacy of the current Natura 2000 network and new zoning proposal in the study area.
2.2.1. Phase I. Criteria Selection and Information for the Assessment
Protected Habitats listed in the Habitats Directive (Directive 92/43/EEC) [4] has been included for the analysis. The species included in Annex II were also used to analyse endangered species within the study areas. Moreover, sites listed in the Bird Directive (Directive 79/409/EEC) [5] were included in this inventory. Corine Land Cover 2012 [41] and SIOSE Land Cover [42] provided information about the land use (excluding the artificial uses). National Biodiversity Inventory (NBI) was used to include information relating vertebrate species. A 10 × 10 km grid corresponding to the NBI grid has been used to relate all these variables.
The following databases were analysed to implement the proposed assessment, according to Figure 3 and Table 1.

Table 1.
Criteria and indicators for identifying suitable areas in Natura 2000 Network.
- Protected habitats of the Habitats Directive: habitats from the Annex I of Habitats Directive were identified (habitats of community interest and priority habitats of community interest). Criteria 4a and 4b.
- Protected species of the Habitats Directive: protected species under Annex II of this Directive were discussed. Criteria 3b, 3c, 3d, 3e.
- Protected species of the Birds Directive: Directive 79/409/EEC on the conservation of wild birds [5]. The inventory of protected birds registered in Annex I was used. Criterion 3b.
- CORINE Land Cover 2012 (CLC 2012) [41] and SIOSE Land Cover [42] provide information on land use coverage at European and national level. Criterion 5.Land uses in artificial surfaces were excluded: Urban areas, industrial, commercial and transport, areas of mining, landfills and construction and nonagricultural artificial greenery areas, because they do not have a high value for conservation.CLC 2012 and SIOSE data recorded in agricultural areas were used: arable land, permanent crops, pastures and meadows and heterogeneous agricultural areas; forest areas with natural vegetation and open spaces: forests, shrubbery spaces and/or herbaceous, open spaces with little or no vegetation; wetlands: continental wetlands; and water surfaces: inland waters.
- National Biodiversity Inventory (NBI) [43]: All information classified as vertebrate’s wildlife. The vertebrate groups were mammals, reptiles, fish, birds and amphibians; in the national inventory of biodiversity they are related to a grid of 10 km × 10 km, and they constitute very relevant criteria for determining species richness in the study area, determined by the presence of species in the grid. Criteria 1a, 1b, 1c, 1d, 1e and 1f.
- National Catalogue of Endangered Species (NCES) [44]: categories whose members face the threat of extinction: critically endangered (CR), endangered species (EN) and vulnerable species (VU) were considered. Criteria 2a, 2b, 2c, 2d, 2e and 2f.
Selection of Criteria for Assessment
In this phase we try to analyse main criteria to identify the most appropriate location for protection under Natura 2000 network according to its biodiversity value. The selected criteria were defined based on the indicators which allow biodiversity assessment of a site upon the information gathered.
The selected criteria and its description are displayed on Table 1.
2.2.2. Phase II. Analysis and Study of Areas of Importance for Biodiversity
The main objective of the second phase is to analyse and process the information through a multicriteria analysis, and to map the results obtained from it, generating a map of Value of Importance for Biodiversity (VIB).
Multicriteria analysis aims to set a VIB which would work as valid criteria to be considered for decision-making in biodiversity conservation. First, an assessment of each criterion by a group of experts has been carried out, which concludes with the generation of an ordinal scale, grading criteria in descending order (1 to 5) having 1 the lowest in biodiversity importance and 5 the highest. The experts were selected among those responsible for decision-making and academic staff in the selected regions, so they could boost their decision to objectively assess each criterion.
The multicriteria analysis is used through the simple attribute utility theory method, called the Additive Model [45]. With this method, a utility function that represents the preferences of the decision-maker is constructed from utility functions for each attribute by means of Equation (1).
where,
- = weights
- = subjective utilities;
- = actions that are under analysis.
This method is a straightforward system where the functions used can transform performance data of the alternatives concerning the criteria (objective/subjective–qualitative/quantitative) in a common dimensionless scale where the best alternative will be the one with the highest value function. This method intends to obtain a value for each surface’s importance regarding the weighted grids for all the analysed variables.
Every expert has weighted each criterion, in order to generate a Value of Importance for Biodiversity (VIB) according to the selected criteria (Table 1). VIB is developed through a factor based of different importance; therefore, a certain gradation is given to each of them that will highlight some criteria for the final suitability of the set objective.
This assessment seeks to express the preferences of the experts on the set of criteria or attributes in terms of importance for biodiversity. It is a model of preferences aggregation based on individual criteria where global preferences are modelled. Given the weight of each criterion in the assessment, we proceeded to weight each criterion and determine the Value of Importance for Biodiversity (VIB), which is obtained as the sum of the weighted values.
Table 2 shows the weights obtained for each criterion, these weights are the average values of all scores awarded by each expert for each criterion.
Table 2.
Weight obtained for each criterion.
Creating a Map of Importance for Biodiversity
The goal is to generate a map where the locations with the highest VIB values are highlighted. This will be obtained by means of the VIB value obtained by the weighting of the proposed criteria, through the interpolation of the data with the least squared error. This step of the second phase is achieved by assigning centroids to each of the 10 × 10 km grids of the NBI, which contain the values of importance for biodiversity. The centroids are the geometric centres of the figures, and allow us to perform an interpolation that generates new points, which allow us to perform a deeper analysis regarding the distribution of the VIB in the different areas of study. This interpolation will enable the generation of the maps. To do this, three interpolation methods have been compared to study which one best suits our needs better [46].
2.2.3. Phase III: Study of the Adequacy of the Current Natura 2000 Network and New Zoning Proposal in the Study Areas
Within this third phase, the main objective is to verify the suitability of the current Natura 2000 network in the three study regions with respect to the results of the second phase, and to develop strategies to improve the Natura 2000 network, proposing a new zoning based on the combination of VIB and land uses of the territories under study (CORINE and SIOSE Land covers).
Adequacy of the Natura 2000 Network
The analysis of the adequacy of the Natura 2000 network is carried out using the VIB of the study areas. For this, the maps of protected zones and the map of VIB are superimposed, which allows to obtain the VIB mean value of each SCIs and SPAs in Castilla y León, Andalucía and Madrid (Appendix A). This analysis will allow to know the current state of the SCIs and SPAs through the criteria defined in the second phase that originated the VIB, allowing to know the suitability of the current protected zones, in order to be able to present a new proposal of zoning for conservation.
Zoning Proposal
In order to develop the new Natura 2000 zoning, the areas with higher values of VIB are combined with the current land uses (CLC 2012 and SIOSE), erasing the urban-industrial covers, since they are not important for biodiversity conservation.
Quartiles of the VIB are determined, which allows a classification of the distribution of the VIB in each of the land use polygons in the areas of study. In this way, these polygons will be classified following a classification of 4 levels of protection, considering the criteria for the conservation of the biodiversity and the land uses suitable for that conservation.
3. Results and Discussion
3.1. Adaptation of the Natura 2000 Network
By weighting each criterion with the value obtained in Phase I, the value of biodiversity importance (VIB), which is achieved with the sum of the weighted values of all criteria grids was determined; these values are those that analyse the areas of greatest relevance to biodiversity conservation of the study area.
With the VIB obtained in the calculation of weighting of the criteria, a 10 km × 10 km grid of Andalucía, Castilla y León and Madrid regions with the VIB values is generated. In order to develop a clear and homogeneous assessment, we proceed to apply an interpolation method in which data is optimised, and where we obtain a more appropriate model to be adopted. In order to perform the interpolation process, we determined the centroids (points that measure the geometric centre of each grid); they have a VIB value that allows the interpolation method to distribute the values on the map and have a clearer outcome of the areas with the value of importance for biodiversity.
Given the VIB of each grid and having defined the centroids, we proceeded to determine the most appropriate method of interpolation to process values. Therefore, to define the optimal method that would make decisions based on the results, different interpolation models were proposed and a comparative analysis was performed in order to select the model that best fits the objective of this work. Two deterministic methods were used as interpolation models—inverse distance weighting (IDW) and the radial basis function—as well as the geostatistical method Kriging.
The choice of these three interpolators was based on the following considerations.
- The IDW method uses the measured values surrounding the place of prediction, to predict a value for any other unsampled place, based on the assumption that things that are closer are more alike than those that are more separate; therefore, it is considered a suitable method because the values generated are close to reality.
- The method of radial basis function uses five basic functions to process each value of the measured sample, thereby creating an accurate surface interpolation. It is also relevant to this case.
- The Kriging geostatistical method is a method that estimates points by model histograms for data collection. It calculates the weights given to each reference point used in the assessment, and it is based on the premise that the spatial variation continues with the same pattern; thus, being an interpolation method for determining relevant values in different parts of the different areas.
The three methods provide pertinent information to develop a distribution map of values; however, Kriging was the selected method because of its lower value of mean square error compared with the other methods (7.1688). Kriging uses statistical models that allow a variety of output surfaces including predictions, standard errors of prediction, probability and quantiles.
With the defined interpolation method (kriging) a map called Map of value of importance for biodiversity (VIB) was created, which is overlapped with the map of Natura 2000 sites (see Figure 4). This map produces a comparison between the values of importance for biodiversity (generated previously with the multicriteria analysis) and the current allocation of protected Natura 2000 sites. This allows checking the suitability of the spaces according to the criteria defined in this work as relevant, also we can consider this as the first step to initiate a zoning proposal in which places with very high VIB are included and are not currently covered by the Natura 2000 Network.
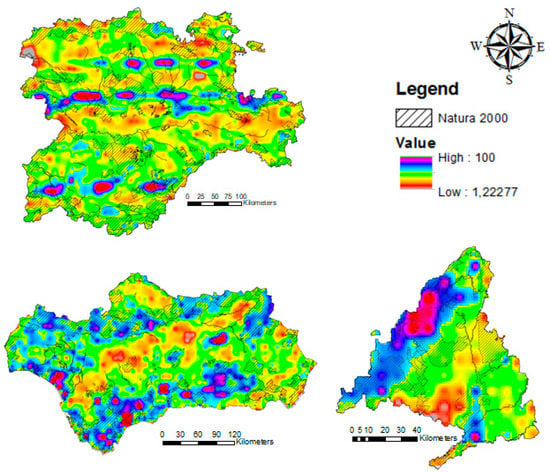
Figure 4.
Map of Importance for Biodiversity (VIB).
3.2. Zoning Proposal
The zoning proposal expects to consider in a special way places with high VIB which are consistent with land use (CLC 2012 and SIOSE), in order to classify areas according to their biodiversity conservation importance, improving management mechanisms.
To develop this zoning proposal, we join the VIB map with database of land use CLC 2012, where the values are grouped into quartiles. In order to classify VIB into groups of importance, quartiles for these values were generated, which are associated with the polygons of the land uses base, and thus consider the importance of each space, which is at the same time consistent with land use, because a zoning proposal cannot be isolated from the territorial distribution of the study area.
After joining the VIB with land uses, we proceed to order the resulting polygons according to the code given in the nomenclature of the CLC 2012 and VIB, obtaining a first classification, grouped by VIB quartiles and land uses. This step allows us to gather information about the areas of the territory and to grant importance for biodiversity based on the most suitable land uses.
Having defined this classification, the degree of importance of each of the polygons is determined by its VIB. This allows us to set levels of protection (Table 3), which are grouped by the type of protection and where the level is determined by the different classifications of land use. By determining levels of protection, we can group zones according to their value, with the aim of making zoning proposals depending on the characteristics of importance for biodiversity in the study area. In addition, it must be said that levels are guidelines for determining various zoning proposals that can be very exclusive or flexible depending on the combination of zones and their respective valuation.
Table 3.
Zoning levels.
Four levels of protection were defined (Table 3), which vary from 0 to 3, with level 0 as the most exclusive, because it determines the spaces with higher VIB (VIB first quartile), and level 3 the most flexible, because it considers more areas as spaces for biodiversity conservation with VIBs in the last quartile. Each of the levels of protection overlaps with the map of Natura 2000 and is presented as zoning proposal (Figure 5, Figure 6 and Figure 7).
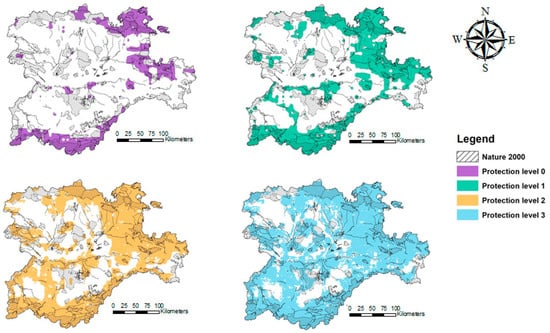
Figure 5.
Map of proposed zoning levels of biodiversity conservation importance for Castilla y León region. Protection level 0 is the highest.
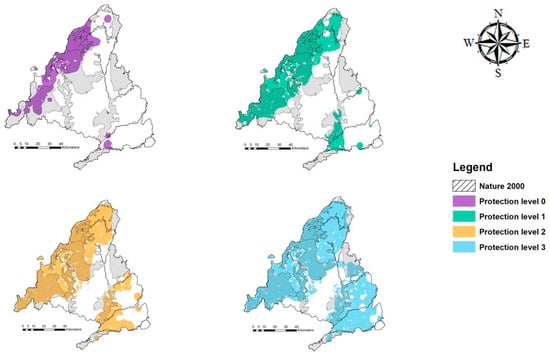
Figure 6.
Map of proposed zoning levels of biodiversity conservation importance for Madrid region. Protection level 0 is the highest.
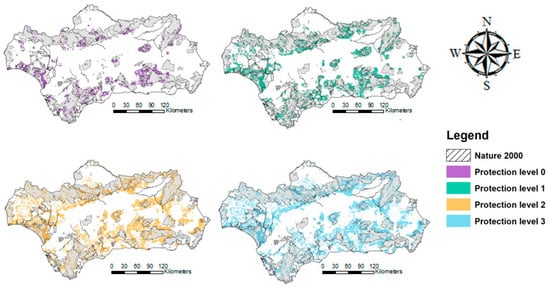
Figure 7.
Map of proposed zoning levels of biodiversity conservation importance for Andalucía region. Protection level 0 is the highest.
On the map, zoning proposals are interpolated by the level of importance. We can see that there are areas of great importance with very high VIB that are not currently listed as protected areas of Natura 2000, as well as some areas that are currently part of Natura 2000 network, not being classified with high VIB in the results obtained with the evaluated criteria in the assessment proposed in this work. However, each of the proposals has been based on biodiversity criteria and allows a clear view of the areas of greatest importance to the different regions in conservation and environmental protection terms, thus enabling developing management plans appropriate for each one of the SCIs, since there are clear and homogeneous classification criteria.
Table 4 and Figure 8 allows us to compare the Natura 2000 Network surface with the zoning proposal surface. According to the data, in Madrid, as well as in Castilla y León, the protected sites that are added are greater than the surface that is currently protected. Most notably, the new protected surface in Castilla y León is twice the current protected surface, so with the zoning proposal, this region would have three times the current protected area. The least significant change is in Andalucía with over 1,600,000 additional hectares.
Table 4.
Current and new protected surface.
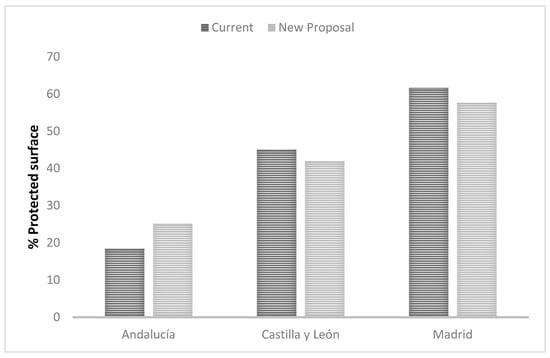
Figure 8.
Current VIB vs. new proposal VIB.
Regarding the VIB index comparison between current and new area (Figure 8), for Castilla y León and Madrid, the new index is lower than the previous; however, in Andalucía the new zoning proposal has 6.8 points more than the Natura 2000 Network surface. Additionally, the lowest values on the index are in Andalucía, and the highest are in Madrid. However, it should be noted that the highest biodiversity index belongs to the areas with highest standard errors (Table 5).
Table 5.
VIB statistics by region.
In order to check this assessment with the current protected areas, the average VIB value was calculated for all the Natura 2000 sites within the study areas. The results are presented in Annex I.
4. Conclusions
The lack of clear guidelines for the selection of protected areas has caused confusion and some errors in determining areas of importance for conservation or places of community interest in member countries of the European Union. However, there are different methodologies from various approaches for establishing optimal criteria of selection. The point of view of this study was the biodiversity conservation, so the results are based on obtaining areas with significantly high value for biodiversity conservation that from homogeneous and coherent criteria and can be analysed and applied in different member countries of the European Union and adopted as a unified assessment for the allocation of protected areas.
Once the multicriteria analysis in the study areas was developed, the suitability of the areas covered by the Natura 2000 Network could be checked. In this sense, we can conclude that the designation of protected areas in the study has a very high approximation to the results on the assessment of biodiversity criteria, therefore there is a zoning close to the optimum, but there are some places of great importance that are not covered and that could be designated as protected areas.
The results obtained in accordance with CLC2012 and SIOSE land cover databases allowed us to develop four zoning proposals considering areas with higher importance value in relation to land use. Some proposals can be adopted according to the level of restriction required or considered as relevant. Also it allows for appropriate management plans and they can be defined as special areas of conservation (SACs).
The proposed assessment is a first step in establishing criteria for zoning and is valuable as a support or justification at the time of decision-making regarding the conservation of biodiversity in specific locations. It is a flexible assessment which can add more criteria that provide a more specific outcome according to the needs of each member country of the European Union, and thus the proposed assessment has a unified method that avoids confusion and mistakes when determining which sites are of community interest and which require special treatment to ensure the conservation of biodiversity and to implement the Habitats and Birds Directives of the European Union.
The importance of the application of this assessment lies in proper land management which contributes to the sustainable development of member countries of the European Union by establishing areas for conservation in order to ensure the natural resources required. Also, it facilitates the compliance with the European politics in the environmental field.
Author Contributions
Conceptualisation: J.V. and A.G.-A.; Methodology: V.R. and J.V.; Software: A.H.; Validation: V.R., J.V., J.G. and B.S.; Formal Analysis: V.R. and J.G.; Investigation: V.R., J.V., J.G. and B.S.; Resources: D.S.-M. and T.S.; Data Curation: V.R. and J.G.; Investigation: V.R., J.V., J.G., A.H. and B.S.; Writing—Original Draft Preparation: V.R., J.V., J.G., A.H. and B.S.; Writing—Review and Editing: V.R., J.V., J.G., A.H. and B.S.; Visualisation: V.R. and J.G.; Supervision: J.V. and A.G.-A.; Project Administration: J.V.
Funding
This research received no external funding.
Conflicts of Interest
The authors declare no conflicts of interest.
Appendix A. SCIs and SPAs VIB Values within Natura 2000 Sites in Andalucía, Castilla y León and Madrid Regions
Table A1.
SCIs of Andalucía and mean VIB values.
Table A1.
SCIs of Andalucía and mean VIB values.
| SITE NAME | MEAN VIB |
|---|---|
| DOÑANA | 28.853 |
| MARISMAS DEL ODIEL | 27.349 |
| COMPLEJO ENDORREICO DE ESPERA | 17.786 |
| LAGUNA DE MEDINA | 23.011 |
| COMPLEJO ENDORREICO DE CHICLANA | 26.403 |
| COMPLEJO ENDORREICO DEL PUERTO DE STA. MARIA | 26.701 |
| COMPLEJO ENDOREICO DE PUERTO REAL | 26.487 |
| SIERRA DE GRAZALEMA | 29.306 |
| TORCAL DE ANTEQUERA | 54.127 |
| LAGUNA DE FUENTE DE PIEDRA | 22.704 |
| LAGUNAS DEL SUR DE CORDOBA | 20.709 |
| SIERRAS DE CAZORLA, SEGURA Y LAS VILLAS | 25.550 |
| SIERRA ALHAMILLA | 16.821 |
| CABO DE GATA-NIJAR | 14.838 |
| DESIERTO DE TABERNAS | 14.312 |
| PUNTA ENTINAS-SABINAR | 12.710 |
| LOS ALCORNOCALES | 27.200 |
| SIERRA DE HORNACHUELOS | 25.659 |
| SIERRA DE ARACENA Y PICOS DE AROCHE | 25.844 |
| SIERRA PELADA Y RIVERA DEL ASERRADOR | 24.798 |
| SIERRA NORTE | 24.505 |
| SIERRA MORENA | 22.736 |
| BAHIA DE CADIZ | 21.246 |
| ESTRECHO | 19.790 |
| SIERRAS DE ALCARAZ Y DE SEGURA Y CAÑONES DEL SEGURA Y DEL MUNDO | 31.226 |
| ALBUFERA DE ADRA | 16.064 |
| KARST EN YESOS DE SORBAS | 20.327 |
| SIERRA MARIA - LOS VELEZ | 21.734 |
| SIERRA DEL OSO | 15.963 |
| SIERRA DE CABRERA-BEDAR | 18.115 |
| RAMBLAS DE GERGAL, TABERNAS Y SUR DE SIERRA ALHAMILLA | 15.821 |
| LA SERRETA DE CABO DE GATA | 16.256 |
| SIERRAS DE GADOR Y ENIX | 15.618 |
| SIERRA DEL ALTO DE ALMAGRO | 20.333 |
| SIERRAS ALMAGRERA, DE LOS PINOS Y EL AGUILON | 14.809 |
| CALARES DE SIERRA DE LOS FILABRES | 21.317 |
| ARTOS DE EL EJIDO | 15.258 |
| COLA DEL EMBALSE DE ARCOS | 31.901 |
| COLA DEL EMBALSE DE BORNOS | 25.845 |
| MARISMAS DEL RIO PALMONES | 29.086 |
| LA BREA Y MARISMAS DEL BARBATE | 26.465 |
| FONDOS MARINOS DE BAHIA DE CADIZ | 19.269 |
| LAGUNA DE LOS TOLLOS | 14.082 |
| SIERRA LIJAR | 24.273 |
| LAGUNA DE LAS CANTERAS Y EL TEJON | 25.702 |
| ACEBUCHALES DE LA CAMPIÑA SUR DE CADIZ | 24.441 |
| PINAR DE ROCHE | 14.885 |
| RIO GUADALETE | 19.629 |
| CUEVA DE LAS MESAS DE ALGAR | 23.763 |
| RIO DE LA JARA | 21.427 |
| CUEVAS DE LA MUJER Y DE LAS COLMENAS | 28.300 |
| SIERRA DE CARDEÑA Y MONTORO | 22.230 |
| SIERRA SUBBETICA | 24.420 |
| SIERRA DE SANTA EUFEMIA | 21.625 |
| RIO GUADALMEZ | 20.195 |
| SUROESTE DE LA SIERRA DE CARDEÑA Y MONTORO | 17.722 |
| GUADALMELLATO | 22.775 |
| GUADIATO-BEMBEZAR | 23.297 |
| TRAMO INFERIOR DEL RIO GUADAJOZ | 15.376 |
| RIO ZUJAR | 17.030 |
| BARRANCOS DEL RIO RETORTILLO | 31.481 |
| RIO GUADALQUIVIR -TRAMO MEDIO | 22.064 |
| SIERRA DE BAZA | 20.468 |
| SIERRA DE CASTRIL | 26.870 |
| SIERRA DE HUETOR | 27.161 |
| SIERRA NEVADA | 26.265 |
| SIERRAS DEL NORDESTE | 23.230 |
| SIERRA DE ARANA | 24.868 |
| SIERRAS DEL CAMPANARIO Y LAS CABRAS | 21.358 |
| SIERRA DE LOJA | 21.402 |
| SIERRA NEVADA NOROESTE | 26.695 |
| SIERRA DE BAZA NORTE | 22.473 |
| SIERRA DE CASTELL DE FERRO | 20.175 |
| LA MALA | 20.045 |
| BARRANCOS DEL RIO DE AGUAS BLANCAS | 30.851 |
| LAGUNA DEL PORTIL | 28.217 |
| ENEBRALES DE PUNTA UMBRIA | 18.295 |
| ESTERO DE DOMINGO RUBIO | 29.182 |
| LAGUNAS DE PALOS Y LAS MADRES | 27.324 |
| MARISMAS DE ISLA CRISTINA | 27.201 |
| MARISMAS DEL RIO PIEDRAS Y FLECHA DEL ROMPIDO | 20.934 |
| PEÑAS DE AROCHE | 24.056 |
| DOÑANA NORTE Y OESTE | 26.329 |
| ANDEVALO OCCIDENTAL | 21.573 |
| DEHESA DEL ESTERO Y MONTES DE MOGUER | 27.216 |
| MARISMAS Y RIBERAS DEL TINTO | 28.958 |
| ISLA DE SAN BRUNO | 28.506 |
| MARISMA DE LAS CARBONERAS | 33.370 |
| RIO GUADIANA Y RIBERA DE CHANZA | 19.700 |
| BAJO GUADALQUIVIR | 23.634 |
| ARROYO DEL ALAMILLO | 24.109 |
| CORREDOR ECOLOGICO DEL RIO TINTO | 21.003 |
| DEHESA DE TORRECUADROS Y ARROYO DE PILAS | 20.938 |
| ESTUARIO DEL RIO PIEDRAS | 23.446 |
| ESTUARIO DEL RIO TINTO | 27.834 |
| LAGUNA HONDA | 17.075 |
| ALTO GUADALQUIVIR | 18.059 |
| CASCADA DE CIMBARRA | 24.817 |
| LAGUNA GRANDE | 14.266 |
| DESPEÑAPERROS | 24.363 |
| SIERRAS DE ANDUJAR | 25.403 |
| SIERRA MAGINA | 38.914 |
| CUENCAS DEL RUMBLAR, GUADALEN Y GUADALMENA | 23.051 |
| ESTRIBACIONES DE SIERRA MAGINA | 30.230 |
| TRAMO INFERIOR DEL RIO GUADALIMAR Y ALTO GUADALQUIVIR | 16.671 |
| RIO GUADIANA MENOR - TRAMO INFERIOR | 19.676 |
| RIO GUADALIMAR | 16.343 |
| RIO GUADIANA MENOR - TRAMO SUPERIOR | 20.919 |
| LAGUNA DE LA RATOSA | 23.571 |
| ACANTILADOS DE MARO-CERRO GORDO | 22.763 |
| DESFILADERO DE LOS GAITANES | 26.938 |
| LOS REALES DE SIERRA BERMEJA | 75.455 |
| SIERRA CRESTELLINA | 34.366 |
| SIERRA DE LAS NIEVES | 30.447 |
| SIERRAS DE TEJEDA, ALMIJARA Y ALHAMA | 27.774 |
| SIERRAS DE ABDALAJIS Y LA ENCANTADA SUR | 25.706 |
| SIERRAS DE ALCAPARAIN Y AGUAS | 27.038 |
| SIERRAS BERMEJA Y REAL | 45.963 |
| SIERRA BLANCA | 24.850 |
| SIERRA DE CAMAROLOS | 39.448 |
| SIERRA DE MOLLINA | 24.146 |
| LAGUNAS DE CAMPILLOS | 21.138 |
| VALLE DEL RIO DEL GENAL | 39.412 |
| RIO VERDE | 27.260 |
| RIO FUENGIROLA | 26.077 |
| YESO III, HIGUERONES IX Y EL MARRUBIO | 24.212 |
| SIERRA BLANQUILLA | 33.263 |
| RIOS GUADALHORCE, FABALAS Y PEREILAS | 26.878 |
| COMPLEJO ENDORREICO DE UTRERA | 14.277 |
| COMPLEJO ENDORREICO LA LANTEJUELA | 14.667 |
| LAGUNA DEL GOSQUE | 17.079 |
| SIERRA DE ALANIS | 22.855 |
| CORREDOR ECOLOGICO DEL RIO GUADIAMAR | 21.533 |
| LAGUNA DE CORIPE | 23.507 |
| ARROYO DE SANTIAGO, SALADO DE MORON Y MATABUEYES/GARRAPATA | 12.602 |
| RIO CORBONES | 18.880 |
| MINAS EL GALAYO Y LA JABATA | 29.421 |
| RIO GUADAIRA | 20.474 |
| MINA EL ABREVADERO | 30.180 |
| VENTA DE LAS NAVAS | 21.297 |
Table A2.
SPAs of Andalucía and mean VIB values.
Table A2.
SPAs of Andalucía and mean VIB values.
| SITE NAME | MEAN VIB |
|---|---|
| DOÑANA | 28.727 |
| MARISMAS DEL ODIEL | 27.478 |
| COMPLEJO ENDORREICO DE ESPERA | 17.761 |
| LAGUNA DE MEDINA | 23.011 |
| COMPLEJO ENDORREICO DE CHICLANA | 26.439 |
| COMPLEJO ENDORREICO DEL PUERTO DE STA. MARIA | 26.701 |
| COMPLEJO ENDOREICO DE PUERTO REAL | 26.242 |
| SIERRA DE GRAZALEMA | 29.310 |
| TORCAL DE ANTEQUERA | 55.905 |
| LAGUNA DE FUENTE DE PIEDRA | 22.799 |
| LAGUNAS DEL SUR DE CORDOBA | 20.995 |
| SIERRAS DE CAZORLA, SEGURA Y LAS VILLAS | 25.407 |
| SIERRA ALHAMILLA | 17.047 |
| CABO DE GATA-NIJAR | 14.958 |
| DESIERTO DE TABERNAS | 14.391 |
| PUNTA ENTINAS-SABINAR | 12.589 |
| LOS ALCORNOCALES | 27.181 |
| SIERRA DE HORNACHUELOS | 25.669 |
| SIERRA DE ARACENA Y PICOS DE AROCHE | 25.858 |
| SIERRA PELADA Y RIVERA DEL ASERRADOR | 24.940 |
| SIERRA NORTE | 24.519 |
| BAHIA DE CADIZ | 21.408 |
| BRAZO DEL ESTE | 16.433 |
| EMBALSE DE CORDOBILLA | 19.994 |
| EMBALSE DE MALPASILLO | 19.517 |
| COMPLEJO ENDORREICO LEBRIJA-LAS CABEZAS | 16.689 |
| PEÑON DE ZAFRAMAGON | 25.215 |
| ESTRECHO | 19.611 |
| ALBUFERA DE ADRA | 16.148 |
| KARST EN YESOS DE SORBAS | 20.364 |
| SIERRA MARIA - LOS VELEZ | 21.713 |
| COLA DEL EMBALSE DE ARCOS | 31.901 |
| COLA DEL EMBALSE DE BORNOS | 25.584 |
| MARISMAS DEL RIO PALMONES | 29.086 |
| LA BREÑA Y MARISMAS DEL BARBATE | 26.333 |
| LAGUNA DE LAS CANTERAS Y EL TEJON | 25.702 |
| SIERRA DE CARDEÑA Y MONTORO | 22.286 |
| SIERRA SUBBETICA | 24.366 |
| ALTO GUADIATO | 16.555 |
| SIERRA DE CASTRIL | 26.740 |
| SIERRA NEVADA | 26.340 |
| ESTERO DE DOMINGO RUBIO | 29.138 |
| MARISMAS DE ISLA CRISTINA | 27.275 |
| MARISMAS DEL RIO PIEDRAS Y FLECHA DEL ROMPIDO | 21.274 |
| PEÑAS DE AROCHE | 24.144 |
| ALTO GUADALQUIVIR | 18.645 |
| CASCADA DE CIMBARRA | 25.065 |
| DESPEÑAPERROS | 24.398 |
| SIERRAS DE ANDUJAR | 25.388 |
| SIERRA MAGINA | 39.405 |
| LAGUNA DE LA RATOSA | 23.571 |
| ACANTILADOS DE MARO-CERRO GORDO | 22.763 |
| DESFILADERO DE LOS GAITANES | 27.073 |
| LOS REALES DE SIERRA BERMEJA | 76.190 |
| SIERRA CRESTELLINA | 35.112 |
| SIERRA DE LAS NIEVES | 30.445 |
| SIERRAS DE TEJEDA, ALMIJARA Y ALHAMA | 27.677 |
| LAGUNAS DE CAMPILLOS | 21.132 |
| COMPLEJO ENDORREICO DE UTRERA | 14.277 |
| LAGUNA DEL GOSQUE | 17.036 |
| CAMPIÑAS DE SEVILLA | 13.457 |
| SIERRAS DE ALCARAZ Y DE SEGURA Y CAÑONES DEL SEGURA Y DEL MUNDO | 24.630 |
| SIERRA MORENA | 22.837 |
Table A3.
SCIs of Castilla y León and mean VIB values.
Table A3.
SCIs of Castilla y León and mean VIB values.
| SITE NAME | MEAN VIB |
|---|---|
| PICOS DE EUROPA | 51.719 |
| HOCES DEL RÍO DURATÓN | 42.199 |
| VALLE DE IRUELAS | 59.480 |
| LAGUNAS DEL CANAL DE CASTILLA | 35.512 |
| ALTO SIL | 31.172 |
| SIERRA DE GREDOS | 67.527 |
| PINAR DE HOYOCASERO | 55.051 |
| SIERRA DE LA PARAMERA Y SERROTA | 43.204 |
| RIBERAS DEL RÍO ALBERCHE Y AFLUENTES | 54.878 |
| CAMPO AZÁLVARO-PINARES DE PEGUERINOS | 55.172 |
| ENCINARES DE LOS RÍOS ADAJA Y VOLTOYA | 38.958 |
| ENCINARES DE LA SIERRA DE ÁVILA | 37.394 |
| CERRO DE GUISANDO | 57.404 |
| PINARES DEL BAJO ALBERCHE | 47.799 |
| VALLE DEL TIETAR | 66.315 |
| OJO GUAREÑA | 58.552 |
| MONTE SANTIAGO | 58.444 |
| MONTES OBARENES | 58.991 |
| BOSQUES DEL VALLE DE MENA | 56.172 |
| RIBERAS DEL ZADORRA | 55.983 |
| RIBERAS DEL AYUDA | 54.202 |
| RIBERAS DEL RÍO EBRO Y AFLUENTES | 56.750 |
| RIBERAS DEL RÍO NELA Y AFLUENTES | 60.450 |
| RIBERAS DEL RÍO RIAZA | 37.959 |
| RIBERAS DEL RÍO ARLANZA Y AFLUENTES | 45.478 |
| RIBERAS DEL RÍO ARLANZÓN Y AFLUENTES | 47.094 |
| RIBERAS DEL RÍO OCA Y AFLUENTES | 48.532 |
| RIBERAS DEL RÍO TIR N Y AFLUENTES | 42.722 |
| MONTES DE VALNERA | 42.648 |
| HOCES DEL ALTO EBRO Y RUDRÓN | 58.835 |
| EMBALSE DEL EBRO - MONTE HIJEDO | 52.793 |
| SABINARES DEL ARLANZA | 51.585 |
| SIERRA DE LA DEMANDA | 47.588 |
| HUMADA-PE A AMAYA | 47.466 |
| SIERRA DE LA TESLA-VALDIVIELSO | 57.326 |
| MONTES DE MIRANDA DE EBRO Y AMEYUGO | 54.154 |
| PICOS DE EUROPA EN CASTILLA Y LEÓN | 48.341 |
| SIERRA DE LOS ANCARES | 41.409 |
| VALLE DE SAN EMILIANO | 31.888 |
| HOCES DE VEGACERVERA | 35.483 |
| SIERRA DE LA ENCINA DE LA LASTRA | 48.711 |
| MONTAÑA CENTRAL DE LEEN | 33.388 |
| RIBERAS DEL RÍO ORBIGO Y AFLUENTES | 33.523 |
| RIBERAS DEL RÍO SIL Y AFLUENTES | 39.595 |
| RIBERAS DEL RÍO ESLA Y AFLUENTES | 35.172 |
| MONTES AQUILANOS Y SIERRA DE TELENO | 31.253 |
| REBOLLARES DEL CEA | 29.699 |
| LAGUNAS DE LOS OTEROS | 34.990 |
| OMAUA | 23.476 |
| LAS TUERCES | 54.277 |
| COVALAGUA | 51.122 |
| MONTES DEL CERRATO | 29.402 |
| RIBERAS DEL RRO CARRIUN Y AFLUENTES | 31.959 |
| RIBERAS DEL RIO PISUERGA Y AFLUENTES | 34.902 |
| MONTES TOROZOS Y PSRAMOS DE TORQUEMADA-ASTUDILLO | 34.786 |
| LAGUNA DE LA NAVA | 36.849 |
| EL REBOLLAR | 53.660 |
| RIBERAS DE LOS RAOS HUEBRA, YELTES, UCES Y AFLUENTES | 35.614 |
| RIBERAS DEL RSO TORMES Y AFLUENTES | 46.816 |
| ARRIBES DEL DUERO | 39.626 |
| CAMPO DE ARGAUEN | 40.845 |
| CAMPO DE AZABA | 44.611 |
| CANDELARIO | 65.973 |
| LAS BATUECAS-SIERRA DE FRANCIA | 54.966 |
| QUILAMAS | 49.242 |
| RIBERAS DEL RSO ALAGDN Y AFLUENTES | 47.765 |
| VALLE DEL CUERPO DE HOMBRE | 53.777 |
| RIBERAS DEL RRO AGUEDA | 40.950 |
| SIERRA DE AYLLON | 40.374 |
| SABINARES DE SOMOSIERRA | 38.663 |
| LAGUNAS DE COCA Y OLMEDO | 43.756 |
| LAGUNAS DE SANTA MARMA LA REAL DE NIEVA | 26.397 |
| RIBERAS DEL RÍO DURATAN | 36.442 |
| HOCES DEL RÍO RIAZA | 53.153 |
| LAGUNAS DE CANTALEJO | 31.265 |
| SIERRA DE GUADARRAMA | 80.347 |
| VALLES DEL VOLTOYA Y EL ZORITA | 37.155 |
| SIERRA DE PRADALES | 33.388 |
| SABINARES SIERRA DE CABREJAS | 48.355 |
| ONCALA-VALTAJEROS | 44.395 |
| CIGUDOSA-SAN FELICES | 45.772 |
| SABINARES DE CIRIA-BOROBIA | 28.759 |
| SABINARES DEL JALAN | 26.114 |
| RIBERAS DEL RÍO DUERO Y AFLUENTES | 44.740 |
| SIERRAS DE URBIÓN Y CEBOLLERA | 51.124 |
| SIERRA DEL MONCAYO | 45.815 |
| PIRAMO DE LAYNA | 35.209 |
| CARAN DEL RÍO LOBOS | 51.341 |
| QUEJIGARES Y ENCINARES DE SIERRA DEL MADERO | 42.114 |
| QUEJIGARES DE GOMARA-NÁJIMA | 25.563 |
| ROBLEDALES DEL BERRAN | 57.170 |
| PINAR DE LOSANA | 38.553 |
| ENCINARES DE TIERMES | 43.763 |
| ENCINARES DE SIERRA DEL COSTANAZO | 26.417 |
| RIBERAS DEL RÍO CIDACOS Y AFLUENTES | 46.760 |
| ALTOS DE BARAHONA | 36.659 |
| RIBERAS DE CASTRONUAO | 45.147 |
| RIBERAS DEL RÍO CEA | 38.718 |
| RIBERAS DEL RÍO O CEGA | 40.628 |
| RIBERAS DEL RÍO ADAJA Y AFLUENTES | 42.067 |
| SALGREROS DE ALDEAMAYOR | 49.404 |
| EL CARRASCAL | 39.167 |
| HUMEDALES DE LOS ARENALES | 30.778 |
| SIERRA DE LA CULEBRA | 38.135 |
| TEJEDELO | 40.655 |
| QUEJIGARES DE LA TIERRA DEL VINO | 39.903 |
| RIBERAS DEL RÍO TERA Y AFLUENTES | 41.110 |
| RIBERAS DEL RÍO ALISTE Y AFLUENTES | 25.189 |
| CABONES DEL DUERO | 33.345 |
| LAGO DE SANABRIA Y ALREDEDORES | 41.550 |
| SIERRA DE LA CABRERA | 35.953 |
| RIBERAS DEL RÍO TUELA Y AFLUENTES | 27.921 |
| RIBERAS DEL RÍO MANZANAS Y AFLUENTES | 28.331 |
| CAMPO ALTO DE ALISTE | 36.376 |
| LAGUNAS DE TERA Y VIDRIALES | 35.412 |
| LAGUNAS Y PASTIZALES SALINOS DE VILLAFAFILA | 36.953 |
Table A4.
SPAs of Castilla y León and mean VIB values.
Table A4.
SPAs of Castilla y León and mean VIB values.
| SITE NAME | MEAN VIB |
|---|---|
| ENCINARES DE LA SIERRA DE ÁVILA | 36.050 |
| CAMPO DE ARGAÑÁN | 43.801 |
| CAMPO DE AZABA | 45.007 |
| SIERRA DE GUADARRAMA | 80.597 |
| ENCINARES DE LOS RÍOS ADAJA Y VOLTOYA | 38.558 |
| CAMPO AZÁLVARO-PINARES DE PEGUERINOS | 55.297 |
| OTEROS-CEA | 42.824 |
| LA NAVA-CAMPOS NORTE | 31.487 |
| PENILLANURAS-CAMPOS SUR | 28.499 |
| PENILLANURAS-CAMPOS NORTE | 33.254 |
| EMBALSE DEL EBRO | 54.427 |
| LAGUNAS DE VILLAFÁFILA | 34.737 |
| CAÑÓN DEL RÍO LOBOS | 51.407 |
| HOCES DEL RÍO DURATÓN | 41.848 |
| CERRO DE GUISANDO | 57.552 |
| PINARES DEL BAJO ALBERCHE | 47.850 |
| MONTES DE MIRANDA DE EBRO Y AMEYUGO | 55.702 |
| ALTOS DE BARAHONA | 36.642 |
| CANDELARIO | 66.748 |
| HOCES DEL RÍO RIAZA | 53.084 |
| FUENTES CARRIONAS Y FUENTE COBRE-MONTA | 46.888 |
| VALLE DEL TIETAR | 66.602 |
| SIERRA DE LOS ANCARES | 41.218 |
| ALTO SIL | 31.154 |
| VALLE DE SAN EMILIANO | 31.745 |
| PICOS DE EUROPA EN CASTILLA Y LEÓN | 48.344 |
| PICOS DE EUROPA | 51.726 |
| LAGUNAS DE CANTALEJO | 31.791 |
| MONTE SANTIAGO | 58.763 |
| SIERRA DEL MONCAYO | 45.052 |
| QUILAMAS | 49.370 |
| SIERRA DE URBIÓN | 50.932 |
| HOCES DEL ALTO EBRO Y RUDRAN | 58.723 |
| ARRIBES DEL DUERO | 39.686 |
| CAMINO DE SANTIAGO | 29.984 |
| RÍO AGUEDA | 39.279 |
| RÍO ALAGÓN | 47.884 |
| LAS BATUECAS-SIERRA DE FRANCIA | 54.990 |
| MONTES OBARENES | 58.781 |
| HUMADA-PEÑA AMAYA | 47.759 |
| SIERRA DE GREDOS | 67.570 |
| VALLE DE IRUELAS | 59.485 |
| SIERRA DE LA CABRERA | 35.524 |
| LAGO DE SANABRIA Y ALREDEDORES | 42.774 |
| MONTES AQUILANOS | 31.861 |
| SABINARES DEL ARLANZA | 51.709 |
| RIBERAS DE CASTRONUÑO | 44.873 |
| SIERRA DE LA DEMANDA | 47.603 |
| SIERRA DE LA TESLA-VALDIVIELSO | 58.157 |
| CAÑONES DEL DUERO | 35.765 |
| TIERRA DE CAMPIRAS | 31.115 |
| VALLES DEL VOLTOYA Y EL ZORITA | 36.295 |
| RIBERAS DEL PISUERGA | 37.323 |
| CIHUELA-DEZA | 28.725 |
| LA NAVA-RUEDA | 34.178 |
| CAMPO DE ALISTE | 35.782 |
| PARAMO LEONES | 34.528 |
| DEHESA DEL RÍO GAMO Y EL MARGAÑÁN | 31.468 |
| OMAGA | 23.501 |
| RIBERAS DE LOS RÍOS HUEBRA Y YELTES | 35.751 |
| CAMPOS DE ALBA | 34.031 |
| VALDEJAMUZ | 31.263 |
| TIERRA DEL PAN | 33.509 |
| LA NAVA-CAMPOS SUR | 33.766 |
| LLANURAS DEL GUARE | 33.613 |
| PÁRAMO DE LAYNA | 34.305 |
| OTEROS-CAMPOS | 33.722 |
| MONTEAGUDO DE LAS VICARBAS | 31.210 |
| ALTOS CAMPOS DE GÓMARA | 29.682 |
Table A5.
SCIs of Madrid and mean VIB values.
Table A5.
SCIs of Madrid and mean VIB values.
| SITE NAME | MEAN VIB |
|---|---|
| SIERRA DE AYLLÓN | 48.797 |
| SIERRA DE GUADARRAMA | 85.276 |
| PINARES DEL BAJO ALBERCHE | 69.649 |
| CERRO DE GUISANDO | 69.536 |
| SIERRA DE SAN VICENTE Y VALLES DEL TIETAR Y ALBERCHE | 63.157 |
| YESARES DEL VALLE DEL TAJO | 47.419 |
| ESTEPAS SALINAS DE TOLEDO | 50.661 |
| CUENCAS DE LOS RÍOS JARAMA Y HENARES | 46.560 |
| CUENCA DEL RÍO LOZOYA Y SIERRA NORTE | 69.607 |
| CUENCA DEL RÍO GUADALIX | 49.473 |
| CUENCA DEL RÍO MANZANARES | 66.803 |
| CUENCA DEL RÍO GUADARRAMA | 61.619 |
| VEGAS, CUESTAS Y PÁRAMOS DEL SURESTE DE MADRID | 52.677 |
| CUENCAS DE LOS RÍOS ALBERCHE Y COFIO | 65.729 |
Table A6.
SPAs of Madrid and mean VIB values.
Table A6.
SPAs of Madrid and mean VIB values.
| SITE NAME | MEAN VIB |
|---|---|
| SIERRA DE AYLLÓN | 48.564 |
| ESTEPAS CEREALISTAS DE LA CAMPIÑA | 45.400 |
| CARRIZALES Y SOTOS DEL JARAMA Y TAJO | 38.819 |
| SIERRA DE GUADARRAMA | 84.149 |
| ALTO LOZOYA | 88.201 |
| ESTEPAS CEREALISTAS DE LOS RÍOS JARAMA Y HENARES | 46.142 |
| CAMPO AZÁLVARO-PINARES DE PEGUERINOS | 72.296 |
| SOTO DE VIÑUELAS | 48.596 |
| PINARES DEL BAJO ALBERCHE | 69.649 |
| MONTE DE EL PARDO | 56.206 |
| ENCINARES DELOS RÍOS ALBERCHE Y COFIO | 65.715 |
| CORTADOS Y CANTILES DE LOS RÍOS JARAMA Y MANZANARES | 55.288 |
| CERRO DE GUISANDO | 70.084 |
| CARRIZALES Y SOTOS DE ARANJUEZ | 46.312 |
References
- Dudley, N. (Ed.) Guidelines for Applying Protected Area Management Categories; UICN: Gland, Zwitzerland, 2008; 86p, ISBN 978-2-8317-1086-0. [Google Scholar]
- Velázquez, J. Propuesta metodológica para la ordenación integral De Montes de la Red Natura 2000; Escuela Técnica Superior de Ingenieros de Montes, Universidad Politécnica de Madrid: Madrid, Spain, 2008. [Google Scholar]
- Jongman, R.H.G.; Külvik, M.; Kristiansen, I. European ecological networks and greenways. Landsc. Urban Plan. 2004, 68, 305–319. [Google Scholar] [CrossRef]
- Council of the European Communities. Council Directive 92/43/EEC of 21 May 1992 on the Conservation of Natural Habitats and of Wild Fauna and Flora; Council of the European Communities: Brussels, Belgium, 1992. [Google Scholar]
- Council of the European Communities. Directive 2009/147/EC of the European Parliament and of the Council of 30 November 2009 on the Conservation of Wild Birds; Council of the European Communities: Brussels, Belgium, 2009. [Google Scholar]
- Gaston, K.J.; Jackson, S.F.; Nagy, A.; Cantú-Salazar, L.; Johnson, M. Protected Areas in Europe. Ann. N. Y. Acad. Sci. 2008, 1134, 97–119. [Google Scholar] [CrossRef] [PubMed]
- Andrade, G.S.M.; Rhodes, J.R. Protected areas and local communities: An inevitable partnership toward successful conservation strategies? Ecol. Soc. 2012, 17, 14. [Google Scholar] [CrossRef]
- Jongman, R.H.G. Nature conservation planning in Europe: Developing ecological networks. Landsc. Urban Plan. 1995, 32, 169–183. [Google Scholar] [CrossRef]
- Bruinderink, G.G.; Van Der Sluis, T.; Lammerstma, D.; Opdam, P.; Pouwels, R. Designing a Coherent Ecological Network for Large Mammals in Northwestern Europe. Conserv. Biol. 2003, 17, 549–557. [Google Scholar] [CrossRef]
- Young, J.; Richards, C.; Fischer, A.; Halada, L.; Kull, T.; Kuzniar, A.; Tartes, U.; Uzunov, Y.; Watt, A. Conflicts between Biodiversity Conservation and Human Activities in the Central and Eastern European Countries. J. Hum. Environ. 2007, 36, 545–550. [Google Scholar] [CrossRef]
- Ministerio de Agricultura y Pesca, Alimentación y Medio Ambiente. La Red Natura 2000 en España. 2018. Available online: http://www.magrama.gob.es/es/biodiversidad/temas/espacios-protegidos/red-natura-2000/rn_espana.aspx (accessed on 16 October 2017).
- Velázquez, J.; Tejera, R.; Hernando, A.; Núñez, M.V. Environmental diagnosis: Integrating biodiversity conservation in management of Natura 2000 forest spaces. J. Nat. Conserv. 2010, 18, 309–317. [Google Scholar] [CrossRef]
- Myers, N.; Mittermeier, R.A.; Mittermeier, C.G.; da Fonseca, G.A.B.; Kent, J. Biodiversity hotspots for conservation priorities. Nature 2000, 403, 853–858. [Google Scholar] [CrossRef]
- Maxted, N.; Ford-Lloyd, B.V.; Hawkes, J.G. Complementary Conservation Strategies. In Plant Genetic Conservation; Springer: Dordrecht, The Netherland, 2000. [Google Scholar]
- Kingsland, S.E. Creating a science of nature reserve design: Perspectives from history. Environ. Model. Assess. 2002, 7, 61–69. [Google Scholar] [CrossRef]
- Costello, C.; Polasky, S. Dynamic reserve site selection. Resour. Energy Econ. 2004, 26, 157–174. [Google Scholar] [CrossRef] [Green Version]
- Żmihorski, M.; Kotowska, D.; Berg, Â.; Pärt, T. Evaluating conservation tools in Polish grasslands: The occurrence of birds in relation to agri-environment schemes and Natura 2000 areas. Biol. Conserv. 2016, 194, 150–157. [Google Scholar] [CrossRef]
- Pressey, R.L.; Possingham, H.P.; Margules, C.R. Optimality in reserve selection algorithms: When does it matter and how much? Biol. Conserv. 1996, 76, 259–267. [Google Scholar] [CrossRef] [Green Version]
- Margules, C.R.; Pressey, R.L. Systematic conservation planning. Nature 2000, 405, 243–253. [Google Scholar] [CrossRef] [PubMed]
- Possingham, H.; Ball, I.; Andelman, S. Mathematical Methods for Identifying Representative Reserve Networks. In Quantitative Methods for Conservation Biology; Springer: New York, NY, USA, 2000. [Google Scholar]
- Cabeza, M.; Moilanen, A. Design of reserve networks and the persistence of biodiversity. Trends Ecol. Evol. 2001, 16, 242–248. [Google Scholar] [CrossRef]
- Gaston, K.J.; Charman, K.; Jackson, S.F.; Armsworth, P.R.; Bonn, A.; Briers, R.A.; Callaghan, C.S.Q.; Catchpole, R.; Hopkins, J.; Kunin, W.E.; et al. The ecological effectiveness of protected areas: The United Kingdom. Biol. Conserv. 2006, 132, 76–87. [Google Scholar] [CrossRef]
- Dimitrakopoulos, P.G.; Memtsas, D.; Troumbis, A.Y. Questioning the effectiveness of the Natura 2000 special areas of conservation strategy: The case of Crete. Glob. Ecol. Biogeogr. 2004, 13, 199–207. [Google Scholar] [CrossRef]
- D’Amen, M.; Bombi, P.; Campanaro, A.; Zapponi, L.; Bologna, M.A.; Mason, F. Protected areas and insect conservation: Questioning the effectiveness of Natura 2000 network for saproxylic beetles in Italy. Anim. Conserv. 2013, 6, 370–378. [Google Scholar] [CrossRef]
- Briers, R.A. Incorporating connectivity into reserve selection procedures. Biol. Conserv. 2002, 103, 77–83. [Google Scholar] [CrossRef]
- Van Teeffelen, A.J.; Cabeza, M.; Moilanen, A. Connectivity, probabilities and persistence: Comparing reserve selection strategies. Biodivers. Conserv. 2006, 15, 899–919. [Google Scholar] [CrossRef]
- Saura, S.; Vogt, P.; Velázquez, J.; Hernando, A.; Tejera, R. Key structural forest connectors can be identified by combining landscape spatial pattern and network analyses. For. Ecol. Manag. 2011, 262, 150–160. [Google Scholar] [CrossRef]
- Opermanis, O.; MacSharry, B.; Aunins, A.; Sipkova, Z. Connectedness and connectivity of the Natura 2000 network of protected areas across country borders in the European Union. Biol. Conserv. 2012, 153, 227–238. [Google Scholar] [CrossRef]
- Velázquez, J.; Gutiérrez, J.; Hernando, A.; García-Abril, A. Evaluating landscape connectivity in fragmented habitats: Cantabrian capercaillie (Tetrao urogallus cantabricus) in northern Spain. For. Ecol. Manag. 2017, 389, 59–67. [Google Scholar] [CrossRef]
- Torrubia, S.; McRae, B.H.; Lawler, J.J.; Hall, S.A.; Halabisky, M.; Langdon, J.; Case, M. Getting the most connectivity per conservation dollar. Front. Ecol. Environ. 2014, 12, 491–497. [Google Scholar] [CrossRef]
- Wills, W.P.J. The Birds Directive 15 years later: A survey of the case law and a comparison with the Habitats Directive. J. Environ. Law 1994, 6. [Google Scholar] [CrossRef]
- SEO BirdLife. Criterios Científicos de Birdlife International; Sociedad Española de Ornitología: Madrid, Spain, 2011; Available online: http://www.seo.org/media/docs/criterios%20IBA.pdf (accessed on 10 May 2016).
- Eken, G.; Bennun, L.; Brooks, T.M.; Darwall, W.; Fishpool, L.D.C.; Foster, M.; Knox, D.; Langhammer, P.; Matiku, P.; Radford, E.; et al. Key Biodiversity Areas as Site Conservation Targets. BioScience 2004, 54, 1110–1118. [Google Scholar] [CrossRef]
- Roberts, C.; Branch, G.; Bustamante, R.H.; Castilla, J.C.; Dugan, J.; Halpern, B.S.; Lafferty, K.D.; Leslie, H.; Lubchenco, J.; McArdle, D.; et al. Application of Ecological Criteria in Selecting Marine Reserves and Developing Reserve Networks. Ecol. Appl. 2003, 3, S215–S228. [Google Scholar] [CrossRef]
- Geneletti, D.; Van Duren, I. Protected area zoning for conservation and use: A combination of spatial multicriteria and multiobjetive evaluation. Landsc. Urban Plan. 2008, 85, 97–100. [Google Scholar] [CrossRef]
- Hernando, A.; Tejera, R.; Velázquez, J.; Núñez, M.V. Quantitatively defining the conservation status of Natura 2000 forest habitats improving management options for enhancing biodiversity. Biodivers. Conserv. 2010, 19, 2221–2233. [Google Scholar] [CrossRef]
- Instituto Nacional de Estadística. 2017. Available online: http://www.ine.es/jaxiBD/tabla.do (accessed on 13 January 2018).
- Förster, M.; Kleinschmit, B. Remote Sensing and GIS-Modelling for the Monitoring of Natura 2000 Habitats; Nature Protection GIS: Dresden, Germany, 2006. [Google Scholar]
- European Environment Agency. CORINE Land Cover; European Environment Agency: København, Denmark, 2012. [Google Scholar]
- Velázquez, J.; Rincón, V.; Gutiérrez, J.; Mayenco, E.; Hernando, A.; Bedoya, A. Methodological proposal for the analysis of the adequacy of European protected spaces: Application to Castilla y León, Spain. Braz. J. For. Res./Pesqui. Florest. Bras. 2017. [Google Scholar] [CrossRef]
- Ministerio de Fomento. Corine Land Cover España; Ministerio de Fomento: Madrid, Spain, 2012.
- Ministerio de Fomento. SIOSE, Sistema de Información sobre Ocupación del Suelo de España; Ministerio de Fomento: Madrid, Spain, 2011.
- Ministerio de Medio Ambiente y Medio Rural y Marino. Inventario Nacional de Biodiversidad; Ministerio de Medio Ambiente y Medio Rural y Marino: Madrid, Spain, 2007.
- Ministerio de Medio Ambiente y Medio Rural y Marino. Real Decreto 139/2011, de 4 de Febrero, para el Desarrollo del Listado de Especies Silvestres en Régimen de Protección Especial y del Catálogo Español de Especies Amenazadas; Ministerio de Medio Ambiente y Medio Rural y Marino: Madrid, Spain, 2011.
- Keeney, R.L.; Raiffa, H. Decisions with Multiple Objectives: Preferences and Value Tradeoffs, 2nd ed.; Cambridge University Press: Cambridge, UK, 1993. [Google Scholar]
- Attorre, F.; Alfo, M.; De Sanctis, M.; Francesconi, F.; Bruno, F. Comparison of interpolation methods for mapping climatic and bioclimatic variables at regional scale. Int. J. Climatol. 2007, 27, 1825–1843. [Google Scholar] [CrossRef] [Green Version]
© 2019 by the authors. Licensee MDPI, Basel, Switzerland. This article is an open access article distributed under the terms and conditions of the Creative Commons Attribution (CC BY) license (http://creativecommons.org/licenses/by/4.0/).