Next Article in Journal
Supply Chain Risk of Obsolescence at Simultaneous Robust Perturbations
Next Article in Special Issue
Education for Sustainable Leadership: Fostering Women’s Empowerment at the University Level
Previous Article in Journal
Asian Medicinal Plants’ Production and Utilization Potentials: A Review
Previous Article in Special Issue
Sustainability in Lifelong Learning: Learners’ Perceptions from a Turkish Distance Language Education Context
 
 
Erratum published on 10 January 2020, see Sustainability 2020, 12(2), 519.
Article

Toward Sustainable Schools: A Mixed Methods Approach to Investigating Distributed Leadership, Organizational Happiness, and Quality of Work Life in Preschools

Faculty of Education, European University of Lefke, 99790 Lefke, Northern Cyprus, TR- 10 Mersin, Turkey
*
Author to whom correspondence should be addressed.
Sustainability 2019, 11(19), 5489; https://doi.org/10.3390/su11195489
Submission received: 15 July 2019 / Revised: 14 September 2019 / Accepted: 30 September 2019 / Published: 3 October 2019
(This article belongs to the Special Issue Sustainability in Leadership and Education)

Abstract

:
Previous research shows that sustainable organization conditions are associated with high levels of teacher well-being. Organizational happiness and quality of work life, two indicators of teacher well-being in an organization, impact the outcomes of teachers and organizations. Determining ways to support the organizational happiness and quality of work life variables in the organizational environment are gaining significance. Distributed leadership has attracted attention in the literature with its principles. Adopting a sequential explanatory design, qualitative data were collected after quantitative data. In the quantitative component, it was hypothesized that organizational happiness could play a mediating role in the relation between distributed leadership and quality of work life. This was tested through structural equation modeling, and the findings indicated that organizational happiness had a full mediation effect. In the qualitative component, the opinions of administrators regarding the effects of their behaviors on organizational happiness and quality of work life of teachers were investigated within the scope of distributed leadership. The results indicated that administrators’ own behaviors in the school context displayed distributed leadership characteristics.

1. Introduction

Findings indicating that at least 20% of teachers in the USA, the UK, China, Australia, and several European countries leave their profession in the first three years of their career [1,2]. The negative emotional and psychological factors experienced in the organization are noteworthy among the reasons for leaving the teaching profession [3]. Previous studies have argued that teachers have a moderate quality of work life [4] and moderate job satisfaction [5,6]. Moreover, considerable amount of workload for teachers results in a high level of stress and potential for burnout [7,8,9].
The literature suggests a relation between organizational happiness of preschool teachers and their capacity to offer quality education [10]. Also, teachers’ organizational happiness reflected on children [11]. Moreover, organizational happiness of teachers may affect the perception of social justice in society [12]. Furthermore, the quality of work life directly affects job satisfaction, motivation, and the quality of work performed by teachers [13]. Previous studies have emphasized that further research is essential to guide the reinforcement of teachers’ organizational happiness in practice [14].
Sustainable schools can be defined as the product of the processes involving followers’ happiness and their joint participation in the leadership roles [15]. In other words, this approach assumes that leadership, in this context, consists of the reciprocal learning processes that enable followers to construct and negotiate meanings leading to a shared purpose of schooling. Leadership is also concerned with learning that facilitates constructive change [16]. Learning has a direction toward a shared purpose, and change in the school context is a collective endeavor; therefore, people can achieve this more effectively in the presence of colleagues. The learning process within an organization must be shared; otherwise, shared purposes and actions are never achieved. Leadership requires the distribution of power and authority [16,17]. Shared learning, purposes, actions, and responsibilities necessitate the realignment of power and authority. Ultimately, it is stated that distributed leadership can be a beneficial approach for achieving sustainable purposes and actions in schools through positively affecting organizational happiness [18].
Previous studies also argue that sustainable school conditions are associated with teacher well-being [19,20]. Considering that organizational happiness and quality of work life are two indicators of teacher well-being in an organization, perceiving high levels of organizational happiness and quality of work life by the teachers may facilitate sustainable education environment [20]. Given these findings, two points gain significance: First, determining ways to support the organizational happiness and quality of work life variables in the organizational environment. Second, identifying ways to provide such support to teachers at higher levels. According to [21], as cited from the study by [22], a collective administration of leadership processes by the actors in the school rather than a single person is recommended to provide a healthy school environment. In this context, the distributed leadership approach comes to the fore. Numerous studies on distributed leadership in the literature have attracted our attention [23,24,25,26,27,28,29,30]. These studies have argued that the distributed leadership approach can affect job satisfaction [31,32], organizational trust [33], student achievement [34], and teacher effectiveness [35]. We believe that the examination of the effect of the distributed leadership approach of administrators on the organizational happiness and quality of work life of teachers would be useful in this context.
The collegial approach is one of the theoretical perspectives that explains organizational behavior in educational institutions [36]. Major assumptions of this approach are decision making based on a process of discussions, agreements and consensus and sharing the power among the members of the organization who are considered to have a joint perception of the organizational aims [37]. Distributed leadership is related to the collegial approach, and has been the focus of attention of scholars in the 21st century [37]. This leadership style, as mentioned in [36], is one of the most significant approaches within the context of educational leadership in the past decade. In the context of organizational behavior in educational institutions, distributed leadership is an approach in which collaborative working is undertaken among followers who trust and respect each other’s contribution and happens most effectively when people at all levels engage in action. However, it is also considered that the collegial approach is strongly normative and may not have a positive contribution to teachers and other employees in real school life [38]. Furthermore, the positive [23,30,35] and negative [24,25,26,27,28,29] effects of distributed leadership within organizations are discussed in the literature. It is believed that an examination of the effects of the distributed leadership approach on the organizational happiness and quality of work life of teachers will be useful in order to test the validity of both collegial theory and distributed leadership in real school life in the context of organizational behavior.
According to [39], in organizations where a distributed leadership approach is adopted, it is found that the organizational happiness perceptions of employees are high depending on the responsibility of the employees. In addition, it was stated in other study [40] that individuals who are not happy in their working environment have low perceptions of quality of work life. In the literature, it is concluded that distributed leadership positively affects organizational happiness and there is a positive correlation between organizational happiness and quality of work life. Based on these findings, it is thought that distributed leadership may affect the quality of work life of followers through organizational happiness. In this context, it is argued that the structural model where organizational happiness is a mediating variable in the possible relationship between distributed leadership and quality of work life can be tested.
This study mainly aims to go one step ahead in investigating the linear relations among the variables of the distributed leadership characteristics of administrators, quality of work life of employees, and organizational happiness of employees in the literature [5,31,33,41]. The study explains how these linear relations are realized, in other words, how the independent variable predicts the dependent variable. Furthermore, it argues that researching the processes through which the relations among the variables are realized would make a theoretical contribution to the literature. The mediation effect of organizational happiness on the possible relation between distributed leadership and quality of work life can be tested through structural modeling with mediating variable created to examine the situation. After these arguments, the first and second research questions are formulated to be tested.
In the literature, the notion of distributed leadership was interpreted in the light of descriptive and correlational findings. However, no studies have comprehensively investigated how these findings are reflected in practice [25,26,27,28,29,31,32,33,34,35,42]. However, conducting in-depth qualitative studies on how distributed leadership characteristics is practiced can lead to a better understanding of the distributed leadership within organizational life. For this reason, the third research question is formulated.
Based on these concerns, we conclude that a mixed methods approach to distributed leadership could contribute to a better understanding of the actors involved in the organizational structure. This study investigates distributed leadership, organizational happiness, and the quality of work life in preschools. In this context, we investigated the answers to the following research questions:
(1)
Do school administrators’ distributed leadership characteristics predict teachers’ organizational happiness and quality of work life?
(2)
Is there a mediating effect of the organizational happiness of teachers on the relation between the school administrators’ distributed leadership characteristics and teachers’ quality of work life?
(3)
What are school administrators’ thoughts on the effects of their behaviors on organizational happiness and quality of work life of teachers?

2. Materials and Methods

Adopting a sequential explanatory design, we utilized a mixed methodology where the quantitative paradigm has a dominant and the qualitative paradigm has a supplemental status in data collection, analysis, and interpretation.

2.1. Universe, Sample, and Study Group

The universe of this study comprised the preschools in Northern Cyprus (TRNC) as there have been no previous leadership studies conducted in preschools in the TRNC. As a result of the limited number of studies, it is evident that more in-depth research should be conducted to explore the relationships between teachers and administrators in preschools [43]. It is believed that a large proportion of the inter-organizational experiences and relations between the administrators and teachers at preschools in TRNC remains unexplored [43]. Furthermore, in the TRNC teachers’ law, only the tasks expected from teachers are specified and the articles of this law are based on the fulfillment of unilateral orders [44]. There is no provision that supports an environment of cooperation and trust within the organization and is based on sharing the duties and responsibilities of school administrators with teachers. In the light of these arguments, conducting this research in TRNC preschools may facilitate the understanding of the actual situation in kindergartens in the context of leadership.
It was thought that this research, which focuses the relationships between administrators and teachers, should be evaluated on the basis of data obtained from both administrators’ and teachers’ perspectives. As previously mentioned, in this research, distributed leadership was one of the variables investigated. In the quantitative section, some of the data were collected through a distributed leadership scale that was only administered to the preschool teachers. The reason that the school principals were not invited to participate in the quantitative part was that some of the administrators may have had a tendency to give socially desirable responses rather than accurate answers about themselves. It was thought that this could have violated the assumption of “participants giving honest and sincere responses to measurement instruments. In terms of the TRNC universe, it was argued that reaching all the preschool teachers would be more qualified in terms of the generalizability of the research results. The first and second research questions were correlational, and according to time, accessibility and economic criteria, the data were obtained via the quantitative method as it was difficult to reach the whole preschool teacher universe by using the qualitative method. Finally, to answer the third research question, teachers were not included in this section, since it was necessary to examine the administrative behaviors in greater depth.
No sampling was performed for the quantitative component of the study, and all class teachers and subject-matter teachers teaching at preschools affiliated with the TRNC Ministry of National Education in the 2018–2019 academic year (N = 290) were invited to participate in the study. Two hundred and forty-one teachers voluntarily participated in the study; however, data of only 208 teachers were suitable for analysis. Teachers and administrators at private schools were not included in the study because those working at private schools could refrain from making negative comments about the institution they work at. This could have violated the assumption of “participants giving honest and sincere responses to measurement instruments”.
A large number of the teachers who participated in the study were in the 31–40 age group (38.9%), followed by those in the 21–30 (28.4%) and those in the 41–50 (24.0%). Most of the participants were females (76.4%), and males were the minority (23.6%). Majority of the participants (81.3%) had a bachelor’s degree. However, a small number of teachers (1.9%) had an associate degree (Table 1).
In terms of the schools they graduated from, most teachers (73.1%) were graduates of Atatürk Teacher Training Academy and the rest (26.9%) had graduated from departments at private universities in Turkey and TRNC. Of the participants, 26.4% had 6–10 years of teaching experience, 23.1% had 11–15 years of experience, and 7.2% had 26 years of experience and above. The study group in the qualitative component of the study was determined through stratified sampling. Based on stratified sampling, participants were included in the study from six districts of TRNC considering their availability and accessibility.
Similarly, two administrators from each district (total 12: 7 females and 5 males) were included in the study, with whom a discussion was held during to the researchers’ visits to schools for the quantitative data collection, and their consent for participating in the study was obtained. The ages of the school administrators varied between 45 and 54 years. They had between 2 and 16 years of experience as school administrators. Two participants had graduated from the department of child development, and 10 participants had graduated from the department of classroom teaching (Table 2).

2.2. Data Collection Tools and Data Collection

The first and second research questions were investigated through quantitative data, which was collected through three scales with the participation of the teachers. A total of three scales were given to those teachers who were willing to participate in the research voluntarily; one scale measuring the distributed leadership perceptions of teachers about their own school administrators, and two scales measuring their perceptions of quality of work life and organizational happiness. The third research question was investigated through interviews with the school administrators. Administrators’ thoughts on the effects of their behaviors on organizational happiness and quality of work life of teachers were examined.
The Distributed Leadership Scale was developed by [45]; Quality of Work Life Scale developed by [46] and adapted into Turkish by [47]; and Organizational Happiness Scale was developed by [48]. 868 teachers from Gaziantep participated in the development of the Distributed Leadership Scale. Expert opinion was sought for content and face validity. Explanatory factor analysis (EFA) and confirmatory factor analysis (CFA) were used for construct validity. EFA revealed that the scale explained 62.5% of the total variance and comprised five factors, i.e., formal structure, unity of purpose, collaboration and trust, sharing responsibilities, and incentive and initiative. CFA revealed that all goodness of fit values ((Chi-square fit index (χ2), Chi-square fit index/degree of freedom (χ2/df), Standardized Root Mean Square Residual (SRMR), Comparative Fit Index (CFI), Goodness of Fit Index (GFI), Adjusted Goodness of Fit Index (AGFI), Root Mean Square Error of Approximation (RMSEA), Root Mean Square Residual (RMR), Normed Fit Index (NFI), and Non-normed Fit Index (NNFI)) were acceptable [49]. In the validity analysis, Cronbach’s alpha and split-half reliability test coefficients were 0.87 and 0.92, respectively. Even though the draft scale included 52 items, 20 items were removed on the basis of EFA, CFA, and reliability analyses. The final form of the scale comprised 32 items, 1 of which was a reverse item. The five-point Likert-type scale was scored between totally disagree (1) and totally agree (5). The arithmetic means of all responses to the items were taken as the score obtained on the scale [45].
Regarding the Quality of Work Life Index developed by Van Laar, Edwards, and Easton (2007) and adapted into Turkish by [47], 31 English teachers in Kilis participated in the linguistic validity study, 324 teachers participated in the construct validity study, and 118 teachers participated in the test-retest reliability study. To ensure linguistic validity, the items were translated from English into Turkish and then from Turkish into English. The correlation coefficient between the Turkish form and English form was 0.77. In addition, based on the results of the EFA, the scale was used without removing any items from the English form and changing the number of factors. The results of the CFA indicated that goodness of fit values were acceptable. In the reliability analysis, the reliability coefficient for each sub-dimension was higher than 0.7, and the Cronbach’s alpha coefficient of the whole scale was 0.95. Accordingly, there were 6 factors, i.e., satisfaction with job and career (6 items), overall well-being (6 items), controlling work (3 items), working conditions (3 items), stress at work life (2 items), work–family life balance (3 items), and 23 items (3 of which were reverse items). The arithmetic means of the responses to the items in the five-point Likert-type scale were interpreted as the score obtained from the scale [47].
An item pool was created in the first phase of the scale development study for the Organizational Happiness Scale, which was developed to measure organizational happiness in the school environment, and a draft scale with 52 items was formed by considering expert opinions. The items with a factor load below 0.3 were removed from the scale based on the EFA conducted with 352 teachers. In addition, a structure comprising 38 items and 5 factors, including management processes, professional attitude, communication with stakeholders, professional commitment, and economic conditions, explained 51% of the total variance. The following CFA indicated that goodness of fit values were good and acceptable. Cronbach’s alpha coefficient was used to measure reliability. Cronbach’s alpha coefficient for each sub-dimension was higher than 0.7, and Cronbach’s alpha coefficient for the whole scale was 0.92. The arithmetic means of the responses to the items in the five-point Likert-type scale were accepted as the score obtained from the scale [48].
The qualitative data of the study were collected through an interview form comprising three semi-structured questions developed by the researcher.

2.3. Validity and Reliability

Prior to the data analysis, the model fit between the determined structure of the scales and Turkish Cypriot culture was examined for assessing the construct validity. Due to the lack of a large research universe (N = 208), the samples in the CFA and the implementation were not different; instead, all the data from the universe underwent CFA, and data analysis started consequently. Because the CFA and reliability analysis on the scales were prerequisites for structural equation modeling (SEM), these analyses are detailed in the findings section under the heading “testing measurement models.”
Expert opinion was consulted to ensure the validity and reliability of the interview form, and the form was reshaped on the basis of these opinions. To measure the reliability of the form, the inter-rater reliability rate was calculated on the basis of ( r M & H = Number   of   Agreements Number   of   Agreements   + Number   of   Disagreements ) the formula by [50]. The analysis revealed that the inter-rater reliability rate was 100%. The interview form got its final form after the pilot study; no guidance was provided during the interviews to ensure validity; and direct excerpts from the interviews were used to represent meaningful data while interpreting the findings to enhance reliability. The interviews, which took 15 minutes on average, were recorded using a voice recorder to ensure no data loss.

2.4. Data Analysis

SEM was used to test the research hypotheses in the quantitative component of the study. In this approach, a causal and relational structure is formed between the observed and latent (unobservable) variables. This structure is defined as a model and is analyzed using multivariate statistical methods [49]. The observed and latent variables within the model created in the SEM analysis are assessed together. SEM is simultaneously defined as multiple regression analysis [51].
In the study, SEM was preferred over multiple regression analysis because multiple regression analysis can only measure the extent to which an independent variable can predict two dependent variables in two different stages instead of doing so at the same time and in one stage. This measure would not be reliable [51]. Testing the whole model in a single stage instead of through individual coefficients would cause less deviation in the measurement error and p-value [49]. However, SEM was thought to be favorable in terms of decreasing the measurement error and p-value [51,52].
Quantitative data were analyzed using SPSS 24 and AMOS 24 package programs. The multivariate normality tests and reliability analysis tests were performed on the data collected. The significance value was accepted as (p < 0.05), and the goodness of fit indices were examined through CFA on the measurement models and structural model. The regression weights and R² values were analyzed to interpret the model. A bootstrap analysis was performed on 500 samples to verify a mediating effect of the mediator variable in the mediation model [52].
Qualitative data were analyzed through content analysis in four stages. In the first stage, coding the data, the audio recordings obtained from the interviews were transcribed. Thereafter, each word, sentence, or paragraph considered to be meaningful within the raw data were named and coded by the researcher in one or more words. No predetermined conceptual structure was provided to guide the data obtained from the 12 administrators. Instead, because the opinions of the administrators about the effect of their behaviors on teachers’ organizational happiness and quality of work life were collected, the analysis started with an inductive analysis of the data. Codes were formed considering the similarities and differences in the data. In the second stage, the codes were grouped under certain categories and themes that contain the common aspects of all relevant codes were created. The code and themes obtained in the third stage were arranged in a way that the reader would understand. The findings were interpreted in the last stage. In the analysis of qualitative data, focus was placed to ensure that the findings were meaningful and consistent for internal validity [53].

3. Results and Discussion

3.1. Quantitative Findings

The universe comprised 290 people, and 241 teachers voluntarily participated in the study. However, 208 responses were suitable for analysis. SEM was utilized to measure the extent to which distributed leadership could predict the quality of work life and organizational happiness.

3.1.1. Descriptive Statistics and Inter-Variable Relationships

In this study, distributed leadership, quality of work life, and organizational happiness were implicit (latent) variables, and the scores obtained from the sub-dimensions that constitute these variables were observed variables [54]. The mean and standard deviations of the observed variables and the correlation coefficients between the observed variables are presented in Table 3.
Table 3 presents significant relationships (* p < 0.05, ** p < 0.01) among the sub-dimensions of distributed leadership, organizational happiness, and quality of work life. Based on these findings, a structural equation model can be formed among distributed leadership, organizational happiness, and quality of work life [54].
The skewness and kurtosis coefficients of the observed variables were found to be between −1.5 and +1.5 (Table 4). According to [52], skewness and kurtosis coefficients between −1.5 and +1.5 indicate that normal distribution is achieved at an acceptable level. Accordingly, each of the observed variables is normally distributed. In addition, the multivariate critical ratio was 2.303. According to [46], if this value is below 5, a multivariate normal distribution is achieved. Accordingly, the data obtained follow a multivariate normal distribution. With a multivariate normal distribution, the assumption of maximum likelihood estimation in structural equation model was met. The analyses were performed through maximum likelihood estimation.

3.1.2. Reliability

In this study, Cronbach’s alpha and split-half test reliability coefficients were used to assess the reliability of the data obtained from the measurement models (Table 5). Because Cronbach’s alpha coefficient is not suitable for dimensions comprising two items due to its formula, the composite reliability approach was used instead [55,56].
While the internal consistency coefficient of the variables in the study varied between 0.72 and 0.94, the internal consistency coefficient for the three scales overall varied between 0.85 and 0.94. According to these findings, the observed variables and scales overall provide a reliable structure [57].

3.1.3. Structural Equation Modeling

In all structural equation models, there are two basic structures: the measurement model and structural model. There are two different approaches to testing these structures. The first is the simultaneous testing of the measurement and structural model. Another approach is to test in two stages by testing the structural model after the measurement model [58]. A two-stage approach was adopted in this study.

Testing Measurement Models

Each of the three scales was previously tested and had validated structures. After the implementation in TRNC, instead of determining the structures to assess construct validity before data analysis, whether the predetermined structures of the scales were suitable for the Turkish Cypriot culture was investigated [59]. By doing so, the measurement models were also tested before testing the structural model. CFA was conducted on the three measurement models. The goodness of fit values of the model were examined by considering the significance level of 0.05 and by adopting maximum likelihood estimation.
Since RMSEA, NFI, CFI, and GFI values were not acceptable on the first DFA for distributed leadership (DL), quality of work life (QWL), and organizational happiness (OH) measurement models, standardized regression coefficients for each expression were examined to improve these values. A factor load value of less than 0.30 for an item indicates that the item is not sufficiently related to that factor. The standardized regression coefficients for each item in the scales were examined. Accordingly, item 11 and 12 in the DL scale and item 37 and 38 in the OH scale were excluded from the scale as their regression coefficients were lower than 0.3 and t values were not significant.
The standardized regression coefficient for each item in the scale was found to be suitable based on the DFA performed after excluding items. Modification suggestions were considered to improve the goodness of fit values. An error covariance was generated between item 14 and 15 and item 26 and 31 in the DL scale; item 7 and 9 and item 11 and 12 in the QWL scale; and item 1 and 2, item 7 and 9, and item 18 and 20 in the OH scale.
The consequent covariances and the measurement models were retested. When the fit values were examined, the X2/df, RMSEA, SRMR, NFI, NNFI, CFI, and GFI values of the three measurement models were all fit and within acceptable compliance limits (Table 6).
The factor loads of the items in the sub-dimensions of the DL measurement model were between 0.66 and 0.91 for formal structure, between 0.80 and 0.95 for unity of purpose, between 0.86 and 0.95 for collaboration and trust, between 0.71 and 0.92 for sharing responsibilities, and between 0.79 and 0.92 for incentive and initiative. A common view in the literature is that the factor load of an item should be above 0.30 [59,60]. According to the CFA results, the DL measurement model has a model fit and ensured construct validity. The factor loads of the items in the sub-dimensions of the QWL measurement model were between 0.71 and 0.91 for satisfaction with job and career, between 0.36 and 0.78 for overall well-being, between 0.48 to 0.73 for controlling work, between 0.74 and 0.84 for stress at work life, between 0.31 and 0.43 for working conditions, and between 0.69 and 0.84 for work–family life balance. In this study, item load values higher than 0.30 were accepted as the criteria. The measurement model had acceptable goodness of fit values and ensured construct validity according to the CFA results on the quality of work life scale.
The factor loads of the items in the sub-dimensions of the OH measurement model were between 0.75 and 0.90 for management processes, between 0.82 and 0.91 for professional attitude, between 0.87 and 0.95 for communication at the workplace, between 0.60 and 0.91 for commitment, and between 0.60 and 0.93 for economic conditions. According to the results of the CFA on the OH scale, the fit indices, t values of the items, and standardized regression coefficients of the scale were examined. It had a model fit and ensured construct validity.
Based on all the data obtained from validity and reliability studies, the distributed leadership scale with its five-factor structure, quality of work life scale with its six-factor structure, and organizational happiness scale with its five-factor structure are valid and reliable for the TRNC sample. All the measurement models were confirmed, and the structural model could be tested.

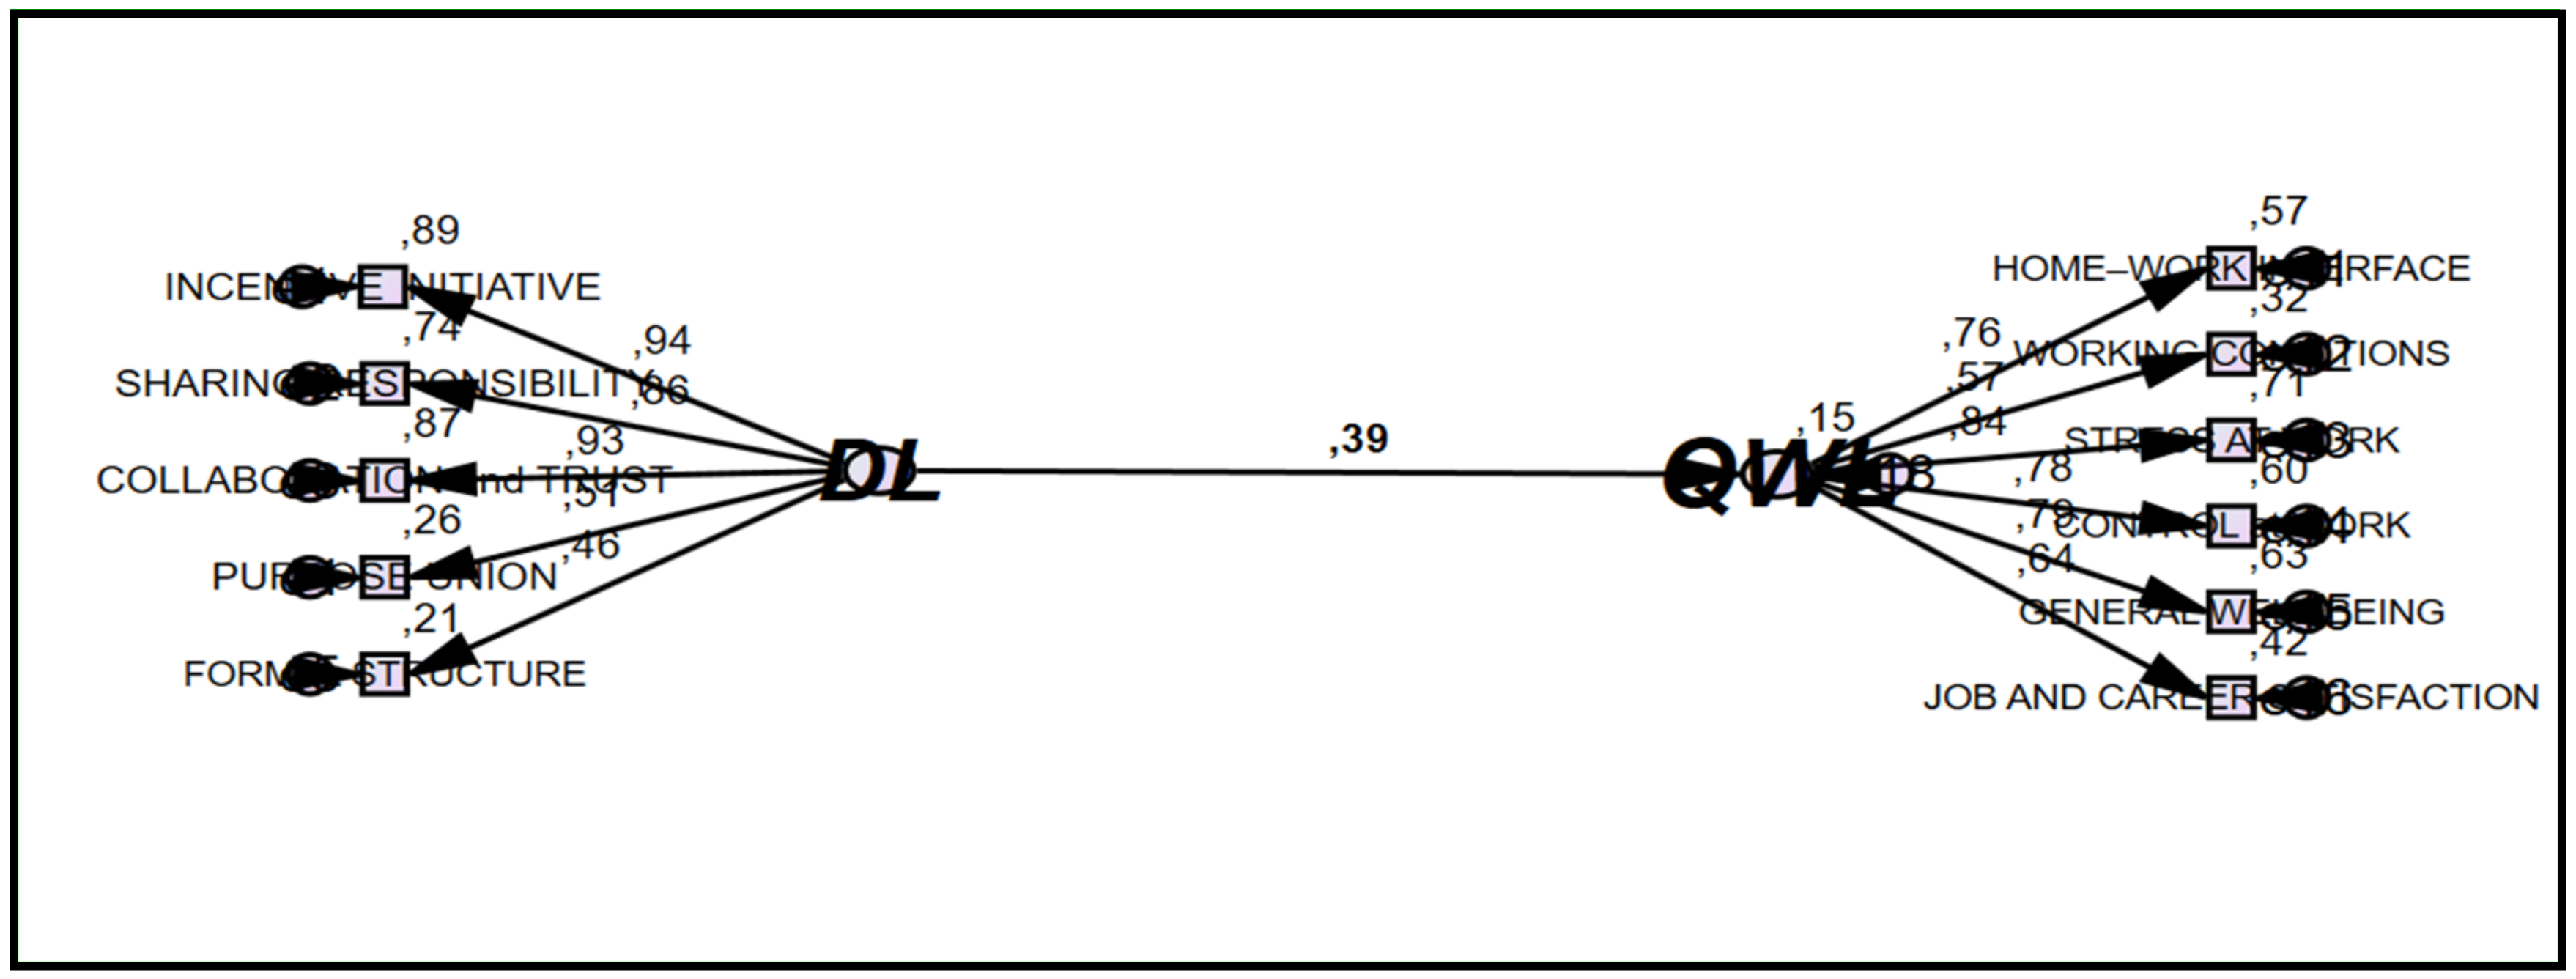
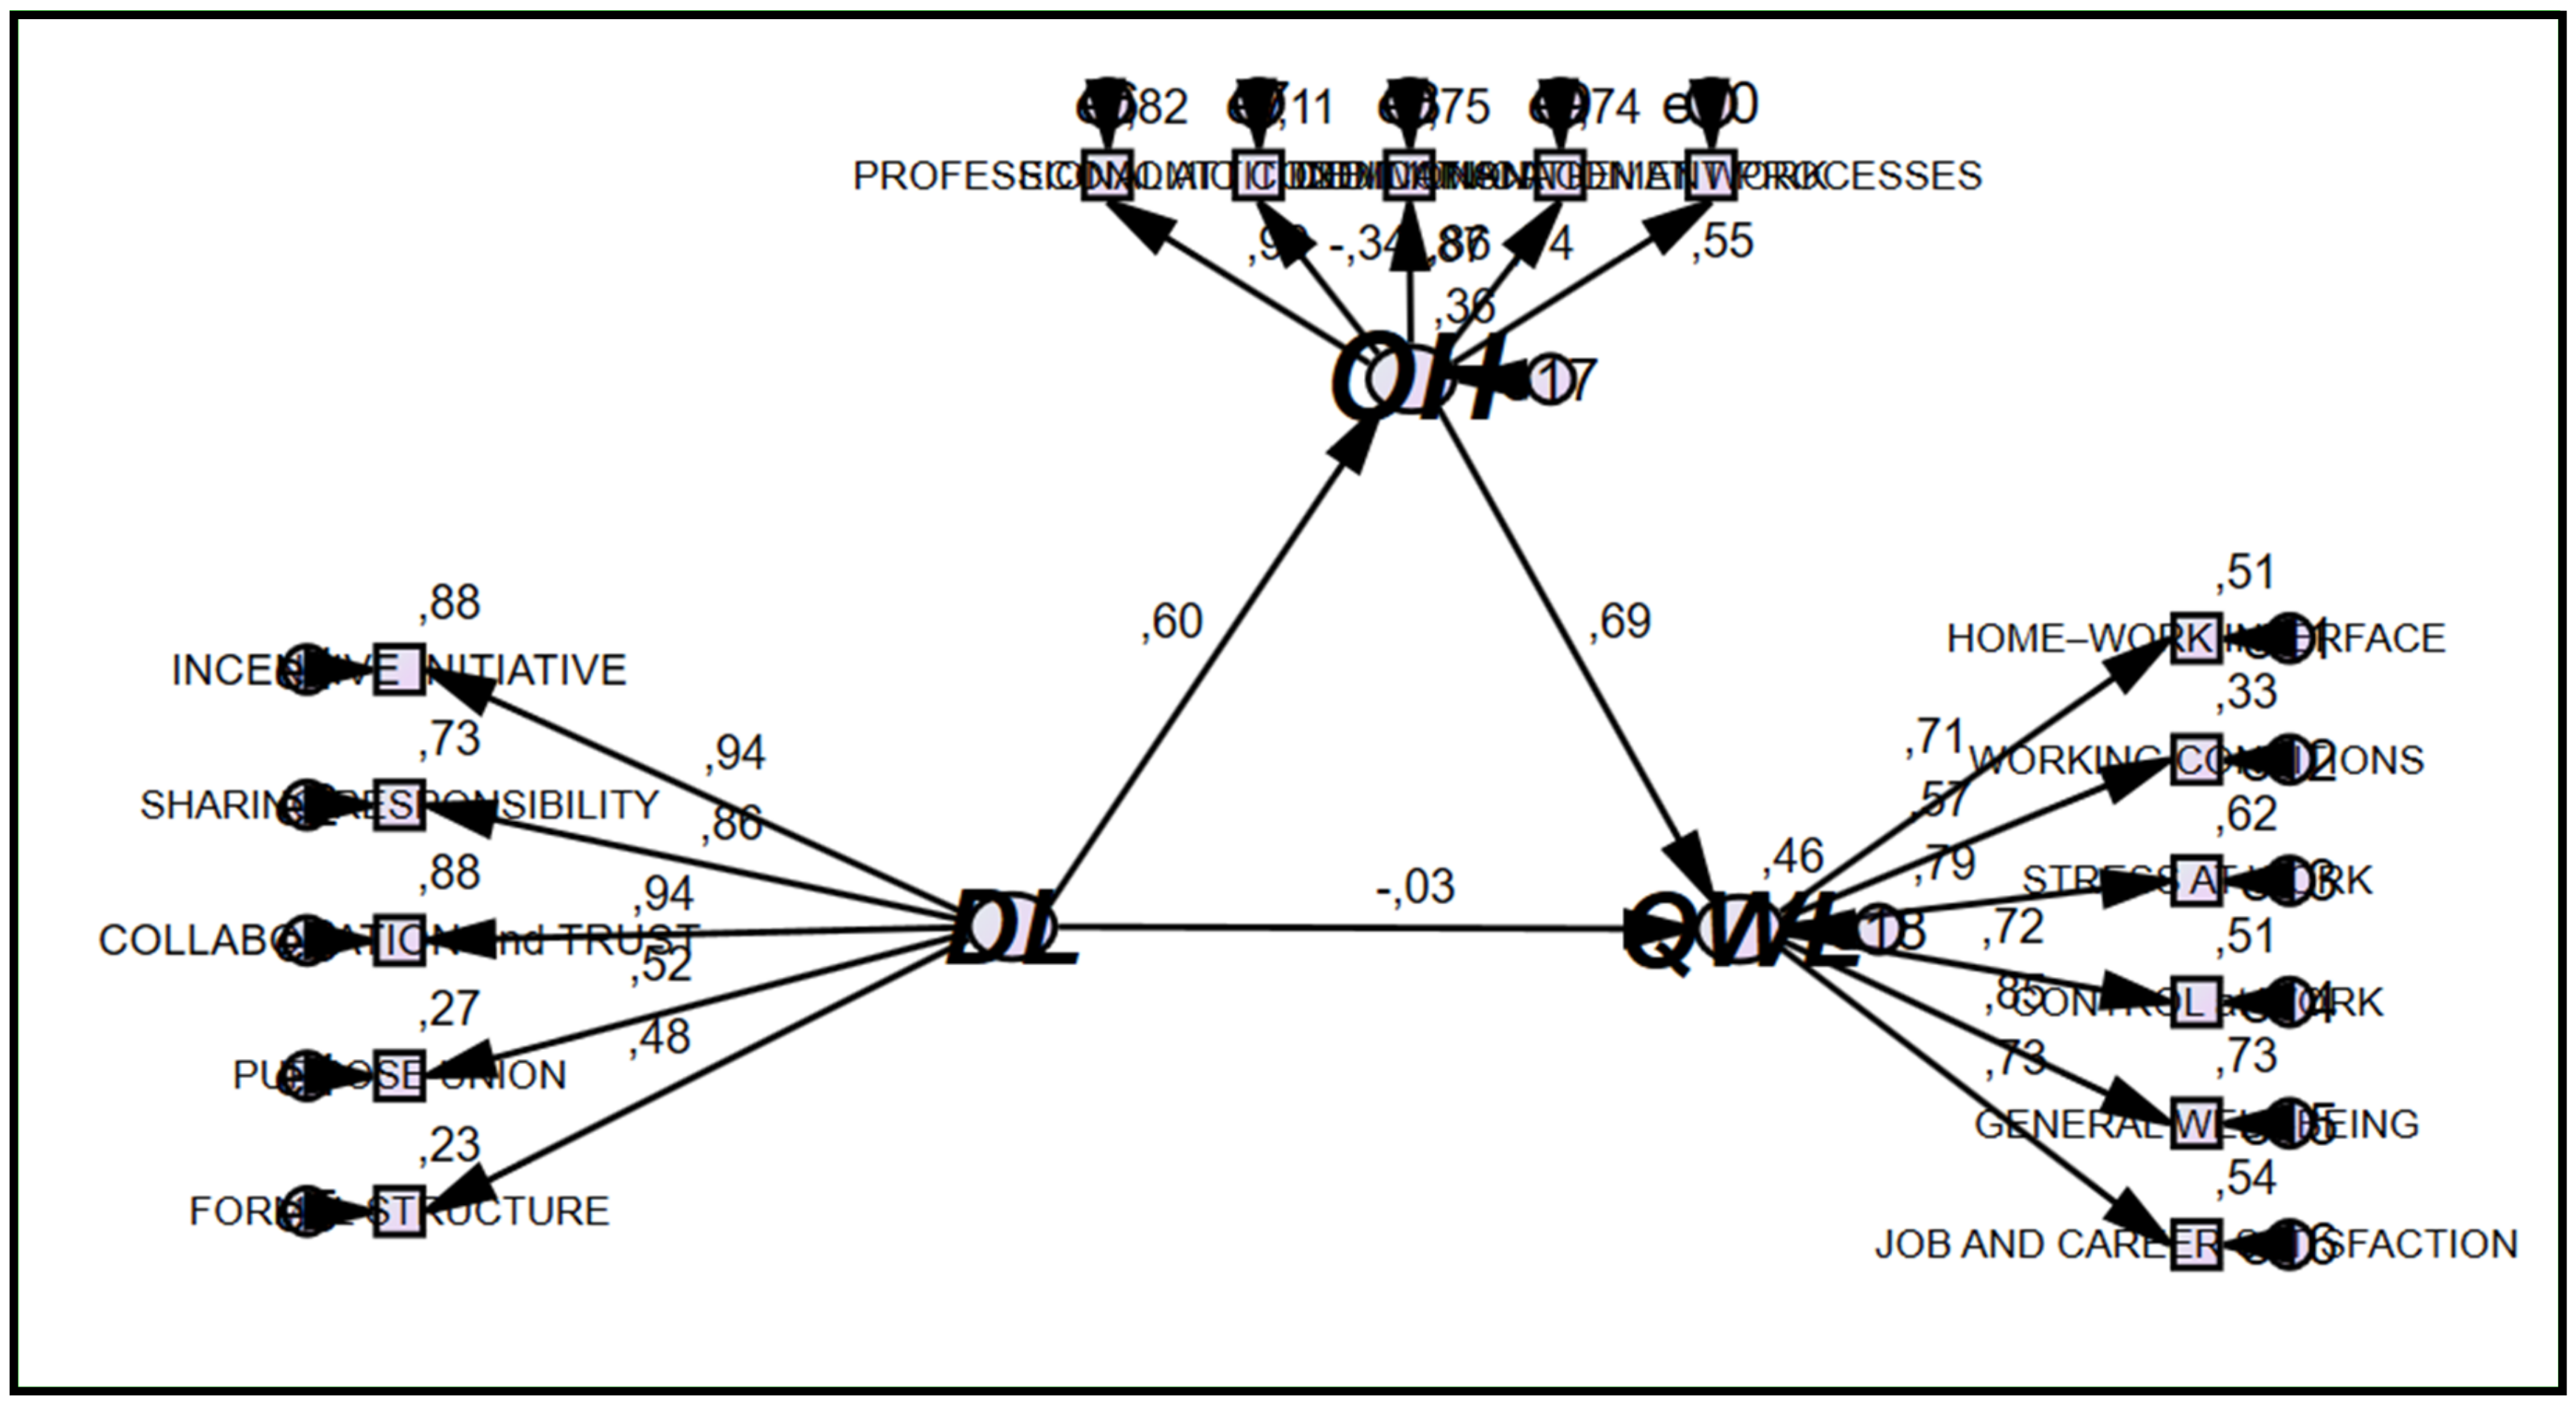
3.1.4. Testing the Structural Model

First, the direct relationship between distributed leadership and teachers’ quality of work life was tested, and a significant positive relationship was found between them (a = 0.391, t = 14.734, p < 0.001). Distributed leadership was also found to have a significant positive predictive effect on the teachers’ quality of work life (R² = 0.152, p < 0.001). The structural model is presented in Figure 1.
In the next phase of the study, organizational happiness of the teachers was added to the model as the mediating variable between distributed leadership and teachers’ quality of work life, and the new model with the mediation relationship was tested (Figure 2). In this structural model, distributed leadership was the latent exogenous variable, teachers’ organizational happiness was the mediating variable, and teachers’ quality of work life was the latent endogenous variable. The sub-factors that constitute the latent variables were accepted as the observed variables explaining the latent variable. CFA was performed to test the fit of the structural model. The goodness of fit values were examined (Table 7), and they were found to be within the acceptable range. Considering these findings, the necessary assumptions needed to conduct a structural equation analysis among the variables were met [52,61].
The model in Figure 2 indicates a positive correlation between distributed leadership and organizational happiness among teachers. It indicates that distributed leadership positively and significantly predicts the organizational happiness of teachers (a = 0.598, t = 18.270, R² = 0.357, p < 0.001).
In addition, organizational happiness was added to the model in Figure 1 as a mediating variable, and the structural model in Figure 2 was constructed. The analysis of the model indicates that the path coefficient between distributed leadership and teachers’ quality of work life approaches zero and loses its significance (a = −0,030, t = −0.348, p = 0.123 > 0.05). The loss of significance of the correlation between distributed leadership and the quality of work life implies that organizational happiness can function as a mediator in the relation between distributed leadership and the quality of work life. A bootstrap analysis was performed on 500 samples to test the presence of this mediating effect, and the indirect effects in this model were significant (p = 0.01 < 0.05). The mean indirect effect of distributed leadership on the quality of work life through organizational happiness was within the 95% confidence interval (0.275–0.549) (Table 8).
Nonetheless, the mediation model (Figure 2) offers a higher R² value (R² = 0.457 > 0.153) than the model with direct effect (Figure 1). Accordingly, the model with direct effect explains the quality of work life, but the mediation model that includes the organizational happiness variable explains the dependent variable at a higher level [62]. According to the R² value of the mediation model, 45.7% of the change in the quality of work life of teachers can be explained by distributed leadership through the organizational happiness of teachers and the undetermined variables are effective for the remaining 54.3%.
The result that distributed leadership significantly and positively affects the quality of work life through organizational happiness was tested and verified (Table 8). In other words, it was found that the change in the quality of work life is a result of the positive effect of distributed leadership on organizational happiness, which, in turn, positively affects the quality of work life (a full mediation effect). Based on these findings, it would be useful to expand the distributed leadership approach to enhance organizational happiness and quality of work life of teachers within an organization.
Similarly, previous research shows that sustainable education environment conditions are associated with well-being of teachers [19,20]. Organizational happiness and quality of work life, two indicators of teacher well-being in an organization, may facilitate the creation of the sustainable education environment. Based on the findings that distributed leadership positively affects the quality of work life through organizational happiness, the use of distributed leadership in the organization can create sustainable schools.
The positive [23,30,35] and negative [24,25,26,27,28,29] effects of distributed leadership within the organization were discussed in the literature. This study, with its findings, is to support those arguments that distributed leadership within the organization positively affects employees. However, these results alone are insufficient to explain distributed leadership. Accordingly, the administrators’ opinions about the effects of their behaviors on organizational happiness and quality of work life among teachers were also investigated. In addition, the behaviors of administrators in relation to teachers in the school environment are discussed within the scope of distributed leadership. Also, the findings of this study are in contradiction with the findings of previous researches that the collegial approach is normative and limited in its applicability [38]. The findings of this study provide support for the idea that via distributed leadership, collegial theory is an approach that could be applied in real organizational life.

3.2. Qualitative Findings

In the first phase of the qualitative component of the study, the opinions of the administrators about the effects of their behavior on organizational happiness and the quality of work life among teachers were investigated. Almost all the participants stated that positive administrative behaviors affect the organizational happiness of teachers. In contrast, only two participants stated that negative behaviors performed by the administrator could positively affect organizational happiness.
‘Some teachers are happy with strict and commanding administrators’ (P8).
‘Sometimes a harsh approach increases the productivity of teachers’ (P11).
Some studies in the literature have proposed the quality of communication between the administrator and teachers, administrative processes, and environmental factors as the factors affecting organizational happiness [63]. A similar study concluded that the organizational climate created by the administrators within the organization and the clearly stated rules promoted organizational happiness [64]. In [65] it was concluded that the administrators’ attitudes and behaviors were important predictors of organizational happiness and organizational silence levels.
In this study, the finding that the behaviors of administrators affect the organizational happiness of teachers, which was agreed upon by all participants (n = 12), has also been supported by relevant studies in the literature [63,64,65]. No studies have found that administrator behaviors lack effect on the organizational happiness of employees.
Another finding of this study was that the negative behaviors of administrators may positively affect organizational happiness. No studies in the literature have supported this finding. Therefore, this finding offers a unique perspective to the literature in terms of the effect of administrators’ behaviors on organizational happiness. Furthermore, negative behaviors, as stated by the participants (giving orders, acting harshly, etc.), may enable the group to do the assigned work, but it does not in any way prove that the person doing the task is happy while doing it. Adopting a harsh attitude by disregarding the feelings and thoughts of the group may decrease the productivity rather than increasing it; besides, in the literature, an authentic leadership approach leads to results in this direction [66].
All administrators (n = 12) agreed that the behaviors of the administrators affect the quality of work life of teachers. The excerpts related to this finding are as follows:
‘The administrator’s behavior has a direct effect on the teacher’s work life’ (P12).
‘Without doubt, it affects. If I display negative behaviors, my colleagues will be influenced negatively’ (P7).
In relation to this finding, [67] indicated the quality of the relationships between the administrator and the employees in the workplace, career opportunities, and administrators’ encouragements toward developing skills as the determining factors of the quality of work life. A similar study emphasized that a qualified working environment provided by the administrator within the organization positively affects the quality of work life and that the restriction of the freedom of expression is an obstacle to the quality of work life [68]. In another study conducted by [69], the leadership styles of school administrators were found to be a significant predictor of the quality of work life of teachers. In [70] it is stated that stress created by the problems between administrators and employees does not negatively or positively affect the quality of life.
The finding that administrators’ behaviors affect the quality of work life of teachers, on which there was a consensus among all participants (n = 12), is supported by the research in relevant literature [67,68,69], excluding the findings of [70].
In the second part of the qualitative component of the study, the administrators were asked about their approach toward teachers in the school environment (the behaviors they often displayed). The responses were analyzed within the scope of distributed leadership. Three excerpts from the administrators are presented below:
‘There must be peace at school. The quality of work life of teachers increases in a stress-free environment. In the end, the teacher wins, the child wins, I win’ (P5).
‘The way I behave towards a teacher determines the attitude of the teacher towards me. Being polite should be made a habit’ (P11).
‘If necessary, we need to remind with gestures, mimics, or by words who the boss is’ (P9).
Responses during interviews were classified as meaningful codes. When these codes were examined, the recurring codes were “making common decisions with teachers and administrators” (n = 7), “providing a democratic environment” (n = 5), “not being oppressive” (n = 5), and “the administrator being able to find solutions to problems” (n = 5). Considering the opinions of teachers when making decisions, being equal and fair to all, and solving problems by adopting a horizontal organizational structure are among the characteristics of the “formal structure” factor of the distributed leadership approach [71]. Based on these statements, the codes above contain behavioral patterns used in the distributed leadership approach.
Nevertheless, two administrators believed that “the principal should have the final say”. This statement is contrary to the nature of the distributed leadership approach [71]. This code is used in classical organization theories. While causing boredom and despondency among employees, there may be a communication breakdown between the administrator and teacher [72]. Notably, making common decisions in the organization by including employees in the decision-making process is adopted in modern management theories and the distributed leadership approach. Thus, decision making by administrators alone is found to be negative and is not preferred in modern approaches. The reason for this result is that behind the decisions that bring success to the organization are the common decisions made by more than one individual [71].
When the other findings obtained from the administrators were reviewed, the codes included “providing a stress-free and peaceful environment” (n = 4), “administrator should be polite” (n = 4), “administrator should be fair” (n = 4), and “the administrator must respect the teacher” (n = 3). Ensuring peace in the environment and creating a fair structure adopting respect and trust by taking democracy as the basis to make education more effective are the characteristics of the “collaboration and trust” dimension of distributed leadership [30,31,32,33,34,35,36,37,38,39,40,41,42,43,44,45,46,47,48,49,50,51,52,53,54,55,56,57,58,59,60,61,62,63,64,65,66,67,68,69,70,71,72,73].
However, these statements are not only the characteristics of distributed leadership; what is striking is the variety of leadership models that share the same elements of positive psychology but have resulted in distinct lines of research [74,75,76]. The above codes are shared in common among different leadership approaches, including transformational, servant, distributed and integrative leadership models [77]. For this reason, it was argued that the behaviors of the administrators in relation to teachers do not show that they are fully distributed leaders in the real school environment because these examples of behaviors are also the characteristics of other leadership models. On the other hand, it can be clearly said that the administrators’ behaviors contain partially distributed leadership characteristics and positive psychology [77].
In the light of qualitative and quantitative findings, we conclude that administrators display behaviors with distributed leadership characteristics and that distributed leadership characteristics of administrators as perceived by teachers significantly affect teachers’ quality of work life and organizational happiness. In this context, administrators’ often displaying distributed leadership characteristics in their behaviors toward the teachers in the organization can positively affect teachers’ organizational happiness and quality of work life. Considering that these findings are supported by relevant research in the literature [63,64,67,68], distributed leadership positively affects the organizational life at the preschool level. Adoption of this approach by the administrators may benefit the organization.

4. Conclusions

In this study, regarding the first research question, the direct effects of the distributed leadership characteristics of administrators as perceived by the teachers on the quality of work life and organizational happiness of teachers were examined. The results indicated that distributed leadership significantly and directly positively affects teachers’ quality of work life and organizational happiness.
Another main objective of this study was to go one step ahead in investigating the linear relations among the variables of distributed leadership characteristics of administrators, quality of work life of employees, and organizational happiness of employees. The study aimed to explain how these linear relations are realized, in other words, how the independent variable predicts the dependent variable. In the structural model with a mediating variable developed to investigate this situation, the mediation effect of the organizational happiness of the teachers in the relation between distributed leadership of administrators and teachers’ quality of work life was assessed as the second research question. According to the findings obtained from the analysis of the mediation model, change in the quality of work life was realized by the positive and significant effect of the distributed leadership on organizational happiness and the positive effect of consequent organizational happiness on the quality of work life (a full mediation effect). Accordingly, a theoretical model which determines how and in which ways distributed leadership affects teachers’ quality of work life was tested and verified. In this context, we believe that this study contributes to the literature.
A review of previous studies on distributed leadership indicates that descriptive and correlational studies were conducted more commonly [25,30,31,32]. These studies sought to answer the question of “what” by looking for a relation or effect between distributed leadership and other variables. However, no studies have investigated how the predictive variable (distributed leadership characteristics) is displayed by administrators in real life. In the qualitative component of this study, the opinions of school administrators about the effects of their behaviors on teachers’ organizational happiness and quality of work life were discussed as the third research question, in addition to concrete examples showing “through which behaviors” (how) distributed leadership characteristics are displayed in the real school environment. This was determined by identifying the examples of behaviors of administrators in the school environment that bear the characteristics of distributed leadership.
In the literature review, it was found that the earlier studies investigating distributed leadership in national and international settings did not include the organizations where preschool education was conducted. With these findings, it can be said that there are distributed leadership characteristics in preschools. The finding that distributed leadership behaviors positively affect organizational happiness and the quality of work life of preschool teachers can contribute to the international literature on distributed leadership.
Sustainable schools were defined as the product of the processes involving followers’ happiness and their joint participation in the leadership roles. Shared learning, actions and responsibilities demand the realignment of power and authority. Related to this, leadership requires the distribution of power and authority [16,17]. Ultimately, it was argued that distributed leadership may be beneficial for creating sustainable school environments by achieving organizational happiness and action in schools [18].

Suggestions for Further Studies and Practices and Limitations

This study investigated the relations among distributed leadership, organizational happiness, and the quality of work life. According to the results of the mediating model, undetermined variables were effective on 54.3% of the change in the quality of work life. It is recommended that theoretical models are developed and tested in the future studies to understand these undetermined dynamics. In addition, a positive and significant relation was observed between distributed leadership and organizational happiness (a = 0.598, t = −18.270, p < 0.001). Reference [41] indicated a connection between the organizational happiness of teachers and their ability to offer quality education. Investigating the extent to which distributed leadership can predict the capacity of teachers to offer quality teaching through the organizational happiness of teachers in future studies will enable testing the extent to which distributed leadership can affect quality education output and its indirect effect on students in practice.
In this study, distributed leadership characteristics of administrators as perceived by teachers positively and significantly predicted teachers’ organizational happiness and quality of work life. Accordingly, disseminating distributed leadership within the organization would be useful in enhancing teachers’ organizational happiness and quality of work life. To achieve this, in-service training sessions on distributed leadership can be organized for school administrators.
This study was conducted with class teachers, subject-matter teachers, and 12 school administrators at preschools in TRNC. This can be seen as a limitation in the generalizability of the findings. Replicating similar studies in organizations that offer education at primary and secondary levels might provide improved generalizability, a more comprehensive discussion of the findings, and more reliable judgments through testing of the mediation model again. In addition, in this study, the sub-dimensions of distributed leadership were not investigated in terms of the extent to which they can predict teachers’ quality of work life and organizational happiness. Investigating which dimension(s) of distributed leadership can better predict teachers’ quality of work life and organizational happiness in future studies will allow the discussion of the quantitative findings obtained in this study in greater detail. However, reviewing the literature on organizational happiness, only a limited number of studies have mentioned the lack of consensus on the foundations and dimensions of the concept of organizational happiness. Further research in this area may allow us to explore the dimensions of organizational happiness more reliably and better understand organizational happiness.

Author Contributions

E.K.A. and A.U. conceptualized the study and choose the theoretical framework. E.K.A. collected and analyzed the data, then wrote the methods and results. The authors read and revised the manuscript several times together.

Funding

This research received no external funding.

Conflicts of Interest

The authors declare no conflict of interest.

References

  1. Chang, M.L. An appraisal perspective of teacher burnout: Examining the emotional work of teachers. Educ. Psychol. Rev. 2009, 2, 193–218. [Google Scholar] [CrossRef]
  2. Roffey, S. Pupil Wellbeing-Teacher wellbeing: Two sides of the same coin? Educ. Child Psychol. 2012, 29, 8–17. [Google Scholar]
  3. Karsentfi, T.; Collin, S. Why are new teachers leaving the profession? Results of a Canada wide survey. Education 2013, 3, 141–149. [Google Scholar]
  4. Baleghizadeh, S.; Gordani, Y. Motivation and quality of work life among secondary school EFL teachers. Aust. J. Teach. Educ. 2012, 37, 30–42. [Google Scholar] [CrossRef]
  5. Çelik, K.; Tabancali, E. Quality of work and life of teachers’ who are working in special education institutions. Mediterr. J. Educ. Res. 2012, 11, 31–38. [Google Scholar]
  6. Olcum, D.; Titrek, O. The effect of school administrators’ decision-making styles on teacher job satisfaction. Procedia Soc. Behav. Sci. 2015, 197, 1936–1946. [Google Scholar] [CrossRef]
  7. Beehr, T.A. Psychological Stress in the Workplace; Routledge: London, UK, 1995. [Google Scholar]
  8. Pascual, E.; Perez-Jover, V.; Mirambell, E.; Ivanez, G.; Terol, M.C. Job conditions, coping and wellness/health outcomes in Spanish secondary school teachers. Psychol. Health 2003, 18, 511–521. [Google Scholar] [CrossRef]
  9. Titrek, M. Employees’ organizational justice perceptions in Turkish schools. Soc. Behav. Personal. 2009, 37, 605–620. [Google Scholar] [CrossRef]
  10. Cummings, T.G.; Worley, C. Organization Development and Change; Cengage Publishing: Mason, OH, USA, 2010. [Google Scholar]
  11. Ylitapio-Mäntylä, O.; Uusiautti, S.; Määttä, K. Critical viewpoint to early childhood education teachers’ well-being at work. Int. J. Hum. Sci. 2012, 9, 112–134. [Google Scholar]
  12. Corr, P.J.; DeYoung, C.G.; McNaughton, N. Motivation and personality: A neuropsychological perspective. Soc. Personal. Psychol. Compass 2013, 11, 158–175. [Google Scholar] [CrossRef]
  13. Bolduc, R.R. An Analysis of the Relationship between Quality of Work Life and Motivation for Correctional Services Officers in the Montreal Area. Ph.D. Thesis, McGill University, Montreal, QC, Canada, 2002, unpublished. [Google Scholar]
  14. Hall-Kenyon, K.M.; Bullough, R.V.; MacKay, K.L.; Marshall, E.E. Preschool teacher well-being: A review of the literature. Early Child. Educ. J. 2014, 42, 153–162. [Google Scholar] [CrossRef]
  15. Lambert, L. Building Leadership Capacity in Schools; Alexandria: North Glengarry, ON, Canada, 1998. [Google Scholar]
  16. Szabo, M. The Constructivist Leader; Teachers College Press: New York, NY, USA, 2002. [Google Scholar]
  17. Lambert, L. Leadership Capacity for Lasting School Improvement; Alexandria: North Glengarry, ON, Canada, 1998. [Google Scholar]
  18. Lambert, L. Lasting leadership: A study of high leadership capacity schools. Educ. Forum 2006, 7, 134–149. [Google Scholar] [CrossRef]
  19. Jiménez, P.; Winkler, B.; Bregenzer, A. Developing sustainable workplaces with leadership: Feedback about organizational working conditions to support leaders in health-promoting behavior. Sustainability 2017, 9, 1944. [Google Scholar] [CrossRef]
  20. Tetrick, L.E.; Peiró, J.M. Occupational Safety and Health; Oxford Press: Oxford, UK, 2012. [Google Scholar]
  21. Bush, T.; Middlewood, D. Leading and Managing People in Education; Sage: London, UK, 2005. [Google Scholar]
  22. Lashway, L. Distributed leadership. Res. Roundup 2003, 19, 1–12. [Google Scholar]
  23. Scribner, J.P.; Sawyer, R.K.; Watson, S.T.; Myers, V.L. Teacher teams and distributed leadership: A study of group discourse and collaboration. Educ. Adm. Q. 2007, 43, 67–100. [Google Scholar] [CrossRef]
  24. Tian, M. Distributed Leadership and Teachers’ Self-Efficacy: The Case Studies of Three Chinese Schools in Shanghai. Master’s Thesis, University of Jyväskylä, Jyväskylä, Finland, 2011, unpublished. [Google Scholar]
  25. Lizotte, J.O. A Qualitative Analysis of Distributed Leadership and Teacher Perspective of Principal Leadership Effectiveness. Ph.D. Thesis, Northeastern University, Boston, MA, USA, 2013, unpublished. [Google Scholar]
  26. Lumby, J. Distributed leadership: The uses and abuses of power. Educ. Manag. Adm. Leadersh. J. 2013, 41, 581–597. [Google Scholar] [CrossRef]
  27. Smith, L.M. Study of Teacher Engagement in Four Dimensions of Distributed Leadership in One School District in Georgi. Ph.D. Thesis, Georgia Southern University, Statesboro, GA, USA, 2017, unpublished. [Google Scholar]
  28. Tahir, L.M.; Lee, S.L.; Musah, M.B.; Jaffri, H.; Said, M.N.H.M.; Yasin, M.H.M. Challenges in distributed leadership: Evidence from the perspective pf head teachers. Int. J. Educ. Manag. 2015, 30, 848–863. [Google Scholar] [CrossRef]
  29. Hollaway, J.; Nielsen, A.; Saltmarsh, S. Prescribed distributed leadership in the era of accountability: The experiences of mentor teachers. Educ. Manag. Adm. Leadersh. 2018, 46, 538–555. [Google Scholar] [CrossRef]
  30. Harris, A. Distributed leadership: Friend or foe. Educ. Manag. Adm. Leadersh. 2013, 41, 545–554. [Google Scholar] [CrossRef]
  31. Ağirdaş, Y. Investigation of the Relationship between Distributed Leadership and Job Satisfaction on the Basis of Teachers’ Opinions in High Schools. Master’s Thesis, Okan University, Istanbul, Turkey, 2014, unpublished. [Google Scholar]
  32. Akyürek, M.İ. The Relationship between Primary School Principals’ Distributed Leadership Characteristics and Teachers’ Job Satisfaction Perceptions. Master’s Thesis, Gazi University, Ankara, Turkey, 2016, unpublished. [Google Scholar]
  33. Bozoğlu, O. Distributed Leadership Practices in Higher Education: An Action Research. Master’s Thesis, Kocaeli University, Kocaeli, Turkey, 2015. [Google Scholar]
  34. Harris, A.; Muijs, D. Improving Schools Through Teacher Leadership; Open University Press: London, UK, 2004. [Google Scholar]
  35. Eggen, D.D. Principals’ Perceptions of Distributed Leadership in an Elementary School Setting. Ph.D. Thesis, University of Northern Colorado, Greeley, CO, USA, 2010. [Google Scholar]
  36. Bush, T. Theories of Educational Leadership and Management; Sage: London, UK, 2011. [Google Scholar]
  37. Gronn, P. Where to next for educational leadership. Princ. Educ. Leadersh. Manag. 2010, 4, 70–86. [Google Scholar]
  38. Brundrett, M. What lies behind collegiality, legitimation or control? Educ. Manag. Adm. 2011, 3, 41–62. [Google Scholar] [CrossRef]
  39. Edge, K. A review of the empirical generations at work research. Manag. Theor. 2008, 6, 123–145. [Google Scholar]
  40. Tamer, E. Determining The Factors Affecting the Quality of Work Life and The Quality of Work Life of Nurses. Master’s Thesis, Karadeniz Technical University, Trabzon, Turkey, 2018. [Google Scholar]
  41. Cumming, T. Early childhood educators’ well-being: An updated review of the literature. Early Child. Educ. 2016, 19, 19–30. [Google Scholar] [CrossRef]
  42. Korkmaz, E.; Gündüz, H.B. Leadership behaviors showing levels of managers. Int. J. Educ. Hum. Sci. 2011, 2, 123–153. [Google Scholar]
  43. Can, E.; Gündüz, Y.; Işik Can, C. The Role of Committee Meetings in Teachers’ Participation in Management. In Proceedings of the 2nd International Conference on Interdisciplinary in Education, Kyrenia, Cyprus, 7 March 2013. [Google Scholar]
  44. Teachers’ Law. TRNC Official Gazette, 3 June 1985; 2–3.
  45. Özkan, M.; Çakir, C. Development of a distributed leadership scale. Int. J. Eurasia Soc. Sci. 2017, 8, 1629–1660. [Google Scholar]
  46. Van Laar, D.; Edwards, J.A.; Easton, S. The work related quality of life scale for healthcare workers. J. Clin. Nurs. 2007, 3, 325–333. [Google Scholar] [CrossRef]
  47. Akar, H.; Üstüner, M. Turkish adaptation of quality of work life scale: Validity and reliability study. J. İnönü Univ. Fac. Educ. 2017, 18, 159–176. [Google Scholar]
  48. Bulut, A. An Analysis of the Organizational Happiness Perceptions of Secondary School Teachers. Ph.D. Thesis, Gaziantep University, Gaziantep, Turkey, 2015, unpublished. [Google Scholar]
  49. Meydan, C.H.; Şeşen, H. Structural Equation Modeling: Amos Applications; Detay: Ankara, Turkey, 2015. [Google Scholar]
  50. Miles, M.B.; Huberman, A.M. Qualitative Data Analysis: An Expanded Sourcebook; Sage: New York, NY, USA, 1994. [Google Scholar]
  51. Hoyle, R.H. The Structural Equation Modeling Approach: Basic Concepts and Fundamental Issues; Sage: Thousand Oaks, CA, USA, 1995. [Google Scholar]
  52. Hu, L.; Bentler, P.M. Cut-off criteria for fit indexes in covariance structure analysis: Conventional criteria versus new alternatives. Struct. Equ. Model. A Multidiscip. J. 1999, 5, 1–55. [Google Scholar]
  53. Metin, M. Scientific Research Methods in Education: From Theory to Practice; Pegem: Ankara, Turkey, 2015. [Google Scholar]
  54. Byrne, B.M. Structural Equation Modelling with AMOS: Basic Concepts, Applications, and Programming; Routledge: New York, NY, USA, 2016. [Google Scholar]
  55. Tabachnick, B.G.; Fidell, L.S. Using Multivariate Statistics; Pearson: Boston, MA, USA, 2013. [Google Scholar]
  56. Petersonn, R.A.; Kim, Y. On the relationship between coefficient alpha and composite reliability. J. Appl. Psychol. 2013, 98, 194–198. [Google Scholar] [CrossRef] [PubMed]
  57. Bademci, V.A. A study on Kuder-Richardson 20, Cronbach’s Alpha, Hoyt’s analysis of variance, generalizability theory and measurement reliability. J. Ziya Gökalp Fac. Educ. 2011, 17, 173–193. [Google Scholar]
  58. Şimşek, Ö. Introduction to Structural Equation Modeling; Ekinoks: Ankara, Turkey, 2007. [Google Scholar]
  59. Seçer, İ. Psychological Test Development and Adaptation Process: SPSS and LISREL Applications; Ani: Ankara, Turkey, 2015. [Google Scholar]
  60. Çokluk, Ö.; Şekercioğlu, G.; Büyüköztürk, S. Multivariate Statistics for Social Sciences: P and LISREL Applications; Pegem: Ankara, Turkey, 2010. [Google Scholar]
  61. Sun, J. Assessing goodness of fit in confirmatory factor analysis. Meas. Eval. Couns. Dev. 2005, 37, 240–256. [Google Scholar] [CrossRef]
  62. Preacher, K.J.; Hayes, A.F. SPSS and SAS procedures for estimating indirect effects in simple mediation models. Behav. Res. Methods Instrum. Comput. 2004, 36, 717–731. [Google Scholar] [CrossRef] [PubMed] [Green Version]
  63. Ertong, C. Investigation of the Factors That Affects the Organizational Happiness of Teachers in Schools. Master’s Thesis, Gaziantep University, Gaziantep, Turkey, 2018. [Google Scholar]
  64. Proctor, C. Effective Organizational Communication Affects Employee Attitude, Happiness, and Job Satisfaction. Master’s Thesis, Southern Utah University, Cedar City, UT, USA, 2014. [Google Scholar]
  65. Moçoşoğlu, B.; Kaya, A. The relationship between organizational silence and organizational happiness levels of school administrators and teachers. Harran Maarif J. 2018, 3, 52–70. [Google Scholar] [CrossRef]
  66. Diddams, M.; Chang, G.C. Only human: Exploring the nature of weakness in authentic leadership. Leadersh. Q. 2012, 23, 593–603. [Google Scholar] [CrossRef]
  67. Widyastuti, U.; Maisaroh, W.; Parimita, W. Analysis of Factors in Quality of Work Life Faculty of Economics State University of Jakarta. In Proceedings of the 23rd International Business Research Conference, Melbourne, Australia, 18–20 November 2013. [Google Scholar]
  68. Jofreh, M.; Yasini, A.; Dehsorkhi, H.F. The relationship between EFL teachers’ quality of work life and job motivation. Educ. Leadersh. J. 2013, 5, 212–236. [Google Scholar]
  69. Yalçin, S.; Akan, D. Examining the relationship among the leadership styles of school administrators, teachers’ job quality and organizational commitment. Electron. J. Soc. Sci. 2016, 13, 1138–1156. [Google Scholar]
  70. Swathi, V.; Reddy, M. Implications of stress on quality of work life among teachers: An empirical study. IPE J. Manag. 2016, 6, 46–52. [Google Scholar]
  71. Spillane, J.P. Educational leadership. Educ. Eval. Policy Anal. 2003, 25, 343–346. [Google Scholar] [CrossRef]
  72. Hoy, W.K.; Miskel, C.G. Educational Administration; Random House: New York, NY, USA, 1974. [Google Scholar]
  73. Davis, M.W. Distributed Leadership and School Performance. Ph.D. Thesis, George Washington University, Washington, DC, USA, 2009. [Google Scholar]
  74. Louis, K.S.; Murphy, J.F. Trust, caring and organizational learning: The leader’s role. J. Educ. Adm. 2017, 55, 103–127. [Google Scholar] [CrossRef]
  75. Luthans, F.; Luthans, K.W.; Luthans, B.C. Positive Psychological Capital: Beyond Human and Social Capital; Routhledge: New York, NY, USA, 2004. [Google Scholar]
  76. Moos, L.; Krejsler, J.; Kofod, K.K. Successful Principals: Telling or Selling? On The Importance of Context for School Leadership. Int. J. Leadersh. Educ. 2008, 11, 341–352. [Google Scholar] [CrossRef]
  77. Murphy, J.F.; Louis, K.S. Positive School Leadership: Building Capacity and Strengthening Relationships; Teachers College Record: New York, NY, USA, 2008. [Google Scholar]
Figure 1. Structural model for the direct relationship between DL (distributed leadership) and QWL (quality of work life).
Sustainability 11 05489 g001
Figure 2. The full mediating role of OH (organizational happiness) on the relationship between DL (distributed leadership) and QWL (quality of work life).
Sustainability 11 05489 g002
Table 1. Descriptive statistics of the research universe.
Age Gender Education Level
FrequencyPercentageFrequencyPercentageFrequencyPercentage
21–305928.4Female15976.4Associate41.9
31–408138.9Male4923.6Undergraduate16981.3
41–505024.0 Graduate3516.8
51 +188.7
Total208100.0Total208100.0Total208100.0
Table 2. Descriptive statistics about the research universe and the school principals participating in the research.
Graduated School Teaching Experience Management Experience as School Principal
FrequencyPercentageFrequencyPercentageFrequencyPercentage
ATTA15273.11–5 years2411.51–5 years216.7
Private University in TRNC3416.36–10 years5526.46–10 years433.3
Private University in Turkey2210.611–15 years4823.111–15 years433.3
16–20 years3918.816 + 216.7
21–25 years2713.0
26+157.2
Total208100.0Total208100.0Total1210.0
Table 3. Descriptive statistics and correlation coefficients among observed variables.
12345678910111213141516
Distributed Leadership
1. Formal structure
2. Purpose union0.862 **
3. Collaboration and trust0.402 **0.457 **
4. Sharing responsibility0.328 **0.371 **0.816 **
5. Incentive and initiative0.421**0.471**0.0690.816**
Quality of work life
6. Job and career satisfaction0.661 **0.650 **0.139 *0.0690.198 **
7. General well-being0.575 **0.632 **0.283 **0.139 *0.323 **0.725 **
8. Control at work0.250 **0.272 **0.245 **0.283 **0.356 **0.401 **0.546 **
9. Stress at work0.312 **0.386 **0.0010.245 **0.367 **0.520 **0.617 **0.733 **
10. Working conditions0.176 *0.238 **0.3020.0400.1040.345 **0.538 **0.388 **0.414 **
11. Home–work interface0.254 **0.348 **0.193 **0.193 **0.261 **0.390 **0.581 **0.618 **0.651 **0.518 **
Organizational happiness
12. Management processes0.656 **0.690 **0.281 **0.281 **0.487 **0.718 **0.750 **0.510 **0.603 **0.315 **0.453 **
13. Professional attitude0.692 **0.642 **0.293 **0.293 **0.432 **0.729 **0.570 **0.280 **0.390 **0.249 **0.242 **0.684 **
14. Communication at work0.484 **0.490 **0.389 **0.389 **0.495 **0.515 **0.411 **0.284 **0.330 **0.209 **0.202 **0.546 **0.801 **
15. Dedication0.514 **0.479 **0.374 **0.374 **0.477 **0.560 **0.517 **0.431 **0.406 **0.340 **0.373 **0.615 **0.770 **0.776 **
16. Economic conditions−0.282 **−0.265 **−0.139 *−0.139 *−0.135 *−0.250 **−0.248 **0.021−0.115−0.129*−0.081−0.251 **0.341 **−0.320 **2.31
Mean3.813.674.053.833.924.084.053.894.024.053.954.144.294.294.163.12
Standard deviation0.740.780.690.660.660.730.650.650.610.720.700.610.620.600.650.74
Notes: * p < 0.05, ** p < 0.01.
Table 4. Normality test.
Observed VariableSkewnessc.r.Kurtosisc.r.
QWL- Job and career satisfaction−1.065−5.6871.3453.590
QWL- General well-being–0.403–2.150–0.489–1.306
QWL- Control at work–0.298–1.592–0.149–0.398
QWL- Stress at work–0.368–1.9660.0930.249
QWL- Working conditions–0.453–2.418–0.521–1.392
QWL- Home–work interface–0.329–1.759–0.334–0.891
OH- Management processes–0.702–3.7460.5991.600
OH- Communication at work–0.442–2.359–0.480–1.282
OH- Dedication–0.315–1.682–0.865–2.310
OH- Economic conditions–0.206–1.098–0.768–2.050
OH- Professional attitude–0.591–3.155–0.550–1.468
DL- Formal structure–1.018–5.4350.9062.419
DL- Purpose union–0.791–4.2240.3730.995
DL- Collaboration and trust–0.682–3.640–0.347–0.927
DL- Sharing responsibility–0.382–2.037–0.317–0.846
DL- Incentive and initiative–0.562–2.998–0.285–0.762
Multivariate 12.4782.303
Table 5. Reliability test scores.
Distributed Leadership Scale
Factors
Cronbach’s Alpha Composite Reliability Split-Half Reliability
DL- Formal structure0.872
DL- Purpose union0.926
DL- Collaboration and trust0.904
DL- Sharing responsibility0.841
DL- Incentive and initiative0.918
DL- Total0.910 0.880
Quality of work life scale Factors
QWL- Job and career satisfaction0.936
QWL- General well-being0.776
QWL- Control at work0.725
QWL- Stress at work0.809
QWL- Working conditions0.918
QWL- Home–work interface 0.782
QWL- Total0.930 0.853
Organizational happiness scaleFactors
OH- Management processes0.939
OH- Professional attitude0.949
OH- Communication at work0.941
OH- Dedication0.880
OH- Economic conditions 0.855
OH- Total0.940 0.894
Table 6. The goodness of fit indices of the measurement models.
The Goodness of Fit IndicesGood FitAcceptable FitOH Scale ValuesQWL Scale ValuesDL Scale Values
Χ2/df0 ≤χ2/df ≤ 22 ≤ χ2/df ≤ 371.512/56=1.277259.375/122=2.126312.538/141= 2.211
RMSEA0 ≤ RMSEA ≤ 0.050.05 ≤ RMSEA ≤ 0.100.0190.0310.033
SRMR 0 ≤ SRMR ≤ 0.050.05 ≤ SRMR ≤ 0.100.0280.0390.048
NFI0.95 ≤ NFI ≤ 1.000.90 ≤ NFI ≤ 0.950.9770.9630.953
NNFI0.97 ≤ NNFI ≤ 1.000.95 ≤ NNFI ≤ 0.970.9870.9780.973
CFIGFI0.95 ≤ CFI ≤ 1.000.95 ≤ GFI ≤ 1.000.90 ≤ CFI ≤ 0.950.90 ≤ GFI ≤ 0.950.9700.9790.9610.9750.9490.973
Table 7. The goodness of fit indices of the structural model.
The Goodness of Fit IndicesGood FitAcceptable FitModel Values
Χ2/df0 ≤χ2/df ≤ 22 ≤ χ2/df ≤ 3442.950/150 = 2.953
RMSEA0 ≤ RMSEA ≤ 0.050.05 ≤ RMSEA ≤ 0.100.071
SRMR0 ≤ SRMR ≤ 0.050.05 ≤ SRMR ≤ 0.100.061
NFI0.95 ≤ NFI ≤ 1.000.90 ≤ NFI ≤ 0.950.911
NNFI0.97 ≤ NNFI ≤ 1.000.95 ≤ NNFI ≤ 0.970.958
CFIGFI0.95 ≤ CFI ≤ 1.00
0.95 ≤ CFI ≤ 1.00
0.90 ≤ CFI ≤ 0.95
0.90 ≤ GFI ≤ 0.95
0.924
0.913
Table 8. Test results of full mediation effect: The mediating role of OH (organizational happiness) on the relationship between DL (distributed leadership) and QWL (quality of work life).
CoefficientS.E.T-ValueLowerUpper
Direct Effect
DL→QWL−0.030 n.s.0.02−0.348
DL→OH0.598 ***0.0318.270
OH→QWL0.693 ***0.0216.628
Indirect effect
DL→OH→ QWL0.415 **0.023.2460.2750.549
Notes:*** p ≤ 0.001,** p ≤ 0.01,* p ≤ 0.05 n.s.: not significant.

