Article

Reform of Chinese Universities in the Context of Sustainable Development: Teacher Evaluation and Improvement Based on Hybrid Multiple Criteria Decision-Making Model

1
Department of Information and Finance Management, National Taipei University of Technology, Taipei 10608, Taiwan
2
Department of Industrial Engineering and Management, National Taipei University of Technology, 1, Sec. 3, Zhongxiao E. Rd., Taipei 10608, Taiwan
*
Author to whom correspondence should be addressed.
Sustainability 2019, 11(19), 5471; https://doi.org/10.3390/su11195471
Submission received: 13 July 2019 / Revised: 28 September 2019 / Accepted: 29 September 2019 / Published: 2 October 2019
(This article belongs to the Special Issue Sustainability Assessment in Higher Education Institutions)

Abstract

:
China is pushing universities to implement reforms in order to achieve the sustainable development goals, but with the development level of teachers becoming the key restricting factor. In this sense, teacher evaluation and improvement act as positive factors for China to achieve the 2030 sustainable development goals. Previous studies on teacher evaluation have usually assumed that the relationship between the evaluation criteria is independent, with the weights of each standard derived from this assumption. However, this assumption is often not in line with the actual situation. Decisions based on these studies are likely to waste resources and may negatively impact the efficiency and effectiveness of teachers’ sustainable development. This study developed an integrated model for the evaluation and improvement of teachers based on the official teacher evaluation criteria of China’s International Scholarly Exchange Curriculum (ISEC) programme and a multiple criteria decision-making methodology. First, a decision-making trial and a laboratory-based analytical network process were used to establish an influential network-relation diagram (INRD) and influential weights under ISEC standards. Next, an important performance analysis was used to integrate the weight and performance of each standard to produce a worst-performance criterion set for each university teacher. Finally, the worst performance set used an INRD to derive an improvement strategy with a cause–effect relationship for each teacher. This study chose a Chinese university that has implemented teaching reform for our case study. The results show that our developed model can assist decision-makers to improve their current evaluations of teachers and to provide a cause–effect improvement strategy for education reform committees and higher education institutions.

1. Introduction

Education is crucial to sustainable development. The action plan entitled ‘Transforming our World: The 2030 Agenda for Sustainable Development’ jointly concluded among 193 countries was released at the World Summit on Sustainable Development in September 2015 [1]. Since then, the goal of sustainable development has become a new goal of global development. One of the goals in the agenda is about ensuring inclusive and equitable quality education and lifelong learning opportunities for all [2,3]. The Talloires Declaration announced in 1990 pioneered the inclusion of sustainable development in higher education, highlighting the role of higher educational institutions in promoting global sustainable development [3]. The higher educational institutions subsequently began to shoulder the task of training human resources with the vision of sustainable development. Following the identification of the Global Education Roadmap 2030 at the World Education Forum 2015, the Global Action Program on Education for Sustainable Development was launched. Sustainable development and education for sustainable development thus gained stronger momentum to be promoted worldwide [4]. According to UNESCO, education for sustainable development can guarantee the future of the economy, the environment, and society. To achieve the goal, universities are undergoing teaching and research reforms [5]. China published the National Plan on Implementation of the 2030 Agenda for Sustainable Development in September 2016. The Plan conveyed China’s resolution to advance the said 2030 Agenda [6]. A sub-plan was proposed to fulfil the educational development goal, further facilitating the reform of China’s higher educational institutions from the perspective of sustainable development. In 2019, China’s Ministry of Education (MOE) came up with the plan to develop nearly 10,000 national top and 10,000 provincial top majors for the undergraduates, thus boosting the reform of teaching activities in higher education institutions [7].
Teachers play a fundamental role in the reforms [3,8]. While higher education institutions are carrying out reforms in response to the goal of sustainable development, sustainability-based teaching activities pose new challenges to teachers at universities. The Teaching Staff Development Plan is a feasible approach to accelerating the integration of education for sustainable development [5,9]. For China’s universities, particularly the regional ones (i.e., universities established by governments under the provincial level), the quality of teachers has become a key obstacle to reform. Therefore, in 2018, the Action Program to Rejuvenate Education for the Teaching Staff 2018–2022 was released by five ministries in China, including the MOE [10]. In this context, regional universities began to invest heavily in the training and re-education of the teaching staff, in the hope that they would stand out in the competition that takes sustainable development as its goal.
However, a key defect with China’s higher education is the lack of, and uneven distribution of sufficient quality education resources [11,12]. At the same time, existing education resources have not been fully leveraged yet [13,14]. Among such resources, there is an important issue of university teacher development wherein massive amounts of invested resources are inefficiently used. Unless addressed properly, this issue would hinder universities in China from realizing the goal of education for sustainable development. If teacher evaluations can identify the core reasons why and where they perform poorly before resources are invested in specific areas, the information can be used to effectively improve the resource investment and use rate in Chinese universities. To solve this problem, a subsidiary department of the Chinese MOE developed the International Scholarly Exchange Curriculum (ISEC) program based on the directive of “globalizing education to deepen reforms in higher education”. University teacher evaluation and improvement is part of the ISEC program, where the assessment criteria of university teachers are also known as the ISEC standard in this study.
Teacher evaluation as a management tool of education aims to facilitate the growth of the teaching staff [15,16,17,18] and are within the scope of multiple criteria decision-making (MCDM). For example, Ghosh [19] combined the analytic hierarchy process (AHP) and the technique for order of preference by similarity to ideal solution (TOPSIS) in order to evaluate faculty performance in engineering education. Pavani et al. [20] developed an expert-based group model for evaluating teacher performance using fuzzy AHP and TOPSIS. Xu et al. [21] evaluated teaching performance on a smart campus. Wang et al. [22] proposed a hybrid model for classroom teaching performance based on TOPSIS and the triangle fuzzy number. These studies provided valuable contributions to teacher evaluations. However, the relationships among the criteria in these models are independent and do not reflect real conditions. To address this issue, the suggestions for teacher improvement provided by these MCDM models are often directed toward the improvement of poor performance, but the factors that lead to poor performance may not always be addressed by these improvement strategies. As the Chinese proverb goes, “treat the head when the head aches, treat the foot when the foot hurts”. Thus, the improvement of the teaching capacity is not satisfactory, resulting in resource wastage and scarcity.
To address this issue, the study combined the MCDM with the teacher evaluation standards adopted by ISEC in order to create a new evaluation model. First, the evaluation model is the use of China’s ISEC standards. These standards in China constitute the practical application of ISEC teachers to choose and improve problems. Based on the ISEC standards, the decision-making trial and evaluation laboratory (DEMATEL)-based analytic network process (ANP; together DANP) was then used to establish an influential network-relation diagram (INRD), and subsequently to obtain the influential weights within ISEC standards. The derived INRD has been proven to be an effective tool to explore the cause and effect relations in many papers [23,24,25,26,27]. Second, the importance-performance analysis (IPA) was used to combine the influential weights and performance of attributes, and to capture a set of criteria for identifying where each teacher performs worst. Finally, decision-makers can use the INRD to focus on the causation of poor performance to determine the actual factors related to each teacher’s performance, and to prioritise a direction for improvement. The integrated model of DEMATEL and IPA methods has been successfully applied to different studies [28,29,30,31,32]. The model focuses on analyzing the factors influencing poor teacher performance according to certain criteria with the intention of using fewer but more focused resources to produce effective improvements. This method provides a new mechanism for the sustainable development of university teachers based on evaluations and also supplements the inadequacies of the existing studies to a certain degree.
In this study, empirical data from 15 domain experts from the ISEC management institute were applied to demonstrate our proposed model. The results show that “Professional ethics and literacy (C1)” is the primary influential standard and “Teacher ability and development (C2)” has the highest influential weight. Teachers A and B both performed poorly in “Teaching performance (C31)” and “Research cooperation (C32)”. In other words, teachers A and B must improve their performance in these two standards. According to traditional performance improvement strategies, the ISEC management institute should invest resources in encouraging teachers to publish their teaching results and promote research cooperation among teachers. In practice, teacher A and teacher B enjoy the same training and development resources. However, the essential causes of their under-performance vary, which, accordingly, requires different training resources. This phenomenon reveals the issue of the untargeted allocation of teaching staff development resources in the reform of China’s universities.
The rest of this paper is structured as follows. Section 2 provides a brief introduction of current teacher evaluations and outlines the literature documenting research methods. Section 3 introduces the DANP and IPA methods used in our new model. Section 4 details the implementation of ISEC topics in this model. Section 5 discusses the results and features of the model, and Section 6 summarizes our contributions and directions for future research.

2. Review of University Teacher Evaluation Models

The previous university teacher evaluation models can be roughly divided into three research stages: (1) the selection of appropriate criteria in the evaluation model, (2) building the decision-making model using the MCDM methodology, and (3) building the decision-making model using statistical or data analysis methodologies.

2.1. Selection of Appropriate Criteria in the Evaluation Model

This stage of research is focused on the selection of subjective and objective indicators in an evaluation model. Contradictions and conflicts exist between indicators, such as encouraging teacher vision and personal development versus increasing wages, and between objective evaluation results and critical feedback [33,34,35]. For example, when Mills and Hyles [36] evaluated university teachers at Oklahoma State University’s Stillwater College (Stillwater, OK, USA), the results provided limited feedback and drawbacks included scattered goals, unclear standards, and inconsistencies in management perspectives. Based on this, they used interviews and surveys to understand opinions on teacher evaluations, and their development process established a consolidated solution with a hierarchical architecture that integrated goals, directions, and procedures for annual performance evaluations. For this reason, some studies began to explore the establishment of more reasonable evaluation indicators and weights. For example, Desselle et al. [37] studied university teacher evaluation systems at Duquesne University’s Mylan School of Pharmacy (Stillwater, OK, USA). They used a modified Delphi procedure to confirm 29 teaching activities and 44 academic actions, including their weights, in an evaluation standard. Filipe et al. [38] provided guidelines for avoiding conflict between processes and goals by developing a message management system to evaluate teaching activity—however, they encountered difficulties similar to those of previous studies due to differing interpretations of how to implement and assess teaching. Subjective indicators are an inevitable aspect of the assessment process, creating ambiguity that hinders the transparency and fairness of teaching performance assessments. However, some studies have shifted from subjective indicators that rely on the evaluator (e.g., enthusiasm for one’s work) to relatively objective indicators (e.g., the number of reference papers). Although this can prevent fuzziness due to subjectivity, it results in fewer facets of evaluation that cannot fully reflect a teacher’s true performance level [39,40,41]. Based on these lessons, others have proposed to combine decision analysis models with objective and subjective indicators or mathematical programming models, but they often lack real-time scoring systems based on theoretical rationality or have weight settings that vary depending on the evaluator’s subjectivity. This neglects the principle of value trade-off and results in a total evaluation score that may have no substance or value. Using a methodology for systematic decision modelling to establish the factors and their weights in an evaluation system is a key problem that remains unsolved [42,43,44].

2.2. Building Decision-Making Models Using MCDM Methodology

The MCDM is specifically applied to solve evaluative decision-making problems with multiple criteria, i.e., evaluation, selection, and improvement problems. Some researchers have used MCDM methods to build decision models. For example, Ghosh [29] used AHP and TOPSIS to review teacher evaluations in engineering schools. Filipe et al. [38] developed a multi-criteria information system to review teaching practices. Hein et al. [45] used tools such as consensus theory, information entropy, and TOPSIS to construct a multi-criteria decision analysis method to evaluate 56 university professors. However, people’s representations of their opinions with regard to objects or events, in reality, contain fuzziness. Therefore, some scholars have developed various fuzzy-based MCDM models. For example, Chen et al. [46] proposed a framework for teaching evaluation based on a combination of fuzzy AHP and fuzzy comprehensive evaluation methods. Chang and Wang [47] proposed a type of multi-criteria decision-making model oriented toward teachers in an attempt to solve the issues of pervasive subjectivity, imprecision, and fuzziness within the faculty. Dey Mondal and Ghosh [48] used AHP, fuzzy AHP, complex proportional assessment of alternatives with grey relations (COPRAS), and TOPSIS in combination with game theory and compromise planning methods in MCDM to evaluate the performance level of teachers. These models provide decision-makers with a simple and easy-to-use method for evaluating and selecting university teachers. However, in these models, decision-making is based on independent relationships among criteria that cannot provide decision-makers with suitable systemic improvement strategies for all university teachers.

2.3. Building Decision-Making Models Using Statistical or Data Analysis Methodologies

The last research stage has involved overcoming the fuzzy defects of these MCDM models that use statistical or data analysis methods to construct decision-making models. For example, Nikolaidis and Dimitriadis [49] established a framework based on statistical quality control to use student feedback to a maximum degree. Lyde et al. [50] used a multisource method for evaluation (MME) and improved constraints such as the timing of reflections, accountability from year to year, and mentoring in order to construct a more comprehensive formative teaching assessment tool. Bi [51] evaluated five years of teaching at a management school of a university by creating a mean and standard deviation diagram based on statistical process control theory. Xu et al. [31] used principal component analysis (PCA) to calculate and identify six primary components and then used AHP to calculate the weight of each hierarchy before using grey correlation to improve the TOPSIS target decision analysis algorithm to avoid errors in decision-making due to subjective factors. These models offer a perspective on data behaviour as a basis for decision-making, but they rely on massive amounts of data and are unable to provide decision-makers with causal influence relationships affecting teacher performance.

2.4. Research Gaps in Their Decision-Making Models

Past decision-making models presented different contributions to teacher evaluation, selection, and improvement problems. However, these MCDM models have a major defect in that the relationship between criteria in the evaluation model is independent. Therefore, current MCDM models cannot help decision-makers to obtain a guide for the performance improvement of each teacher. To fill the research gap, this study developed a novel MCDM model that uses the DANP method to construct the INRD and influential weights for criteria and the IPA method to search the worst performances of criteria for each teacher. The detailed modelling process and its corresponding method are described in Section 3. The comparison of the three categories of decision-making models is shown in Table 1.

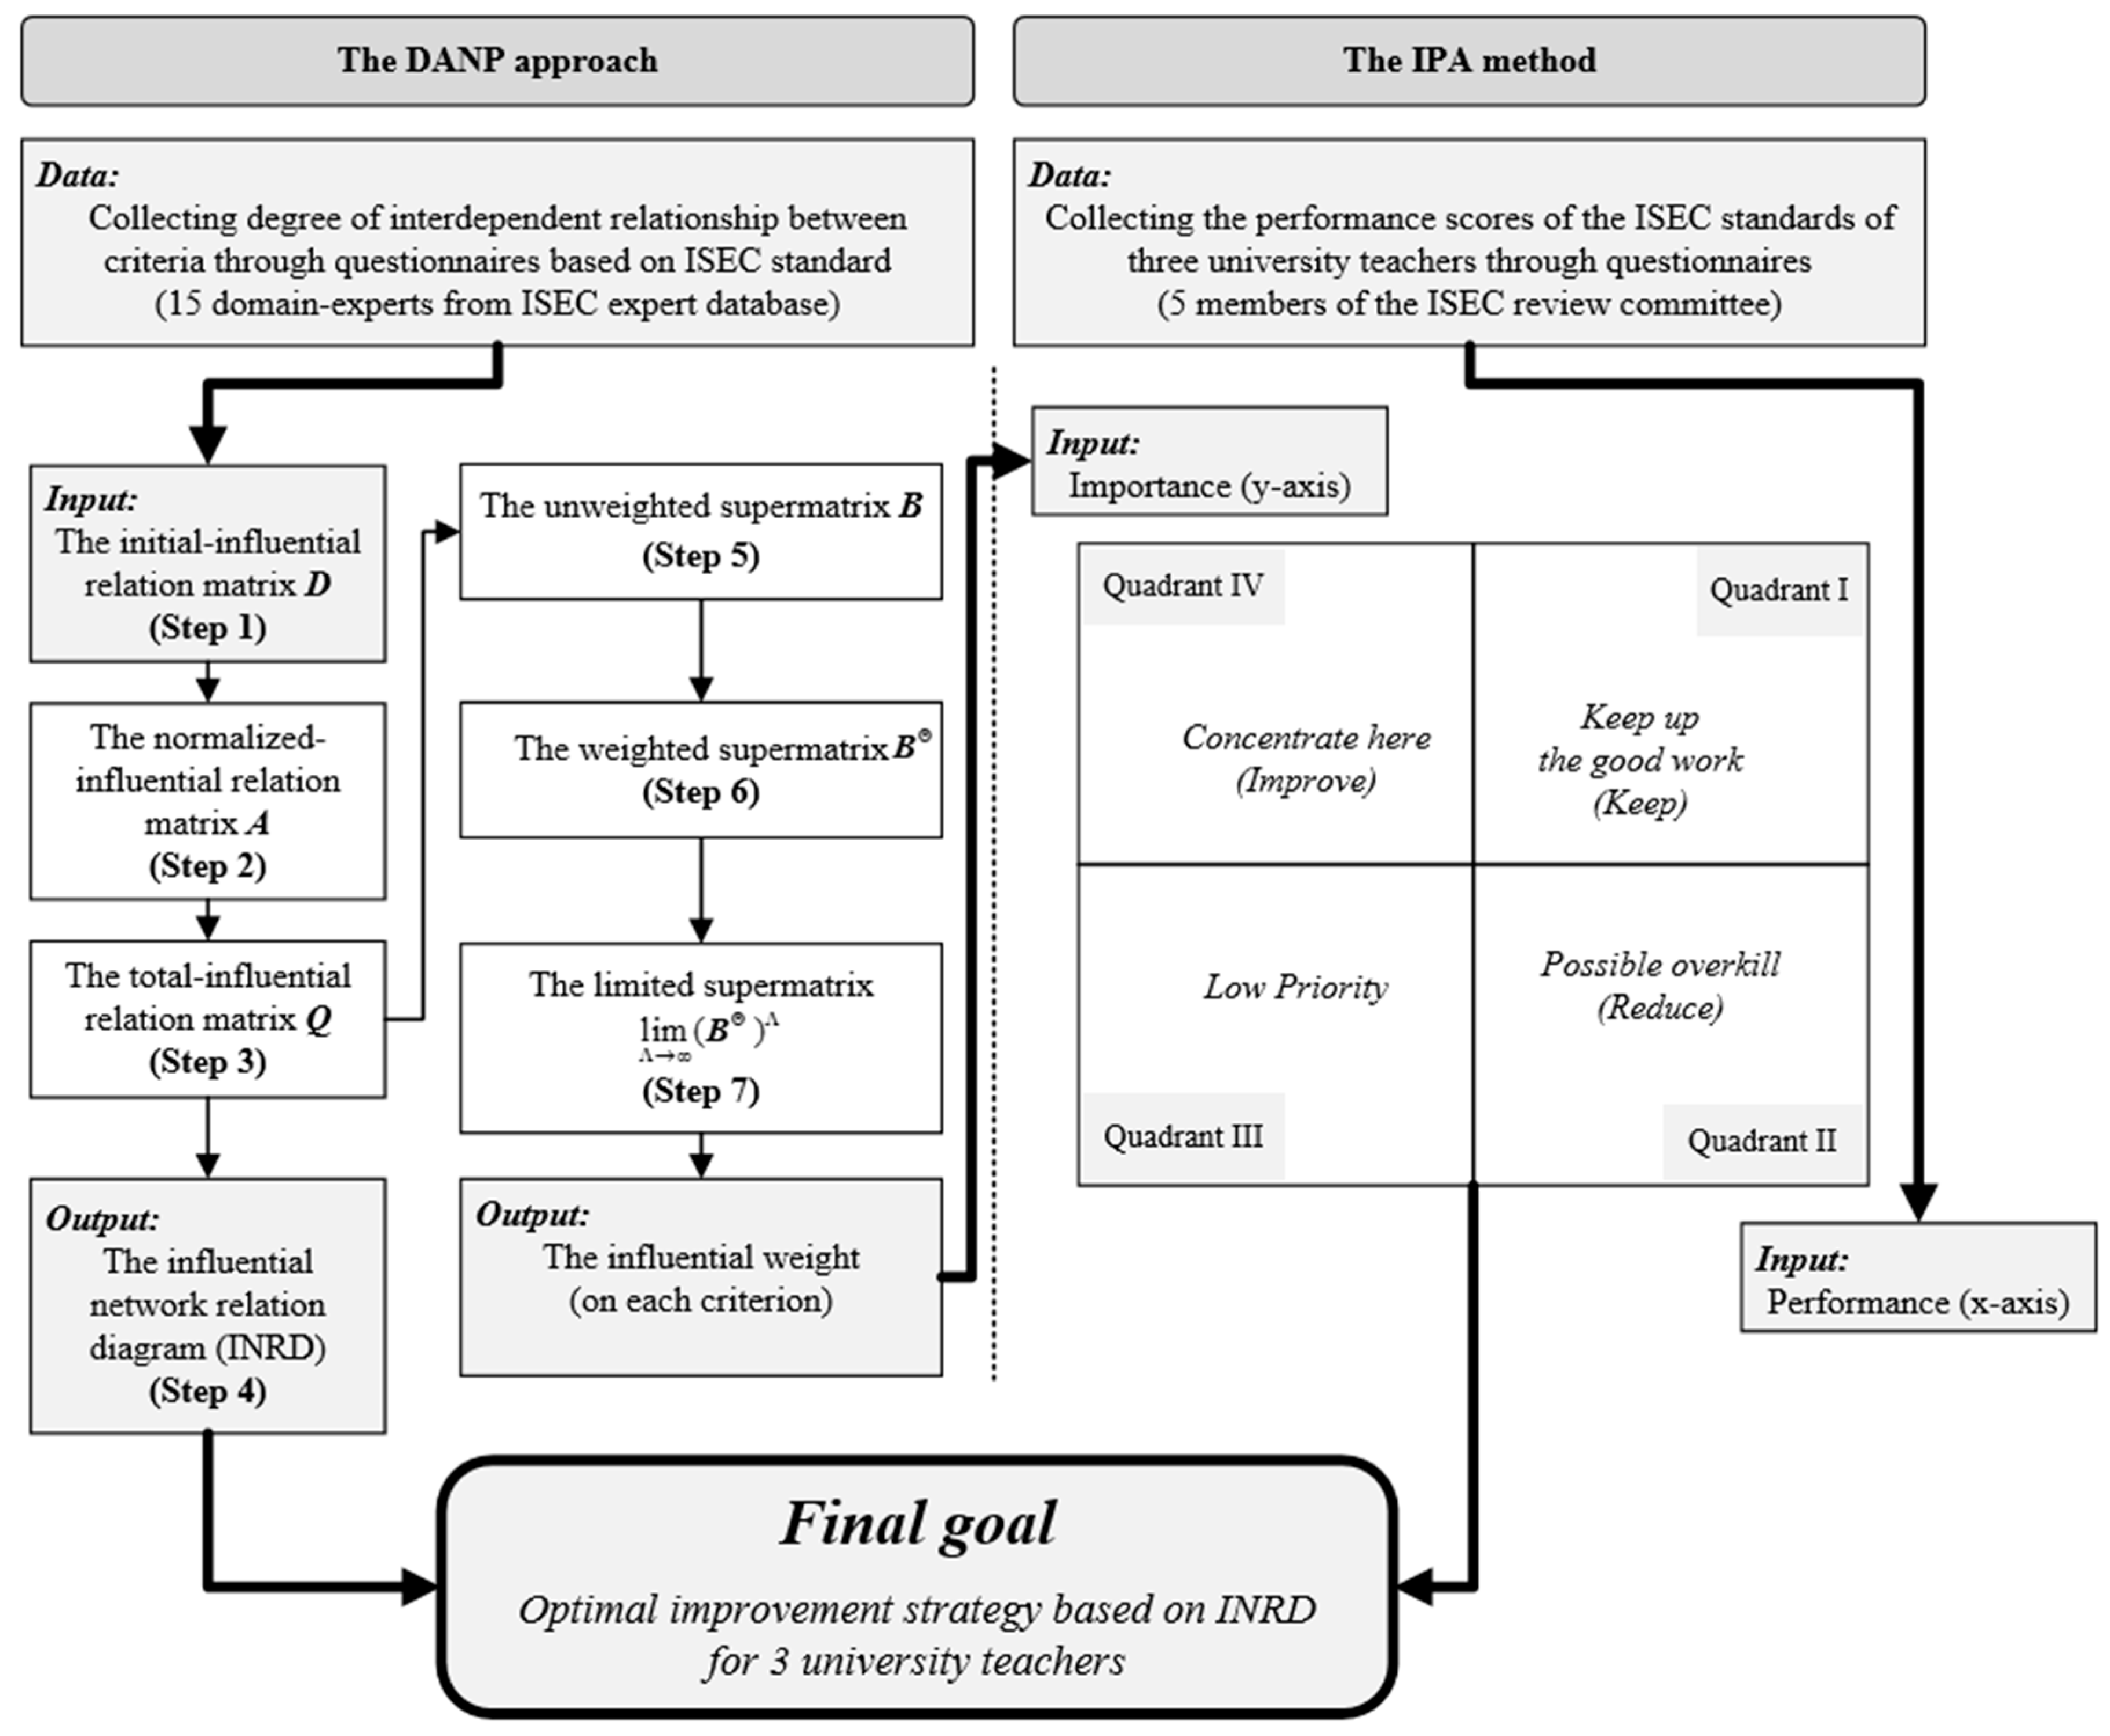
3. Our Proposed Hybrid DANP-IPA Model

This study developed an integrated hybrid MCDM model that combines the DANP method and IPA analysis. The former can be used to derive the influential network-relationship diagram (INRD) and influential weights that can help decision-makers to understand the cause-effect direction based on a systemic perspective. The latter can help decision-makers to easily capture the worst performance of each teacher in all attributes. Finally, the worst performance attributes of each teacher can be based on the INRM to develop a series of the most appropriate improvement strategies. The modelling flow diagram and corresponding methods of this hybrid DANP-IPA model are depicted in Figure 1.

3.1. DANP Method

The DANP method was developed by Lee et al. [52] by combining the DEMATEL technique [53] and the ANP method [54]. The DANP method retains interdependent relationships among criteria and further derives an influential network-relation diagram (INRD) and influential weights for all criteria. The INRD established by the DANP method can help to form decision-making equations for various systemic plans to improve alternative/objective performance after evaluation [55]. Based on this advantage, the method has been applied in many areas, such as public open space development [56], creative communities [57], quality of life [58], supplier management [59], airline performance [60], green buildings [61], and international airports [62]. The detailed steps in the DANP calculation are as follows.
Step 1: Build an initial influence–relationship matrix.
For an evaluation criteria model, respondents assess the degree of influence between criteria using a pairwise comparison based on a five-point Likert scale (ranging from 0 = “no influence” to 4 = “extremely high influence”). Then, the influential matrices of all respondents are integrated into a matrix by averaging to produce the initial influence relationship matrix D. Matrix D represents the actual experience within the group of all respondents:
D = [ ( Θ = 1 n c i j Θ ) / α ] n × n
where c i j Θ is the result of the respondent Θ , indicating the degree of influence between criteria i and j; α is the total number of respondents, and n is the total number of criteria.
Step 2: Derive a normalized influence–relationship matrix.
The initial–influence relationship matrix D derives a normalized influence-relationship matrix A using Equations (2) and (3), in which all diagonal terms are 0 and the maximum sum of a row or column is 1:
ρ = max i , j [ max i j = 1 n d i j , max j i = 1 n d i j ]
A = C / ρ
where ρ is the maximum value of the sum of a row or column.
Step 3: Obtain a total influence–relationship matrix.
Matrix A calculates and adds the influence degree of each iteration through the Markov chain process and produces a total influence relation matrix Q, as shown in Equation (4):
Q = A + A 2 + + A δ = A ( I A ) 1 ,   when   lim δ A δ = [ 0 ] n × n
Step 4. Build an influential network–relationship diagram (INRD).
First, the sum of each row and column can obtain vectors u i and v i through Equations (5) and (6). Then, ( u i + v i ) is the total strength of influences given and received, or prominence, as shown in Equation (7). Otherwise, ( u i v i ) is the net influence degree between given and received influences, also called the cause/effect. A positive cause/effect value indicates that factor i affects other factors and belongs to the cause group; if the value is negative, factor i is affected by other factors and belongs to the effect group. Finally, the INRD is established based on the vectors of prominence and cause/effect:
u i = ( u i ) n × 1 = [ j = 1 n q i j ] n × 1 ,     i { 1 , 2 , , n }
v i = ( v j ) 1 × n = [ i = 1 n q i j ] 1 × n ,     j { 1 , 2 , , n }
where denotes transposition, u i indicates the sum of direct and indirect effects of the factor i on the other factors, and v i indicates the sum of direct and indirect effects factor i received from the other factors.
Step 5: Transfer to an unweighted supermatrix.
First, the total influence–relation matrix Q can be divided into two matrices: the attribute level Q C and the dimension level Q D . Second, each row within a dimension in the total influence relation matrix Q C uses Equations (7)–(9) to obtain the normalized total influence relation matrix Q C ρ , as shown in Equation (7), in which Q C ρ 11 is an example to demonstrate the basic concept of normalizing, as shown in Equations (8) and (9).
Q C ρ = D 1 D j D m c 11 c 1 m 1 c j 1 c j m j c m 1 c m m m D 1 D i D m c 11 c 12 c 1 m 1 c i 1 c i 2 c i m i c m 1 c m 2 c m m m [ Q c ρ 11 Q c ρ 1 j Q c ρ 1 m Q c ρ i 1 Q c ρ i j Q c ρ i m Q c ρ m 1 Q c ρ m j Q c ρ m m ] n × n | m < n , j = 1 m m j = n
q i 11 = j = 1 m 1 q i j 11 , i = 1 , 2 , , m 1
Q C ρ 11 = [ q 11 11 / q 1 11 q 1 j 11 / q 1 11 q 1 m 1 11 / q 1 11 q i 1 11 / q i 11 q i j 11 / q i 11 q i m 1 11 / q i 11 q m 1 1 11 / q m 1 11 q m 1 j 11 / q m 1 11 q m 1 m 1 11 / q m 1 11 ] = [ q 11 ρ 11 q 1 j α 11 q 1 m 1 α 11 q i 1 α 11 q i j α 11 q i m 1 α 11 q m 1 1 α 11 q m 1 j α 11 q m 1 m 1 α 11 ]
Lastly, the normalized influence relation matrix Q c ρ is transposed to obtain the unweighted supermatrix B = ( Q c ρ ) , as shown in Equation (10):
B = ( Q C ρ ) = D 1 D i D m c 11 c 1 m 1 c i 1 c i m i c m 1 c m m m D 1 D j D m c 11 c 12 c 1 m 1 c j 1 c j 2 c j m j c i 1 c i 2 c m m m [ B 11 B i 1 B m 1 B 1 j B i j B m j B 1 m B i n B m m ] n × n | m < n , j = 1 m m j = n
Step 6: Obtain a weighted supermatrix.
Each row within the goal in the total influence–relation matrix Q D uses Equations (11)–(13) to obtain the normalized total influence relation matrix Q D ρ , as shown in Equation (11). Matrices Q C ρ and Q D ρ produce a new matrix through Equation (14), the weighted supermatrix B Θ :
Q D = [ q 11 q 1 j q 1 m q i 1 q i j q i m q m 1 q m j q m m ] m × m
d i = j = 1 m q D i j , i = 1 , 2 , , m   and   q D ρ i j = q D i j / d i , j = 1 , 2 , , m
W = ( Q D ρ ) = [ f D 11 / d 1 f D 1 j / d 1 f D 1 m / d 1 f D i 1 / d i f D i j / d i f D i m / d i f D m 1 / d m f D m j / d m f D m m / d m ] m × m = [ f D ρ 11 f D ρ 1 j f D α 1 m f D ρ i 1 f D ρ i j f D ρ i m f D ρ m 1 f D ρ m j f D ρ m m ] m × m
B Θ = W × B = [ q D ρ 11 × B 11 q D ρ i 1 × B i 1 q D ρ m 1 × B m 1 q D ρ 1 j × B 1 j q D ρ i j × B i j q D ρ m j × B m j q D ρ 1 m × B 1 m q D ρ i m × B i m q D ρ m m × B m m ]
Step 7: Limit the weighted supermatrix and derive the influential weights.
The weighted supermatrix B Θ convergences the influence degree of each time through the Markov chain process and finally obtains the influential weights for all criteria/dimensions, as shown in Equation (15).
lim Λ ( B Θ ) Λ

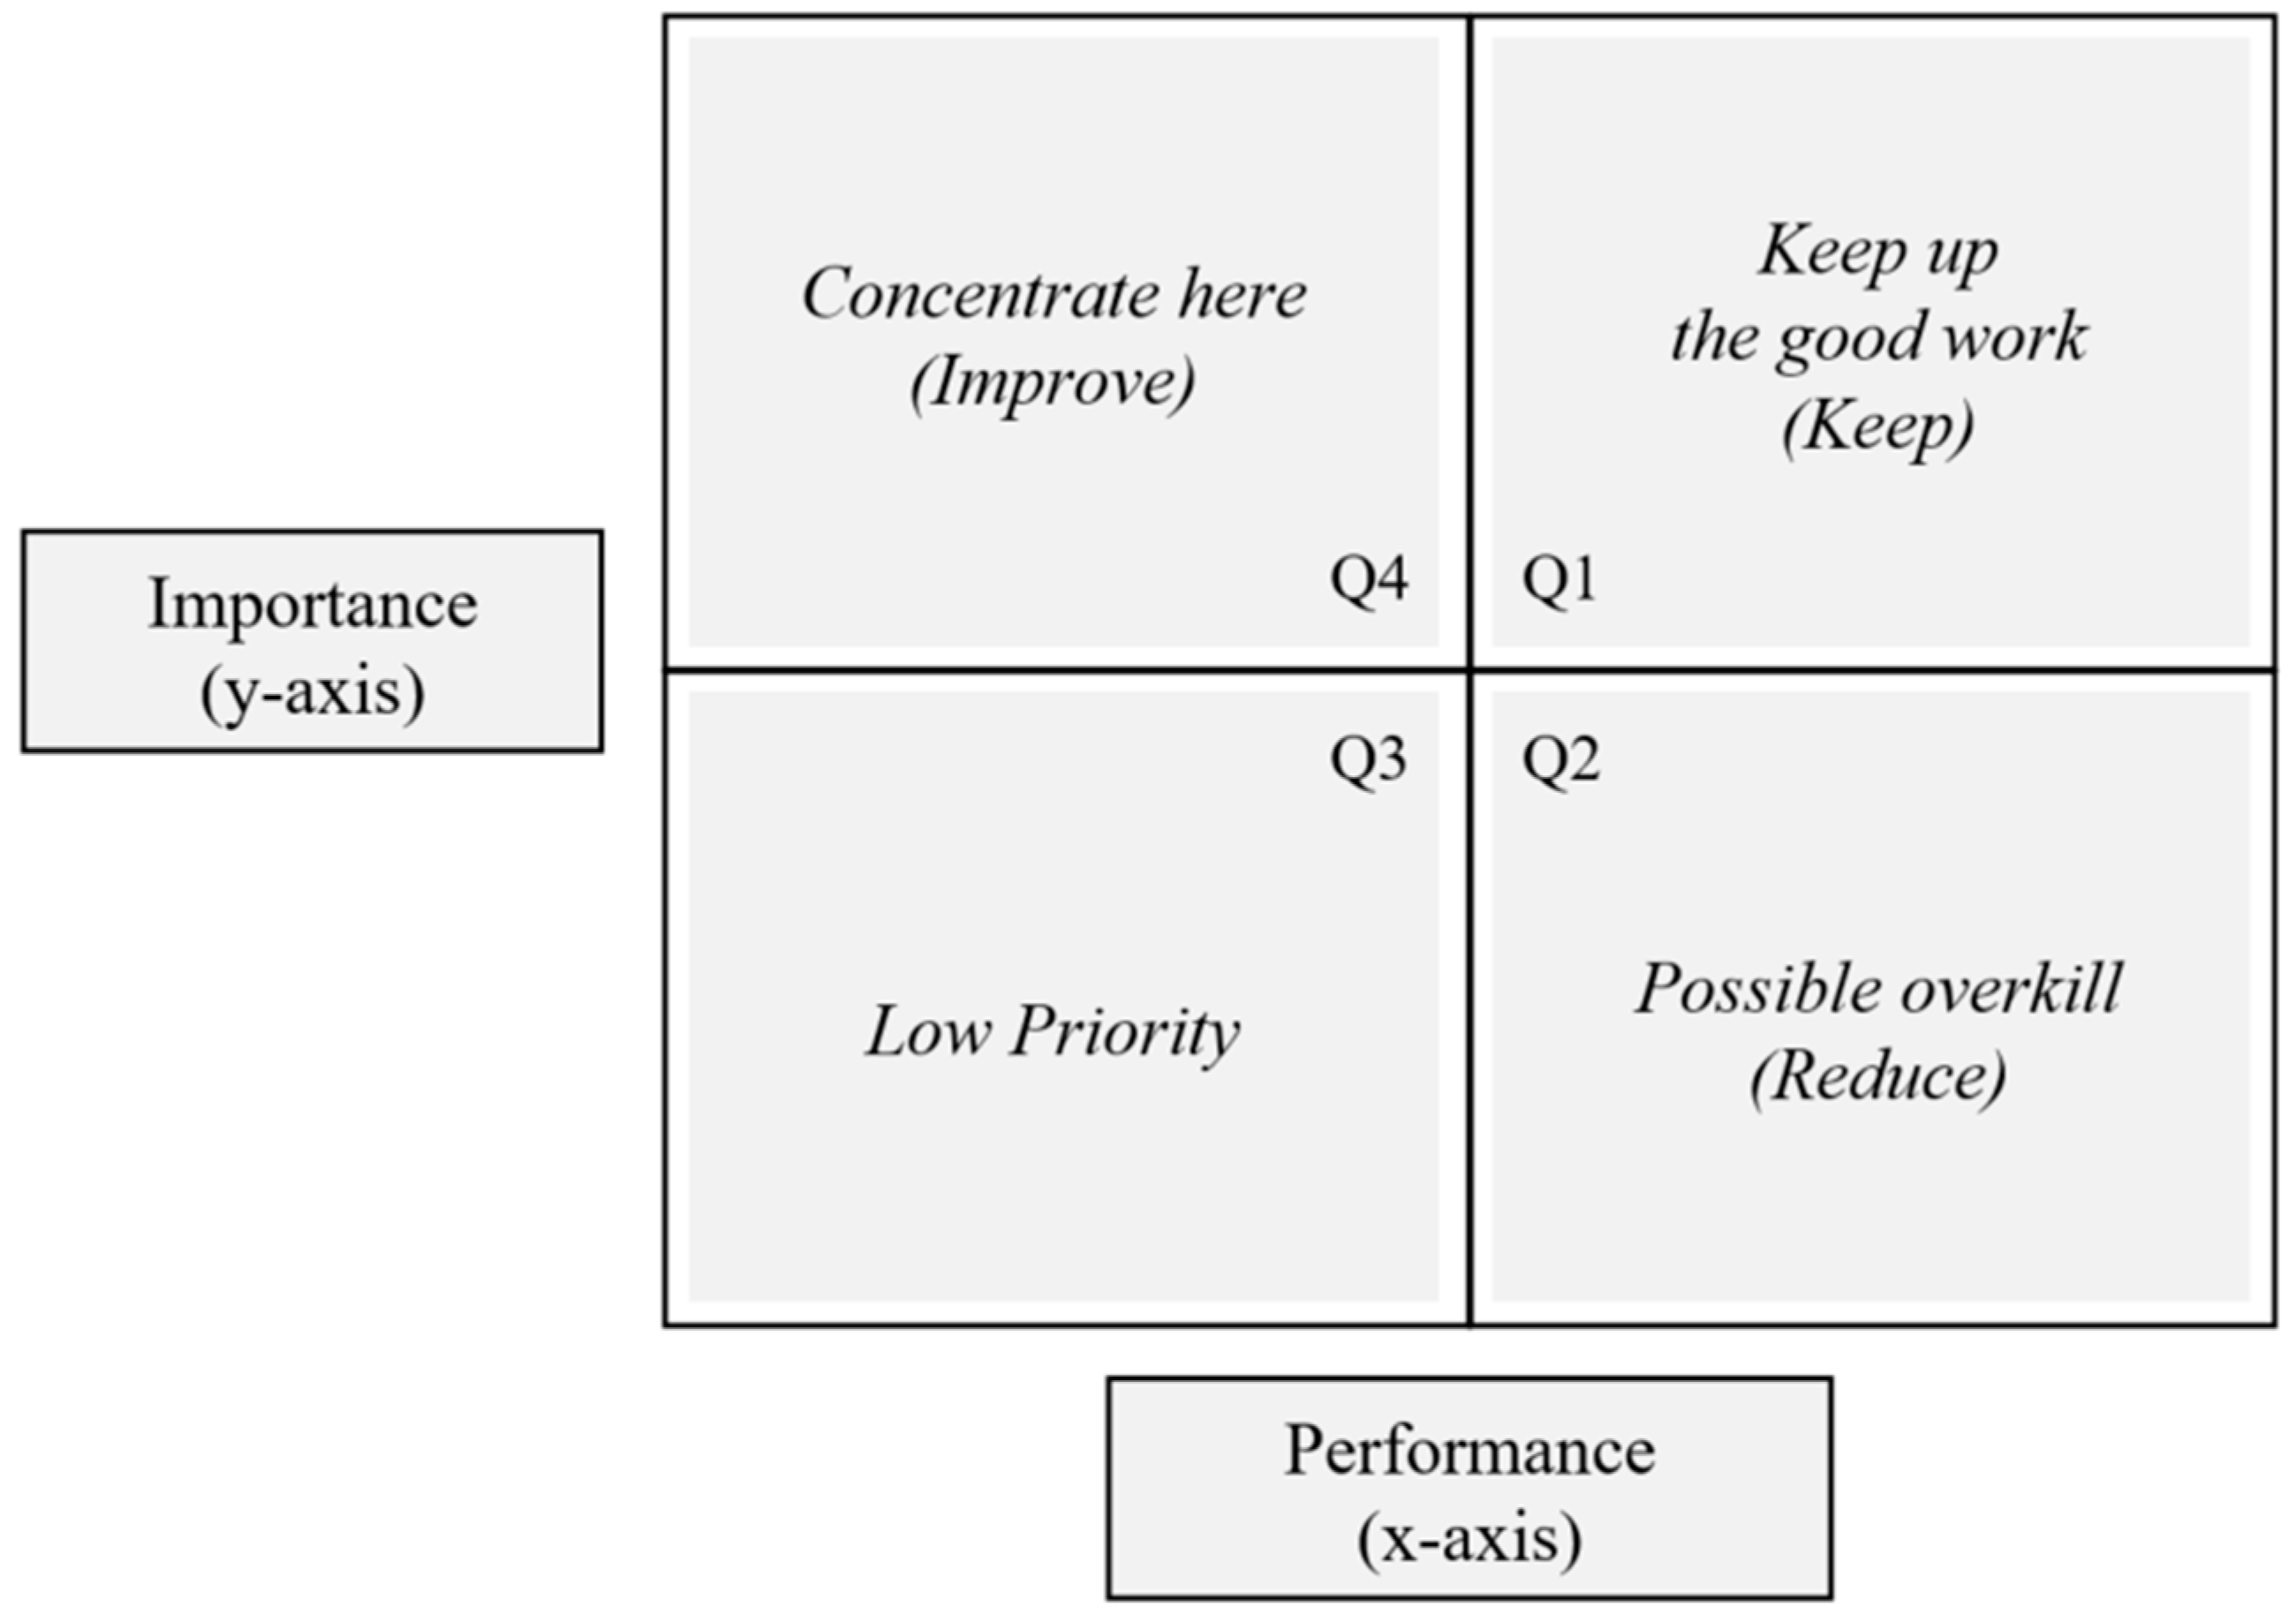
3.2. Importance–Performance Analysis Method

Importance–performance analysis (IPA) is a well-known business management method [63] that was first developed by Martilla and James [64] to identify the critical performance criteria of products or services [65,66]. The method is used to create an IPA matrix or priority map using standard performance and importance scores, which can be divided into four quadrants (Q1–Q4), as shown in Figure 2 [31,63,67]:
(1)
Q1: Keep up the good work, indicating the main strengths and potential competitive advantages of a product or service.
(2)
Q2: Possible overkill, representing that these criteria are a low priority for customers. That is, the organization should reduce resources directed toward these criteria because resources are limited.
(3)
Q3: Low priority, representing criteria that are not important to customers and not performing exceptionally well. The organization should not care too much about these attributes.
(4)
Q4: Concentrate here, representing the service’s primary weaknesses and threats to its competitiveness. For the organization, these criteria have the highest priority in terms of investment.
This approach can help decision-makers to easily understand the performance and importance of criteria. The method is widely used in many different areas, such as supplier management [31], tourism development [66,68], and strategy management [69].

4. Empirical Case

In this section, an empirical study using data from the ISEC in China is presented to illustrate the application of the proposed DANP-IPA model for evaluating and improving the performance of university teachers.

4.1. Case Background Problem Description

Compared with developed countries, China lacks higher education resources and their distribution is imbalanced, especially at regional universities, which constitute the majority of universities in China. To solve this problem, a subsidiary department of the Chinese MOE developed the International Scholarly Exchange Curriculum (ISEC) program based on the directive of “globalizing education to deepen reforms in higher education”. Universities that participated in the program received assistance with curriculum, teaching, and quality assurance reforms—however, these reforms were based on teachers. For this reason, ISEC sought to establish a sustainable development mechanism in order to cultivate quality teaching teams that would autonomously reform curriculums and teaching and achieve the goal of comprehensive teaching reform. This line of thinking is a departure from China’s current method of promoting change from the top downward. The core of this development program involves teachers and the sustainable development of promoting reforms in higher education. The corresponding content includes (1) curriculum systems, (2) support for teacher development systems, and (3) service systems. Currently, the program has been implemented in approximately 30 test universities in nine provinces with more than 1500 teachers listed in ISEC, accumulating practical experience with both successes and failures. These ISEC teachers have met the ISEC inclusion criteria, i.e., age, academic qualifications, foreign study or exchange experience, international curriculum teaching experience, critical thinking, and ISEC mission acceptance. The program prioritizes the development of teachers on the front line as its core. ISEC is the coordinating mechanism and training platform for teacher development, partnering with universities to use global educational resources to support the improvement of teacher abilities. Next, ISEC teachers act as leaders to push teaching reforms throughout the university and faculty. Therefore, establishing a decision-making model with practical value to assist decision-makers with effectively evaluating ISEC teachers and improving their abilities is a critical problem.
With assistance from the ISEC management institute, 15 ISEC domain experts were selected from the ISEC expert database (one American, two Australian, and 12 Chinese). These experts were teachers, administrative staff members, or ISEC teacher representatives (associate professor or above) at renowned universities. The ISEC domain experts represent elite ISEC teachers. As such, this study is based on the ISEC university teacher standard indicator system (Table 2), and it integrated MCDM and IPA tools to establish a mixed multi-criteria decision-making model. This DANP-IPA model can be used to evaluate and improve ISEC standards for teachers.

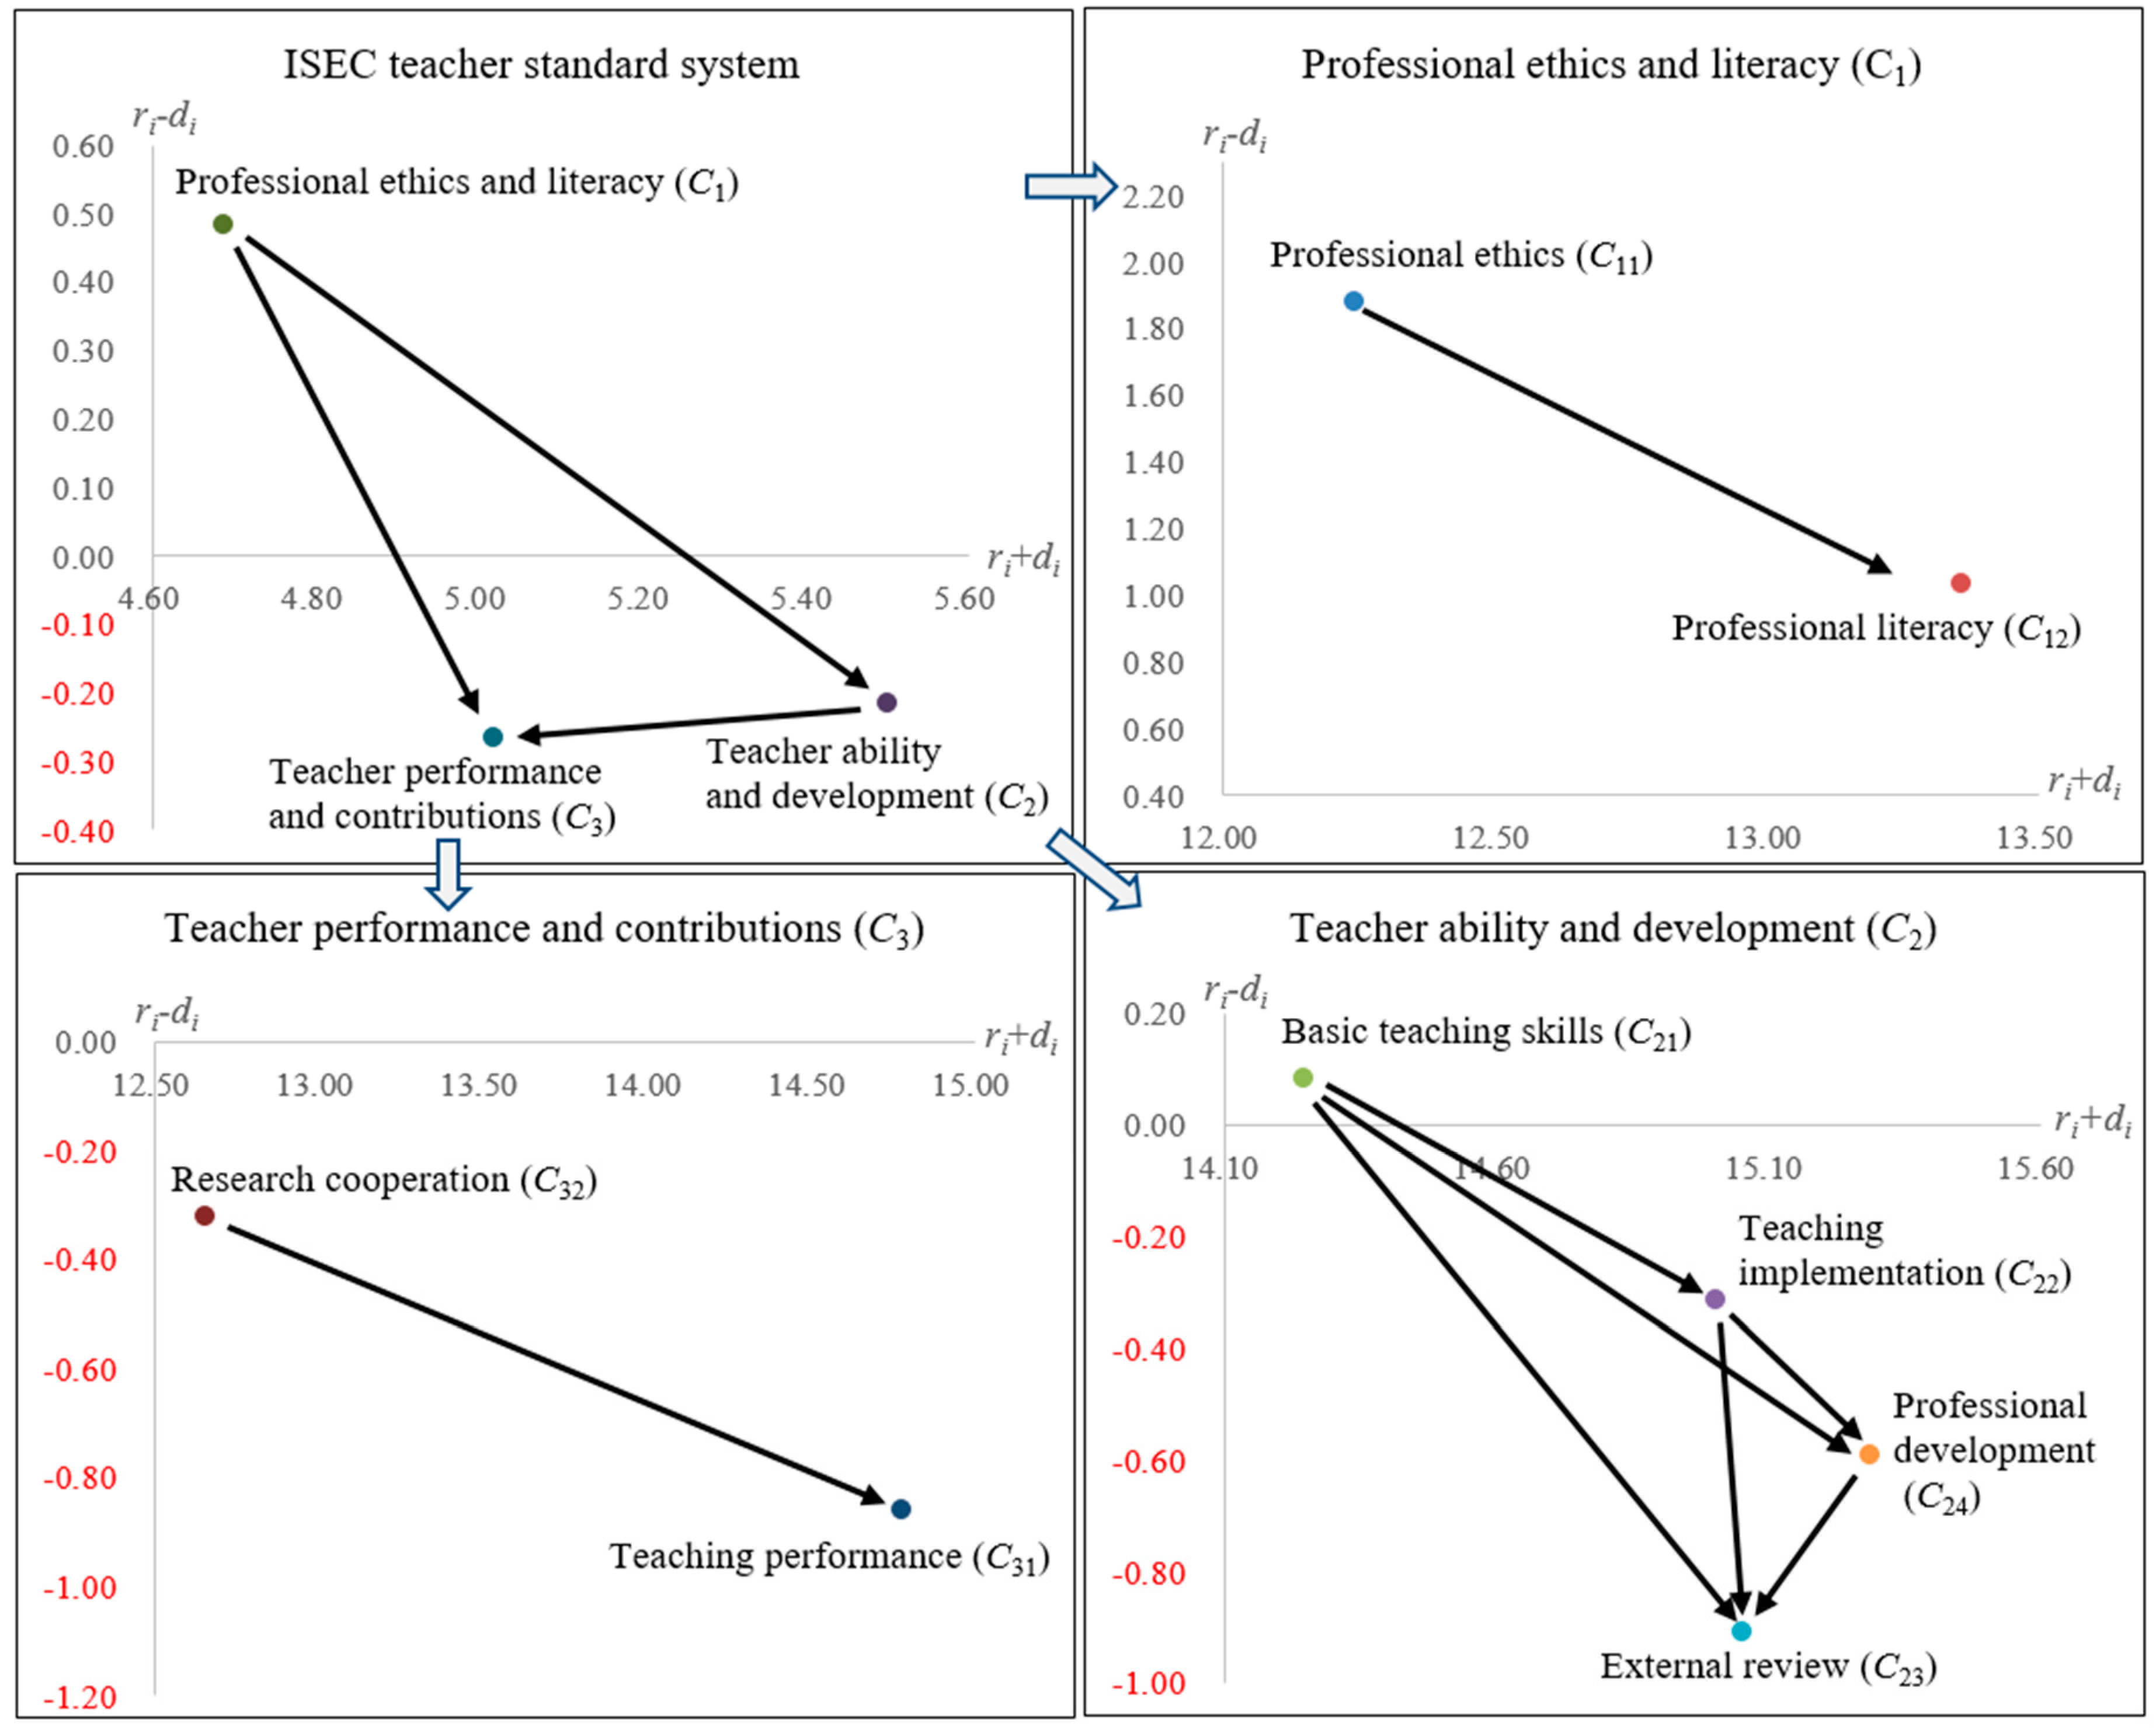
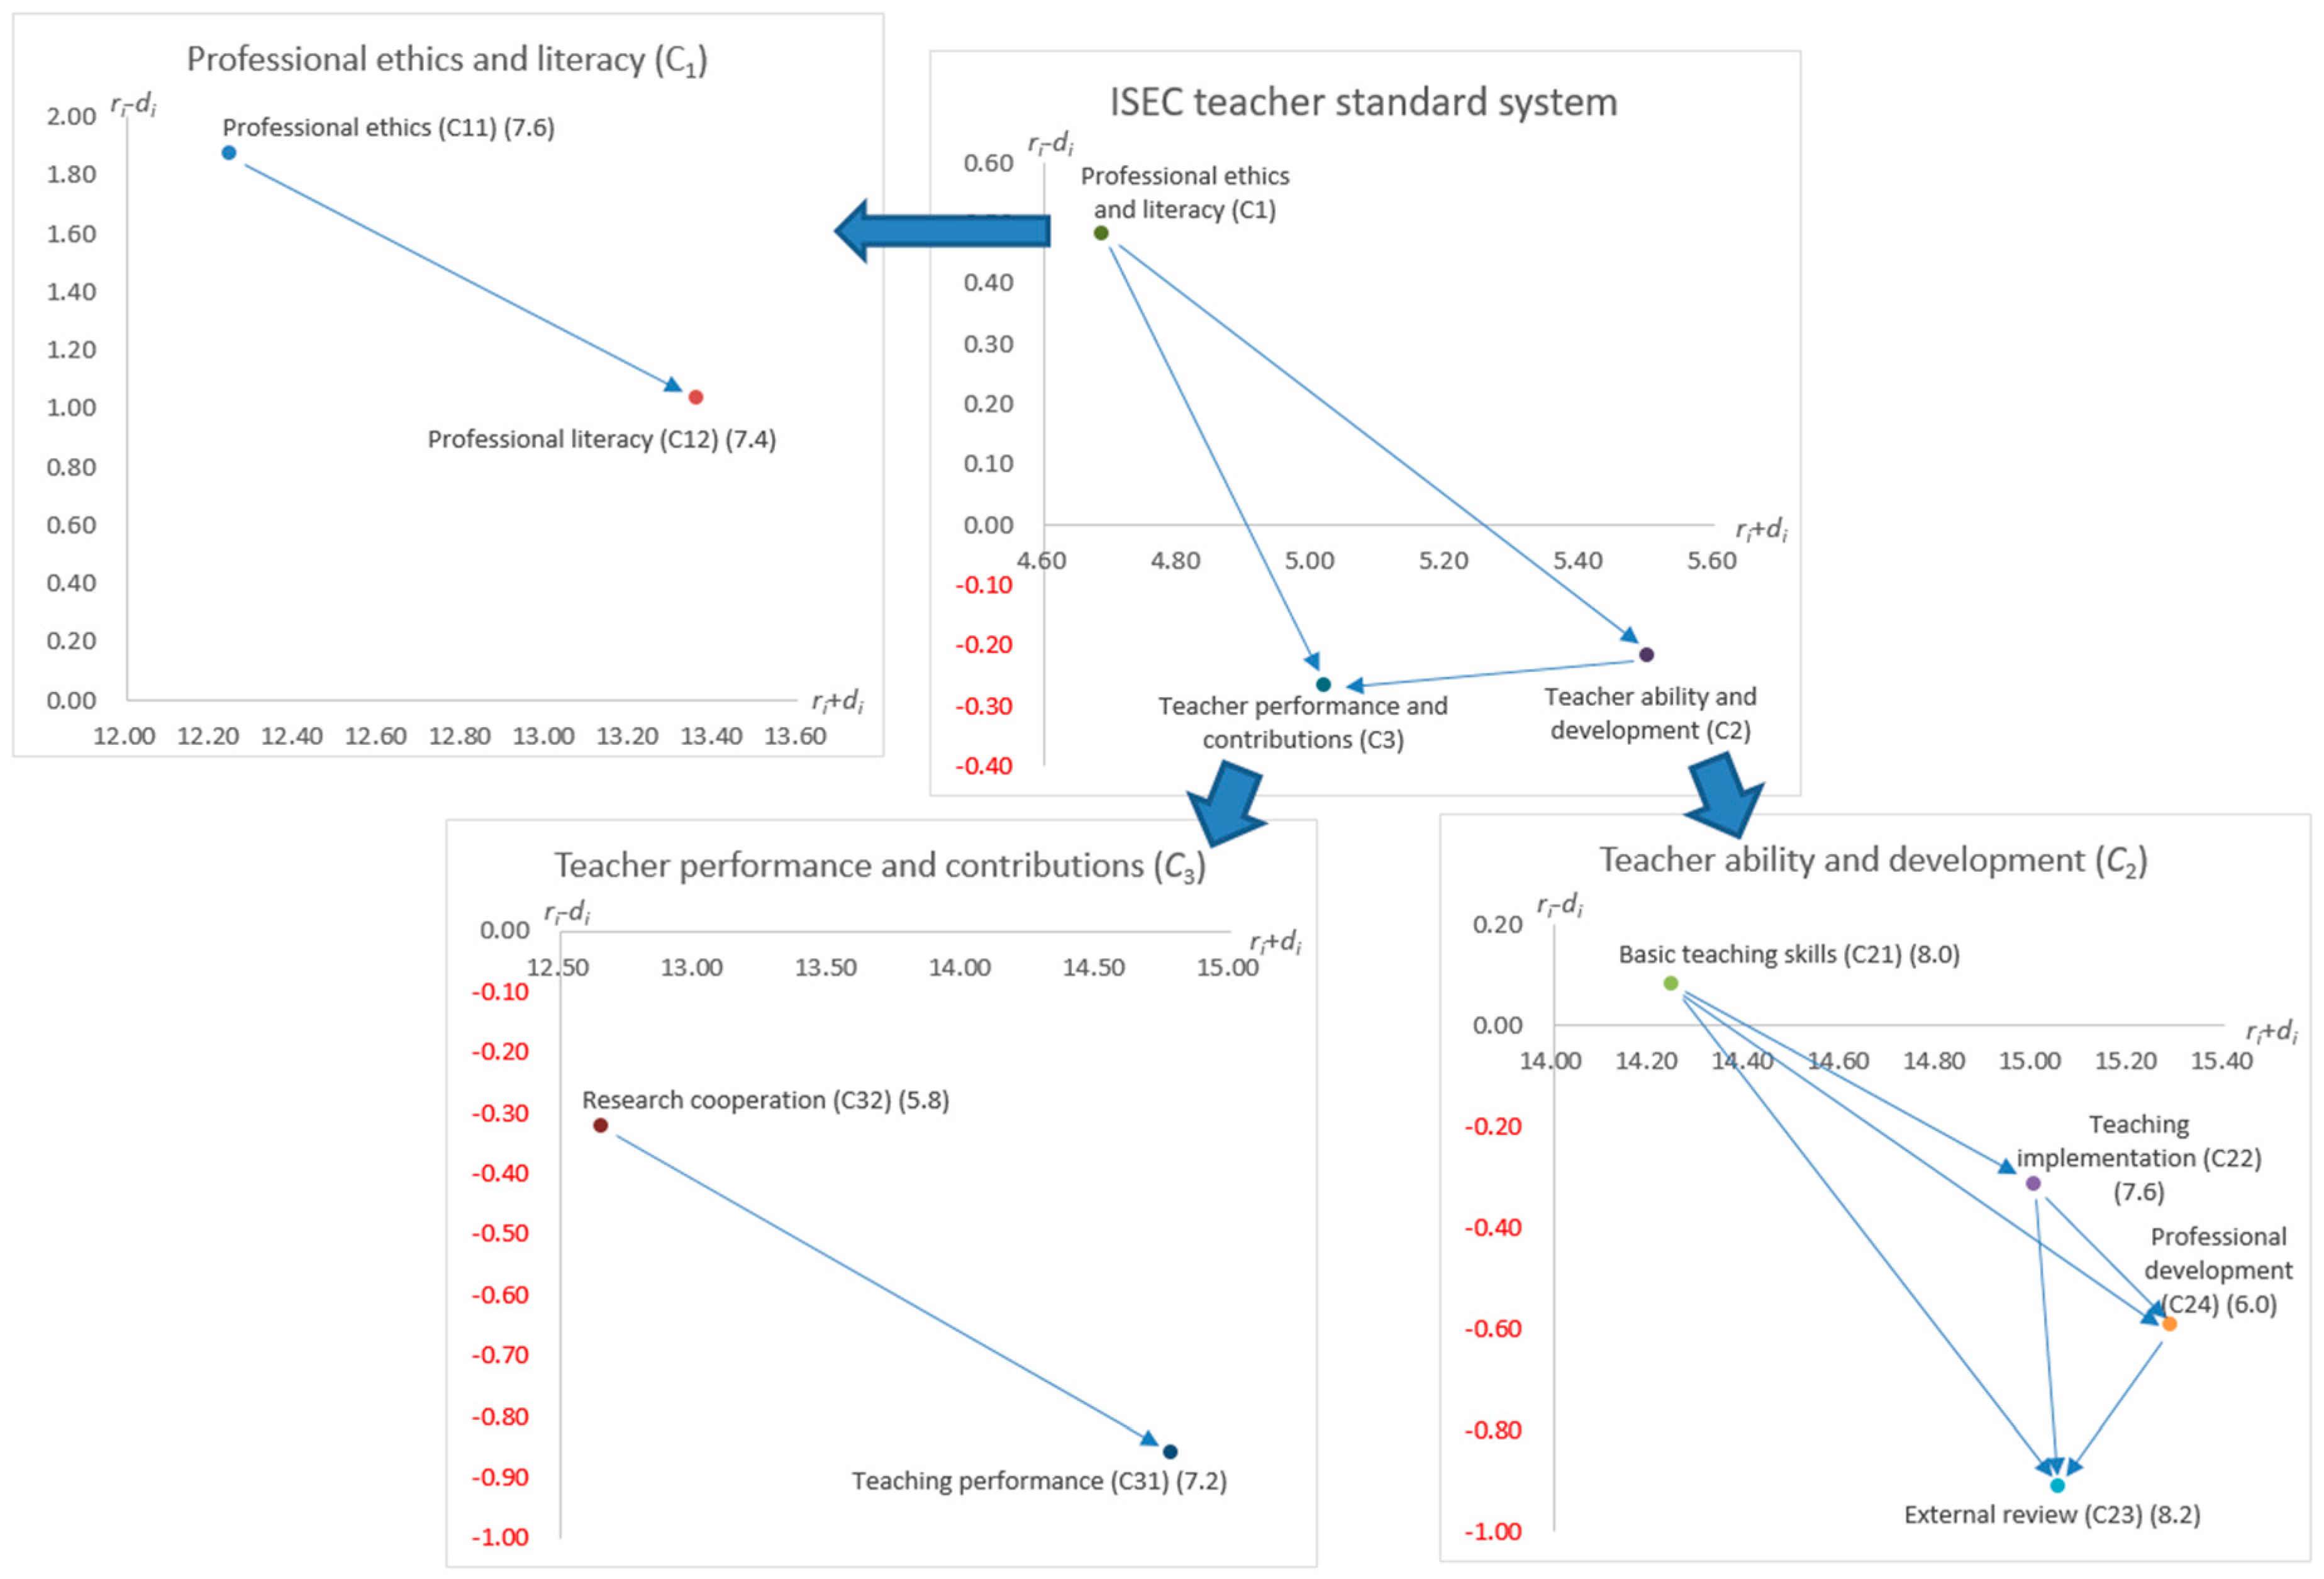
4.2. INRD and Influential Weight Using the DANP Method

The degree of influence between standards was calculated using a five-point measurement scale for all experts, and then Equation (1) was used to consolidate and obtain an initial influence–relationship matrix (Table 3). In this matrix, Equations (2)–(4) allowed the inference of a total influence–relationship matrix (Table 4). Using Equations (5) and (6), the influence structure of each standard was obtained (Table 5) to draw an INRD (Figure 3).
Figure 3 shows the entire mutual influence network within the ISEC teacher standard evaluation system, where “Professional ethics and literacy (C1)” is the primary standard influencing “Teacher ability and development (C2)” and “Teacher performance and contributions (C3)”—this shows that “Professional ethics and literacy (C1)” is the basis of two criteria. That is, a teacher’s professional ethics and literacy impact their abilities and future development, which is reflected in performance and teaching contributions. Further analysis showed that “Professional ethics (C11)” and “Teaching implementation (C22)” are causal groups (i.e., ridi > 0). “Research cooperation (C32)” and “Teaching performance (C31)” are effect groups (i.e., ridi < 0). Past studies focused on decision-makers investing resources to improve specific standards to correct poor performance. However, this may not address the true cause of the problems as decision-makers may neglect the influence structure of standards being composed of interdependent, not independent, relationships. When decision-makers focus solely on poorly performing standards (effect) and invest massive amounts of resources, they do not recognize that the problem may stem from causal standards. For instance, “Research cooperation (C32)” maybe a teacher’s poorest performing standard and the decision-maker may hope that the teacher can cooperate with other researchers. They then host workshops to provide cooperative opportunities and invest massive amounts of resources to encourage teachers to work together on research projects. However, teachers may want to focus on lectures and teaching due to their own state of “Professional ethics (C11)” and “Professional literacy (C12)”, which is conservative. They may simply lack an assertive attitude toward learning, leading to poor research ability. In other words, various factors can cause “Research cooperation (C32)” to be the area of poorest performance. Here, INRD provides a systemic view that assists decision-makers in understanding the relationship structure influencing the standards to pinpoint each teacher’s problems. The aspect of “Basic teaching skills (C21)” in “Teacher ability and development” is a basic standard in teaching because it influences other standards such as “Teaching implementation (C22)”, “Professional development (C24)”, and “External review (C23)”.
For the weights of the influencing relationships, the total influence–relationship matrix (Table 4) uses Equations (7)–(10) to establish an unweighted supermatrix (Table 6). Next, Equations (11)–(14) are used in the matrix to establish a weighted supermatrix (Table 7). Finally, Equation (15) is used to achieve a stable, extreme supermatrix. The influence weights for each standard are shown in Table 8.
Table 8 shows the influential weight of each standard within the entire system and the degree of influence for each standard, which is beneficial for subsequent teacher evaluation processes, as the performance in each standard considers the degree of influence. Judging from the results, the dimension of “Teacher ability and development (C2)” has the highest influential weight and reflects teacher ability and development as the most influential relationship in the evaluation system. In addition to being driven by “Professional ethics and literacy (C1)”, performance is also reflected by “Teacher performance and contributions (C3)”. A teacher’s long-term planning and development in each period of “Teacher performance and contributions (C3)” impacts improvements in future “Teacher ability and development (C2)”, which is why “Teacher ability and development (C2)” is the most influential dimension. “Teaching performance (C31)” and “Research cooperation (C32)” are the top two criteria in terms of influential weight because they reflect performance in the other dimensions, so if other dimensions perform poorly, this is reflected in “Teaching performance (C31)” and “Teacher ability and development (C2)”.

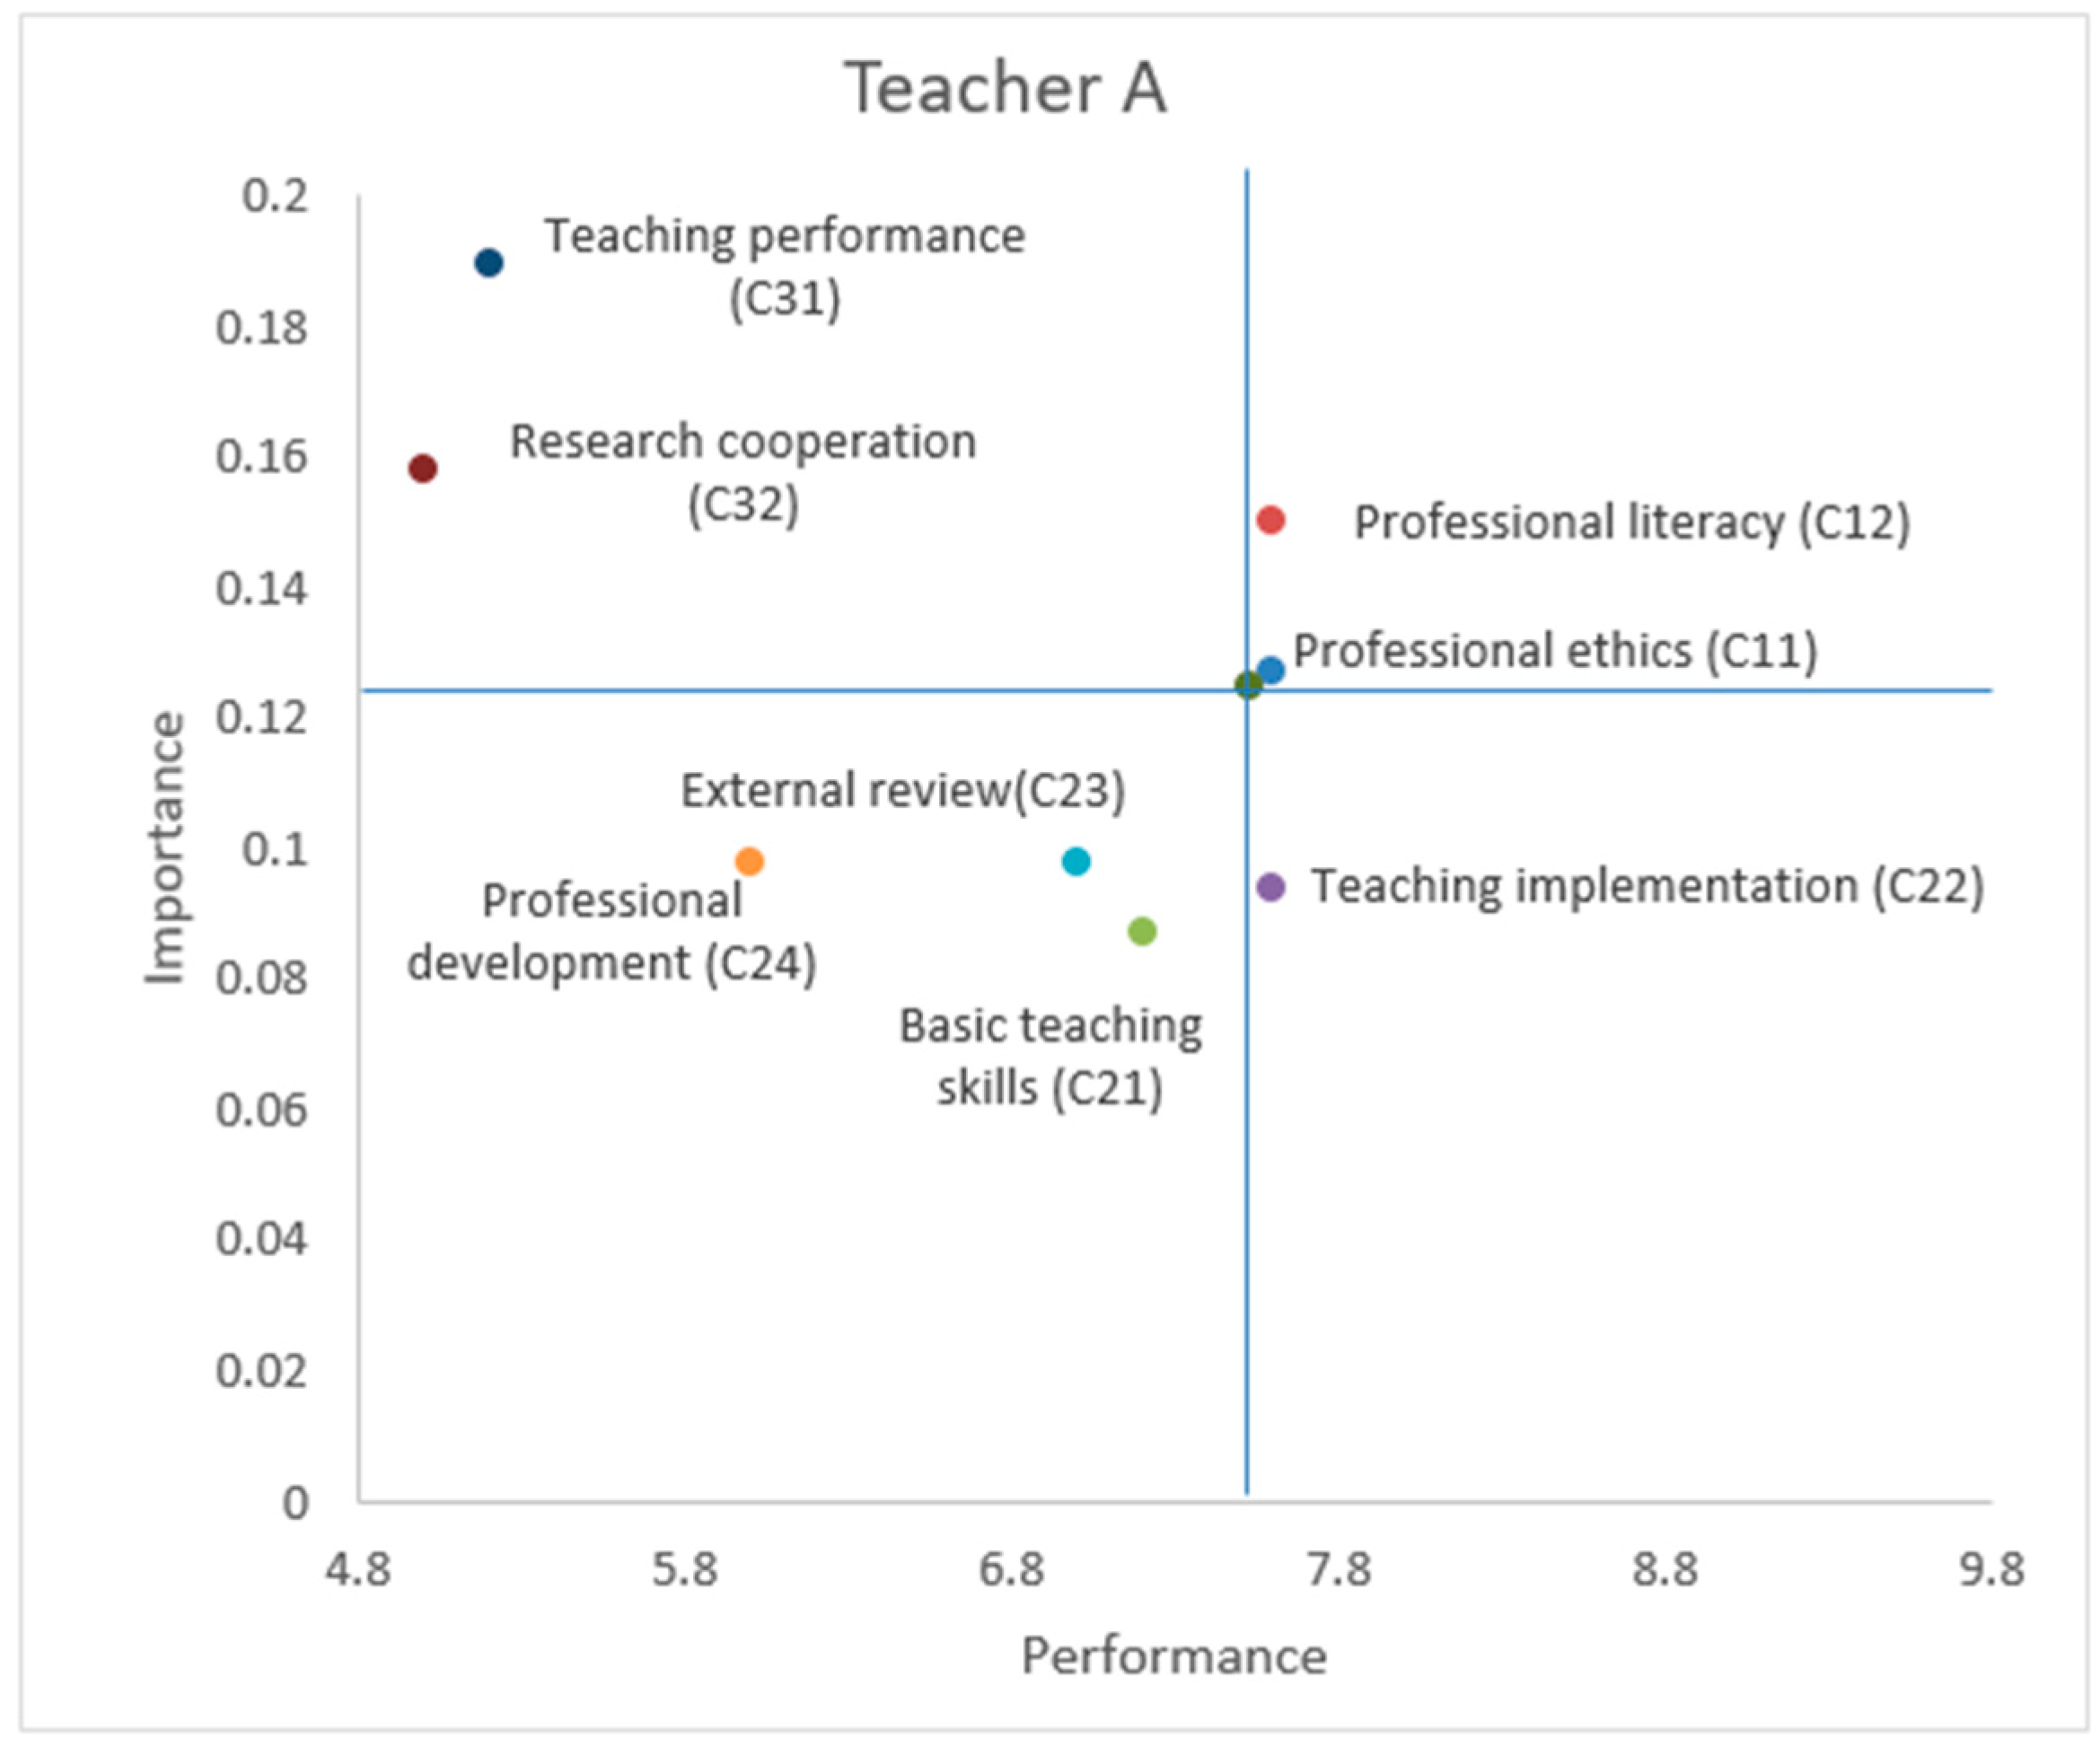
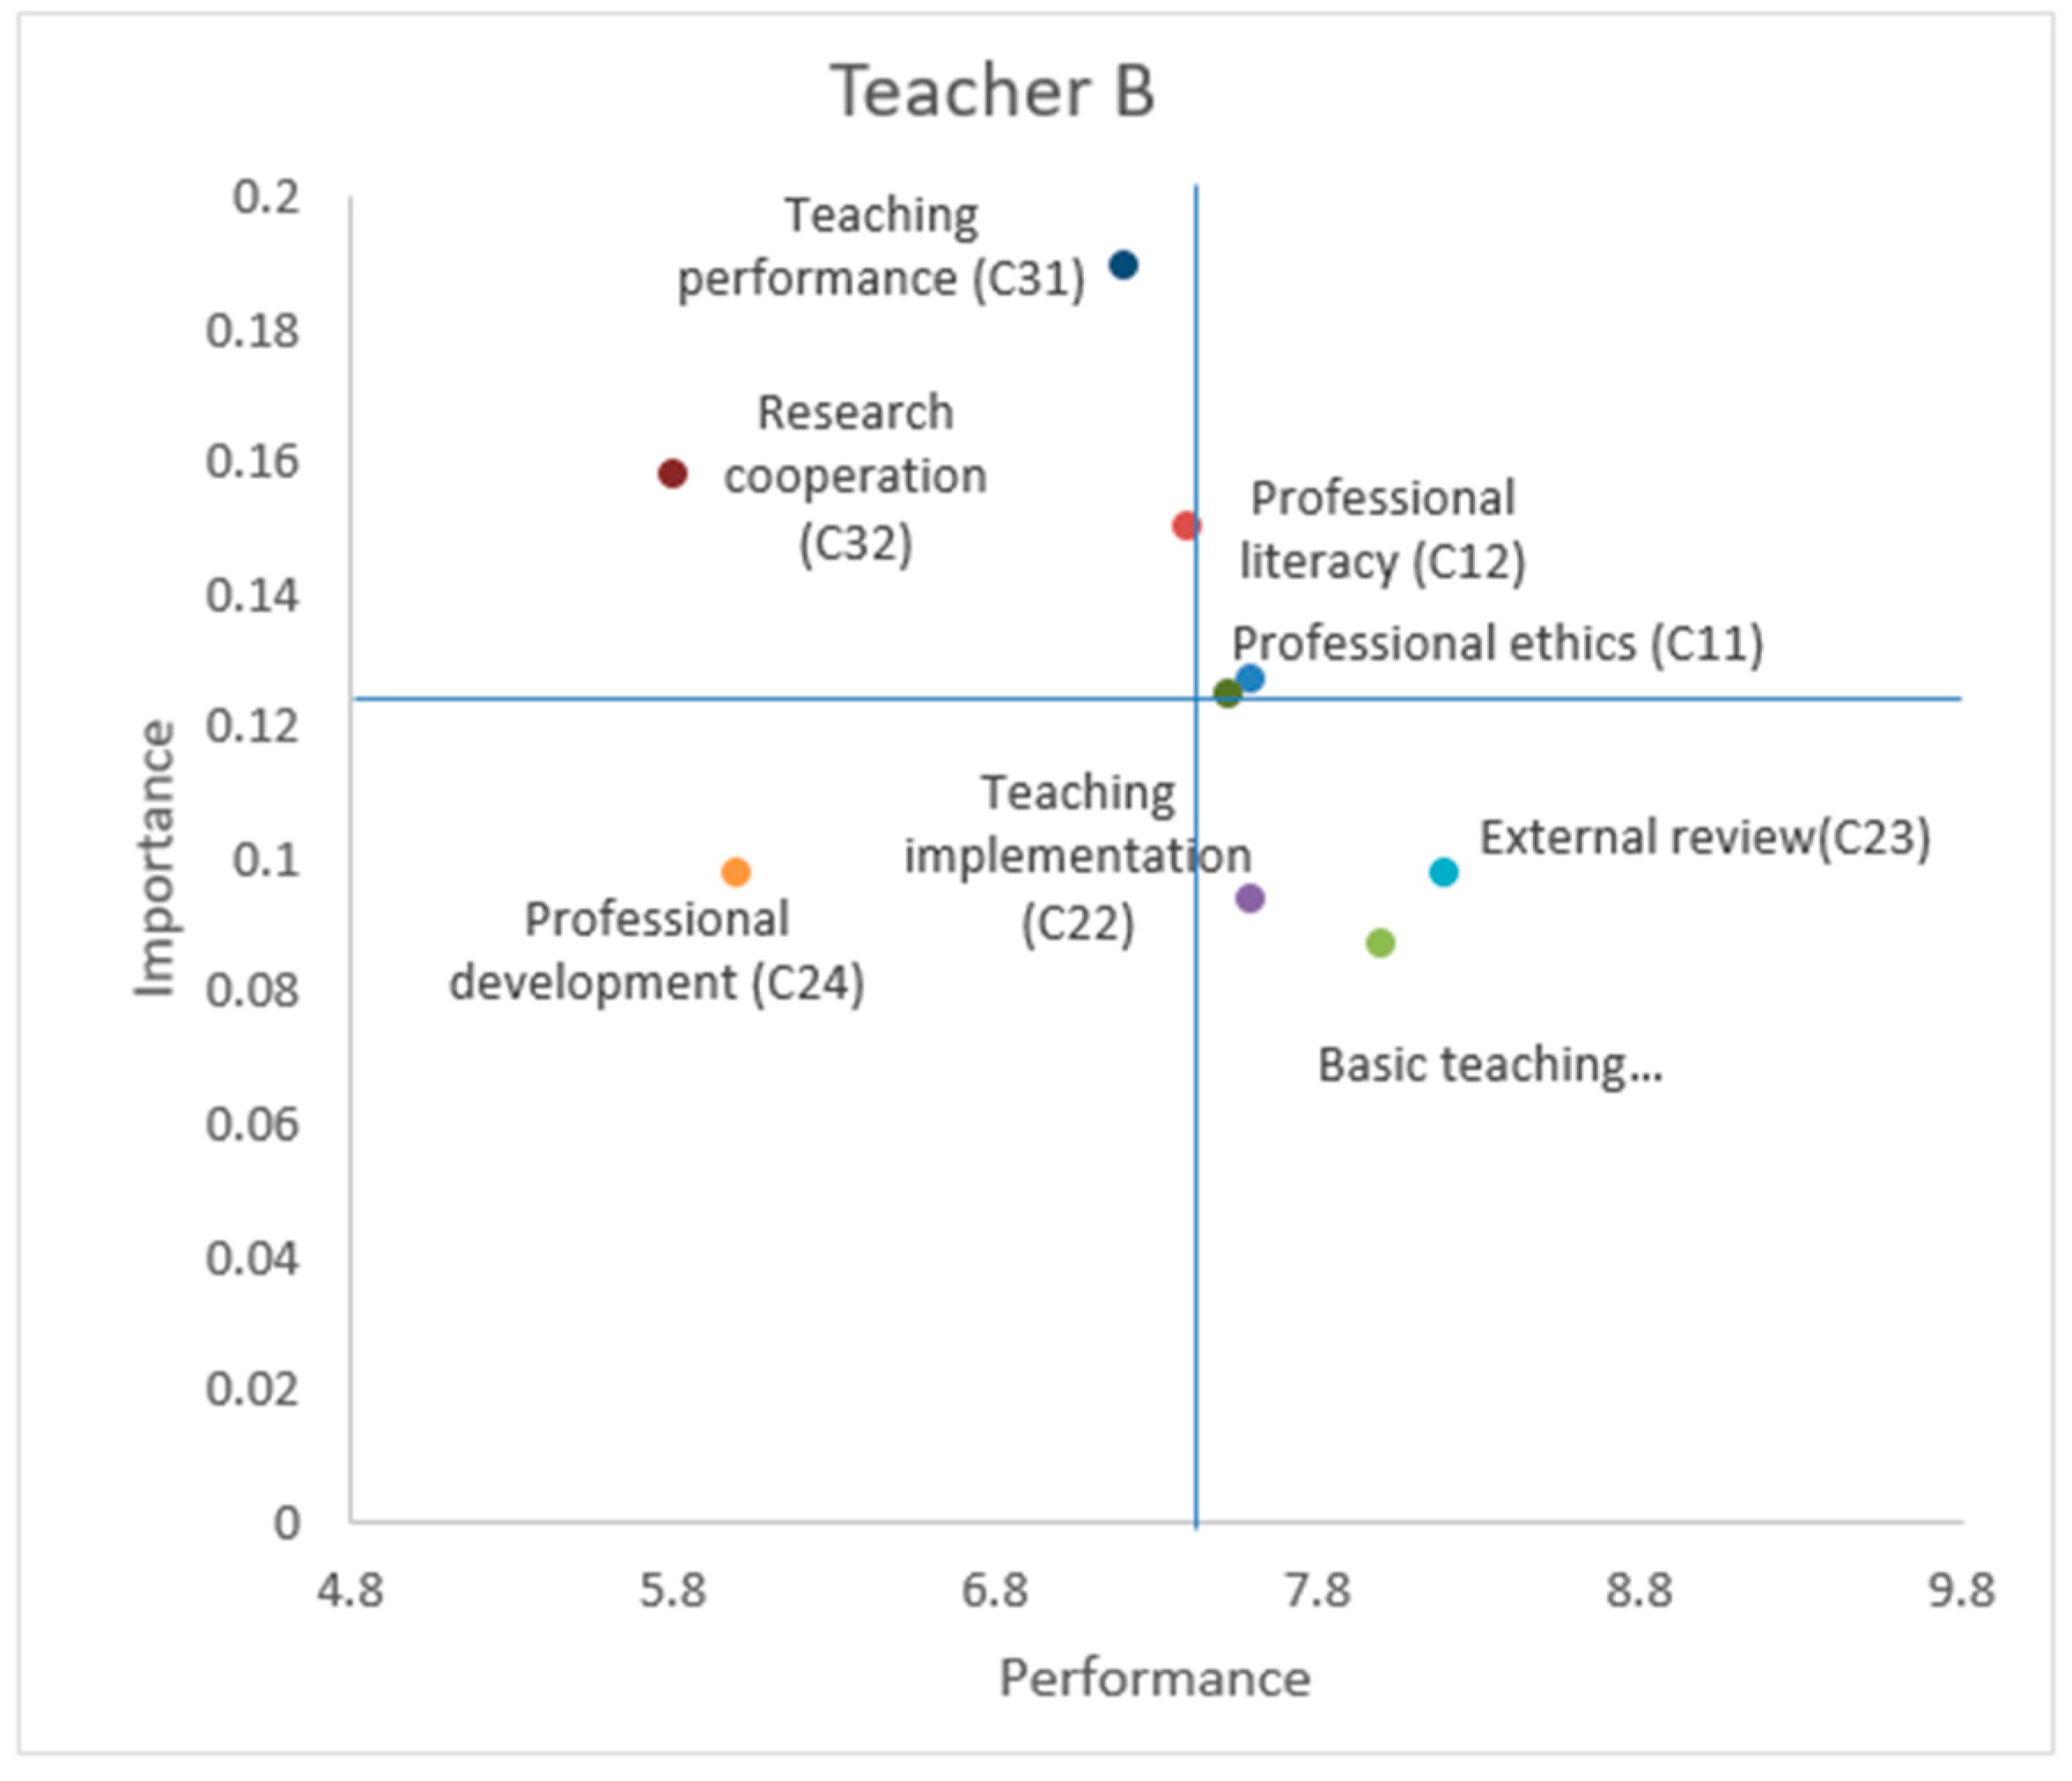
4.3. University Teacher Evaluation Using the IPA Method

Based on teacher performance and weights, this section outlines our use of the IPA method to analyze and gather the standard in which each teacher performs the poorest. With the assistance of the ISEC management institute, five members of the review committee and three university teachers participated in this study. All five members had experience in evaluating ISEC teachers for more than one semester; they used a 0–10-point scale to evaluate three university teachers. These scores were averaged and consolidated into a performance score (Table 9, Table 10 and Table 11). Next, the centre values of weights and performance were used as threshold values to separate standards into four groups as follows: Group I—high weights and performance; group II—low weights and high performance; group III—low weights and performance, and group IV—high weights and low performance. Decision-makers must focus on group IV, as standards within the group are categorized as high weight but the performance in these standards is the poorest. The investment of resources should prioritize the standards in this group to effectively improve the performance in the group. The analysis results for the three university teachers are provided in Table 12 and Figure 4, Figure 5 and Figure 6.
Figure 4, Figure 5 and Figure 6 show that teacher C performed the best overall. Teachers A and B perform poorest in the standards of “Teaching performance (C31)” and “Research cooperation (C32)”. In other words, teachers A and B must improve their performance in these two standards. Based on traditional performance improvement strategies, the ISEC management institute should invest resources to encourage these teachers to publish their teaching results in order to promote academic cooperation among teachers. However, their problems may not actually stem from these two standards because their performance simply reflects the existence of a problem. To avoid this issue, the cause–effect relationship analysis of INRD (Figure 3) can be used to understand the entire issue and propose appropriate improvement measures for each university professor—this is also the solution that allows both the minimization of resources and the maximization of benefit. This will be discussed in further detail in the next section.

5. Discussion

This section presents the results of the IPA with a cause-and-effect relationship analysis based on the INRD to create plans and strategies for teacher improvement. Finally, the influential weights produced from this study and actual current weights are explored.

5.1. Proposal for Improvement Suggestions Based on the INRD

To understand how INRD is used, this study used the case of teacher B to explain how INRD is used in analyzing and proposing improvement measures. Figure 7 shows that teacher B performed poorly in “Teaching performance (C31)” and “Research cooperation (C32)”. Of the two, “Research cooperation (C32)” was associated with the poorest performance. However, the standards that impact “Teacher performance and contributions (C3)” are “Teacher ability and development (C2)” and “Professional ethics and literacy (C1)”. The teaching-related standards are “Basic teaching skills (C21)”, “Teaching implementation (C22)”, and “External review (C23)”, which all had good scores (7.6 to 8.2). This was also reflected in the “Teaching performance” score (7.2). Of these, “Professional development (C24)” was the poorest performing standard (6.0), which may be due to different factors, such as not listing research cooperation in professional development planning, using the majority of their daily time for teaching or administrative tasks, not having the ability or opportunity to conduct research cooperation, or not having a suitable research budget. All these factors can lead to poor performance in “Research cooperation (C32)”. Based on the above analysis, this study conducted discussions with ISEC management staff and proposed suggestions for improvements based on the perspectives of “Professional ethics and literacy (C1)” and “Teacher ability and development (C2)”. The university should reassess teacher B’s professional ethics and literacy, research ability, and time spent teaching, and adjust these three aspects, for instance, by improving a teacher’s professional acknowledgment, adjusting their lecture and teaching time, arranging for them to learn the skills required for research, and arranging opportunities for research cooperation. The ISEC Management Institute could arrange a series of comprehensive courses to improve research capability and post-curricular meetings for research cooperation.

5.2. Comparison of Weights

Next, this section compared the weights obtained by the analysis of ISEC teacher standards using the DANP and AHP methods to actual weights currently being used, as shown in Table 13. This study discovered the following: (1) actual weights and DANP weights stem from the cumulative practical teaching experience of experts, and the results show that the rankings in both are close. This result shows that the establishment of actual weights contains implicit systemic perspectives. (2) Actual weights do not provide specific values but approximate values. For instance, the standards “Basic teaching skills (C21)” and “Professional development (C24)” are both weighted 0.2, whereas “Teaching implementation (C22)” and “External review (C23)” are both weighted 0.3. The same weight values provide the impression that the standards “Basic teaching skills (C21)” and “Professional development (C24)” are equally important, and “Teaching implementation (C22)” and “External review (C23)” are equally important. However, the DANP weights show that: “External review (C23)” “Professional development (C24)” “Teaching implementation (C22)” “Basic teaching skills (C21)”. By comparison, precise weights allow for precise evaluations along with subsequent use and investment of resources for teacher development. From a practical standpoint, this does not merely involve categorizing the importance of standards. (3) Currently, actual weights do not precisely describe factors. Further, past studies have often used the AHP method as weight analysis of criteria in teacher evaluation models [19,20,29,46,48]. In this study, the ranking of dimensions and criteria between the AHP method and the other two methods is a little different, however, AHP weights can provide specific values for each criterion. However, the AHP method assumes that the relationship between the criteria is independent, which is inconsistent with the operation of the real world. On the contrary, the DANP method used to obtain the weights of the standards from the perspective of systemic influence allows these systemic perspectives to identify cause-and-effect relationships using INRD. This assigns greater significance and high explanatory power to standard weights. Based on this feature, the DANP has been successfully applied to different issues [56,57,58,59,60,61,62]. Compared to the previous model, the DANP method employed in this study can provide more specific information to help decision-makers to obtain a complete systematic solution.

6. Conclusions and Remarks

ISEC teacher evaluation standards are a key aspect of Chinese education reform. In the past, the ISEC management institute has focused on teachers’ poorest performing standards to propose a series of improvement measures. However, these measures did not consider the mutual influence structures amongst the standards. Therefore, the improvements often treat the symptoms but not the source, and resources are not used efficiently for maximum benefit. Standard weights are expressed in integers that cannot effectively differentiate the degree of relative importance among standards and explain the management significance behind each weight. This type of evaluation process does not truly reflect the abilities of each teacher. To solve this issue, this study developed a mixed multi-criteria decision-making (DANP-IPA) model based on ISEC teacher standards.
First, this model provides the INRD and influential weights based on the systemic perspective. INRD assists decision-makers in understanding the influential relationship structure among standards. Influential weights integrate influential perspectives into subsequent processes of teacher evaluation so that improvement measures are based on cause and effect. In the practical case studies used in this research, INRD identified “Professional ethics and literacy (C1)” as the primary influential standard that impacts “Teacher ability and development (C2)” and “Teacher performance and contributions (C3)”. In other words, the basic factors that affect teacher ability and performance are the individual’s own professional ethics and literacy. “Teacher ability and development (C2)” was shown to have the highest influential weight because it is driven by “Professional ethics and literacy” and is reflected in “Teacher performance and contributions (C3)”. A teacher’s long-term planning and development and “Teacher performance and contributions (C3)” in each period were found to be influenced by future improvements in “Teacher ability and development (C2)”. This is why “Teacher ability and development (C2)” was found to have the highest influential ranking of all dimensions. “Teaching performance (C31)” and “Research cooperation (C32)” were the two highest in terms of influential weight because they reflect the performance of other standards, meaning that if other standards perform poorly, this is eventually reflected in “Teaching performance (C31)” and “Research cooperation (C32)”. Finally, the IPA performance analysis showed that teacher C had the best overall performance—in comparison, teachers A and B both performed poorly in “Teaching performance (C31)” and “Research cooperation (C32)”. Teachers A and B must improve their performance in these two standards. According to traditional performance improvement strategies, the ISEC management institute should invest resources to encourage teachers to publish their teaching results and promote research cooperation among teachers. However, these problems may not actually stem from these two standards because they are simply a reflection of the problem.
Based on the above analysis, this study conducted discussions with ISEC management staff and provided suggestions for improvements based on the perspectives of “Professional ethics and literacy (C1)” and “Teacher ability and development (C2)”. Specifically, the university should reassess teacher B’s professional ethics and literacy, research ability, and time spent teaching and adjust these three aspects, for example, by improving the teacher’s professional acknowledgment, adjusting their lecture and teaching time, arranging for them to learn the skills required for research, and arranging opportunities for research cooperation. The ISEC management institute could arrange a series of comprehensive courses to improve research capability and post-curricular meetings for research cooperation. Therefore, this study contributes to this topic as follows: (1) our method can be combined with INRD (Figure 3) to analyze the cause-effect relationship and understand the entire problem to propose the most suitable improvement measures for each university professor. (2) Our solution both minimizes resources and maximizes benefits to improve the efficiency of resource investment in the development of university teachers. Our method will have a catalyzing effect on the continued development and cultivation of teachers.
Although this study provides a scientific decision-making model, the orientation of future research involves the exploration of multiple facets. This study focused on the establishment of the model and the application of ISEC teacher assessment and improvement. In our current research, the limitations are the ISEC evaluation standards and improvement strategies that must depend on domain-experts’ knowledge (i.e., influential network-relation diagram and influential weights). The data source requires the expertise of a group of ISEC domain experts with practical experience in the issue area. Therefore, the data sources (i.e., DANP and performance) require support from the ISEC management institute. In addition, the student’s perspective in the evaluation process and the subsequent development of the teacher were not included in the scope of this research, which forms another limitation of this study. Based on these limitations, one direction of future studies could involve the consideration of the perspective of students in the evaluation process for university teachers. Another research opportunity could be the integration of research on data exploration and multi-criteria decision-making into the model with the use of big data to analyse and understand the correlations between standards for filtering key standards and their weights—as a way of ultimately proposing improvement measures based on expert knowledge with objective behavioural rules and subjective practical experience. As the Chinese education reform deepens, various problems relating to building decision-making models will require corresponding solutions from future researchers.

Author Contributions

Conceptualization, S.-S.W.; methodology, Y.-C.C.; numeration: Y.-C.C.; investigation, Y.L.; resources, Y.L.; data curation, Y.L.; writing—original article, Y.L.; writing—review and editing, S.-S.W. and Y.-C.C.; supervision, S.-S.W.; project administration, S.-S.W.

Funding

This research received no external funding

Acknowledgments

The authors would like to thank the management department of China’s ISEC program for its strong support for this study. We are grateful to the editor of the Special Issue and the two anonymous reviewers for their constructive and helpful comments and suggestions.

Conflicts of Interest

The authors declare no conflict of interest.

References

  1. Albareda-Tiana, S.; García-González, E.; Jiménez-Fontana, R.; Solís-Espallargas, C. Implementing Pedagogical Approaches for ESD in Initial Teacher Training at Spanish Universities. Sustainability 2019, 11, 4927. [Google Scholar] [CrossRef]
  2. The United Nations. Sustainable Development Goals: 17 Goals to Transform our World. Available online: https://sustainabledevelopment.un.org/ (accessed on 15 September 2019).
  3. Bürgener, L.; Barth, M. Sustainability competencies in teacher education: Making teacher education count in everyday school practice. J. Clean. Prod. 2018, 174, 821–826. [Google Scholar] [CrossRef]
  4. UNESCO. Roadmap for Implementing the Global Action Programme on Education for Sustainable Development; UNESCO: Paris, France, 2014. [Google Scholar]
  5. Brito, R.; Rodríguez, C.; Aparicio, J. Sustainability in Teaching: An Evaluation of University Teachers and Students. Sustainability 2018, 10, 439. [Google Scholar] [CrossRef]
  6. The Chinese Government. A National Plan of China for Implementing the 2030 Agenda for Sustainable Development. Available online: http://www.gov.cn/xinwen/2016-10/13/content_5118514.htm (accessed on 15 September 2019).
  7. Ministry of Education. Notice from the Ministry of Education on Implementing the “Dual Ten-Thousand Plan” for Establishing First Rate Undergraduate Majors. Available online: http://www.moe.gov.cn/srcsite/A08/s7056/201904/t20190409_377216.html (accessed on 15 September 2019).
  8. Varela-Losada, M.; Arias-Correa, A.; Pérez-Rodríguez, U.; Vega-Marcote, P. How Can Teachers Be Encouraged to Commit to Sustainability? Evaluation of a Teacher-Training Experience in Spain. Sustainability 2019, 11, 4309. [Google Scholar] [CrossRef]
  9. Álvarez-García, O.; García-Escudero, L.Á.; Salvà-Mut, F.; Calvo-Sastre, A. Variables Influencing Pre-Service Teacher Training in Education for Sustainable Development: A Case Study of Two Spanish Universities. Sustainability 2019, 11, 4412. [Google Scholar] [CrossRef]
  10. The Ministry of Education and Four Other Ministries. the Action Programme to Rejuvenate Education for the Teaching Staff 2018–2022. Available online: http://www.moe.gov.cn/srcsite/A10/s7034/201803/t20180323_331063.html (accessed on 15 September 2019).
  11. China News. The Serious Shortage of High-Quality Educational Resources is the Major Contradiction of Chinese Education. Available online: http://edu.china.com.cn/2014-04/30/content_32246901.htm (accessed on 15 September 2019).
  12. Song Chunpeng, Member of the CPPCC National Committee: The Situation of East is Strong, West is Weak in Universities Must Be Changed. Available online: http://www.moe.gov.cn/jyb_xwfb/xw_zt/moe_357/jyzt_2019n/2019_zt2/zt1902_dbwy/201903/t20190314_373410.html (accessed on 15 September 2019).
  13. Ding, L.; Zeng, Y. Evaluation of Chinese higher education by TOPSIS and IEW — The case of 68 universities belonging to the Ministry of Education in China. China Econ. Rev. 2015, 36, 341–358. [Google Scholar] [CrossRef]
  14. Johnes, J.; Yu, L. Measuring the research performance of Chinese higher education institutions using data envelopment analysis. China Econ. Rev. 2008, 19, 679–696. [Google Scholar] [CrossRef] [Green Version]
  15. Hallinger, P.; Heck, R.H.; Murphy, J. Teacher Evaluation and School Improvement: An Analysis of the Evidence. Educ. Assess. Eval. Account. 2014, 26, 5–28. [Google Scholar] [CrossRef]
  16. Herlihy, C.; Karger, E.; Pollard, C.; Hill, H.C.; Kraft, M.A.; Williams, M.; Howard, S. State and local efforts to investigate the validity and reliability of scores from teacher evaluation systems. Teach. Coll. Rec. 2014, 116, 1–28. [Google Scholar]
  17. Papay, J. Refocusing the debate: Assessing the purposes and tools of teacher evaluation. Harv. Educ. Rev. 2012, 82, 123–141. [Google Scholar] [CrossRef]
  18. Gagnon, D.J.; Hall, E.L.; Marion, S. Teacher evaluation and local control in the US: an investigation into the degree of local control afforded to districts in defining evaluation procedures for teachers in non-tested subjects and grades. Assess. Educ. Princ. Policy Pract. 2017, 24, 489–505. [Google Scholar] [CrossRef] [PubMed]
  19. Ghosh, D.N. Analytic hierarchy process & TOPSIS method to evaluate faculty performance in engineering education. Dipendra Nath Ghosh Et Al Uniascit 2011, 1, 63–70. [Google Scholar]
  20. Pavani, S.; Sharma, L.K.; Hota, H. A group expert evaluation for teachers by integrating fuzzy AHP and TOPSIS models. In Proceedings of the 2013 IEEE International Conference in MOOC, Innovation and Technology in Education (MITE), Jaipur, India, 20–22 December 2013; pp. 85–90. [Google Scholar]
  21. Xu, X.; Wang, Y.; Yu, S. Teaching performance evaluation in smart campus. IEEE Access. 2018, 6, 77754–77766. [Google Scholar] [CrossRef]
  22. Wang, W.; Liu, Z.; Yao, L.; Liu, G. Classroom teaching performance evaluation model of ideological and political education in colleges and universities based on TOPSIS and triangle fuzzy number. Risti-Rev. Iber. Sist. E Tecnol. Inf. 2016, 2016, 220–230. [Google Scholar]
  23. Tseng, M.L. Using the extension of DEMATEL to integrate hotel service quality perceptions into a cause–effect model in uncertainty. Expert Syst. Appl. 2009, 36, 9015–9023. [Google Scholar] [CrossRef]
  24. Kiani Mavi, R.; Standing, C. Cause and effect analysis of business intelligence (BI) benefits with fuzzy DEMATEL. Knowledge Manag. Res. Pract. 2018, 16, 245–257. [Google Scholar] [CrossRef]
  25. Si, S.L.; You, X.Y.; Liu, H.C.; Zhang, P. DEMATEL technique: A systematic review of the state-of-the-art literature on methodologies and applications. Math. Probl. Eng. 2018, 3696457, 1–33. [Google Scholar] [CrossRef]
  26. Liou, J.J.; Chuang, Y.C.; Zavadskas, E.K.; Tzeng, G.H. Data-driven hybrid multiple attribute decision-making model for green supplier evaluation and performance improvement. J. Clean. Prod. 2019, 241, 118321. [Google Scholar] [CrossRef]
  27. Ding, J.F.; Kuo, J.F.; Shyu, W.H.; Chou, C.C. Evaluating determinants of attractiveness and their cause-effect relationships for container ports in Taiwan: users’ perspectives. Marit. Policy Manag. 2019, 46, 466–490. [Google Scholar] [CrossRef]
  28. Hu, H.Y.; Lee, Y.C.; Yen, T.M.; Tsai, C.H. Using BPNN and DEMATEL to modify importance–performance analysis model–A study of the computer industry. Expert Syst. Appl. 2009, 36, 9969–9979. [Google Scholar] [CrossRef]
  29. Hu, H.Y.; Lee, Y.C.; Yen, T.M. Amend importance-performance analysis method with Kano’s model and DEMATEL. J. Appl. Sci. 2009, 9, 1833–1846. [Google Scholar] [CrossRef]
  30. Hu, H.Y.; Chiu, S.I.; Cheng, C.C.; Yen, T.M. Applying the IPA and DEMATEL models to improve the order-winner criteria: A case study of Taiwan’s network communication equipment manufacturing industry. Expert Syst. Appl. 2011, 38, 9674–9683. [Google Scholar] [CrossRef]
  31. Ho, L.H.; Feng, S.Y.; Lee, Y.C.; Yen, T.M. Using modified IPA to evaluate supplier’s performance: Multiple regression analysis and DEMATEL approach. Expert Syst. Appl. 2012, 39, 7102–7109. [Google Scholar] [CrossRef]
  32. Cheng, C.C.; Chen, C.T.; Hsu, F.S.; Hu, H.Y. Enhancing service quality improvement strategies of fine-dining restaurants: New insights from integrating a two-phase decision-making model of IPGA and DEMATEL analysis. Int. J. Hosp. Manag. 2012, 31, 1155–1166. [Google Scholar] [CrossRef]
  33. Wilson, F.; Beaton, D. The theory and practice of appraisal: progress review in a Scottish university. High. Educ. Q. 1993, 47, 163–189. [Google Scholar] [CrossRef]
  34. Tucker, A. Chairing the Academic Department: Leadership Among Peers; Oryx Press: Phoenix, AZ, USA, 1992. [Google Scholar]
  35. Moses, I. Assessment and Appraisal of Academic Staff. High. Educ. Manag. 1996, 8, 79–86. [Google Scholar]
  36. Michael, M.; Adrienne, E.H. Faculty Evaluation: A Prickly Pair. High. Educ. 1999, 38, 351. [Google Scholar]
  37. Desselle, S.P.; Mattei, T.J.; Pete Vanderveen, R. Identifying and weighting teaching and scholarship activities among faculty members. Am. J. Pharm. Educ. 2004, 68, 1–11. [Google Scholar] [CrossRef]
  38. Filipe, M.N.M.; Ferreira, F.A.F.; Santos, S.P. A multiple criteria information system for pedagogical evaluation and professional development of teachers. J. Oper. Res. Soc. 2015, 66, 1769–1782. [Google Scholar] [CrossRef]
  39. Lane, J. Let’s make science metrics more scientific. Nature 2010, 464, 488–489. [Google Scholar] [CrossRef]
  40. Coccia, M. Measuring scientific performance of public research units for strategic change. J. Informetr. 2008, 2, 183–194. [Google Scholar] [CrossRef]
  41. Bana e Costa, C.A.; Oliveira, M.D. A multicriteria decision analysis model for faculty evaluation. Omega 2012, 40, 424–436. [Google Scholar] [CrossRef]
  42. Keeney, R.L.; See, K.E.; Von Winterfeldt, D. Evaluating academic programs: With applications to US graduate decision science programs. Oper. Res. 2006, 54, 813–828. [Google Scholar] [CrossRef]
  43. Billaut, J.-C.; Bouyssou, D.; Vincke, P. Should you believe in the Shanghai ranking? An MCDM view. Scientometrics 2010, 237. [Google Scholar] [CrossRef]
  44. Oral, M.; Oukil, A.; Malouin, J.-L.; Kettani, O. The appreciative democratic voice of DEA: A case of faculty academic performance evaluation. Soc.-Econ. Plan. Sci. 2014, 48, 20–28. [Google Scholar] [CrossRef]
  45. Hein, N.; Kroenke, A.; Júnior, M.M.R. Professor Assessment Using Multi-Criteria Decision Analysis. Proc. Comput. Sci. 2015, 55, 539–548. [Google Scholar] [CrossRef] [Green Version]
  46. Chen, J.-F.; Hsieh, H.-N.; Do, Q.H. Evaluating teaching performance based on fuzzy AHP and comprehensive evaluation approach. Appl. Soft Comput. J. 2015, 28, 100–108. [Google Scholar] [CrossRef]
  47. Chang, T.-C.; Wang, H. A Multi Criteria Group Decision-making Model for Teacher Evaluation in Higher Education Based on Cloud Model and Decision Tree. Eurasia J. Math. Sci. Technol. Educ. 2016, 12, 1243–1262. [Google Scholar] [CrossRef]
  48. Dey Mondal, S.; Ghosh, D. An Integrated Approach of Multi-Criteria Group Decision Making Techniques to Evaluate the overall Performance of Teachers. Int. J. Adv. Res. Comput. Sci. 2016, 7, 38–45. [Google Scholar]
  49. Nikolaidis, Y.; Dimitriadis, S.G. On the student evaluation of university courses and faculty members’ teaching performance. Eur. J. Oper. Res. 2014, 238, 199–207. [Google Scholar] [CrossRef]
  50. Lyde, A.R.; Grieshaber, D.C.; Byrns, G. Faculty Teaching Performance: Perceptions of a Multi-Source Method for Evaluation (MME). J. Scholarsh. Teach. Learn. 2016, 16, 82–94. [Google Scholar] [CrossRef]
  51. Bi, H.H. A robust interpretation of teaching evaluation ratings. Assess. Eval. High. Educ. 2018, 43, 79–93. [Google Scholar] [CrossRef]
  52. Lee, W.-S.; Tzeng, G.-H.; Cheng, C.-M. Using novel MCDM methods based on Fama-French three-factor model for probing the stock selection. In Proceedings of the 10th Asia Pacific Industrial Engineering and Management Systems Conference, APIEMS, Kitakyushu, Japan, 14–16 December 2012; pp. 14–16. [Google Scholar]
  53. Gabus, A.; Fontela, E. World problems, an invitation to further thought within the framework of DEMATEL. Battelle Geneva Res. Cent. Geneva Switz. 1972, 1–8. [Google Scholar]
  54. Saaty, T.L. Decision Making with Dependence and Feedback: The Analytic Network Process; RWS Publ.: Casa Branca, Santo André-SP, Brazil, 1996; Volume 4922. [Google Scholar]
  55. Chuang, Y.-C.; Hu, S.-K.; Liou, J.J.; Lo, H.-W. Building a Decision Dashboard for Improving Green Supply Chain Management. Int. J. Inf. Technol. Decis. Mak. 2018, 17, 1363–1398. [Google Scholar] [CrossRef]
  56. Zhu, B.W.; Zhang, J.R.; Tzeng, G.H.; Huang, S.L.; Xiong, L. Public open space development for elderly people by using the DANP-V model to establish continuous improvement strategies towards a sustainable and healthy aging society. Sustainability 2017, 9, 420. [Google Scholar] [CrossRef]
  57. Xiong, L.; Teng, C.L.; Zhu, B.W.; Tzeng, G.H.; Huang, S.L. Using the D-DANP-mV model to explore the continuous system improvement strategy for sustainable development of creative communities. Int. J. Environ. Res. Public Health 2017, 14, 1309. [Google Scholar] [CrossRef]
  58. Feng, I.M.; Chen, J.H.; Xiong, L.; Zhu, B.W. Assessment of and improvement strategies for the housing of healthy elderly: Improving quality of life. Sustainability 2018, 10, 722. [Google Scholar] [CrossRef]
  59. Liou, J.J.H.; Chuang, Y.C.; Tzeng, G.H. A fuzzy integral-based model for supplier evaluation and improvement. Inf. Sci. 2014, 266, 199–217. [Google Scholar] [CrossRef]
  60. Gudiel Pineda, P.J.; Liou, J.J.H.; Hsu, C.-C.; Chuang, Y.-C. An integrated MCDM model for improving airline operational and financial performance. J. Air Transp. Manag. 2018, 68, 103–117. [Google Scholar] [CrossRef]
  61. Shao, Q.G.; Liou, J.J.H.; Chuang, Y.C.; Weng, S.S. Improving the green building evaluation system in China based on the DANP method. Sustainability 2018, 10, 1173. [Google Scholar] [CrossRef]
  62. Lu, M.T.; Liou, J.J.H.; Hsu, C.C.; Lo, H.W. A hybrid MCDM and sustainability-balanced scorecard model to establish sustainable performance evaluation for international airports. J. Air Transp. Manag. 2018, 71, 9–19. [Google Scholar] [CrossRef]
  63. Sever, I. Importance-performance analysis: A valid management tool? Tour. Manag. 2015, 48, 43–53. [Google Scholar] [CrossRef]
  64. Martilla, J.A.; James, J.C. Importance-performance analysis. J. Mark. 1977, 41, 77–79. [Google Scholar] [CrossRef]
  65. Abalo, J.; Varela, J.; Manzano, V. Importance values for Importance–Performance Analysis: A formula for spreading out values derived from preference rankings. J. Bus. Res. 2007, 60, 115–121. [Google Scholar] [CrossRef]
  66. Frauman, E.; Banks, S. Gateway community resident perceptions of tourism development: Incorporating Importance-Performance Analysis into a Limits of Acceptable Change framework. Tour. Manag. 2011, 32, 128–140. [Google Scholar] [CrossRef]
  67. Cohen, J.F.; Coleman, E.; Kangethe, M.J. An importance-performance analysis of hospital information system attributes: A nurses’ perspective. Int. J. Med. Inf. 2016, 86, 82–90. [Google Scholar] [CrossRef] [PubMed]
  68. Boley, B.B.; McGehee, N.G.; Tom Hammett, A.L. Importance-performance analysis (IPA) of sustainable tourism initiatives: The resident perspective. Tour. Manag. 2017, 58, 66–77. [Google Scholar] [CrossRef]
  69. Masoumik, S.M.; Abdul-Rashid, S.H.; Olugu, E.U. Importance-performance Analysis of Green Strategy Adoption within the Malaysian Manufacturing Industry. Proc. CIRP 2015, 26, 646–652. [Google Scholar] [CrossRef] [Green Version]
Figure 1. Modelling flow diagram of the decision-making trial and evaluation laboratory (DEMATEL)-based analytic network process (DANP)-importance–performance analysis (IPA) model.
Sustainability 11 05471 g001
Figure 2. Importance-performance analysis (IPA) map.
Sustainability 11 05471 g002
Figure 3. Influential network-relation diagram (INRD) of ISEC teacher standard evaluation system.
Sustainability 11 05471 g003
Figure 4. IPA of teacher A using the standard evaluation system.
Sustainability 11 05471 g004
Figure 5. IPA of teacher B using the standard evaluation system.
Sustainability 11 05471 g005
Figure 6. IPA of teacher C using the standard evaluation system.
Sustainability 11 05471 g006
Figure 7. INRD for teacher B.
Sustainability 11 05471 g007
Table 1. Comparison with different decision-making models.
CategoryCharacteristicLimitations or Current Defects
Selection of appropriate criteria in the evaluation modelThe research is focused on the selection of subjective and objective indicators in an evaluation model.
  • The modelling process of the scoring system is not considered the relationship between indicators.
  • The weight setting of the indicator depends on the evaluator’s subjectivity.
Building the decision-making model using MCDM methodologyThe research used MCDM methods to construct various decision-making models for multi-criteria evaluation, selection, and improvement problems.
  • The decision-making depends on a group of experts’ domain knowledge.
  • The current MCDM models are based on independent relationships among criteria that cannot provide decision-makers with suitable systemic improvement strategies for each teacher.
Building the decision-making model using statistical or data analysis methodologiesThe research used statistical or data analysis methods to construct decision-making models for overcoming the fuzzy defects of original MCDM models.
  • The models are unable to provide decision-makers with causal influence relationships affecting teacher performance.
Table 2. University teachers’ evaluation system based on ISEC standards.
DimensionCriterionContent
Professional ethics and literacy (C1)Professional ethics (C11)According to the Code of Professional Ethics of Teachers in Higher Education formulated by the MOE, teachers are examined for their moral performance in the teaching process.
Professional literacy (C12)Evaluation of a teacher’s professionalism, professional sense of belonging, and physical and mental health
Teacher ability and development (C2)Basic teaching skills (C21)Evaluation of future planning ability and level of teaching
Teaching implementation (C22)Achievement of teaching goals and amount of teaching resources used
External review (C23)Evaluation of teaching performance by students, peers, and experts
Professional development (C24)Planning and implementation of personal career development
Teacher performance and contributions (C3)Teaching performance (C31)Contributions to teaching performance, awards, research standards, and teaching teams
Research cooperation (C32)Status of personal and group research results
Table 3. Initial influence–relation matrix.
CriteriaC11C12C21C22C23C24C31C32
C110.003.202.673.002.872.932.732.07
C122.870.002.873.003.002.932.872.40
C211.672.130.003.803.733.133.002.33
C222.072.333.000.004.003.133.532.33
C231.802.333.003.200.003.333.472.40
C242.202.603.073.203.200.003.272.93
C311.672.132.933.003.133.270.003.13
C321.732.271.932.132.333.532.870.00
Table 4. Total influence–relation matrix.
CriteriaC11C12C21C22C23C24C31C32
C110.580.810.900.971.011.000.980.81
C120.700.700.920.991.031.021.000.83
C210.660.780.801.011.051.021.010.83
C220.680.810.940.891.081.051.050.85
C230.650.780.910.980.891.021.010.82
C240.690.820.941.011.050.921.040.87
C310.640.760.890.961.001.000.860.84
C320.580.690.770.830.870.910.880.63
Table 5. Sum of given influence (ri) and received influence (di).
Dimensionridiri + diridiCriterionridiri + diridi
C12.592.104.690.48C117.065.1812.241.88
C127.206.1613.361.04
C22.642.865.50−0.22C217.167.0814.250.08
C227.357.6615.00−0.31
C237.077.9815.05−0.91
C247.357.9415.29−0.59
C32.382.645.02−0.27C316.967.8214.77−0.86
C326.176.4912.65−0.32
Table 6. Unweighted supermatrix.
CriteriaC11C12C21C22C23C24C31C32
C110.420.500.460.460.460.460.460.45
C120.580.500.540.540.540.540.540.55
C210.230.230.210.240.240.240.230.23
C220.250.250.260.220.260.260.250.25
C230.260.260.270.270.230.270.260.26
C240.260.260.260.260.270.230.260.27
C310.550.550.550.550.550.540.510.58
C320.450.450.450.450.450.460.490.42
Table 7. Weighted supermatrix.
CriteriaC11C12C21C22C23C24C31C32
C110.110.140.130.130.130.130.130.13
C120.160.130.150.150.150.150.150.15
C210.090.090.080.090.090.090.090.09
C220.100.090.100.080.100.100.090.09
C230.100.100.100.100.090.100.100.10
C240.100.100.100.100.100.090.100.10
C310.190.190.190.200.190.190.170.20
C320.160.160.160.160.160.160.170.14
Table 8. Influence weights for each criterion of ISEC standard.
DimensionLocal WeightRankingCriterionLocal WeightRankingGlobal WeightRanking
C10.2773C110.45820.1274
C120.54210.1503
C20.3761C210.23140.0878
C220.24930.0947
C230.26010.0985
C240.26020.0986
C30.3472C310.54510.1891
C320.45520.1582
Table 9. The average performance of university teacher A.
CriteriaMember_1Member_2Member_3Member_4Member_5Average
C11878787.6
C12878787.6
C21788677.2
C22787887.6
C23787677
C24666666
C31555655.2
C32555555
Table 10. The average performance of university teacher B.
CriteriaMember_1Member_2Member_3Member_4Member_5Average
C11878788
C12877788
C21978889
C22878878
C23888988
C24666666
C31886778
C32665666
Table 11. The average performance of university teacher C.
CriteriaMember_1Member_2Member_3Member_4Member_5Average
C11888888
C12888888
C21898888
C22999979
C23989989
C24999999
C3110101081010
C3210101010810
Table 12. IPA method for university teacher evaluation.
CriterionWeightTeacher ATeacher BTeacher C
PerformanceGroupPerformanceGroupPerformanceGroup
C110.1277.6I7.6I8.0I
C120.1507.6I7.4IV8.0I
C210.0877.2III8.0II8.2II
C220.0947.6II7.6II8.6II
C230.0987.0III8.2II8.6II
C240.0986.0III6.0III9.0II
C310.1895.2IV7.2IV9.6I
C320.1585.0IV5.8IV9.6I
Note: Center value as a threshold value (7.5, 0.125). The values of x and y are derived from the central point between the maximum and minimum of performance and weight, respectively.
Table 13. Comparative analysis of weights.
Dimension/CriterionReal CaseDANPAHP
Local WeightRankingLocal WeightRankingLocal WeightRanking
Professional ethics and literacy (C1)0.230.27730.4591
Professional ethics (C11)0.420.45820.5191
Professional literacy (C12)0.610.54210.4812
Teacher ability and development (C2)0.510.37610.3242
Basic teaching skills (C21)0.220.23140.2372
Teaching implementation (C22)0.310.24930.2203
External review (C23)0.310.26010.3541
Professional development (C24)0.220.26020.1884
Teacher performance and contributions (C3)0.320.34720.2183
Teaching performance (C31)0.710.54510.8161
Research cooperation (C32)0.320.45520.1842

