Article

Operation Health Assessment of Power Market Based on Improved Matter-Element Extension Cloud Model

Research Institute of Energy Markets, North China Electric Power University, Beijing 102206, China
*
Author to whom correspondence should be addressed.
Sustainability 2019, 11(19), 5470; https://doi.org/10.3390/su11195470
Submission received: 19 August 2019 / Revised: 13 September 2019 / Accepted: 30 September 2019 / Published: 2 October 2019

Abstract

:
The complex power system and trading environment in China has led to higher requirements for the efficient and stable operation of the electricity market. With the continuous advancement of power system reforms, regular evaluation of the operation of the market can help us grasp its status and trends, which is of great significance for ensuring its sustainable development. In order to effectively evaluate the current operational status of the electricity market, the concept of operation health degree of power market (OHDPM) is proposed to measure whether the operation is safe, efficient, and sustainable. This paper establishes an improved model framework based on the matter-element extension theory for evaluation. In order to effectively avoid information distortion and loss in the evaluation process, this paper combines the cloud model, matter element extension theory, ideal point method (IPM), and cloud entropy optimization algorithm to deal with this problem. The matter-element extension cloud model (MEECM) can clearly represent the characteristics of the object to be evaluated. IPM is used to determine the weight of the index. For the improved matter-element extension model, the traditional rules of “3En” and “50% relevance” are taken into account, and the method of solving the entropy is optimized. Then, for the correlation degree between the object to be evaluated and the graded normal cloud, the weight vector solved by the IPM is used to weigh the cloud correlation degree, which can give a reliable evaluation result. The health evaluation index system of power market operation includes 16 sub-indicators in five categories: supply side, demand side, coordinated operation, market security, and sustainable development. In the empirical analysis, the OHDPM situation in Y Province was evaluated in May 2019. The results prove that the OHDPM level is medium, and the importance and health level of each index are given. The reliability of the power system, transaction price stability, Lerner index, residual proportion of producers, and user satisfaction have a greater impact on the health status. Finally, in order to verify the validity and stability of the model, different methods are used to evaluate the evaluation objects, and the advantages of OHDPM evaluation based on the model framework proposed in this paper are proven.

1. Introduction

Electricity plays an indispensable role in human economic and social development [1]. In order to break the monopoly of the power industry, promote the development of the industry, and foster structural transformation and industrial upgrading, a new round of power system reform was launched in 2015. The main objective of this reform was to establish a market structure and system with effective competitiveness, and improve the operational efficiency of the electricity market [2], while at the same time strengthening the overall planning and scientific supervision of electricity, and improving the level of security and reliability of electricity. By the end of 2018, the market-oriented trading electricity was about 2.1 trillion kilowatt-hours, accounting for nearly 40% of total electricity sales in China [3], and some other achievements have been made. However, the installed capacity of non-fossil energy power generation is 770 million kilowatts, accounting for 40.8% of the total installed capacity of China’s power generation, which also increases the risk of stable operation of the electricity market. The problems of unstable operations, of the desire for clean energy consumption, and the need to ensure clean development of coal and electricity should not be overlooked [4,5]. Faced with the complex and multidimensional operational environment of the electricity market, regular evaluation of the operational situation is helpful to grasp the existing problems in the development in a timely manner [6,7]. Therefore, it is necessary to consider all aspects of power market operation and evaluate its situation to help government departments, power regulatory authorities, power exchange centers, and market players to grasp the current market development situation in a timely manner, so as to ensure that China’s power industry achieves sustainable development [8].
Based on the above, the purpose of OHDPM evaluation is clarified, and the concept of OHDPM is put forward on the basis of analyzing the operational efficiency of the power market [9]. OHDPM is the ability of the system to achieve optimal operations and resource optimization and remain competitive in the power market, which is based on the security of the power system and the security of the market economy, under the combined effect of moderate regulation and free competition, through market-oriented means. OHDPM is a comprehensive judgment on the efficiency, security, stability, and sustainability of market operations, which can provide a reference for future development.
At present, there are many theories and methods to evaluate the construction, benefits, and risks of the electricity market, such as the theory of structure‒conduct‒performance (SCP) [10,11], SWOT analysis [12,13], Porter’s five forces analysis (PFFA) [14,15], the PEST analysis model [16,17], the system dynamics method [18,19], and so on. Considering the current process of power system reform and the operation of the power market, this paper evaluates OHDPM from the perspective of market stability and sustainable development, and establishes an evaluation framework. The evaluation framework includes five aspects: supply side, demand side, coordinated operation, market security, and sustainable development. Therefore, the evaluation of OHDPM can be regarded as a multi-criteria decision-making (MCDM) problem. Compared with other operation evaluation methods in an electricity-related market, the MCDM technique can consider various factors to comprehensively calculate quantitative objective data and determine qualitative indicators based on experts’ experience, which can effectively obtain credible evaluation results [20].
MCDM is widely used not only in research but also in practice. Common methods include TOPSIS [21], VIKOR [22], the correlation degree method [23], the FMEA method [24,25], the fuzzy comprehensive evaluation method (FCEM) [26], genetic algorithm [27], the entropy weight method [28], ANP [29], AHP [30], etc. These methods have specific advantages and applications. In order to make the results more reliable, some studies introduce linguistic hesitation theory and fuzzy set theory into these methods to make the evaluation results closer to reality [31,32]. However, it is difficult to overcome the problem of information distortion during the actual evaluation process. This is because linguistic information is transformed into real numbers, and uncertain decisions are transformed into precise categories. To some extent, this violates the original intention of using fuzzy methods [33,34]. When a single term cannot accurately express the evaluation information of an object, researchers propose uncertain linguistic variables, but a rough description of the uncertainty of qualitative information is inevitable, which will also lead to information distortion [35,36]. However, the cloud model is a method of computing language without the shortcomings of the above methods. It is a description of qualitative concepts, a development based on probability theory and fuzzy set theory, and allows the membership degree to fluctuate randomly within a certain range of central values, rather than a fixed number [37]. The cloud model can transform the uncertainty between qualitative concepts and quantitative values, and has applicability to MCDM problems based on linguistic information [38,39]. Dawei established a comprehensive evaluation model of power market operation efficiency based on extension cloud theory, and introduced credible factors to verify the credibility of the evaluation results [40]. Based on variable weight theory and normal cloud model, Lv carried out fuzzy comprehensive evaluation of power quality, and verified the accuracy and validity of the proposed method through an example [41]. At the same time, the cloud model has many applications in other fields, such as power load forecasting [42], system evaluation [43], risk assessment [44], etc., which verifies the evaluation effect of the cloud model in practical applications. Nevertheless, the MEECM method is seldom used in the evaluation of market operations.
We propose the concept of OHDPM and improve the MEECM method based on some theories to better evaluate the changing OHDPM situation in China. Considering all aspects of the power market, a comprehensive evaluation index system is established, and an improved MEECM method is proposed to improve the reliability of the evaluation framework. Specifically, indicators are the basis of the evaluation system and play a very important role. The traditional combination weighting method, although it achieves a reasonable distribution of subjective and objective weights, only makes the weights uniform, and weakens the difference between the main evaluation index and the secondary evaluation index, which is not fully in line with the actual situation [45]. We use the AHP method to calculate the subjective weight of the index, and the entropy method to calculate the objective weight of the index; then the ideal point method (IPM) [46] is used to combine these two methods to better discharge the interference information, and get a more objective index weight. Then, for the calculation of the correlation degree in MEECM, different cloud entropy determination methods may lead to conflicting decision results [47]. Therefore, an adaptive cloud entropy optimization algorithm for evaluating objects is proposed to improve the MEECM and obtain more accurate operational health status information.
According to the OHDPM’s evaluation results and index subordinate grade information, market participants can regularly evaluate and compare the health status of each index, and then improve the operational efficiency of the market. The main contributions of this paper are as follows:
(1)
Combined with the objectives of China’s power system reform and the current stage of electricity market development, the concept of OHDPM is put forward, and a comprehensive evaluation index system for measuring OHDPM is established. The index system comprehensively reflects the operational status of the electric power market from the aspects of supply side, demand side, coordinated operation, safety, and sustainable development.
(2)
In order to realize a reasonable conversion between qualitative information and quantitative data in the evaluation process, an improved MEECM method is proposed to evaluate the OHDPM status. We introduce the IPM into the weight determination method of AHP and the entropy weight method, which better achieves the purpose of seeking the ideal weight by the comprehensive weighting method. In addition, based on the principle of the “3En” [48] and “50% relevance” rules [49], the cloud entropy optimization algorithm is used to obtain consistent and stable evaluation results.
(3)
In view of the reliability of the evaluation results, different methods are used to evaluate the same object, and a credibility factor is introduced to compare the reliability of the results, so as to verify the effectiveness of the framework structure proposed in the paper. The health status of each index is given, and the operation of the evaluation object is analyzed as both a whole and a part. The evaluation results can provide a valuable reference for government departments, power regulatory agencies, power trading centers, market participants, etc.
This paper consists of six sections. The second section introduces the framework of the evaluation model, including the basic theory, the improvement principle of the method, and the implementation steps of the evaluation model. The third section constructs an OHDPM index system from five dimensions. Then the fourth section carries out the empirical analysis, chooses the electricity market operation situation of Y Province in May 2019 as the evaluation object, and carries out the appraisal. The fifth section is the analysis and discussion of the evaluation results. In the last section, we draw conclusions.

2. Evaluation Theory and Method of OHDPM

In this section, first, the basic theory of MEECM is introduced. Second, we explain how to use IPM to determine index weight and how to use the cloud entropy optimization algorithm to improve the accuracy of entropy. Then, these two methods are applied to MEECM, and the specific implementation steps of OHDPM evaluation are described in detail.

2.1. Matter-Element Extension Cloud Theory

2.1.1. Cloud Model

The cloud model is an uncertain transformation model from qualitative to quantitative based on fuzzy theory and probability theory [50]. The cloud model has been proven to be an effective method for solving uncertainty problems with the advantages of fuzziness and randomness, and has also been applied to some practical problems [51,52]. The cloud model can use three digital features ( E x , E n , H e ) to express qualitative concepts [53]. Through the corresponding cloud generator, the transformation of qualitative concepts to quantitative values can be completely represented, and the fuzziness and randomness of concepts can be organically combined.
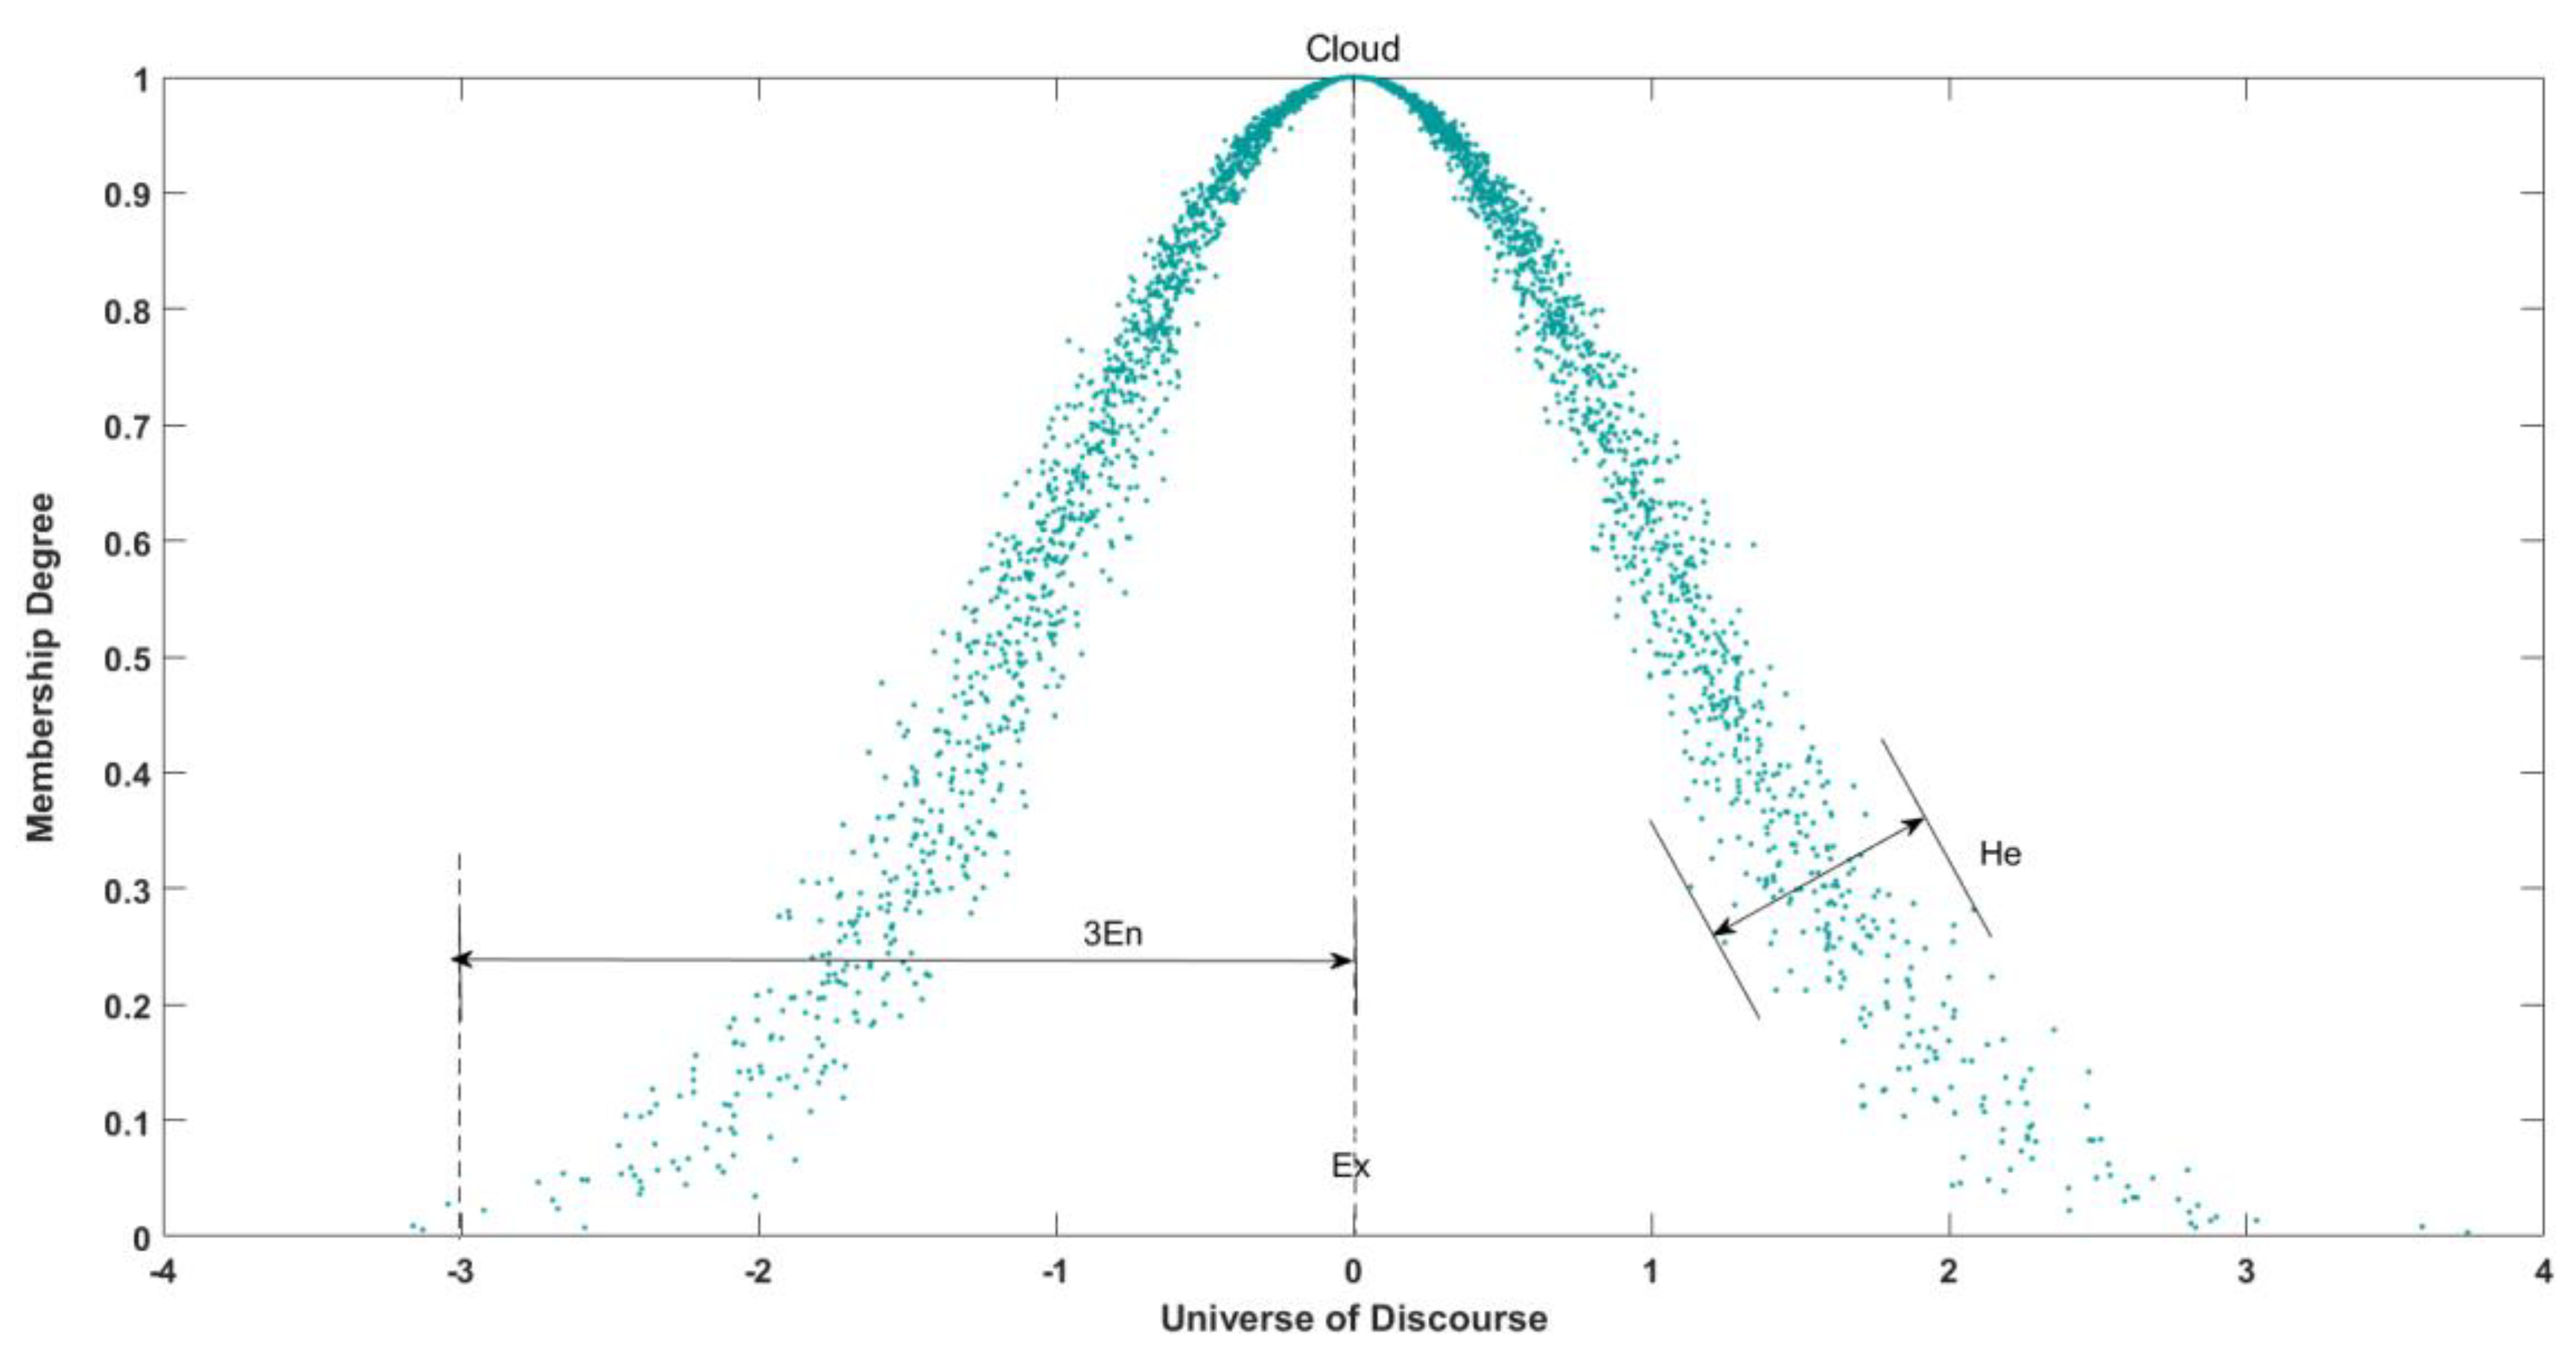
For the cloud eigenvalue, the expected value ( E x ) represents the center value of the membership cloud, which fully reflects the concept of OHDPM classification grade. Entropy ( E n ) is a mathematical description of the uncertain size of attribute concept, which reflects the randomness of index data in OHDPM level evaluation process, and effectively portrays the fuzziness and randomness of the grading boundary in the process of evaluating. Hyperentropy ( H e ) is the entropy of entropy, objectively describing the degree of correlation between fuzziness and randomness of each evaluation index [54]. In order to visualize the above concepts, a cloud model with numerical characteristics of (0,1,0.1) and the number of cloud droplets N c d = 3000 is taken as an example in this paper for drawing. The diagrammatic sketch is shown in Figure 1.

2.1.2. MEECM Theory

“” in the matter element evaluation method refers to the name, features, and characteristic value of things, which can reflect the dialectical relationship between quantity and quality, so it can describe the transformation process of objects more closely [55]. Matter elements are generally expressed as R = ( N , C , v ) , where N is the name of the thing, C is the feature of the thing, and v is the characteristic value of the feature C , usually expressed as a determined value or numerical interval. When a thing has multiple attributes, the traditional matter element can be expressed as in Equation (1) [56]:
R = [ N C 1 v 1 N C 2 v 2 N C n v n ] .
The uncertainties of the normal cloud model are introduced into the traditional matter-element theory, and the MEECM is obtained as shown in Equation (2):
R = [ N C 1 ( E x 1 , E n 1 , H e 1 ) N C 2 ( E x 2 , E n 2 , H e 2 ) N C n ( E x n , E n n , H e n ) ] .

2.2. Method for Determining the Comprehensive Weight of Indicators Based on IPM

The AHP method is an effective system analysis method put forward by Saaty in the 1970s; it is a mature subjective weighting method [57], but is vulnerable to the subjective limitation of expert opinion. The entropy weight method is a measure of the uncertainty of a system state [58]. Using the intrinsic information of each scheme, the entropy of each evaluation index can be obtained through the entropy weight method, and then the weight of each index can be obtained. The entropy weight method is more sensitive to the difference of indicators, that is, the difference of sample data of indicators has a greater impact on the weight results.
The determination of weights of OHDPM evaluation indicators is a key step in the comprehensive evaluation process. Because the results of the single weighting method are easily distorted, the AHP and entropy weight methods are used to combine the indicators, and the method of comprehensive weighting of indicators based on ideal points is used to solve the problem. Ideal point method (IPM) is a MCDM method that chooses the best compromise solution from many candidate solutions [59]. The objective and subjective weights are combined by IPM, which not only reflects the subjective experience of decision-makers, but also makes full use of the original data of indicators, so as to obtain more real and objective weights of indicators. The basic idea is to minimize the deviation between the vector objective function and the ideal point of the problem, and then automatically solve the weight of each index by establishing a mathematical programming model [60]. The specific steps are as follows.
Step 1: Subjective weight calculation of indicators based on AHP.
Let C i ( i = 1 , 2 , n ) denote the evaluation indicators and E l ( l = 1 , 2 , L ) denote expert groups. The weight vector of the subjective weighting method is calculated by AHP and expressed by α = [ α 1 , α 2 , , α n ] , where α i represents the subjective weight of index i .
Step 2: Objective weight calculation of indicators based on the entropy weight method.
The weight vector of objective weighting method is obtained through the entropy weight method, which is expressed as β = [ β 1 , β 2 , , β n ] , where β i represents the objective weight of index i .
Step 3: Constructing the ideal scheme.
Let the ideal values of each index be expressed by u i * ( i = 1 , 2 , n ) . If the comprehensive weight of indicators based on the ideal point is expressed by w = [ w 1 , w 2 , , w n ] , w i represents the weight of index i , and the index value corresponding to the ideal scheme can be expressed by B * = ( b 1 * , b 2 * , , b n * ) = ( w 1 u 1 * , w 2 u 2 * , , w n u n * ) , where B i * = b i * = w i u i * denotes the weighted value of index i in an ideal scheme. If the corresponding index values of the schemes to be evaluated are expressed as u i ( i = 1 , 2 , n ) , then the subjective evaluation results of the schemes to be evaluated are expressed as B ( α ) = ( b 1 ( α ) , b 2 ( α ) , , b n ( α ) ) = ( α 1 u 1 , α 2 u 2 , , α n u n ) ; similarly, the objective evaluation results of the schemes to be evaluated are expressed as B ( β ) = ( b 1 ( β ) , b 2 ( β ) , , b n ( β ) ) = ( β 1 u 1 , β 2 u 2 , , β n u n ) .
Step 4: Calculating the distance between each scheme and the ideal scheme.
The distance between the w-weighted schemes to be evaluated and the ideal scheme is expressed by Equation (3):
d = i = 1 n ( b i b i * ) 2 = i = 1 n [ ( u i u i * ) w i ] 2 ,
where b i represents the weighted value of index i in the scheme to be evaluated.
The smaller d is, the closer the evaluation scheme is to the ideal one. In order to facilitate calculation, the vectors are united according to Equation (4):
α = α α 1 2 + α 2 2 + + α n 2 β = β β 1 2 + β 2 2 + + β n 2 w = w w 1 2 + w 2 2 + + w n 2 ,
where the united weight vectors are denoted by α , β , and w , respectively. Correspondingly, α i , β i , and w i denote the united weight values of index i in the three different weight solving methods.
The square of the distance between the schemes to be evaluated and the ideal point corresponding to the weights of α , β , and w is expressed by d ( α ) 2 , d ( β ) 2 , and d ( w ) 2 , respectively. The calculation is shown in Equation (5):
d ( α ) 2 = l = 1 n [ ( u i u i * ) α i ] 2 d ( β ) 2 = i = 1 n [ ( u i u i * ) β i ] 2 d ( w ) 2 = i = 1 n [ ( u i u i * ) w i ] 2 .
Step 5: Constructing the minimum deviation model.
In order to take into account both subjective and objective weights, the combination weights are selected to minimize the weight deviation under subjective and objective combination weights. A nonlinear programming model of the distance deviation from the combination weight, subjective weight and objective weight to the ideal scheme is constructed, the deviation is expressed in h ( w ) , as shown in Equation (6):
h ( w ) = [ d ( w ) 2 d ( α ) 2 ] 2 + [ d ( w ) 2 d ( β ) 2 ] 2 = i = 1 n [ ( u i u i * ) 2 ( w i 2 α i 2 ) ] 2 + i = 1 n [ ( u i u i * ) 2 ( w i 2 β i 2 ) ] 2
Step 6: Determining the comprehensive weight of indicators.
For the extremum of the function, a Lagrange function is constructed to solve the problem [61], and then the extreme value of the function w i = ( α i 2 + β i 2 ) 2 ( i = 1 , 2 , n ) is obtained. By deriving the h ( w ) function, it is found that when w i takes this value, the first derivative is 0 and the second reciprocal is greater than 0, so the function h ( w ) is convex and the value is the minimum point of it. Through the above analysis, it is found that the value is the solution of combination weight. After normalization, the combination weight can be expressed by Equation (7):
w i = w i i = 1 n w i ( i = 1 , 2 , n ) ,
where i = 1 n w i 2 = 1 .

2.3. Cloud Entropy Optimization Algorithm

Constructing the graded normal cloud model of indicators is a key step in the health assessment of power market operations. The traditional extension cloud theory regards hierarchical boundaries as a double-constrained space [ c min , c max ] , and the method for the values of E x and E n is relatively fixed. However, as a measure of the ambiguity of the concept of state level, the size of cloud entropy E n reflects the acceptable numerical range of the concept of state level, which directly affects the accuracy of the results of the determination of index level. Based on scholars’ understanding of different angles of classification, there are two kinds of cloud entropy calculation methods.

2.3.1. Cloud Entropy Computing Method Based on “3En” Rule

The “3En” rule refers to the fact that the elements of cloud droplets located outside the interval [Ex − 3En, Ex + 3En] are low-probability events, which do not affect the overall characteristics of the cloud model and can be neglected. According to the rule, adjacent hierarchical extension clouds with clear boundaries are obtained, as shown in Equation (8) [8]:
E n = c max c min 6 .

2.3.2. Cloud Entropy Computing Method Based on “50% relevance” Rule

The rule of “50% relevance” refers to the correlation degree of cloud droplets located at the level boundary being equal to that of adjacent levels; both are 50%. By using the rule, an extension cloud with a blurred boundary at adjacent levels is obtained, which indicates that the critical value belongs to both the upper and lower levels. The calculation formula is as shown in Equation (9) [49]:
E n = c max c min 2.355 .

2.3.3. Cloud Entropy Optimization Algorithms

These two methods adopt different classifications to determine the entropy value of the graded normal cloud model from different angles, which may lead to conflicting state determination conclusions. Therefore, we use a cloud entropy optimization algorithm to solve the entropy problem [46], which guarantees the clarity of the classification and takes into account the principle of fuzziness.
Assuming that the actual measurement data of an evaluation index are represented by x i and its state level is m , the corresponding m-group hierarchical cloud model is established. ( E x ( j ) ) 1 × m and ( H e ( j ) ) 1 × m represent the cloud expectation set and cloud super-entropy set, respectively, ( E n ( j ) ) 1 × m and ( E n ( j ) ) 1 × m are the cloud entropy sets calculated by the above two algorithms, ( E n ( j ) ) 1 × m is the optimal cloud entropy set obtained by combinatorial optimization, and j ( j = 1 , 2 , m ) represents the rank number.
From the cloud correlation degree, function μ ( x ) can be regarded as a monotonically increasing function with E n as its independent variable, so for E n ( j ) E n ( j ) , the minimum correlation degree of corresponding grade j is the value of μ ( x ) ( j ) under the “3En” rule algorithm, expressed as μ ( x ) ( j ) min , and the maximum correlation degree of corresponding grade j is the value of μ ( x ) ( j ) under the “50% relevance” rule algorithm, expressed in μ ( x ) ( j ) max . Let the cloud entropy optimization algorithm get the correlation degree of grade j as μ ( x ) ( j ) , and use Δ μ ( x ) ( j ) max to express the maximum deviation of grade j correlation degree. The constructed function is shown in Equation (10):
Δ μ ( x ) ( j ) max = ( μ ( x ) ( j ) max μ ( x ) ( j ) ) 2 + ( μ ( x ) ( j ) μ ( x ) ( j ) min ) 2 .
Then, according to the principle of minimizing the maximum deviation, the sum of the maximum correlation deviations of the indicator observations x i for the standard hierarchical cloud model of group m should be minimized. Therefore, a nonlinear decision-making model of Δ μ ( x ) ( j ) max can be constructed, which is shown in Equation (11):
{ min Δ μ ( x ) max ( E n ) = j = 1 J Δ μ ( x ) ( j ) max s . t . E n ( j ) E n ( j ) E n ( j ) .
By solving the above model, the optimal cloud entropy set E n = ( E n ( j ) ) 1 × m of a single index for each level is obtained.

2.4. OHDPM Evaluation Method Based on Combination Method

2.4.1. The Grade Limit of OHDPM Evaluation Indicators

Referring to the relevant standards [62] and references [8,40,44], and considering existing research and expert opinions, we have sorted out the hierarchical boundaries of OHDPM impact indicators. Based on the experience of power market operation, we propose a hierarchical division method, that is, the hierarchical I-V corresponds to the lower, low, medium, higher, and high health levels. In addition, the index data of the evaluation object in the evaluation cycle are calculated and used as the basis for evaluation.

2.4.2. Establishment of MEECM with OHDPM Grade Limit

The OHDPM evaluation model is constructed by the matter element extension theory, the index weight determination method based on IPM, the cloud entropy optimization algorithm, and the cloud model. The concrete implementation steps are as follows.
(1)
Determination of the standard cloud [56]:
R 0 j = [ N j C 1 ( E x 1 , E n 1 , H e 1 ) j C 2 ( E x 2 , E n 2 , H e 2 ) j C n ( E x n , E n n , H e n ) j ] ,
where R 0 j represents the j -th ( j = 1 , 2 , m ) health level corresponding to the standard OHDPM. N j denotes the j -th health level; C i ( i = 1 , 2 , n ) represents an indicator for measuring the OHDPM, that is, the evaluation index. ( E x i , E n i , H e i ) j is the description of the value standard cloud of health level j in the evaluation index C i .
(2)
Determination of the matter element to be evaluated:
R 0 = [ P C 1 ( E x 1 , E n 1 , H e 1 ) C 2 ( E x i , E n i , H e i ) C n ( E x n , E n n , H e n ) ] ,
where P represents an object to be evaluated; ( E x i , E n i , H e i ) is the cloud description of the object to be evaluated about its assessment indicator C i .
(3)
Establishing a cloud model of health level boundaries based on various assessment indicators:
Step 1: Determine the expected values of the corresponding indicators for each graded normal cloud model.
First, the grade boundaries of OHDPM’s evaluation indexes are treated as a special double-constraint index [ c min , c max ] . Then, considering the randomness and fuzziness of the boundary information of the evaluation index classification level, the boundary is moderately expanded, and its parameters are described by ascending and descending semi-normal clouds, as shown in Equation (14) [8]:
E x = { c min + c max 2 ( 1 j m ) .
When the left or right boundary is not determined, it can be extended appropriately according to the threshold of the adjacent boundary.
Step 2: Entropy value solution based on the cloud entropy optimization algorithm.
Step 3: Determine the value of hyperentropy.
Let the hyperentropy of index i be expressed as H e i = τ , where τ is a constant that can be adjusted according to the actual situation.
Because H e represents the degree of cloud dispersion, the greater the degree of dispersion, the more the overall cloud will show a blurred boundary atomization phenomenon. Through a large number of statistics on the process of cloud atomization in [63], it is concluded that the critical condition of cloud atomization is H e = E n / 3 . When H e > E n / 3 , the cloud begins to atomize. Therefore, this principle is taken into account when selecting τ , and different τ are tested in the graded normal cloud model; the value that will not cause atomization is chosen as the value of H e in this model.

2.4.3. Cloud Association Degree Calculation

The extension cloud correlation degree is a function to evaluate the correlation between a certain index value and a graded normal cloud model. The index value x is regarded as a cloud drop, and then a random number E n with mean E n and standard deviation H e obeying normal distribution is generated. Then the cloud correlation degree k between the target to be evaluated and the OHDPM level extension cloud is calculated, as shown in Equation (15):
k = e ( x E x ) 2 2 E n 2 .
Through Equation (15), the extension cloud correlation degree between each index value of the matter element to be evaluated and the standard grade is calculated, and the comprehensive evaluation matrix K of OHDPM level is obtained, as shown in Equation (16):
K = [ k 11 k 12 k 1 m k 21 k 22 k 2 m k n 1 k n 2 k n m ] .
In the above formula, k i j is the correlation degree between the i-th ( i = 1 , 2 , n ) index of matter element P to be evaluated and the extension cloud model of the standard grade boundary of grade j ( j = 1 , 2 , m ) of OHDPM.

2.4.4. Determination of OHDPM Level

Based on the ideal point combination weighting method [58], the comprehensive weights of each evaluation index of power market operation health are obtained. The comprehensive evaluation vector of OHDPM level can be obtained by weighting the index weight and cloud correlation degree. The implementation steps for determining the OHDPM level are as follows.
Step 1: Calculation of comprehensive evaluation vector G .
The calculation of comprehensive evaluation vectors for OHDPM level evaluation is shown in Equation (17) [54]:
G = w T K = [ g 1 , g 2 , g m ] ,
where w is the comprehensive weight vector for each evaluation indicator and K is the comprehensive evaluation matrix.
Step 2: Computation of overall OHDPM evaluation score.
The weighted average method is used to obtain the overall evaluation score once its cloud digital characteristics are represented by A, B, and C, and the calculation methods are as shown in Equation (18):
E x Z = i = 1 n g i E x i i = 1 n g i , E n Z = i = 1 n g i 2 E n i i = 1 n g i 2 , H e Z = i = 1 n g i 2 H e i i = 1 n g i 2 .
Step 3: Repeatedly calculate the evaluation score to obtain a more reliable evaluation result.
According to the calculation formula of correlation degree, it can be seen that normal random numbers influence the process of calculating the correlation degree between the index data and the corresponding graded normal cloud model. Therefore, the average value of the evaluation score is obtained by repeated calculation, and the discrete degree of the repeated calculation results is analyzed to judge the fluctuation between the results. The calculation method is shown in Equation (19):
E ¯ x Z = E x Z 1 + E x Z 2 + + E x Z T T σ = 1 T t = 1 T ( E x Z t E x Z ) 2 ,
where T is the number of repeated calculations; E x Z t is the evaluation score of the health degree obtained by the t-th operation; and σ is the standard deviation of the result calculated by T times.
The expected value can represent the representative OHDPM evaluation score after multiple operations, and the standard deviation can reflect the reliability of the operation results. In order to measure the credibility of the evaluation results, this paper introduces a reliability factor θ . The larger the value, the greater the dispersion of evaluation scores and the smaller the credibility. It can be calculated by the formula θ = σ / E ¯ x Z [47].
Therefore, the expected value is regarded as the final evaluation score of OHDPM, that is, Z = E ¯ x Z .

2.4.5. Determination of OHDPM Level

Through the above steps, we can get the comprehensive evaluation vector G ; using the principle of maximum membership degree, we can get the OHDPM level of the object to be evaluated, and the corresponding specific score value is Z .

2.5. Calculation Framework

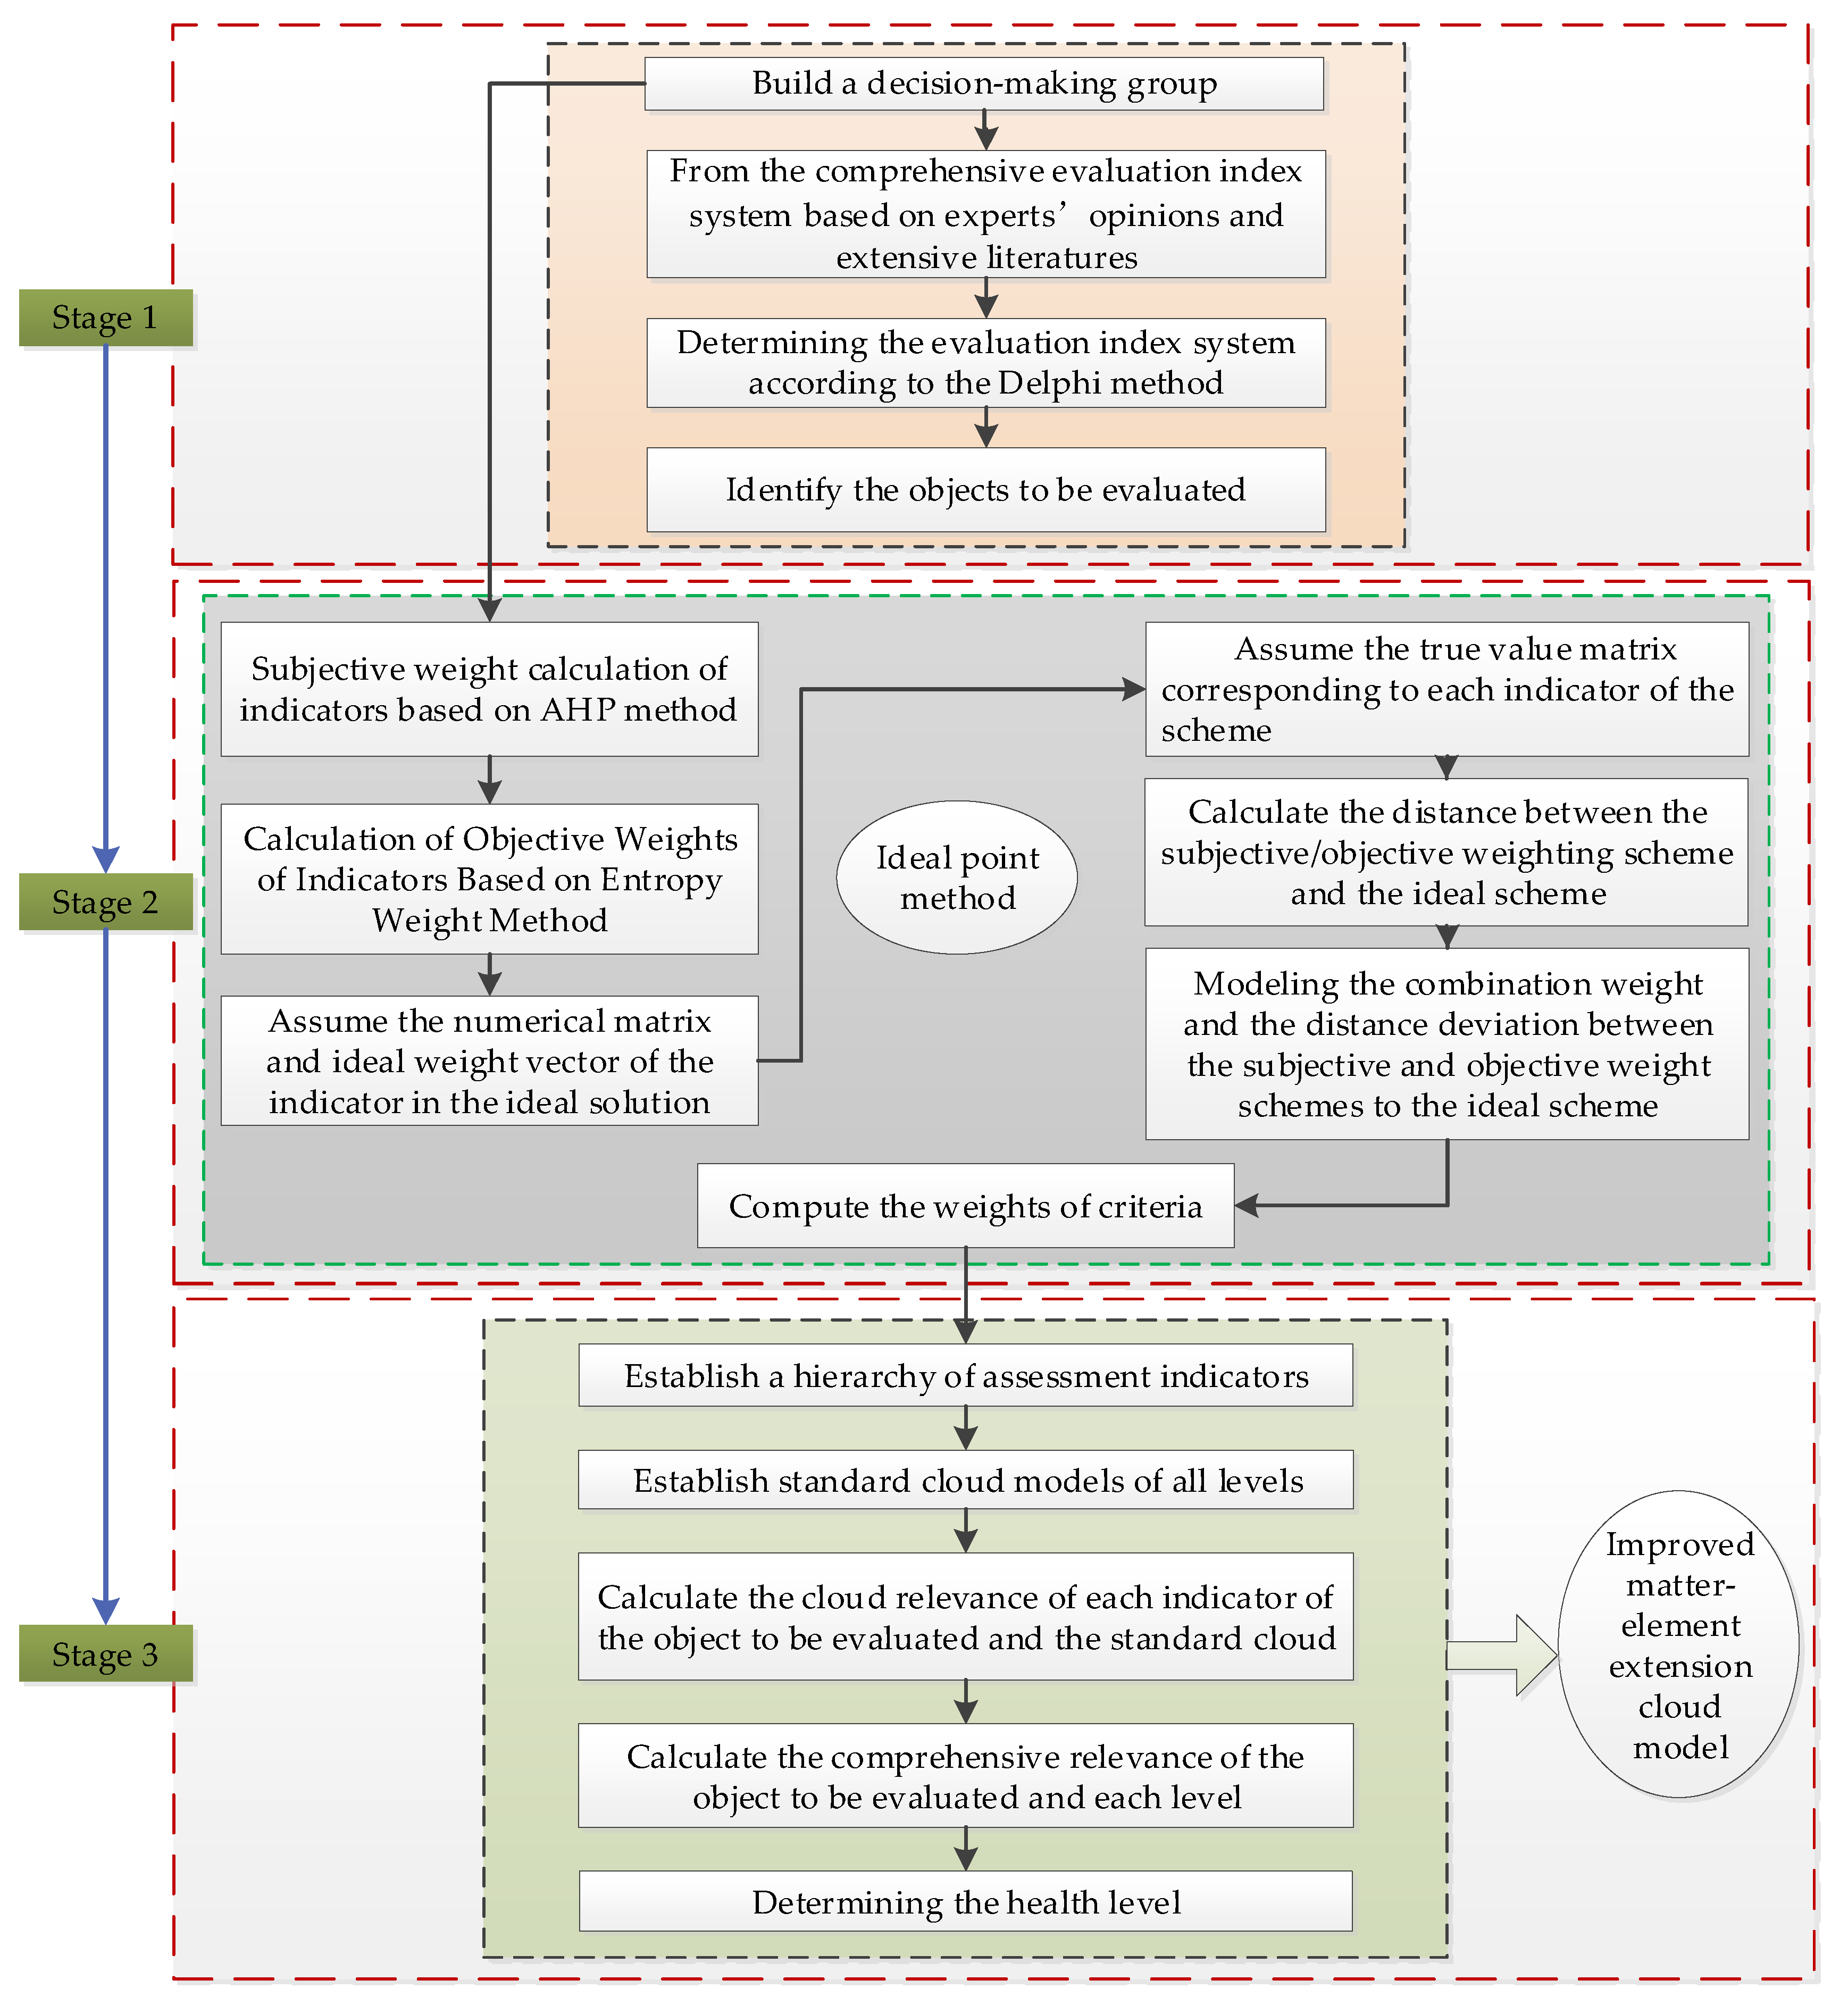
The model used to evaluate OHDPM is based on the Delphi method, IPM, and the improved MEECM method. Figure 2 shows a detailed evaluation process consisting of three stages.
Stage 1: Determine the key evaluation indicators from multiple dimensions, and identify the characteristics of the objects to be evaluated.
In the first stage, experts’ related fields are selected and included in the evaluation team. Then, experts are invited to conduct semi-closed questionnaires through the Delphi method, and the key indicators for evaluating OHDPM are determined.
Stage 2: The weights of indicators are determined based on the comprehensive weight calculation method of ideal points.
To determine the weights of criteria with IPM, the subjective weight and objective weight of the index are first calculated by the AHP and entropy weight methods. Then, the ideal scheme of OHDPM is constructed. Third, the distance between the objective and subjective weight corresponding schemes and the ideal scheme is established. Fourth, a nonlinear programming model of distance deviation from the combination weight, subjective weight, and objective weight scheme to the ideal scheme is constructed. Finally, a Lagrange function is constructed to solve the programming model, and the final combination weight is obtained.
Stage 3: Evaluate the OHDPM status by the improved MEECM method.
In this stage, the first step is to determine the level boundaries of OHDPM evaluation indicators, then calculate the cloud eigenvalues corresponding to each level of OHDPM, and establish graded normal cloud models of OHDPM. Next, the cloud correlation degree between each index of the object to be evaluated and the graded normal cloud model is calculated. Finally, the comprehensive correlation degree between the object to be evaluated and each level is calculated, and the OHDPM level is determined according to the principle of maximum membership degree.
The hybrid evaluation model, which combines the index weighting method of IPM and the improved MEECM method, has three advantages for evaluating OHDPM. The hybrid evaluation model, which combines the index weighting method of the ideal point and the improved MEECM method, has three advantages when evaluating OHDPM. First, the framework allows the membership degree to fluctuate randomly within the range determined by the central value, and achieves a reasonable transformation from qualitative concept to quantitative expression. Second, the comprehensive weight determination method based on ideal points is different from the traditional weighting method. It does not weigh the subjective and objective weights linearly, but realizes the optimal weight of adaptive adjustment according to the actual situation of the index. Finally, by improving the cloud entropy optimization algorithm and taking into account two kinds of cloud entropy calculation rules, the phenomenon of contradictory evaluation results is avoided, and evaluation results with high reliability are produced. Therefore, the hybrid model is suitable for dealing with practical problems.
3. Index System for OHDPM

Assessing OHDPM is similar to assessing people’s physical health, which requires different indicators. The evaluation index system is very important in the OHDPM evaluation process, so it is necessary to establish an index system that can reflect the inherent characteristics of power market operation. The evaluation of OHDPM is mainly to analyze whether the current electricity market has achieved effective competition, maximizing social welfare and optimizing the allocation of resources. Therefore, the evaluation index system is established from five aspects: supply side, demand side, coordinated operation, market security, and sustainable development, hoping to fully reflect the operational health of a power market.

3.1. Construction of OHDPM Evaluation Index System

For the supply side, the scale, quantity, and concentration of such market participants can reflect the degree of competition and operation of power market. For the demand side, it mainly includes power selling companies, retail market users, wholesale market users, etc. The operational status of the demand-side market can be assessed by users’ satisfaction with the services provided in the current electricity market and their willingness to participate in relevant activities. For coordinated operation indicators, the electricity market provides a forum for supply-side and demand-side transactions, and the two sides choose different forms of power commodity ownership to exchange by appropriate trading methods. The indicators affecting the coordinated operation of the power market are analyzed from two aspects: power trading and market construction. For market security indicators, market security includes power system security and market economy security, which are the necessary conditions to ensure the normal operation of the power market. Sustainable development indicators can reflect the characteristics of sustainable development in energy, the environment, and the economy.
After consulting the literature, 23 indicators were initially identified as alternative indicators. The index system is shown in Table 1.

3.2. Determination of OHDPM Evaluation Index System

Six groups of experts were invited to conduct a questionnaire survey on the OHDPM indicators system and qualitative indicators in a subsequent case analysis. The relevant information of the expert groups is shown in Table 2.
A semi-closed questionnaire survey was conducted with the Delphi method for the preliminary established evaluation index system. The results of each round were sent to the expert groups as a reference, and the steps were repeated until consistent results were obtained. The screened evaluation index system is shown in Table 3, in which indexes C6, C7, C10, C11, and C12 are qualitative and the others are quantitative.

4. Empirical Analysis

The electricity market situation in Y province of China in May 2019 was selected as the evaluation object. The data of each evaluation index were obtained by combining the collected data, the operational data of the local power grid, and the operational evaluation given by experts, as shown in Table 4.

4.1. Determining the Grade Limits of OHDPM Evaluation Indicators

The grade limitation and index data of indexes are obtained as shown in Table 4. Because the indicators C6, C7, C10, C11 and C12 are not easy to be expressed by direct operation data, expert scoring method is used to evaluate the operation of the indicators, and the classification boundaries of the health level of power market operation are consistent. The index ranks are lower, low, medium, higher and high from left to right.

4.2. Extension Graded Normal Cloud Model for OHDPM Evaluation Indicators

4.2.1. Computation of the Graded Cloud Eigenvalues of OHDPM and Its Assessment Indicators

According to Equation (14), the E x calculation results can be obtained. According to the cloud entropy optimization algorithm, the grade limit cloud model of each evaluation index is obtained. By trying out several data points in the range of cloud entropy, it is found that the graded normal cloud map distribution is more suitable when H e is 0.05, so it may be better to make H e = 0.05 . The grade limit cloud model of the OHDPM evaluation index is shown in Table 5.

4.2.2. Graded Normal Cloud Model Map of OHDPM

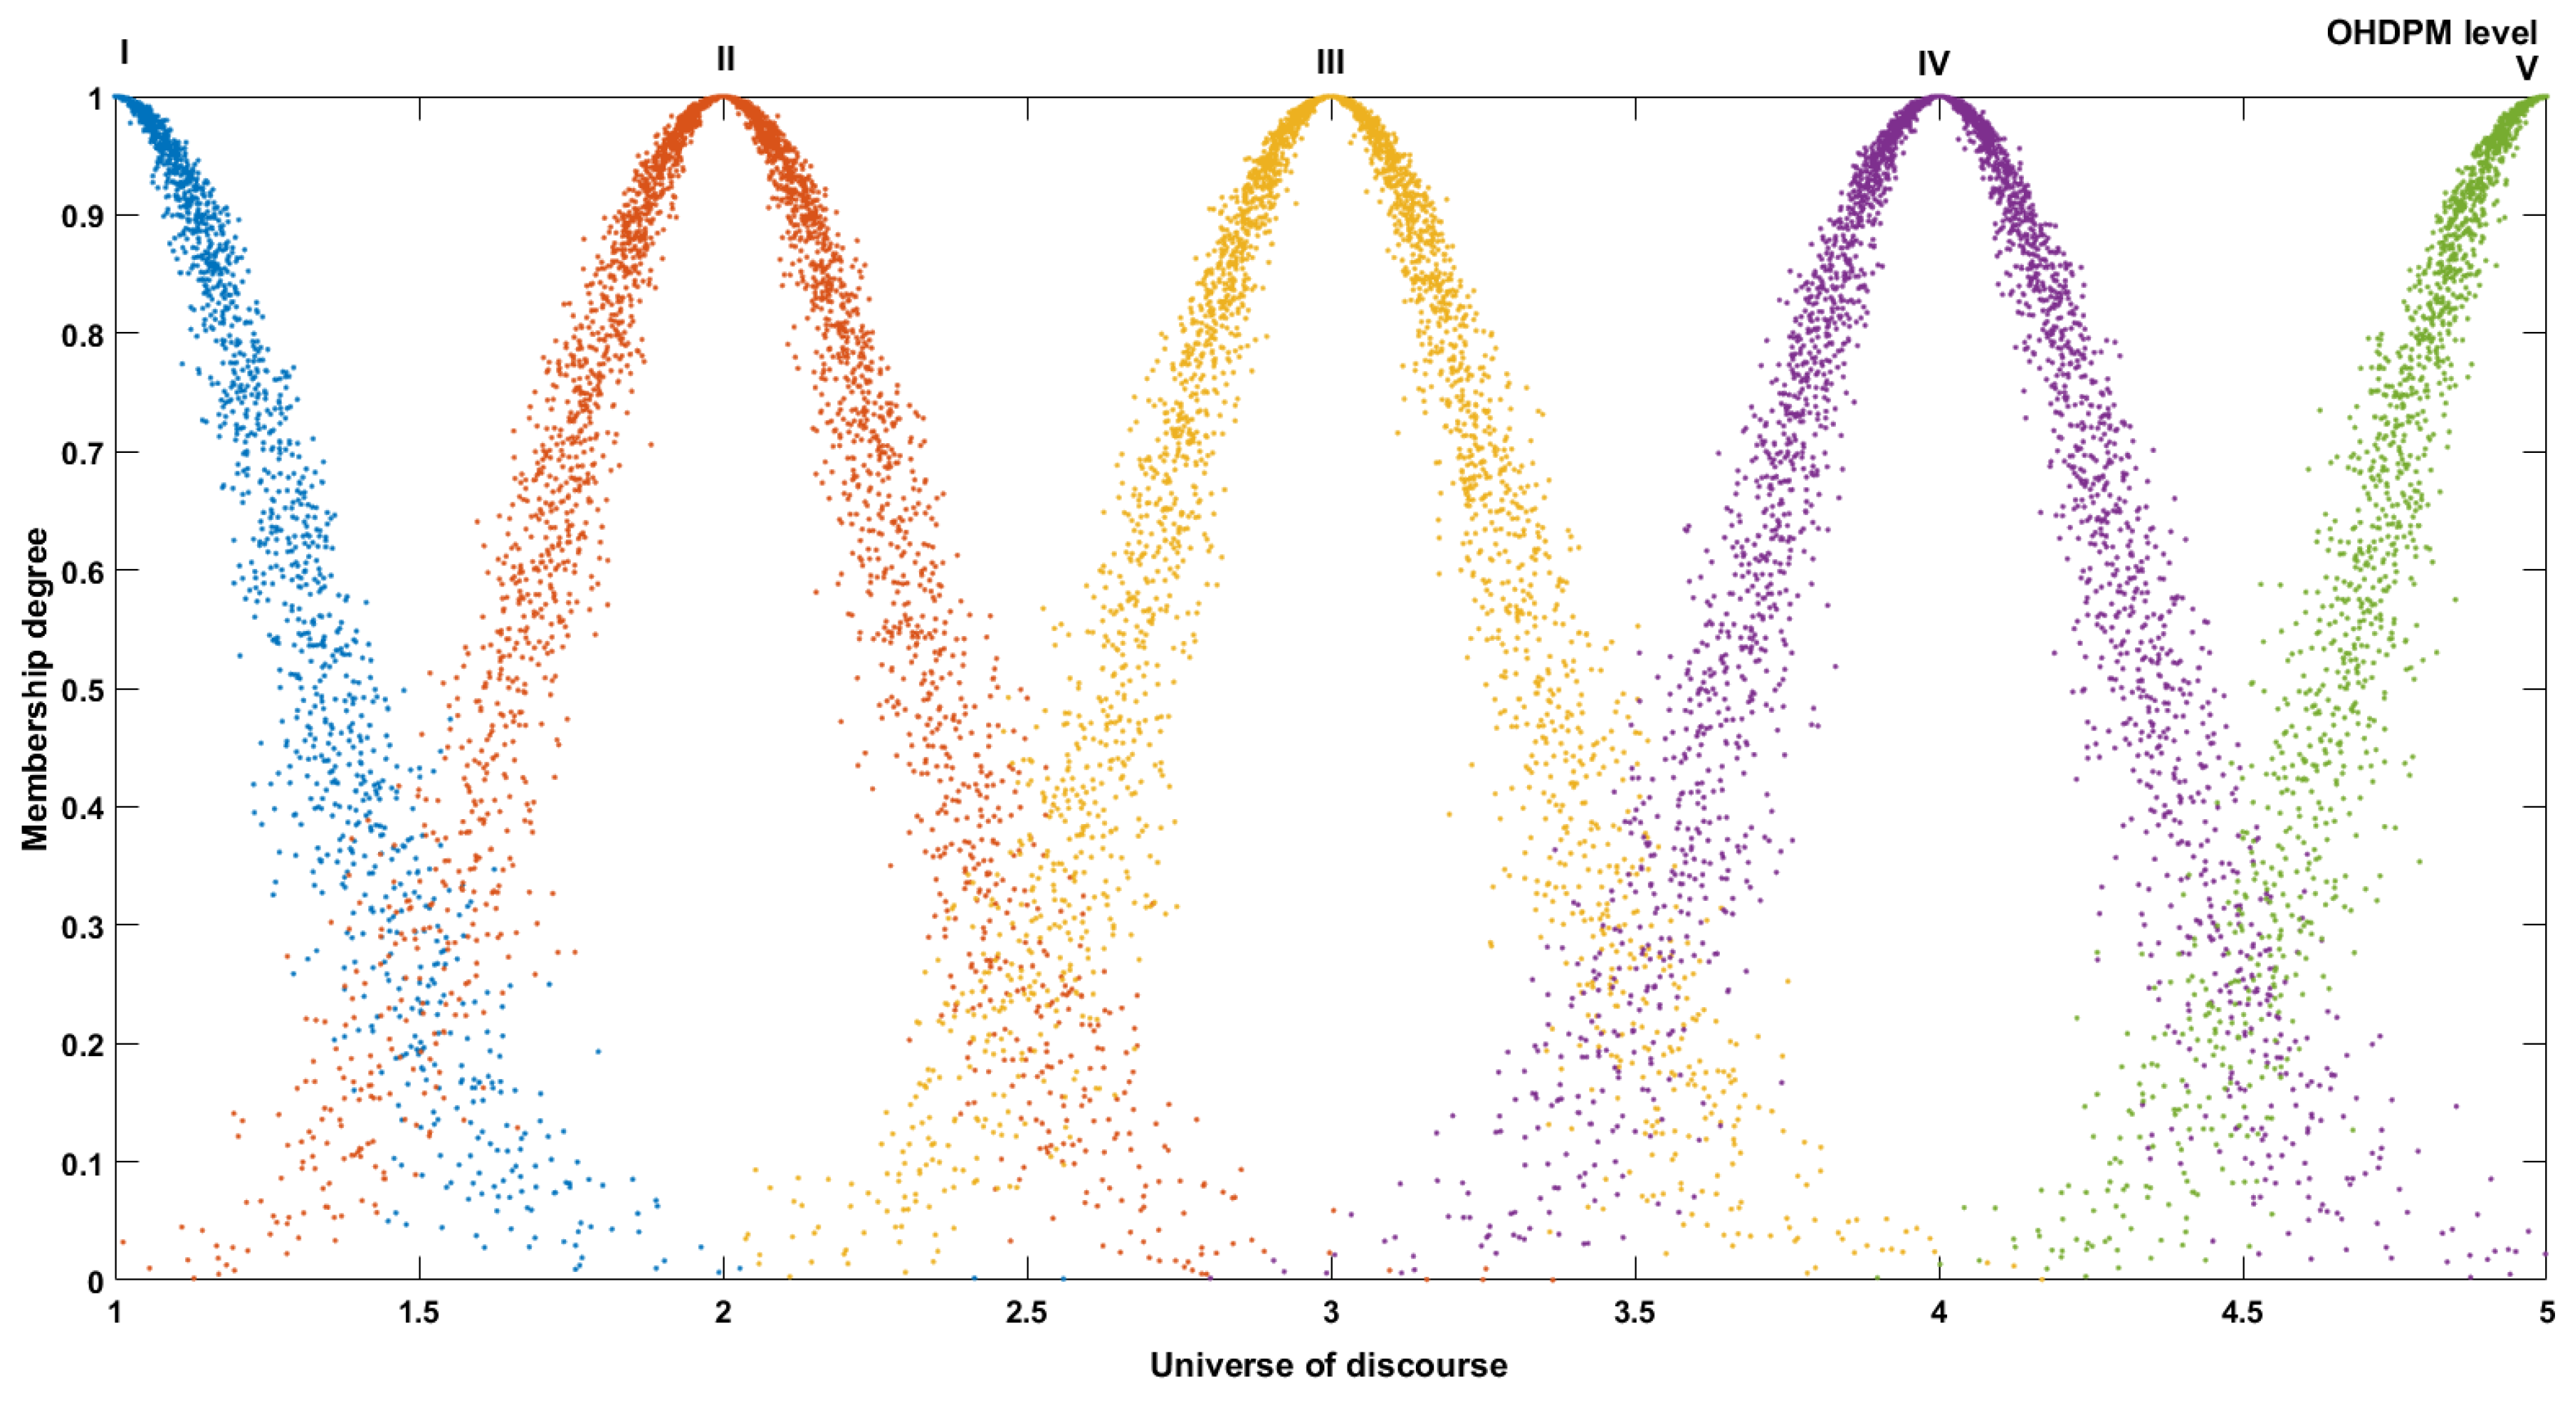
According to the digital characteristics of the five grades of index C0, the distribution of the OHDPM graded normal cloud is shown in Figure 3.
The horizontal axis represents the domain of evaluation scores, and the vertical axis represents the membership degree. Each cloud droplet has its corresponding eigenvalues ( E x , E n , H e ) . These blue, orange, yellow, purple, and green cloud droplets represent the distribution of the graded normal cloud model of grades I–V, respectively.

4.3. Computing the Cloud Association Degree

Equation (15) is used to calculate the correlation degree between the index of matter element to be evaluated and the graded normal cloud model of OHDPM. The comprehensive evaluation matrix K of OHDPM grade is obtained, which is shown in Table 6 for convenience of representation.

4.4. Determination of Comprehensive Weight of Indicators

In order to obtain more accurate evaluation results, experts in power-related fields were invited to evaluate the operation of power market in Y province in May 2019. After several rounds of collation and feedback, more consistent and objective evaluation results were obtained. Then, the entropy weight method and AHP were used as the basic data, and the real and objective index weights were obtained by the index comprehensive weighting method based on ideal points, as shown in Table 7.

4.5. Determination of OHDPM Level

4.5.1. Computing the Comprehensive Evaluation Vector G of OHDPM

The value of the comprehensive evaluation vector represents the comprehensive cloud correlation between OHDPM status and graded normal cloud model in Y province during the assessment period. G = (0.002474, 0.004487, 0.041300, 0.004314, 0.000000) is calculated by Equation (18).

4.5.2. Calculating the Score of OHDPM

The weighted average method is used to get the evaluation score of OHDPM, and the results of three replications are 2.8562, 2.8542, and 3.8603. In order to ensure the credibility of the results, the number of repetitions in this round was set to 500, that is, T = 500 . In addition, because of E n i = 0.296 ( i = 1 , 2 , 3 , 4 , 5 ) , H e = 0.05 , E n Z is a fixed value of 0.296, and H e Z is a fixed value of 0.05, so the cycle does not affect the calculation results.
The expected value of the circular calculation is E ¯ x Z = 2.8547 , the standard deviation is E ¯ x Z = 0.0296 , and the credibility factor is σ = 0.0049 . Therefore, the final OHDPM evaluation score is 2.8547. The results of OHDPM in May 2019 in this province can be expressed as cloud digital eigenvalues (2.8547, 0.296, 0.05).

4.5.3. Determination of OHDPM Level

Based on the above results, a comprehensive evaluation vector G can be obtained, and the health status of the province’s electricity market in the evaluation cycle can be compared with the standard grades, as shown in Table 8.

5. Findings and Discussion

5.1. Analysis of Evaluation Results of OHDPM in Y Province

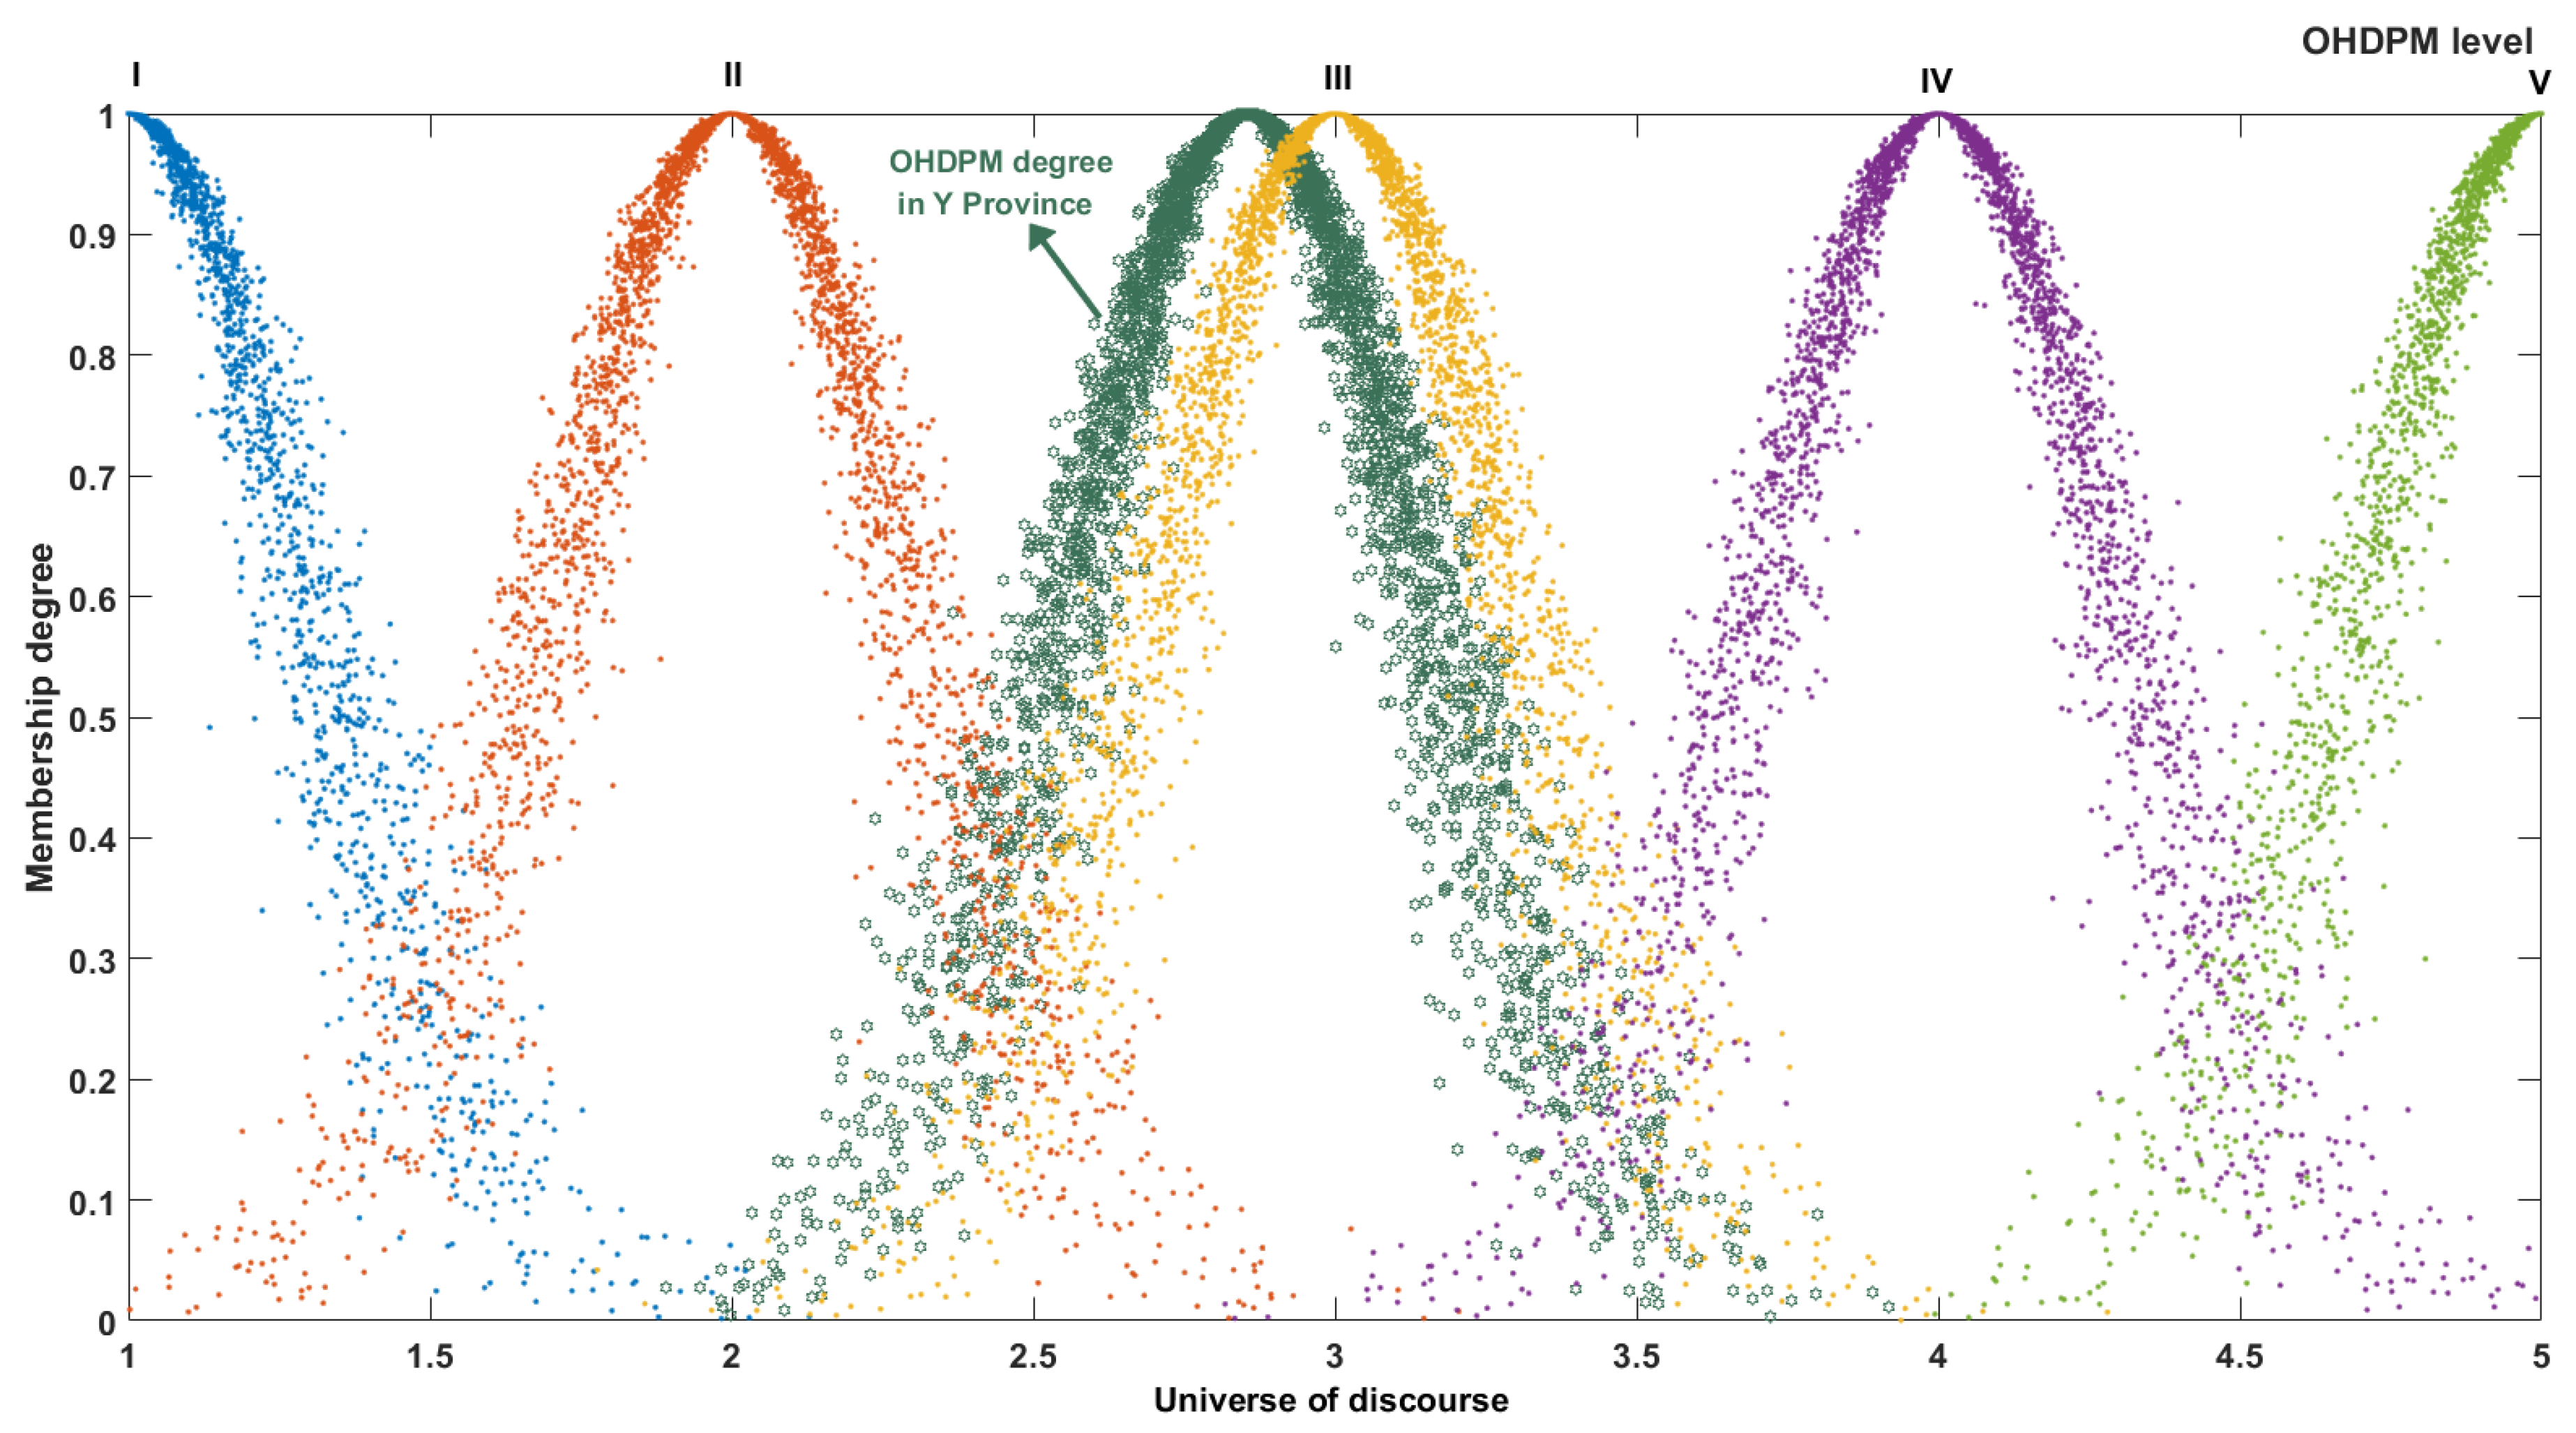
According to the data in Table 8 and the principle of maximum membership degree, it is concluded that the OHDPM level of the province in this evaluation cycle is medium. The results can be expressed more clearly with a cloud image, as shown in Figure 4.
Figure 4 shows the distribution of OHDPM evaluation results in Y province. It can be seen that the distribution of cloud droplets in OHDPM evaluation results during the evaluation cycle is close to that of grade III, which proves that the health status of OHDPM is medium.
According to the cloud correlation data of each index and the standard health level in Table 6, the health level of each index can be judged. In order to analyze the health level and weights of each index more intuitively, the radar chart drawn by combining the data from Table 6 and Table 7 is shown in Figure 5.
Compared with the overall situation of OHDPM in Y province expressed in Figure 4, Figure 5 shows the situation affecting the indicators of OHDPM. In the radar chart shown in Figure 5, dotted lines represent the weight of 16 indicators, that is, the importance of influencing the development of the power market is represented by dotted lines, and the importance of dotted lines increases from inside to outside. The solid line represents the OHDPM level of 16 indicators, and the grade is higher as you move from inside to outside. In addition, the larger the area surrounded by the solid line, the higher the level of operational health of the market.
Power system reliability (C12), transaction price stability (C13), Lerner index (C4), producer surplus ratio (C5), and customer satisfaction (C6) are the five most important indicators, as shown in Figure 5. The importance of indicators C12 and C13 is much greater than that of the other indicators, as they have great impacts on OHDPM. The health level of indicator C12 is IV, which indicates that the reliability of the power system in Y province is higher. Indicator C13 is in grade III, which shows that the declaration behavior of market participants involved in the transaction is rational. The fluctuation of electricity transaction price is within a reasonable range, and will not cause economic security problems because of the excessive fluctuation of the market price. The health level of indicator C4 is III, which indicates that the competition in the electricity market in this province is quite high. The state level of indicator C5 is V, which represents that the deviation degree between the price and cost of electricity transaction in the province is relatively small. No power generation enterprises in the market obtain excess profits, there is no strong market power behavior, there is reasonable concentration and market equilibrium, and the overall interests are relatively large. Index C6 is in IV, which shows that the electricity sales companies, retail market users, and wholesale market users in this province are satisfied with the operation of the electricity market.
On the whole, Top 4 (C2) and RSI1 (C3) on the supply side have a health level of II. There may be oligopoly in the market. Although there is no excess profit from the power market in this month, it needs to be monitored in future transactions. The health level of demand-side indicators is III and IV, which indicates that users are more enthusiastic in participating in market transactions and responding to demand. From the perspective of coordinated operations, the cross-provincial and cross-regional transaction rate (C9) is still at a low level. However, according to the power production structure of the province, clean energy accounts for a large proportion, and there is a large proportion of interprovincial and interregional planned power transmission, resulting in a low transaction rate, indicating that the degree of market openness still needs to be further strengthened. For the level of market security, the province’s electricity market security is relatively high. For sustainable development, the environmental sustainability is optimistic, but the ratio of electricity consumption to GDP annual growth rate (C16) is II, which shows that the future electricity consumption is not ideal and the development space of electricity demand is small. Therefore, we suggest that cross-provincial and cross-regional electricity transactions should be increased in the future, to give full play to the advantages of regional clean energy.

5.2. Comparison of the Results of Different Evaluation Methods

OHDPM evaluation is taken as an MCDM problem, and FCEM is a mature and widely used method in the evaluation process at present. Therefore, FCEM [36,64] is selected to evaluate the evaluation object, and the results are taken as a reference to prove the rationality of the method proposed in this paper. In addition, in order to verify the effectiveness and advancement of the proposed cloud entropy optimization algorithm, MEECM based on the “3En” rule, the “50% relevance” rule, and the cloud entropy optimization algorithm rule are used to evaluate the status of OHDPM on the basis of the weight determined by the IPM. The results are shown in Table 9.
As can be seen from Table 9, first, the expected values based on FCEM are 3.3075 and 2.7194, respectively, indicating that the level of OHDPM in Y province in May 2019 is III. The evaluation results of EMMCM method based on the “3En” rule, the “50% relevance” rule, and cloud entropy optimization algorithm are 2.6952, 2.7643, and 2.8547, respectively, indicating that the health level is also III, which shows that the introduction of the EMMCM method into OHDPM evaluation is reasonable. Second, the evaluation scores of the different FCEM have some deviations, which shows that the application scope of fuzzy comprehensive evaluation is limited by the characteristics of experts’ subjective experience. Finally, the credibility factors of the evaluation results of MEECM method corresponding to the above three cloud entropy algorithms are 0.0107, 0.0095, and 0.0049, respectively. The smaller the credibility factor is, the smaller the dispersion degree of the conclusion is and the greater the reliability of the result is, so the evaluation result of the MEECM method corresponding to the cloud entropy optimization algorithm is the most reliable. Therefore, the improved EMMCM method proposed in this paper can improve the reliability and accuracy of the evaluation.

6. Conclusions

Under the continuous reform of China’s electric power system, the evaluation of OHDPM level is of great significance to the operations and future development of the electric power industry. With the increasingly sense of competition between the use of resources and the health of the environment, the competition among the main bodies of the electricity market is becoming more and more fierce. There is no perfect evaluation system to measure the operational health of the electricity market. Therefore, this paper establishes an evaluation framework that can effectively evaluate the operations of the electricity market. First, according to the current concept and trend of power market development, the evaluation system of OHDPM is established from five aspects: supply side, demand side, coordinated operation, market security, and sustainable development. Then, OHDPM is evaluated by using an evaluation model based on the cloud model to improve the matter-element extension structure, although with the usual shortcomings of the general evaluation model, such as strong subjectivity of results and easy distortion of information. The model uses IPM based on AHP and the entropy weight method to determine the comprehensive weight of indicators. Taking into account the “3En” and “50% relevance” rules, the cloud model is improved by using the cloud entropy optimization algorithm. Then we calculated the correlation degree between the object to be evaluated and the graded normal cloud model, determined the health degree grade of each index to measure the health degree, and finally obtained the OHDPM level of Y Province in May 2019 as III by the weighted average method. According to the calculation results of the evaluation model, the operation situations of each index in the provincial electricity market were analyzed, and corresponding suggestions were put forward. In order to verify the reliability of the final results, “fuzzy comprehensive evaluation,” the “3En” rule, the “50% relevance” rule, and the cloud entropy optimization cloud model were used to evaluate and compare the credibility factors. The results showed that the improved cloud model based on the cloud entropy optimization algorithm was more reliable and suitable for OHDPM evaluation, which extends the application of the MCDM technique. In future research, more suitable methods can be introduced to evaluate the proposed OHDPM concept, and the results can be further compared with the hierarchical results of the OHDPM evaluation framework proposed in this paper. In addition, it is necessary to update the OHDPM evaluation index system according to the different stages of power market development.

Author Contributions

Conceptualization, J.D.; and D.W.; Formal analysis, D.W.; Investigation, L.N.; Methodology, P.A.; Writing—original draft, D.W.; Writing—review & editing, D.L.

Funding

This study is supported by the China Three Gorges consulting project (the 111 project, B18021) (Project), and the Beijing Social Science Foundation research base project (18JDGLB037) (Found).

Conflicts of Interest

The authors declare no conflict of interest.

References

  1. Buonomano, A.; Calise, F.; d’Accadia, M.D.; Vicidomini, M. A hybrid renewable system based on wind and solar energy coupled with an electrical storage: Dynamic simulation and economic assessment. Energy. 2018, 155, 174–189. [Google Scholar] [CrossRef]
  2. The State Council of the Central Committee of the Communist Party of China. Some Opinions on Further Deepening the Reform of the Electric Power System; No. 9 of China; The State Council of the Central Committee of the Communist Party of China: Beijing, China, 2015.
  3. China Electric Power Enterprise Federation. Annual Development Report of China Electric Power Industry. China Electr. Power Dly. 2018, 6, 14–38. [Google Scholar]
  4. Wang, J. Brief discussion on operation problems and Countermeasures of electric power market. China’s New Technol. Prod. 2018, 24, 132–133. [Google Scholar]
  5. Li, Y.; Shi, H.; Wu, J.; Wang, M.; Wang, D. Risk identification of power market operation management based on HFLTS-AHP. Control Eng. 2019, 26, 1003–1010. [Google Scholar]
  6. Lin, B.; Wu, W. Economic viability of battery energy storage and grid strategy: A special case of China electricity market. Energy 2017, 124, 423–434. [Google Scholar] [CrossRef]
  7. Hache, E.; Palle, A. Renewable energy source integration into power networks, research trends and policy implications: A bibliometric and research actors survey analysis. Energy Policy 2019, 124, 23–35. [Google Scholar] [CrossRef]
  8. Shi, S.; Wang, L.; Zhang, Q.; Liu, D.; Yang, T.; Liu, Z. Comprehensive Evaluation Research on Efficiency of Direct Power Trading Market: Based on Extension Cloud Theory. Price Theory Pract. 2018, 6, 146–150. [Google Scholar]
  9. Sun, J.; Yan, L.; Li, C. Dynamic evaluation of power market operation efficiency based on self-organization and co-evolution. East China Power 2013, 41, 1305–1310. [Google Scholar]
  10. Sköld, D.; Fornstedt, H.; Lindahl, M. Dilution of innovation utility, reinforcing the reluctance towards the new: An upstream supplier perspective on a fragmented electricity industry. Energy Policy 2018, 116, 220–231. [Google Scholar] [CrossRef]
  11. McMeekin, A.; Geels, F.W.; Hodson, M. Mapping the winds of whole system reconfiguration: Analysing low-carbon transformations across production, distribution and consumption in the UK electricity system (1990–2016). Res. Policy 2019, 48, 1216–1231. [Google Scholar] [CrossRef]
  12. Niu, D.; Song, Z.; Xiao, X. Electric power substitution for coal in China: Status quo and SWOT analysis. Renew. Sustain. Energy Rev. 2017, 70, 610–622. [Google Scholar] [CrossRef]
  13. Ervural, B.C.; Zaim, S.; Demirel, O.F.; Aydin, Z.; Delen, D. An ANP and fuzzy TOPSIS-based SWOT analysis for Turkey’s energy planning. Renew. Sustain. Energy Rev. 2018, 82, 1538–1550. [Google Scholar] [CrossRef]
  14. Türker Ahi, M.; Yildiz, K. Determining performance criteria of railway market: A case study. J. Open Innov. Technol. Mark. Complex. 2018, 4, 21–39. [Google Scholar]
  15. Pezzutto, S.; Grilli, G.; Zambotti, S.; Dunjic, S. Forecasting Electricity Market Price for End Users in EU28 until 2020—Main Factors of Influence. Energies 2018, 11, 1460. [Google Scholar] [CrossRef]
  16. Ma, B.; Liu, P.; Niu, D. Assessment of power industry development in China: Possibilities and challenges. J. Renew. Sustain. Energy 2018, 045903. [Google Scholar] [CrossRef]
  17. Hou, J.; Luo, S.; Cao, M. A review on China’s current situation and prospects of poverty alleviation with photovoltaic power generation. J. Renew. Sustain. Energy 2019, 11, 013503. [Google Scholar] [CrossRef]
  18. Jiang, Q.; Wang, Y.; Lin, H. Analysis on relationship between electricity wholesale market and retail market based on system dynamics method. Autom. Elect. Power Syst. 2016, 40, 77–84. [Google Scholar]
  19. Fontes, C.H.O.; Freires, F.G.M. Sustainable and renewable energy supply chain: A system dynamics overview. Renew. Sustain. Energy Rev. 2018, 82, 247–259. [Google Scholar]
  20. Zhao, H.; Zhao, H.; Guo, S. Comprehensive Performance Evaluation of Electricity Grid Corporations Employing a Novel MCDM Model. Sustainability 2018, 10, 2130. [Google Scholar] [CrossRef]
  21. Cavallaro, F.; Zavadskas, E.K.; Streimikiene, D.; Mardani, A. Assessment of concentrated solar power (CSP) technologies based on a modified intuitionistic fuzzy topsis and trigonometric entropy weights. Technol. Forecast. Soc. Chang. 2019, 140, 258–270. [Google Scholar] [CrossRef]
  22. Wu, Y.; Zhang, B.; Xu, C.; Li, L. Site selection decision framework using fuzzy ANP-VIKOR for large commercial rooftop PV system based on sustainability perspective. Sustain. Cities Soc. 2018, 40, 454–470. [Google Scholar] [CrossRef]
  23. Lee, C.; Lee, J.W.; Ryu, S.G.; Oh, J.H. Optimum design of a large area, flexure based XYθ mask alignment stage for a 12-inch wafer using grey relation analysis. Robot. Comput.-Integr. Manuf. 2019, 58, 109–119. [Google Scholar] [CrossRef]
  24. Fattahi, R.; Khalilzadeh, M. Risk evaluation using a novel hybrid method based on FMEA, extended MULTIMOORA, and AHP methods under fuzzy environment. Saf. Sci. 2018, 102, 290–300. [Google Scholar] [CrossRef]
  25. Dong, J.; Wang, D.; Dou, X.; Liu, D.; Nie, S.; Nie, L. Operational Risk Identification of Electric Power Market Management Committee Based on Intuitionistic Fuzzy FMEA and TOPSIS-GRPM Methods. Am. J. Environ. Resour. Econ. 2019, 4, 96–103. [Google Scholar]
  26. Zhang, L.; Xin, H.; Kan, Z. Sustainability Performance Evaluation of Hybrid Energy System Using an Improved Fuzzy Synthetic Evaluation Approach. Sustainability 2019, 11, 1265. [Google Scholar] [CrossRef]
  27. Hu, M.; Xiao, F. Price-responsive model-based optimal demand response control of inverter air conditioners using genetic algorithm. Appl. Energy 2018, 219, 151–164. [Google Scholar] [CrossRef]
  28. Yuan, J.; Li, X.; Xu, C.; Zhao, C.; Liu, Y. Investment risk assessment of coal-fired power plants in countries along the Belt and Road initiative based on ANP-Entropy-TODIM method. Energy 2019, 176, 623–640. [Google Scholar] [CrossRef]
  29. Dong, J.; Liu, D.; Wang, D.; Zhang, Q. Identification of key influencing factors of sustainable development for traditional power generation groups in a market by applying an extended MCDM model. Sustainability 2019, 11, 1754. [Google Scholar] [CrossRef]
  30. Ghimire, L.P.; Kim, Y. An analysis on barriers to renewable energy development in the context of Nepal using AHP. Renew. Energy 2018, 129, 446–456. [Google Scholar] [CrossRef]
  31. Liu, J.; Wei, Q. Risk evaluation of electric vehicle charging infrastructure public-private partnership projects in China using fuzzy TOPSIS. J. Clean. Prod. 2018, 189, 211–222. [Google Scholar] [CrossRef]
  32. Niu, D.; Li, S.; Dai, S. Comprehensive Evaluation for Operating Efficiency of Electricity Retail Companies Based on the Improved TOPSIS Method and LSSVM Optimized by Modified Ant Colony Algorithm from the View of Sustainable Development. Sustainability. 2018, 10, 860. [Google Scholar] [CrossRef]
  33. Han, C.; Zhao, Y.; Lin, Z. Critical lines identification for skeleton-network of power systems under extreme weather conditions based on the modified VIKOR method. Energies 2018, 11, 1355. [Google Scholar] [CrossRef]
  34. Seddiki, M.; Bennadji, A. Multi-criteria evaluation of renewable energy alternatives for electricity generation in a residential building. Renew. Sustain. Energy Rev. 2019, 110, 101–117. [Google Scholar] [CrossRef]
  35. Tseng, M.L.; Lim, M.; Wu, K.J. A novel approach for enhancing green supply chain management using converged interval-valued triangular fuzzy numbers-grey relation analysis. Resour. Conserv. Recycl. 2018, 128, 122–133. [Google Scholar] [CrossRef]
  36. Dong, J.; Huo, H.; Liu, D.; Li, R. Evaluating the comprehensive performance of demand response for commercial customers by applying combination weighting techniques and fuzzy VIKOR approach. Sustainability 2017, 9, 1332. [Google Scholar] [CrossRef]
  37. Zhang, J.; Chang, W.; Zhou, S. An improved MCDM model with cloud TOPSIS method. In Proceedings of the 27th Chinese Control and Decision Conference, Qingdao, China, 23–25 May 2015; pp. 873–878. [Google Scholar]
  38. Wu, G.; Duan, K.; Zuo, J. Integrated sustainability assessment of public rental housing community based on a hybrid method of AHP-Entropy weight and cloud model. Sustainability 2017, 9, 603. [Google Scholar]
  39. Wang, M.; Wang, X.; Liu, Q.; Shen, F.; Jin, J. A novel multi-dimensional cloud model coupled with connection numbers theory for evaluation of slope stability. Appl. Math. Model. 2019. [Google Scholar] [CrossRef]
  40. Dawei, S.; Meng, Y.; Hongkun, B.; Hujun, L.; Jiangbo, W.; Jiani, W.; Guangyu, Q. A Comprehensive Evaluation Model of Power Market Operation Efficiency Based on Extension Cloud Theory. Energy Procedia 2019, 156, 302–309. [Google Scholar] [CrossRef]
  41. Lv, C.; Tian, L.J.; Wang, Z. Fuzzy Comprehensive Evaluation of Power Quality Based on State Variable Weight and Normal Cloud Model. In Proceedings of the 2018 China International Conference on Electricity Distribution (CICED), Beijing, China, 23–24 August 2018; pp. 736–740. [Google Scholar]
  42. Deng, S.; Yuan, C.; Yang, L.; Zhang, L. Distributed electricity load forecasting model mining based on hybrid gene expression programming and cloud computing. Pattern Recognit. Lett. 2018, 109, 72–80. [Google Scholar] [CrossRef]
  43. Parra, D.; Zhang, X.; Bauer, C.; Patel, M.K. An integrated techno-economic and life cycle environmental assessment of power-to-gas systems. Appl. Energy 2017, 193, 440–454. [Google Scholar] [CrossRef]
  44. Liu, D.; Zhang, Q.; Li, X. Identification of Potential Harmful Behaviors in Electricity Market Based on Cloud Model and Fuzzy Petri Net. Autom. Electr. Power Syst. 2019, 43, 25–37. [Google Scholar]
  45. Wang, J.J.; Miao, Z.H.; Cui, F.B.; Liu, H.C. Robot evaluation and selection with entropy-based combination weighting and cloud TODIM approach. Entropy 2018, 20, 349. [Google Scholar] [CrossRef]
  46. Mavi, R.K.; Fathi, A.; Saen, R.F.; Mavi, N.K. Eco-innovation in transportation industry: A double frontier common weights analysis with ideal point method for Malmquist productivity index. Resour. Conserv. Recycl. 2019, 147, 39–48. [Google Scholar] [CrossRef]
  47. Liu, Y.; Xu, Z.; Fu, H.; Li, G.; Gao, S. The method of transformer insulation condition assessment based on extension cloud theory is improved by using optimal cloud entropy. High Volt. Technol. 2019, 7, 1–9. [Google Scholar]
  48. Yan, F.; Zhang, Q.; Ye, S.; Ren, B. A novel hybrid approach for landslide susceptibility mapping integrating analytical hierarchy process and normalized frequency ratio methods with the cloud model. Geomorphology 2019, 327, 170–187. [Google Scholar] [CrossRef]
  49. Wang, W.; Hou, B.; Su, J.; Ma, D. Evaluation of seismic service function of water supply network based on cloud matter element model. J. Beijing Univ. Technol. 2013, 39, 994–1001. [Google Scholar]
  50. Wu, Y.; Yang, M.; Zhang, H.; Chen, K.; Wang, Y. Optimal site selection of electric vehicle charging stations based on a cloud model and the PROMETHEE method. Energies 2016, 9, 157. [Google Scholar] [CrossRef]
  51. Li, T.; Yang, X. Risk assessment model for water and mud inrush in deep and long tunnels based on normal grey cloud clustering method. KSCE J. Civ. Eng. 2018, 22, 1991–2001. [Google Scholar] [CrossRef]
  52. Lu, Z.; Sun, X.; Wang, Y.; Xu, C. Green supplier selection in straw biomass industry based on cloud model and possibility degree. J. Clean. Prod. 2019, 209, 995–1005. [Google Scholar] [CrossRef]
  53. Liu, X.; Liu, Z.; Wu, G. Regional power grid security risk assessment based on FAHP and cloud model. J. Kunming Univ. Technol. (Nat. Sci. Ed.) 2018, 43, 71–77. [Google Scholar]
  54. Ma, L.; Ding, R.; Lu, Z.; Li, X. Comprehensive evaluation and sensitivity analysis of economic operation of distribution network based on extension cloud model. New Technol. Electr. Power 2016, 35, 8–16. [Google Scholar]
  55. Yu, W.; Jia, C.; Di, S.; Li, K.; Yuan, H. Groundwater quality evaluation based on comprehensive weight and improved matter-element extension evaluation model. J. Jilin Univ. (Geosci. Ed.) 2019, 49, 539–547. [Google Scholar]
  56. Wang, X.; Yu, H.; Lv, P.; Wang, C.; Zhang, J.; Yu, J. Seepage Safety Assessment of Concrete Gravity Dam Based on Matter-Element Extension Model and FDA. Energies 2019, 12, 502. [Google Scholar] [CrossRef]
  57. Ahmad, S.; Nadeem, A.; Akhanova, G. Multi-criteria evaluation of renewable and nuclear resources for electricity generation in Kazakhstan. Energy 2017, 141, 1880–1891. [Google Scholar] [CrossRef]
  58. Li, Y.; Sun, M.; Yuan, G.; Zhou, Q.; Liu, J. Study on Development Sustainability of Atmospheric Environment in Northeast China by Rough Set and Entropy Weight Method. Sustainability 2019, 11, 3793. [Google Scholar] [CrossRef]
  59. Li, A.; He, Z.; Zhang, Y. Bi-objective variable selection for key quality characteristics selection based on a modified NSGA-II and the ideal point method. Comput. Ind. 2016, 82, 95–103. [Google Scholar] [CrossRef]
  60. Xue, L.; Liu, B.; Zheng, Z.; Li, C.; Zhang, J.; Zhu, L.; Su, C.; Xu, C. Coal resource sustainability evaluation based on ideal point-extension cloud model. J. Nat. Resour. 2018, 33, 1657–1665. [Google Scholar]
  61. Jiang, Q.; Fang, D.; Zhang, G. Geological hazard risk assessment based on new combination weighting method. J. Nat. Disasters 2015, 24, 28–36. [Google Scholar]
  62. GB/Z 36046-2018, Standard for Evaluation of Electricity Supervision Indicators. National Energy Board Southern regulatory bureau. China Standardization Research Institute, 2018; 3, 1–40. [Google Scholar]
  63. Liu, Y.; Li, D. Statistical analysis of atomization properties of normal cloud model. J. Beijing Univ. Aeronaut. Astronaut. 2010, 36, 1320–1324. [Google Scholar]
  64. Li, R.; Dong, J.; Wang, D. Competition ability evaluation of power generation enterprises using a hybrid MCDM method under fuzzy and hesitant linguistic environment. J. Renew. Sustain. Energy 2018, 10, 055905. [Google Scholar] [CrossRef]
Figure 1. Diagrammatic sketch of cloud characteristics.
Sustainability 11 05470 g001
Figure 2. The computational framework of the proposed evaluation model.
Sustainability 11 05470 g002
Figure 3. Graded normal cloud model map of OHDPM.
Sustainability 11 05470 g003
Figure 4. A comparison of the OHDPM evaluation results with the graded normal cloud model.
Sustainability 11 05470 g004
Figure 5. Weight and health level of indexes.
Sustainability 11 05470 g005
Table 1. Preliminary evaluation index system of OHDPM.
CriteriaSubcriteriaIndex
Supply sideMarket structure
  • Herfindahl‒Hirschman index (HHI)
  • Top 4
  • Residual supply index of the maximum supplier (RSI1)
  • Lerner
Market Benefits
  • Producer surplus proportion
  • Linkage index of power price and generation cost
Demand sideDemand-side market effect
  • User satisfaction
  • User’s initiative to participate in demand response
  • Proportion of direct electricity transactions to total electricity consumption
Coordinated operationMarket transactions
  • Ratio of declared supply‒demand
  • The proportion of market-oriented transactions
  • Trans-provincial and cross-regional transaction proportion
Market construction
  • Indicators setting for market transactions
  • Horizontal of market supervision
Market securityPower system security
  • Power system reliability
Market economy security
  • Transaction rate of high-priced auction
  • Ratio of zero quotation
  • Stability of transaction price
Sustainable developmentEnergy security
  • Ratio of coal supply to demand
  • Fuel diversity index
Environmental sustainability
  • Proportion of clean energy generation
  • Emissions per unit of power generation
Economic sustainability
  • Ratio of electricity consumption to gross domestic product (GDP) annual growth rate
Table 2. Main characteristics of expert groups.
FeaturesE1E2E3E4E5E6
AffiliationSupply-side power generation enterprisesDemand-side power purchase enterprisesElectric power trading agencyElectric power dispatching agencyResearch institutionsGovernment
Experience (years)≥4≥3≥3≥7≥8≥7
EducationBachelor’s or aboveBachelor’s or aboveBachelor’s or aboveBachelor’s or aboveDoctorateMaster’s or above
Age29–4530–4335–4536–5436–5735–49
Table 3. Evaluation index system of OHDPM.
SymbolIndexDescriptionNature
C1
  • HHI
HHI measures market power by the sum of the market share of each supplier in the market.Quantitative
C2
  • Top 4
Top 4 refers to the market share of the largest m suppliers in the electricity market, which reflects the degree of market concentration.Quantitative
C3
  • RSI1
RSI refers to the sum of the market share of the total supply capacity of all suppliers except the maximum supplier in a certain period of time.Quantitative
C4
  • Lerner
Lerner index is a measure of market power by comparing electricity price with marginal cost.Quantitative
C5
  • Producer surplus proportion
The proportion of producer surplus refers to the proportion of producer surplus in the total market surplus. The existence of market power will lead to market failure, price will be affected, consumer surplus will be reduced, producers will earn excess profits, and then the proportion of producer surplus will increase.Quantitative
C6
  • User satisfaction
Customer satisfaction is the evaluation of products and services provided by power supply enterprises by power users, which can include the satisfaction of power supply, maintenance, emergency repair, power supply, metering and charging, etc.Qualitative
C7
  • User’s initiative to participate in demand response
Power users are willing to adjust their electricity consumption behavior according to price signals or incentive mechanisms under different power consumption conditions.Qualitative
C8
  • The proportion of market-oriented transactions
It refers to the percentage of electricity generated in the whole region that participates in market competition and trading.Quantitative
C9
  • Trans-provincial and cross-regional transaction proportion
It refers to the percentage of electricity transacted across provinces and regions in the total market transactions.Quantitative
C10
  • Indicators setting for market transactions
It is an important aspect of market construction. It can be evaluated from three aspects: trading variety, ancillary service market, and balanced electricity price model.Qualitative
C11
  • Horizontal of market supervision
It is the basic principle that market construction should follow. It can be analyzed from the degree of market participants’ free participation in transactions and the proportion of power users’ free choice of power suppliers.Qualitative
C12
  • Power system reliability
It means that the power system has enough generating capacity and transmission capacity to meet the peak load requirement at any time, and can ensure the safety under accident conditions and avoid cascading reactions without causing uncontrolled and large-scale blackouts.Qualitative
C13
  • Stability of transaction price
Refers to the change of electricity transaction price during the evaluation period, which can be divided into normal and abnormal price fluctuations.Quantitative
C14
  • Fuel diversity index
IT refers to the sum of energy sources other than coal power, such as water, natural gas, nuclear power, wind power, photovoltaic power generation, biomass power generation and so on.Quantitative
C15
  • Proportion of clean energy generation
It is measured by the ratio of clean energy to total power generation in the statistical range. Clean energy mainly includes renewable energy and new energy created by new technologies, such as nuclear energy and hydrogen energy.Quantitative
C16
  • Ratio of electricity consumption to GDP annual growth rate
The value of this index is equal to the ratio of electricity consumption to the average annual growth rate of GDP.Quantitative
Table 4. Grade limits of OHDPM and actual data of indicators.
IndexGrade
IIIIIIIVVActual Data
C0[1,1.5][1.5,2.5][2.5,3.5][3.5,4.5][4.5,5]-
C1[2500, -][2000,2500][1500,2000][800,1500][0,800]1395.8100
C2[0.65, -][0.65,0.50][0.40,0.50][0.30,0.40][0,0.30]0.5390
C3[0,1.0][1.0,1.2][1.2,1.4][1.4,1.6][1.6, -]1.1800
C4[0.35, -][0.25,0.35][0.25,0.15][0.05,0.15][0,0.05]0.2066
C5[0.70,1][0.65,0.70][0.60,0.65][0.55,0.60][0,0.55]0.4246
C6123454
C7123453
C8[0.9,1.0][0.8,0.9][0.7,0.8][0.6,0.7][0.5,0.6]0.5026
C9[0,0.2][0.2,0.25][0.25,0.3][0.3,0.35][0.35,0.4]0.2114
C10123453
C11123453
C12123454
C13[0.06, -][0.06,0.05][0.04,0.05][0.03,0.04][-, 0.03]0.0420
C14[0,0.15][0.15,0.25][0.25,0.35][0.35,0.45][0.45,1]0.9207
C15[0,0.10][0.10,0.20][0.20,0.35][0.35,0.50][0.50,1]0.9150
C16[1.1, -][0.9,1.1][0.7,0.9][0.4,0.7][0,0.40]0.8000
Table 5. Grade limit cloud model of OHDPM evaluation index.
[Ex, En, He]Grade
IIIIIIIVV
C0[1,0.296,0.05][2,0.296,0.05][3,0.296,0.05][4,0.296,0.05][5,0.296,0.05]
C1[2750,147.8235,0.05][2250,147.8235,0.05][1750,147.8235,0.05][1150,206.9535,0.05][400,236.518,0.05]
C2[0.825,0.1035,0.05][0.575,0.0445,0.05][0.45,0.0295,0.05][0.35,0.0295,0.05][0.15,0.0885,0.05]
C3[0.5,0.296,0.05][1.1,0.059,0.05][1.3,0.059,0.05][1.5,0.059,0.05][1.7,0.059,0.05]
C4[0.4,0.0295,0.05][0.3,0.0295,0.05][0.2,0.0295,0.05][0.1,0.0295,0.05][0.025,0.0145,0.05]
C5[0.85,0.0885,0.05][0.675,0.0145,0.05][0.625,0.0145,0.05][0.575,0.0145,0.05][0.275,0.163,0.05]
C6[1,0.296,0.05][2,0.296,0.05][3,0.296,0.05][4,0.296,0.05][5,0.296,0.05]
C7[1,0.296,0.05][2,0.296,0.05][3,0.296,0.05][4,0.296,0.05][5,0.296,0.05]
C8[0.95,0.0295,0.05][0.85,0.0295,0.05][0.75,0.0295,0.05][0.65,0.0295,0.05][0.55,0.0295,0.05]
C9[0.1,0.059,0.05][0.225,0.0145,0.05][0.275,0.0145,0.05][0.325,0.0145,0.05][0.375,0.0145,0.05]
C10[1,0.296,0.05][2,0.296,0.05][3,0.296,0.05][4,0.296,0.05][5,0.296,0.05]
C11[1,0.296,0.05][2,0.296,0.05][3,0.296,0.05][4,0.296,0.05][5,0.296,0.05]
C12[1,0.296,0.05][2,0.296,0.05][3,0.296,0.05][4,0.296,0.05][5,0.296,0.05]
C13[0.08,0.012,0.05][0.055,0.003,0.05][0.045,0.003,0.05][0.035,0.003,0.05][0.015,0.009,0.05]
C14[0.075,0.0445,0.05][0.2,0.0295,0.05][0.3,0.0295,0.05][0.4,0.0295,0.05][0.725,0.163,0.05]
C15[0.05,0.0295,0.05][0.15,0.0295,0.05][0.275,0.0445,0.05][0.425,0.0445,0.05][0.75,0.1475,0.05]
C16[1.2,0.059,0.05][1,0.059,0.05][0.8,0.059,0.05][0.55,0.0885,0.05][0.2,0.1185,0.05]
Table 6. Relevance between the element to be evaluated and the graded normal cloud model.
CorrelationGrade
IIIIIIIVVMembership Degree
C10.000000 0.000000 0.056735 0.493888 0.000142 IV
C20.000061 0.827517 0.024537 0.000058 0.000000 II
C30.099540 0.757552 0.005731 0.000000 0.000000 II
C40.000396 0.017691 0.993838 0.003835 0.008493 III
C50.000000 0.000000 0.015984 0.000000 0.741235 V
C60.000000 0.000000 0.003599 1.000000 0.020015 IV
C70.000001 0.003385 1.000000 0.001148 0.000000 III
C80.000000 0.000000 0.000000 0.415032 0.093720 IV
C90.000220 0.902563 0.340724 0.391456 0.000000 II
C100.000000 0.001169 1.000000 0.024272 0.000000 III
C110.000000 0.004303 1.000000 0.008932 0.000000 III
C120.000000 0.000001 0.001123 1.000000 0.001030 IV
C130.745383 0.838146 0.999400 0.972900 0.973824 III
C140.000000 0.000000 0.000000 0.000000 0.603834 V
C150.000000 0.000000 0.000000 0.000000 0.477893 V
C160.001171 0.244635 1.000000 0.045300 0.000465 II
Table 7. Weights of OHDPM evaluation index.
IndexWeight Type
Subjective WeightObjective WeightCombination WeightsRank
C10.0516130.0624140.04625310
C20.0446050.0623930.04327312
C30.0672090.0624280.0571247
C40.0984840.0624950.0973833
C50.0858390.0626520.078385
C60.0876600.0623920.0807404
C70.0175320.0623920.03932715
C80.0321360.0623920.04035614
C90.0173870.0623930.03932416
C100.0573410.0623920.0495029
C110.0441380.0623920.04311313
C120.1071220.0627000.1125861
C130.1071220.0626200.1125512
C140.0747450.0624420.0646236
C150.0595940.0624570.0510768
C160.0474730.0624260.04438911
Table 8. Comprehensive cloud association degree.
GradeIIIIIIIVV
Comprehensive cloud correlation0.002474 0.004487 0.041300 0.004314 0.000000
Table 9. Comparison of results from different methods.
Evaluation ModelExpectAssessment ResultsCredibility Factor
Fuzzy Comprehensive Evaluation [36]3.3075III-
Fuzzy Comprehensive Evaluation [64]2.7194III-
“3En” rule2.6952III0.0107
“50% Relevance” Rule2.7643III0.0095
Cloud Entropy Optimization2.8547III0.0049