Article

Fish Communities, Habitat Use, and Human Pressures in the Upper Volta Basin, Burkina Faso, West Africa

1
WAU Department of Water, Atmosphere and Environment, IHG Institute of Hydrobiology and Aquatic Ecosystem Management, BOKU—University of Natural Resources and Life Sciences, Gregor Mendel Strasse 33, 1180 Vienna, Austria
2
Laboratory for Freshwater Ecology and Inland Fisheries, NORCE Norwegian Research Center, Nygårdsgaten 112, 5008 Bergen, Norway
3
Laboratoire de Biologie et Ecologie Animales, UFR/SVT, Université Joseph Ki-Zerbo, 03 BP 7021 Ouagadougou 03, Burkina Faso
4
IIASA—International Institute of Applied System Analyses, Schlossplatz 1, 2361 Laxenburg, Austria
5
CDR Centre for Development Research, BOKU—University of Natural Resources and Life Sciences, Dänenstrasse 4, 1190 Vienna, Austria
6
Département Environnement et Forêts, Institut de l’Environnement et de Recherches Agricoles, Ouagadougou, Burkina Faso, 04 BP 8645 Ouagadougou 04, Burkina Faso
*
Authors to whom correspondence should be addressed.
Sustainability 2019, 11(19), 5444; https://doi.org/10.3390/su11195444
Submission received: 26 August 2019 / Revised: 19 September 2019 / Accepted: 26 September 2019 / Published: 1 October 2019
(This article belongs to the Special Issue Sustainable Natural Resource Management)

Abstract

:
Human pressures and loss of natural fish habitats led to a decline in fish populations in terms of abundances, biodiversity, and average size in sub-Sahelian Burkina Faso. Little knowledge exists about fish assemblages regarding their composition, their habitat preferences, or their sensitivity to or tolerance of human pressures. This research provides the first data-driven basis for sustainably managing fish and associated aquatic and terrestrial habitats. Surveys in four different regions sampled 18,000 specimens from 69 species during the dry season. Fish communities, available abiotic habitat conditions, habitat use, and human pressures were assessed and analyzed. Fish communities cluster into four distinct types, each dominated by either Cichlidae, Clariidae, Cyprinidae, or Alestidae and accompanied by specific other families and genera of fish. Habitat preferences of four key species (Labeo coubie, Bagrus bajad, Chelaethiops bibie, and Lates niloticus) were linked to ecological habitat conditions. Results show that physical parameters influence fish community composition and abundances and, when indexed according to pressure type, are linked to responses in fish metrics. Relative abundance either dropped (Mormyridae) or increased (Cichlidae, Cyprinidae) with rising pressure intensity, and some sentinel taxa (Auchenoglanis, Hydrocynus) were only found in low-pressure sites. The outcomes of this study provide basic knowledge of habitat availability, habitat use by fish, species associations, and human pressures and therefore provide the basis for effective conservation and management of fish populations.

1. Introduction

The Upper Volta basin is located in Burkina Faso, a sub-Saharan landlocked country in the central part of West Africa. It is one of the poorest and the least developed countries in the world, and rising population density is driving an increasing demand for fish protein and is jeopardizing it as an important source for food security. The country has a tropical climate with two seasons. In the rainy season, from May/June to September, the country receives between 600 and 1000 mm of rainfall per year, decreasing with latitude. In the dry season, high temperatures (up to 45 °C) result in massive losses of water due to high evapotranspiration rates (2000 mm/year) [1,2,3]. This leads to temporal changes in freshwater habitat availability in terms of quantity and quality [4].
The natural habitat conditions are altered by human activities. Frequent pressures on African water bodies include (1) water shortage and water abstraction, (2) pollution (suspended solids, solid wastes, organic and agricultural chemicals), (3) damming, (4) deforestation, and (5) overfishing [5,6,7]. Similar pressures are also reported in Burkina’s water bodies, e.g., over abstraction, reservoir degradation, and pollution with agricultural chemicals [8]. The Volta Basin has lost almost 97% of its original forest cover [7,9], which is a good indicator for watershed degeneration [10]. As a reaction to severe droughts in Burkina Faso, more than 1400 reservoirs of 1 to 25,000 ha surface area were built since 1950. These are mainly used for agriculture, livestock farming, and fisheries [3]. About 85% of all built reservoirs are smaller than one million cubic meters (Mm3), whereas the two largest ones contribute to more than 60% of the national capacity [11]. The construction of reservoirs increased fishery landings by 15 times since 1950, employing more than 30,000 fishermen and several thousand women for processing and selling the fish [3]. According to Boelee [12] and Mahe et al. [13], more than 50% of the annual discharge of the Nakanbé basin is held in these reservoirs by dams. Many reservoirs are not passable for fish due to lacking or poorly built fish passages [3]. Moreover, large reservoirs have severe downstream effects such as altered flow and sediment regime, a change of water parameters (temperature, oxygen, suspended solids, etc.), erosion, missing flood pulses, decreased fish recruitment, and disturbed river biota [14,15,16].
The specific composition of communities is mainly influenced by the interaction between animals and their biotic and abiotic environments [17]. Fish habitat encompasses a variety of physical, biological, and chemical features of the environment that affect assemblages, populations, and individuals [18]. The understanding of these interrelations also is crucial with regard to future changes caused by climate change [19,20,21].
The loss of habitat and human pressures led to a decline in fish populations in terms of total population, biodiversity, and average fish size [3,22]. Native fish species are well adapted to their environment to an extent that some species use the entire river continuum from the headwaters to the estuaries within their life cycle [15]. Because fish cannot easily migrate between aquatic systems, they have to adapt to changing conditions or die. Therefore, they are potential indicators of environmental changes and trends in general aquatic biodiversity, since they interact with other aquatic organisms via predation, nutrient input, and mechanical effects [4]. The knowledge of essential fish habitat for spawning, breeding, feeding, or growth to maturity is an important management tool for a healthy ecosystem and sustainable fisheries [23,24]. Thus far, for Burkinabe and Sub-Sahelian fish species, little knowledge exists about fish assemblages regarding their composition, their habitat preferences, or their sensitivity to or tolerance of human pressures [3,25]. Hugueny et al. [26] noted, already 20 years ago, that fish must become a well-established indicator to support better management that secures an important source of food (protein), especially for Burkina Faso and other less developed countries.
This study highlights important findings and generalizations regarding the roles of abiotic factors and human pressures that influence fish community composition and abundances for sub-Sahelian countries. The specific objectives are: (1) to describe fish assemblages, map available habitat parameters, and link them to habitat use by four key species, and (2) to identify typical human impacts on aquatic habitats and associated fish assemblages by proving the response of fish to human induced pressure impacts, eventually leading to modern fisheries management.

2. Materials and Methods

2.1. Study Area

Three large river basins (63% Volta, Niger 28%, Comoé 9%) drain the country. The largest and the most important is the Volta Basin, covering over 120,000 km2. Three major rivers, the Mouhoun, the Nakanbé, and the Nazinon (respectively Black-, White-, and Red Volta) eventually all flow into Lake Volta in Ghana [27,28]. The study area is located in the Upper Volta (Nakanbé) catchment in Burkina Faso between the reservoir of Korsimoro, north of Ouagadougou, and the border with Ghana in the south (Figure 1). The fish sampling took place between October and December 2012 in the early dry season. Sampling areas were selected visually by means of Geographic Information System (GIS) and the expert judgment of the local fishermen, the fisheries department in charge of the Ministry of Environment, and the University of Ouagadougou. Decision criteria for selection were water availability, accessibility, different human stressors, spatial variability, and security. Each sampling area was subdivided into different sites. We describe each site in terms of all nearby and accessible habitats. Figure 1 gives a geographical overview of the sampling areas and their component sites.
The sampling area of Kougri is located on the Nakanbé River to the east of Ouagadougou. The Nariale, a tributary, flows in from the west. The moderately impacted area of Koubri consists of 15 reservoirs and belongs to the Nariale catchment [3,22]. Bagré is the biggest reservoir in Burkina Faso and was constructed to bolster irrigation and to provide hydroelectricity. This large shallow reservoir was built in 1994 by damming the Nakanbé River [29]. The protected game ranch of Nazinga is located in the south, just north of the border with Ghana, and was created in 1979. The terrestrial habitats around its aquatic ecosystems are characterized by low population density and no economic activities such as agriculture, livestock breeding, or timber usage. There is one natural pond, and an additional 11 small reservoirs were built to provide water for wildlife [3,22].
Our research focused mainly on Kougri, Koubri, Bagré, and Nazinga. The sampling areas, Bissiga, Korsimoro, Loumbila, and Ziga, were summarized as “Others” for further analyses and discussion. A detailed list of all sampling locations is available in Table A1 (Appendix A).

2.2. Fish Sampling and Fish Determination

Fish were sampled in all water bodies within one sampling site using two types of equipment—electric fishing (EF) and cast net (CN) (Figure 2). For EF, the backpack-generator ELT60-IIH from Hans Grassl was applied. The generator has 1.3 kW and 500 V. The anode ring has a diameter of 30 cm with a net of 5 mm mesh size in the center. Small water bodies were fished completely, while larger ones were strip-sampled with comparable effort. EF was always performed by wading [30,31,32,33].
Two professional local fishermen were recruited to conduct the “traditional” CN fishing method. Two different kinds of nets with 10/25 mm mesh size and a diameter of 4.3/4.5 m were used. Most of the time, the fishermen were wading; for some deeper areas, they used a boat [34]. Electric fishing and cast net were applied to the same habitats. Fish were identified to species level by using morphological characters [35]; fish were then counted, and their total length was measured.

2.3. Habitat Sampling

At each habitat, the river width, depth and flow velocity were measured at seven randomly selected transects. The number of measurements was empirically chosen as the smallest statistically relevant quantity [36].
The percentage of water surface covered with shading was estimated. Presence–absence of in-stream structures such as Xylal (deadwood), rocks, water plants, trees, reed, and out-washed bank were recorded (Figure 3). The distribution of substrate was estimated and classified according to particle size range (Pelal < 6 µm, Psammal 6 µm–2 mm, Akal 2–20 mm, Mikrolithal 20–63 mm, Mesolithal 63–200 mm, Macrolithal 200–400 mm, Megalithal > 400 mm, Primary Rock and Concrete) [37]. Basic physicochemical parameters were measured with a WTW Multi 340i Gear, namely pH, O2, temperature, and conductivity.

2.4. Human Pressure Impacts

Pressures were categorized according to Schineggeret al. [38] as: hydrological (Hyd), morphological (Morph), water quality (Wq), and connectivity (Conn). Connectivity pressures were measured on a segment scale depending on river size: 2 km for small rivers (1 km up- and downstream, catchment area < 100 km2), 10 km for medium-sized rivers (100–1000 km2), and 20 km for large rivers (>1000 km2). Using GIS, a buffer of 1 km around each sampling site was created, and land use and pressures were controlled and refined. Additionally, fishing and agriculture (land use) were considered as two separate pressure categories. All pressures were ranked as 0 (low pressure), 1 (medium pressure), or 2 (high pressure) based on literature and expert judgement. Pressures, pressure types, and judgment criteria are listed in Table 1.
Pressure type indices were calculated for six locally identified pressure types adapted from the method of Schinegger, Trautwein, Melcher, and Schmutz [38]. The average of single pressure parameter values of only classes 1 and 2 was calculated to avoid that 0 values compensate for 1 or 2 values. A global pressure index (GPI) was calculated and could range from 0 (no pressure) to 12 (maximal pressure intensity). For visualization, the GPI was categorized into “Low” (GPI 0–4), “Medium” (4–8), and “High” (8–12) pressure intensity.

2.5. Data Analysis

Statistical analyses and data management were achieved by using SPSS and Excel. Spatial distribution descriptive statistics were used to analyze and cross-tabulate fish assemblages. Available habitat conditions were quantified through histograms and boxplots, and their effects on species richness and abundances were visualized through a combination of line plots and histogram. To analyze habitat use of selected species, available habitat and usage curves were developed for selected parameters using frequency-of-use graphs [39] as normalized probability density function ranging from 0 to 1 [40].
FUGi = ∫i/∫[max]
where ∫i is class frequency and ∫[max] is maximum class frequency.
Fish assemblage clusters were developed by applying K-means clustering at family and genus levels. For the calculated mean abundance per m2, only fish caught with EF were selected for a standardized comparison. Some key species were analyzed according to their habitat use. Decision criteria for key species selection were high abundances (Chelaethiops bibie), high value for fishery (Bagrus bajad and Lates niloticus) [41], and a benthopelagic and potamodromous species (Labeo coubie) [42]. Pearson correlation coefficient (significance level 0.05) was used to correlate pressure indices and fish genera. Kruskal–Wallis test was performed to test differences of the global pressures index and the number of species as well as for biomass (significance level 0.01).

3. Results

3.1. Fish Assemblages

Considering all fishing methods and habitats together, we collected 18,021 fish specimens and recorded a total number of 16 families, 34 genera, and 69 species (Table 2). The number of Alestidae, Cyprinidae, and Mormyridae together contributed to almost half of all specimens (48%) and genera (53%).
Application of K-means clustering identified four discrete fish community clusters or “assemblages”. Out of 16 families represented in the study area, four were dominant (Table 3 and Figure 4): Alestidae (mixed assemblage), Cichlidae (Cichlidae dominated assemblage), Clariidae (Clariidae dominated assemblage), and Cyprinidae (Cyprinidae dominated assemblage). The mixed assemblage was characterized by the co-existence of multiple families, namely Alestidae, Mormyridae, Cichlidae, Cyprinidae, Schilbeidae, and Mochokidae. Two out of three of the Cichlidae dominated assemblage were built up by Cichlidae, which itself was evenly composed by the genera of Sarotherodon, Oreochromis, and Coptodon (Table 4). The Clariidae dominated assemblage was prevailed by the family of Clariidae, which made up more than 70% of all individuals. They co-existed with Cichlidae, mainly with Oreochromis niloticus. The Cyprinidae dominated assemblage was the fourth community and consisted mainly of the family Cyprinidae (58%), more precisely the genus Enteromius (46%). It also showed high relative frequencies of the families Alestidae and Cichlidae (Table 3, Figure 4 and Table A2).

3.2. Available Habitat Characteristics

In total, the substrate composition was dominated by fine fractions, e.g., Pelal (44.5%) and Psammal (30.4%). The other fractions shared 7% Akal, 2.5% Microlithal, 1.7% Mesolithal, 3.6% Macrolithal, 2.6% Megalithal, 2% Primary Rock, and 5.7% Concrete. In Kougri, the fine fractions (Pelal and Psammal) made up 87%, and coarse materials such as Micro-, Meso-, and Macrolithal were missing completely. While all different fractions were present, the substrate of Koubri was dominated by fine fractions (69%) but with remarkably high proportions of Concrete (8.7%). Bagré exhibited the largest shares of fractions smaller than 2 mm (92%). Nazinga showed a distinctly different picture, with fewer fine fractions (61%) and a larger proportion of coarse materials (18.7% Macrolithal and 10.9% Mesolithal).
For all investigated water bodies, Xylal (dead wood) was the most commonly present element of habitat structure (42.7%), followed by trees (31.2%), reed (24.2%), rocks (18.5%), water plants (13.4%), and out-washed bank (5.7%). Kougri showed a relatively high frequency of trees (47.8%) and Xylal (82.6%). Koubri stood out with its high occurrence of reeds (56.6%) and water plants (30.2%). In Bagré, water plants were missing. Nazinga showed the highest occurrence of out-washed bank (9.1%) but no reed habitat (Figure 5).
For all investigated water bodies, conductivity ranged from 36.9 µs/cm to a maximum of 271 µs/cm with an overall mean value of 92 µs/cm. Bagré exhibited the highest mean value (134.3 µs/cm) and the widest variation (standard deviation 66.9 µs/cm). Table 3 shows a smaller range of values for all the other areas. The sampled pH values covered a range from 6.4 to 10.1 (mean 7.8). For pH, both extremes of the value range were measured in Koubri. Temperature distribution could be divided into two major groups based on geographical latitude. More southern sampling sites, e.g., Bagré and Nazinga, exhibited cooler water column temperatures with the mean values of 26.9 °C and 25.5 °C and a maximum not exceeding 31 °C. More northerly sampling sites showed higher mean (32 °C) and maximum (35.1 °C) temperatures. Regarding the mean shading of the water surface, Nazinga exhibited the highest mean value (Nazinga 19%, Bagré 14%, Koubri 12%, Kougri 6%). Oxygen saturation varied from 18% to 158% with a mean value of 76.3%. Variance in oxygen saturation values ranged from high at Koubri (18–135%) to low in Nazinga (75–90%) (Table 4).

3.3. Fish Habitat Use

Increases in water column temperature were correlated with increases in the number and the abundance of species as well. The highest number of species was found in a temperature range of 29–31 °C. The most populated fish communities occurred in a temperature range of 31–33 °C. Above 33 °C, fish abundance and diversity abruptly declined (Figure 6).
Most species lived in habitats with a water column pH value from seven to eight. With an increase of the pH, diversity decreased but abundance increased. The highest diversity was found in waters with conductivity lower than 120 µs/cm. There was no clear correlation between abundance and measured conductivity. The number of species increased up to 110% of oxygen saturation. More than 110% led to a decrease of species. Abundance reached its maximum between 90% and 150%. There was no clear indication that the occurrence of certain habitat structural elements had an influence on the number of species or the abundance at community level (data not shown).
Looking at selected different key species, Figure 7 illustrates the different habitat use curves related to substrate size, wetted width, water depth, and temperature, namely for Labeo coubie, Lates niloticus, Chelaethiops bibie, and Bagrus bajad. Lates niloticus usage curves are similar to the ones from Bagrus bajad but were removed for better clarity.
Bagrus bajad and Chelaethiops bibie shared the same habitat characteristics with regard to substrate. However, Labeo coubie clearly used habitats with coarser substrate. Looking at the available substrate distribution, it is clear that its potential habitat was more limited compared to the other species. In terms of wetted width, we recognized three different patterns. Labeo Coubie almost exclusively used water bodies with a wetted width smaller than 10 m. Bagrus bajad had its maximum wetted width up to 30 m, and Chelaethiops bibie mostly used habitats with higher wetted widths, e.g., around 50 m. Figure 7 shows that water depth usage of Chelaethiops bibie and Labeo coubie seemed to avoid waters deeper than 2 m. Bagrus bajad avoided areas with water depth smaller than 0.5 m. Its usage curve was staggered a bit toward the deeper areas. Bagrus bajad and Labeo coubie clearly preferred water temperatures < 25 °C. However, Chelaethiops bibie mostly used water bodies with temperatures between 31 and 32 °C.
Labeo coubie was caught mainly in shallow areas with depths less than 0.3 m, reaching a maximum size of 150 mm, and showed clear preferences for coarse substrate. In its average habitat, substrate was dominated by fractions with average particle diameters larger than 6 cm (73%). This was also reflected in its preference for habitat structures such as rocks, which are typical for its habitat. Table 4 and Table 5 indicate that each habitat was characterized by some level of water velocity (average 0.37 m/s) and oxygen saturation around 90% and not falling under 43%.
Xylal occurred as a structure element in more than 90% of Chelaethiops bibie habitat. It mainly used habitats dominated by fine substrate (80% < 2 mm). It was caught mostly in areas with a mean wetted width around 18 m and depths smaller than 0.6 m (Figure 7). Water temperatures ranged between 23.3 and 35.1 °C (Table 5). Additionally, 70% of the caught fish ranged between 40 and 50 mm with a maximum of 60 mm. Bagrus bajad was mainly caught in larger water bodies with an average depth of 1.8 m and a width of 22 m (Figure 7). It showed similar habitat use characteristics as Lates niloticus. The latter seemed tolerant of severe values for physicochemical parameters, e.g., oxygen saturations under 20%, temperature maxima of 35 °C, and pH values above 10. Compared with the others, it was caught in waters with relatively low maxima of conductivity (<120 µs/cm) (Table 5).

3.4. Human Pressure Impacts on Fish

The cumulative sum of pressure indices gives a good overview of the range of pressure intensity values in the sampling areas (Figure 8). The hydrological pressure index (HPI) was highest in Bagré due to the vicinity of a large reservoir with a constant HPI value of two and was lowest in Nazinga (median at zero). The water quality index was highest in Nazinga and Loumbila, with all other sampling areas exhibiting a median of about one. The highest connectivity index (CPI) values were found in the free-flowing section of Kougri (between Ziga and Bagré) and the reservoir of Bagré. Koubri still had dams within the river segment in the upstream sites and therefore received a bad CPI index. Nazinga had dams, but some of them were passable, and some were selectively passable. The areas Loumbila and Koubri received the highest CPI values. Agricultural pressures were high in all sites except for the protected area of Nazinga. Fishing had a pressure index of two for all sites except for the area of Nazinga and one remote site in Bagré, which had a fishing pressure index of one. Figure 8 shows the cumulative sum of the pressure categories: 31 sites were affected by fishing, 28 sites by hydrology, 27 sites by agriculture, 23 sites by water quality, 17 by connectivity, and 14 sites by morphological pressures.
Human pressures had clear impacts on all genera of fish. Table 6 summarizes genera whose relative abundance significantly (significance level 0.05) correlated with the pressure indices. Auchenoglanis, Ctenopoma, and Hydrocynus correlated with almost all pressure indices.
Figure 9 illustrates the relation between number of taxa and GPI. The median number of species dropped from 25 species at low pressure sites to 10 at high pressure sites. Accordingly, the number of genera dropped from 20 to 10 and the number of families from nine to five. For all three graphs, the number of taxa was significantly different in each GPI category (Kruskal–Wallis test, significance level 0.01). Similarly, biomass values dropped significantly as human pressures increased (Figure 9).

4. Discussion

In Burkina Faso and globally, fish are a very important protein source, and their sustainable management continues to be a long-term goal. Based on measurements in Burkina Faso, we introduce, for the first time, species lists and indices as management tools that link characteristics and presence of fish species and assemblages with associated characteristics of habitat and human pressures.

4.1. Fish Assemblages and Associated Habitats

By sampling more than 69 fish species and 34 genera, we defined the composition of distinct fish assemblages in 157 habitats around Burkina Faso undergoing different kinds and levels of human pressure. Through quantification, we linked freshwater habitat conditions with their effects on fish community composition and abundances at the beginning of the dry season. Most of the Sahelian fish species spawn in the wet season [4]. This is also reflected in the average fish size of the caught species indicating that most of them were juveniles. Indices based on such links allow managers to detect challenges from habitat (aquatic and terrestrial) and human pressures as well as fish assemblages and develop policies for managing them.
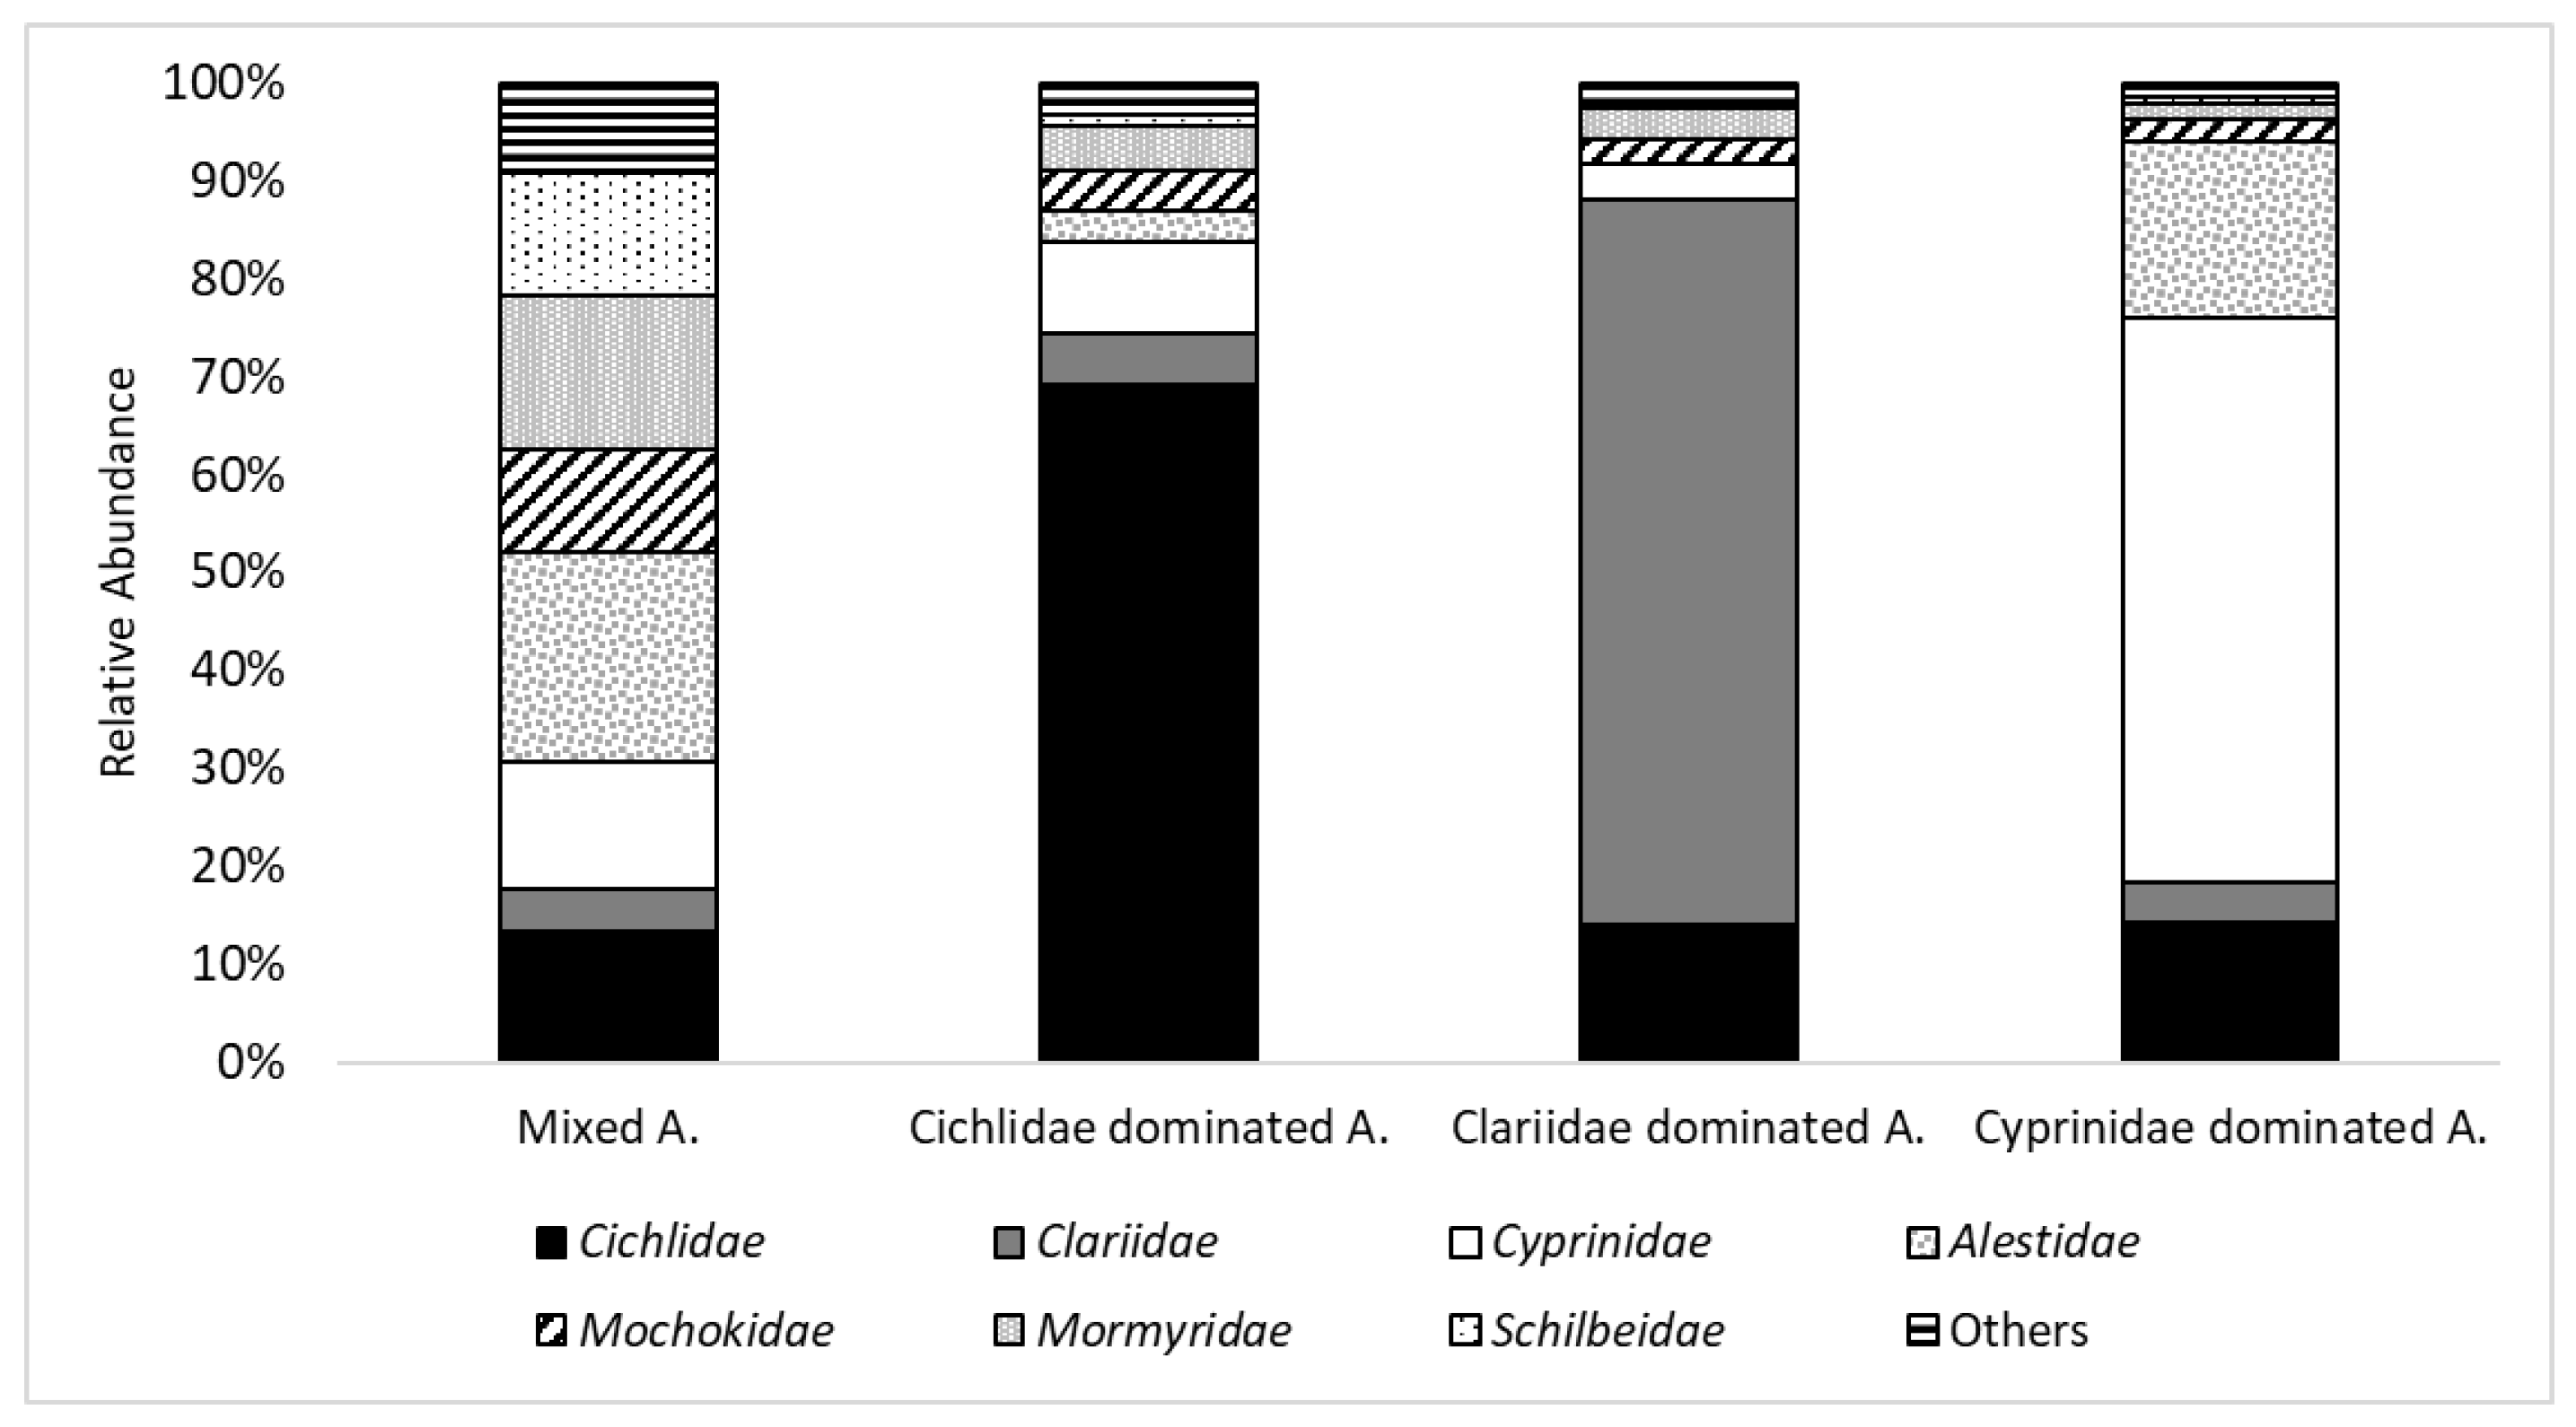
The four discrete fish community assemblages describe the typically observed co-existence of Burkinabe fish species in distinct clusters. One is dominated by Alestidae, one by Cichlidae, one by Clariidae, and one by Cyprinidae. Further studies that analyze the parameters and the relationships determining the community’s structure should consider such factors as: habitat parameters, feeding types, predator–prey relations, and human impacts. Species found in the same assemblage indicate similar requirements/tolerances for their biotic and/or abiotic environment. Further study in Burkina Faso is also mandated by the fact that fully one third of species with red list status have not yet been classified at the world level, much less at the national level.
The data collected on available habitat conditions represent a picture at a certain time, which is strongly influenced by seasonal hydrology just before the dry season [22]. The benthic substrate composition of every site was dominated by a fine fraction. In addition, the heavily impacted and obstructed area of Koubri showed a notable proportion of concrete caused by erosion of reservoir and irrigation channel infrastructure. These man-made aquatic zones were also used as fish habitat, mainly by Enteromius macrops, Clarias spp., Oreochromis niloticus, and Coptodon zillii. This indicates the tolerance of these species for obstructions. The protected area of Nazinga exhibited a higher percentage of coarser substrate conditions, likely the result of no agriculture, fewer reservoirs, and more free-flowing sections [3,22]. The high proportion of fine fractions in Bagré can be explained by the selection of the sampling points, which are mostly located at tributaries to the reservoir with agriculture along them, which deposit high sediment loads. This can also explain high conductivity values for these sites.
The availability of structural elements is a key determinant of the diversity of in-stream fish communities [31,43]. These elements can be necessary as an essential fish habitat for spawning, feeding, breeding, or hiding for certain species and life stages [24,43]. The relatively high frequencies of reed (56%) and water plants (30%) in Koubri were caused by high nutrient input from intensive agriculture. Our results show that Burkinabe waters do not exhibit a lack of in-stream structures as in Europe [44].
Physicochemical parameters are also important for fish assemblage composition. pH values ranged from 6.4 to 10.1 with a mean value of 7.8. The lowest and the highest values were measured in Koubri (Table 4). These extreme values can be explained by the high agricultural and livestock activities in this area [3,22,45,46].
There were noticeable temperature differences between Bagré/Nazinga and Kougri/Koubri (Table 6). One reason is that Kougri and Koubri are located in a warmer area than Nazinga and Bagré [47]. Secondly, the selection of the sampling points and the influence of reservoirs can explain these circumstances. In Kougri and Koubri, most of the sampling points are located downstream of reservoirs, while in Bagré, we mainly sampled tributaries. Nazinga generally shows a lower density of reservoirs than Koubri [22]. Nearly all reservoirs have a spillover, which releases the warm water from the surface and therefore heats up the waters downstream [48].

4.2. Habitat Use

With increasing temperature, productivity of a water body increases as well, resulting in higher abundances and more diverse species richness until a maximum threshold is reached (Figure 5). The described maximum between 29–31 °C and the sudden drop of abundance and species richness indicates the maximum temperature tolerance of some of local fish species [49]. For West Africa and Burkina Faso, one indication of the potential negative effects of climate change, e.g., increasing desertification and decreasing annual precipitation with more frequent extreme events, is that increasing variability, rising trends, episodic extremes of temperature, or precipitation might have dramatic effects on the fish fauna and the fisheries. Desertification is directly linked with loss of habitat for aquatic species [19,20,21].
Regarding the mean shading of the water surface, Nazinga exhibited the highest mean value (Nazinga 19%, Bagré 14%, Koubri 12%, Kougri 6%). Additionally, shading can lower the impact of solar gain on water body temperature [50]. Consequently, increasing riparian vegetation for sun protection lowers the average water body temperature as well as the scale of temperature fluctuations [51,52].
In ephemeral water bodies such as in sub-Saharan Burkina Faso, it is difficult to distinguish between habitat preferences and minimum requirements or tolerances. As the sampling took place at the beginning of the dry season, some species might have been trapped in unfavorable habitats. However, the results highlight that the Burkinabe fish species do have different habitat preferences. Regarding the habitat usage curves (Figure 6), it is obvious that some habitat categories are used mainly according to their availability, and therefore the selection for this habitat feature is low, e.g., habitat use of substrate size for Chelaethiops bibie or Bagrus bajad. In contrast, the habitat selection of Makrolithal for Labeo coubie is high (Figure 6).
Summarizing the habitat use curves and the physicochemical parameters, one can see differences in the habitat use of four species (Figure 6, Table 4 and Table 5). Chelaethiops bibie, which feeds mainly on terrestrial insects [53] and seeds found at the water surface [54], uses shallow, large, warm water bodies with fine sediments and high proportions of Xylal. The frequent occurrence of Xylal (90%) is evidence that this structural element is an essential one for its lifecycle. Bagrus bajad uses deeper, cool, mid-size water bodies also dominated by fine substrates. It lives and feeds on or near the bottom [55] on insects, crustaceans, mollusks, and vegetable matter [54], and adults are exclusively piscivorous [56]. Worthington and Ricardo [57] observed them at depths up to 60 m. Lates niloticus shows similar habitat characteristics. It inhabits streams, lakes, and irrigation channels. Adults inhabit deep water, while juveniles are found in shallow water. It feeds on fish, especially Clupeids and Alestes [58]. Smaller specimens also feed on larger crustaceans and insects. Juveniles are planktivorous [54]. Maximum reported length for this species is 2000 mm [59]. By contrast, Labeo coubie inhabits water bodies that are characterized by coarse substrate and higher flow velocity. It occurs in narrow and shallow streams. For the described habitat of Labeo coubie, one should note that we only caught young fish (maximum size of 150 mm).

4.3. Human Pressures, Overfishing, and Loss of Habitat

Efficient monitoring tools for the assessment of stream ecosystem response to human pressures are urgently needed but still lacking in West Africa. Apart from one method for macroinvertebrate [60], there are no established biological assessment methods for Burkina Faso. All sampled Burkinabe sites were exposed to fishing activities (
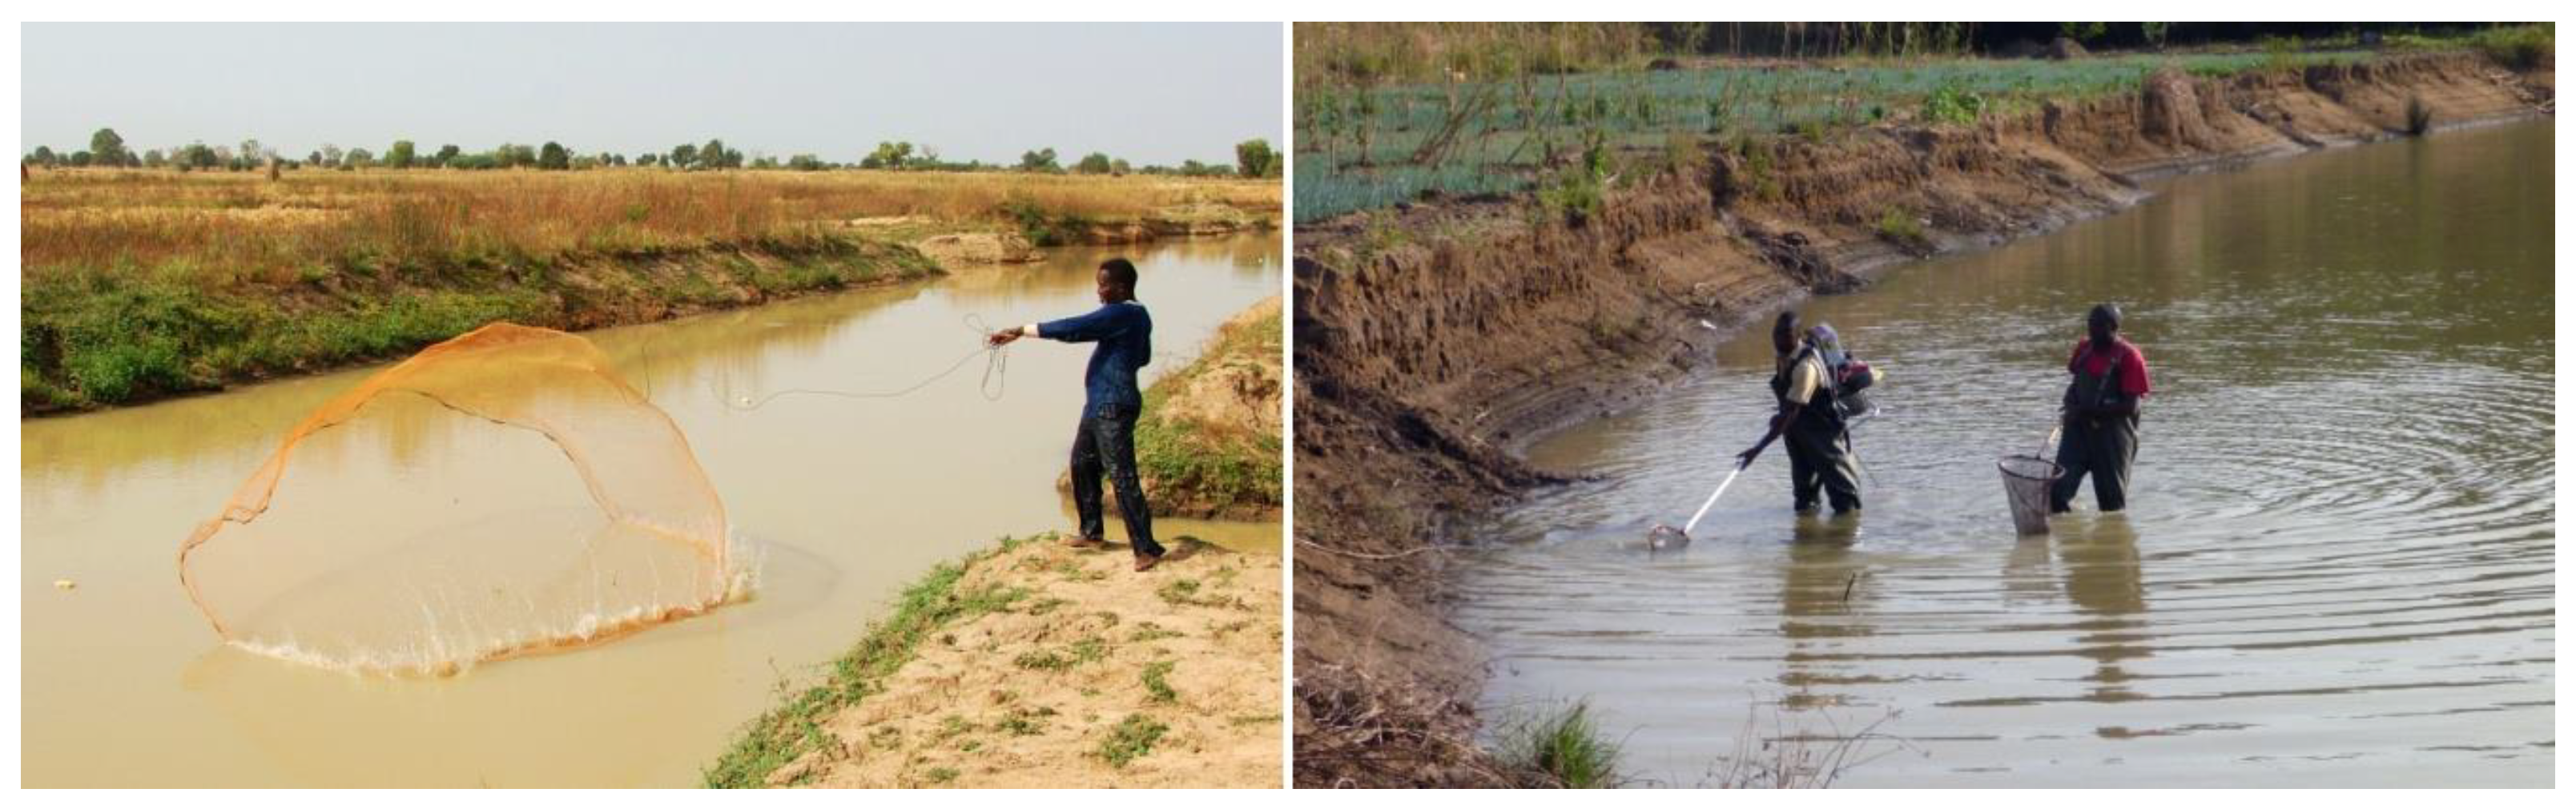
Figure 9). In protected areas, e.g., Nazinga, fishermen need to buy a license in order to fish, and one season is closed for fishing. Despite such protections, camps of professional fishermen sell huge amounts of fish to nearby cities and Ouagadougou without incurring negative impacts on the fish assemblages. Therefore, Nazinga and a few remote sites were judged as medium fishing pressure sites, and all others were judged as high fishing pressure sites. Almost all sites (89%) were exposed to hydrological modifications. This was mainly due to the high reservoir density in the sampling areas. Agricultural activities were present in 87% of all sites, but rice occurred less than the other pressures. Additionally, 74% of the sites were affected by water quality pressures, and eutrophication was the most frequent pressure. Both larger and smaller dams created connectivity pressures on more than half of the sites. Morphological pressures or alterations were already present in nearly half (47%) of the sites. Cross-section and in-stream habitat modification were the most frequent kinds of habitat loss created by morphological pressure impacts.
In response to different pressure classifications, the sharp and the distinct reactions of different fish assemblages in terms of taxa richness, total density (g/min, individuals/min), and share of intolerant species suggest that such measures could serve as core metrics. As pressures increase from medium to high, the trophic level drops from 3 to 2.5.
Except for Hemichromis and Coptodon, all genera had a negative correlation between the pressure indices and the relative abundance of genera, indicating that these two are generalists. The share of Cichlids and Enteromius increased with pressure intensity. These taxa are noted as quite tolerant of pressures and are frequently found in reservoir communities [26,61]. Some genera such as Auchenoglanis or Hydrocynus correlated with many pressure groups, showing that they are very sensitive and indicating the correlation amongst the pressure groups.
Adams [62] reported the loss of Lates niloticus, Hydrocynus sp., Gymnarchus niloticus, Auchenoglanis sp., and Bagrus sp. downstream of reservoirs in Nigeria. We also caught Lates niloticus more frequently in free-flowing stretches. Hydrocynus was found only in Nazinga, indicating that it is generally sensitive. We could find Auchenoglanis in Nazinga and Bagré (in tributaries to the reservoir) but also downstream of the reservoir of Loumbila. Bagrus was caught in all areas except for Nazinga and Loumbila.
The study shows a variation in spatial distribution of fish species richness. Median species richness decreased to 40% of values found at the low-pressure sites (GPI). However, if connectivity is intact and species can still migrate to the appropriate habitats for their life stages, this can compensate for some other pressures. About 50% of the caught species are reported as potamodromous [63]. This way, connectivity could serve as a core metric in a multi-metric index. Since river morphology is still widely intact in Burkina Faso, restoring and preserving connectivity could be an important contribution to protect the Burkinabe fish communities.
While the presence of cichlids increased with pressure, Mormyridae and Mochokidae decreased. Hugueny, Camara, Samoura, and Magassouba [26] came to similar results, where Mormyridae were almost extinct at impacted sites and were proposed as intolerant species for a future Index of Biotic Integrity in Africa. Abundance of Alestidae was similar in low and medium pressure sites but had a drop at high pressure sites. Clariidae were frequent in medium pressure sites but less frequent in low and high pressure sites. Anne, Lelek, and Tobias [61] experienced a considerable reduction in the abundance of the genus Citharinus in reservoir environments and a substitution by cichlids and pelagic species such as cyprinids. We could only find Citharinus in very low numbers in the protected area of Nazinga.

5. Conclusions

Rising risk of climate change, population growth, and associated human pressures give urgency to efforts to link science and policy for sustainable fisheries management in Burkina Faso, West Africa. Inland fisheries production has plateaued at the same time that the quantity of riverine fish has dramatically declined. There is a clear need for habitat protection; thus, the tools provided here open the door to habitat management based on quantification. This addresses the need for modernizing the governance of fisheries based on scientific measurements.
This study revealed that most waters of Burkina Faso were exposed to multiple human pressures, with overfishing, hydrological changes, agricultural pressures, and water quality being the most frequent. The results from Nazinga—higher abundances, larger mean length, and highest diversity—highlight the importance of protected areas as a refuge habitat for sensitive and rare species and as a genetic reserve for future restoration measures. The differences of total fish length at managed vs. non-managed fishing sites showed the importance of protections provided by sustainable fisheries management. These findings provide the scientific basis for policy recommendations, e.g., a licensing system for fishermen and closed seasons with better controls that can assure a higher fish yield long-term and improve the food security. Water quality is still a big problem in Burkina Faso. Urban areas urgently need better waste water treatment. Water quality in agricultural areas could be improved with re-vegetation of riparian buffer forests along the water bodies. This could also slow down soil erosion. This research shows that West African fish prefer specific temperature niches, and the shading effect of trees can buffer rising temperatures and increase fish species and fish community resilience to rising temperatures, especially in light of the extremes anticipated under various climate change scenarios [64].
Some taxa reacted distinctly to specific levels of pressure intensity. As shown in this study and proposed by several authors, such sensitive taxa as Mormyridae, Polypterus, Brycinus, Hydrocynus, Heterobranchus, Synodontis, Labeo, Citharinus, Lates niloticus, and Heterotis niloticus could serve as indicator taxa for managing waters in Burkina Faso [3,65]. Additionally, in this study, Auchenoglanis, Ctenopoma, and Schilbe showed distinct reactions to specific pressures. Other species such as Coptodon zillii are tolerant of human pressures and increase significantly as pressures intensify. Additional sampling campaigns at reference sites in Burkina Faso as proposed by Kaboré, Moog, Alp, Guenda, Koblinger, Mano, Ouéda, Ouédraogo, Trauner, and Melcher [60] are recommended to gain more valuable information on these aspects. Many problems have emerged with the creation of dams, e.g., siltation and reservoir volume loss [3], downstream effects on biota, migration obstacles, the changes in hydrological and sediment regime, and the impacts on rain fed agriculture (e.g., [16]). To address these problems, we propose to focus on alternative solutions, e.g., Martin and Van De Giesen [66] showed that only 5% of the average annual groundwater recharge in large parts of the Burkinabe Nakanbé basin is exploited at present. They conclude that, from a geo-scientific view, further development of groundwater abstraction would be sustainable and desirable.

Author Contributions

Conceptualization: P.M., S.S. and A.M.; Data curation: P.M. and S.S.; Formal analysis: P.M. and S.S.; Funding acquisition: A.M.; Investigation: P.M., S.S., K.M. and I.K.; Methodology: P.M., S.S. and A.M.; Project administration: R.O. and A.M.; Resources: A.O. and R.O.; Supervision: J.S. and A.M.; Validation: A.O.; Visualization: P.M. and S.S.; Writing—original draft: P.M., S.S. and J.S.; Writing—review & editing: S.S., J.S., A.O., K.M., I.K., R.O. and A.M.

Funding

This study was funded by the Austrian Development Cooperation (ADC) through the Austrian Exchange Service, ÖAD (Susfish-plus: project166 and Susfish: project056) Remove Funding. The authors are grateful to the Center for International Relations (ZIB) for the scholarship for short-term scientific work abroad (KUWI), funding parts of the stay in Burkina Faso for data collection. This is awarded directly by the University of Natural Resources and Applied Life Sciences in Vienna.

Acknowledgments

This study is dedicated to Noufou Bonkoungou (also known as Dom-Dom) who sadly passed away during the project. We will remember him as a good friend, a passionate dancer, and one of the best fisherman of Burkina Faso. The authors are grateful to the Center for International Relations (ZIB) for the scholarship for short-term scientific work abroad (KUWI), funding parts of the stay in Burkina Faso for data collection. This is awarded directly by the University of Natural Resources and Applied Life Sciences in Vienna. We also want to thank the Austrian Development Cooperation and Appear Programme (Austrian Partnership Programme in Higher Education & Research for Development) for financing the Susfish and the Susfish-plus Project (Sustainable Management of Water and Fish Resources in Burkina Faso) in which frame this paper was written. The cooperation with the IUCN (Afrique centrale et de l’ouest), the ‘Université de Ouagadougou’, and especially the ‘Laboratoire de Biologie et Ecologie Animales’ helped a lot with their consolidated knowledge and their infrastructure.

Conflicts of Interest

The authors declare no conflict of interest. The funders had no role in the design of the study; in the collection, analyses, or interpretation of data; in the writing of the manuscript, or in the decision to publish the results.

Appendix A

Table A1. Study site names, number of fished habitats, elevation and Global Positioning System (GPS) coordinates [World Geodetic System (WGS) 84, decimal degrees].
Sampling LocationNr. of Fished HabitatsLongitudeLatitudeElevation (m)
Kougri (A)23
Kougri5−1.08078512.378996259
Nakanbé Barrage5−1.08908212.245099251
Nakanbé under Nariale3−1.09880412.256668250
Nakanbé /Masili4−1.0961912.268317256
Pitioko6−1.11661212.26906265
Koubri (B)53
Ancien1−1.35473912.226753282
ArzoumBaongo7−1.2972412.221255280
Naba Zana8−1.35146912.204276280
Noungou5−1.30413712.204209269
Pedga5−1.34155312.180401291
Peele4−1.19009712.249763268
PK252−1.40251912.192986279
Naba Zana pond3−1.39233312.187168281
Segda4−1.28412112.223419268
Nagreongo1---
Tolguin3−1.32220912.229311280
Tyokin3−1.39633712.235285291
Wedbila7−1.41561612.151827292
Bagre (C)34
Djerma1−0.74651211.773999238
Bagré Tributary1−0.53830111.533057239
Bagré-Bangako2−0.55460511.461552232
Djerma/Boussouma5−0.86259711.675352248
Fungu5−0.73118411.497439237
Lengho3−0.74280811.622711236
Nakanbé2−0.51555811.409616212
Niagho3−0.77706111.757274224
Béguédo4−0.72571811.769889232
Béguédo 24−0.75262111.807014244
Zangoula4−0.55783711.562785240
Nazinga (D)22
Bodjero6−1.50439111.091481269
Kouzougou3−1.53100411.154303266
Naguio8−1.58324111.128345274
Talango5−1.52811411.188797270
Others25
Korsimoro5−1.14826912.475053274
Nakanbé Bissiga6−1.1481112.475041276
Ziga3−1.07613412.492104269
Loumbila11−1.39788412.493584285
157
Table A2. Relative frequency (%) of fish genus in the four clusters defined after the K-means clustering.
Assemblage
Genus1234
Brycinus15.93.00.06.1
Schilbe11.61.00.10.7
Synodontis10.64.02.42.3
Marcusenius8.72.00.50.4
Enteromius7.98.53.645.9
Sarotherodon4.421.11.33.5
Oreochromis4.424.89.42.9
Alestes4.20.30.011.2
Clarias4.24.973.94.1
Labeo3.80.40.01.3
Bagrus3.10.80.00.4
Coptodon2.719.81.65.3
Malapterurus2.20.00.00.0
Petrocephalus2.10.51.30.6
Lates2.00.81.50.3
Pollimyrus1.80.50.00.5
Mormyrus1.60.90.30.1
Hyperopisus1.40.71.10.0
Micralestes1.40.00.00.4
Chrysichthys1.21.40.00.2
Chelaethiops1.20.30.110.8
Hemichromis1.02.91.61.0
Parailia0.90.20.00.1
Auchenoglanis0.30.00.00.3
Distichodus0.20.20.00.0
Polypterus0.20.00.00.2
Heterobranchus0.10.30.00.0
Leptocypris0.10.00.00.0
Protopterus0.00.01.10.0

References

  1. Baijot, E.; Moreau, T.; Bouda, S. Aspects hydrobiologiques et piscicoles des retenues d’eau en zone soudano-sahelienne. Le cas du Burkina Faso; Centre Technique de Coopération Agricole et Rurale (CTA): Wageningen, The Netherlands; Commission des Communautés Européennes (CEE): Brussels, Belgium, 1994; p. 250. [Google Scholar]
  2. Manson, K.; Knight, J. Burkina Faso (Bradt Travel Guides); Bradt Travel Guides: Chalfont Saint Peter, UK, 2011. [Google Scholar]
  3. Ouedraogo, R. Fish and Fisheries Prospective in Arid Inland Waters of Burkina Faso, West Africa; University of Natural Resources and Life Sciences: Vienna, Austria, 2010. [Google Scholar]
  4. Lévêque, C. Biodiversity Dynamics and Conservation: The Freshwater Fish of Tropical Africa; Cambridge University Press: Cambridge, UK, 1997. [Google Scholar]
  5. Payet, R.; Obura, D. The negative impacts of human activities in the eastern african region: An international waters perspective. Ambio 2004, 33, 24–34. [Google Scholar] [CrossRef] [PubMed]
  6. Twumasi, Y.; Merem, E. Using remote sensing and gis in the analysis of ecosystem decline along the river niger basin: The case of mali and niger. Int. J. Environ. Res. Public Health 2007, 4, 173–184. [Google Scholar] [CrossRef] [PubMed]
  7. Amisigo, B.A. Modelling Riverflow in the Volta Basin of West Africa: A Data-Driven Framework; Cuvillier Verlag: Göttingen, Germany, 2005; Volume 34. [Google Scholar]
  8. de Fraiture, C.; Giordano, M. Small private irrigation: A thriving but overlooked sector. Agric. Water Manag. 2014, 131, 167–174. [Google Scholar] [CrossRef]
  9. Revenga, C.; Murray, S.; Abramovitz, J.; Hammond, A. Watersheds of the World: Ecological Value and Vulnerability; World Resources Institute: Washington, DC, USA, 1998. [Google Scholar]
  10. Huq, S.; Reid, H.; Murray, L. Water and the Least Developed Countries (Ldcs). Report Prepared for the United Nations Office of the High Representative for the Ldcs, Lldcs and Sids. 2003. Available online: https://www.ircwash.org/sites/default/files/Huq-2003-Water.pdf (accessed on 29 September 2019).
  11. Cecchi, P.; Meunier-Nikiema, A.; Moiroux, N.; Sanou, B. Towards an Atlas of Lakes and Reservoirs in Burkina Faso. 2008. Available online: https://pdfs.semanticscholar.org/4e04/8e12039ecb6e823253cfb294c60fa4a7cb85.pdf (accessed on 29 September 2019).
  12. Boelee, E. Climbing the Water Ladder: Multiple-Use Water Services for Poverty Reduction; IRC International Water and Sanitation Centre and International Water Management Institute: The Hague, The Netherlands, 2009. [Google Scholar]
  13. Mahe, G.; Dray, A.; Paturel, J.E.; Cres, A.; Koné, F.; Manga, M.; Cres, F.; Djoukam, J.; Maiga, A.; Ouedraogo, M. Climatic and anthropogenic impacts on the flow regime of the nakambe river in burkina faso. Int. Assoc. Hydrol. Sci. Publ. 2002, 274, 69–76. [Google Scholar]
  14. Laë, R. Effects of drought, dams, and fishing pressure on the fisheries of the central delta of the niger river. Int. J. Ecol. Environ. Sci. 1994, 20, 119–128. [Google Scholar]
  15. Welcomme, R.L. Floodplain fisheries management. In Alternatives in Regulated River Management; Gore, J.A., Petts, G.E., Eds.; CRC Press: Boca Raton, FL, USA, 1989; pp. 209–233. [Google Scholar]
  16. Marmulla, G. Dams, Fish and Fisheries: Opportunities, Challenges and Conflict Resolution; Food & Agriculture Organization: Rome, Italy, 2001. [Google Scholar]
  17. Schoener, T.W. Resource partitioning in ecological communities. Science 1974, 185, 27–39. [Google Scholar] [CrossRef]
  18. Hubert, W.; Bergersen, E.; Bain, B. Approaches to habitat analysis. In Aquatic Habitat Assessment: Common Methods; American Fisheries Society: Bethesda, MD, USA, 1999; pp. 7–10. [Google Scholar]
  19. De Wit, M.; Stankiewicz, J. Changes in surface water supply across africa with predicted climate change. Science 2006, 311, 1917–1921. [Google Scholar] [CrossRef]
  20. Arnell, N.W. Climate change and global water resources. Glob. Environ. Chang. 1999, 9, S31–S49. [Google Scholar] [CrossRef]
  21. Allison, E.H.; Perry, A.L.; Badjeck, M.C.; Neil Adger, W.; Brown, K.; Conway, D.; Halls, A.S.; Pilling, G.M.; Reynolds, J.D.; Andrew, N.L. Vulnerability of national economies to the impacts of climate change on fisheries. Fish Fish. 2009, 10, 173–196. [Google Scholar] [CrossRef] [Green Version]
  22. Melcher, A.H.; Ouedraogo, R.; Schmutz, S. Spatial and seasonal fish community patterns in impacted and protected semi-arid rivers of burkina faso. Ecol. Eng. 2012, 48, 117–129. [Google Scholar] [CrossRef]
  23. Meulenbroek, P.; Shumka, S.; Schiemer, F. First reconnaissance of habitat partitioning and fish diversity in the alluvial zone of the river vjosa, albania. Acta ZooBot Austria 2018, 155, 177–186. [Google Scholar]
  24. Rosenberg, A.; Bigford, T.E.; Leathery, S.; Hill, R.L.; Bickers, K. Ecosystem approaches to fishery management through essential fish habitat. Bull. Mar. Sci. 2000, 66, 535–542. [Google Scholar]
  25. de Morais, L.T. Fish population structure and its relation to fisheries yield in small reservoirs in côte d’ivoire. Manag. Ecol. Lake Reserv. Fish. 2008, 112–122. [Google Scholar] [CrossRef]
  26. Hugueny, B.; Camara, S.; Samoura, B.; Magassouba, M. Applying an index of biotic integrity based on fish assemblages in a west african river. Hydrobiologia 1996, 331, 71–78. [Google Scholar] [CrossRef]
  27. Barry, B.; Obuobie, E.; Andreini, M.; Andah, W.; Pluquet, M. The Volta River Basin. Comparative Study of River Basin Development and Management. 2005, pp. 11–188. Available online: http://citeseerx.ist.psu.edu/viewdoc/download?doi=10.1.1.662.3537&rep=rep1&type=pdf (accessed on 29 September 2019).
  28. Frenken, K. Irrigation Potential in Africa: A Basin Approach; Food & Agriculture Organization: Rome, Italy, 1997; Volume 4. [Google Scholar]
  29. Villanueva, M.C.; Ouedraogo, M.; Moreau, J. Trophic relationships in the recently impounded bagré reservoir in burkina faso. Ecol. Model. 2006, 191, 243–259. [Google Scholar] [CrossRef]
  30. Brousseau, C.M.; Randall, R.G.; Clark, M. Protocol for Boat Electrofishing in Nearshore Areas Lf the Great Lakes: Transect and Point Survey Methods for Collecting Fish and Habitat Data, 1988 to 2002; Fisheries and Oceans Canada: Burlington, ON, Canada, 2005.
  31. Peter, A.; Erb, M. Leitfaden für fischbiologische erhebungen in fließgewässern unter einsatz der elektrofischerei. Mitt. Fisch. 1996, 58, 1–19. [Google Scholar]
  32. Reid, S. Comparison of point and transect-based electrofishing to sample american eel (anguilla rostrata) in wadeable riverine habitats. Aquat. Living Resour. 2011, 24, 79. [Google Scholar] [CrossRef]
  33. Schmutz, S.; Zauner, G.; Eberstaller, J.; Jungwirth, M. Die streifenbefischungsmethode: Eine methode zur quantifizierung von fischbeständen mittelgrosser fliessgewässer. Österr. Fisch. 2001, 54, 14–27. [Google Scholar]
  34. Hayes, D.B.; Ferreri, C.P.; Taylor, W.W. Active fish capture methods. In Fisheries Techniques, 2nd ed.; American Fisheries Society: Bethesda, MD, USA, 1996; pp. 193–220. [Google Scholar]
  35. Paugy, D.; Lévêque, C.; Teugels, G.G. Fresh and Brackish Water Fishes of West Africa; Institut de recherche pour le développement: Paris, France, 2003; Volume 2. [Google Scholar]
  36. Parasiewicz, P. The mesohabsim model revisited. River Res. Appl. 2007, 23, 893–903. [Google Scholar] [CrossRef]
  37. ÖNORM M 6232:1997-05-01. Richtlinien für Die Ökologische Untersuchung und Bewertung Von Fliessgewässern (Zweisprachige Fassung); Austrian Standards Institute: Vienna, Austria, 1997. [Google Scholar]
  38. Schinegger, R.; Trautwein, C.; Melcher, A.; Schmutz, S. Multiple human pressures and their spatial patterns in e uropean running waters. Water Environ. J. 2012, 26, 261–273. [Google Scholar] [CrossRef]
  39. Raleigh, R.; Zuckerman, L.; Nelson, P. Habitat suitability index models and instream flow suitability curves: Brown trout. Biol. Rep. 1982, 82, 57–65. [Google Scholar]
  40. Melcher, A.H.; Schmutz, S. The importance of structural features for spawning habitat of nase Chondrostoma nasus (L.) and barbel Barbus barbus (L.) in a pre-alpine river. River Syst. 2010, 19, 33–42. [Google Scholar] [CrossRef]
  41. Dankwa, H.; Abban, E.; Teugels, G. Freshwater Fishes of Ghana: Identification, Distribution, Ecological and Economic Importance; Musee royal de l’Afrique Centrale: Tervuren, Belgium, 2000; Volume 283, 53p. [Google Scholar]
  42. Skelton, P.H. A Complete Guide to the Freshwater Fishes of Southern Africa; Struik: Cape Town, South Africa, 2001. [Google Scholar]
  43. Jungwirth, M.; Haidvogel, G.; Moog, O.; Muhar, S.; Schmutz, S. Angewandte Fischökologie an Fließgewässern; Facultas Universitätsverlag: Wien, Austria, 2003; ISBN 3-8252-2113-X. [Google Scholar]
  44. Jungwirth, M.; Muhar, S.; Schmutz, S. Re-establishing and assessing ecological integrity in riverine landscapes. Freshw. Biol. 2002, 47, 867–887. [Google Scholar] [CrossRef]
  45. Bellingham, K. Physicochemical Parameters of Natural Waters. Available online: http://www.stevenswater.com/articles/waterparameters.aspx (accessed on 21 February 2013).
  46. Stranzl, S. Human Impacts on the Fisheries Management in Burkina Faso. Master’s Thesis, University of Natural Resources and Life Sciences, Vienna, Austria, 2014. [Google Scholar]
  47. FAO. Burkina Faso. Available online: http://www.fao.org/ag/agp/AGPC/doc/Counprof/BurkinaFaso/burkinaFeng.htm (accessed on 21 February 2013).
  48. Allan, J.D.; Flecker, A.S. Biodiversity conservation in running waters. BioScience 1993, 43, 32–43. [Google Scholar] [CrossRef]
  49. Beitinger, T.L.; Bennett, W.A.; McCauley, R.W. Temperature tolerances of north american freshwater fishes exposed to dynamic changes in temperature. Environ. Biol. Fishes 2000, 58, 237–275. [Google Scholar] [CrossRef]
  50. Tabacchi, E.; Correll, D.L.; Hauer, R.; Pinay, G.; Planty-Tabacchi, A.M.; Wissmar, R.C. Development, maintenance and role of riparian vegetation in the river landscape. Freshw. Biol. 1998, 40, 497–516. [Google Scholar] [CrossRef]
  51. Beschta, R.L. Riparian shade and stream temperature: An alternative perspective. Rangelands 1997, 19, 25–28. [Google Scholar]
  52. Kocher, S.D. Forest Stewardship Series 10: Riparian Vegetation; UCANR Publications: Oakland, CA, USA, 2007. [Google Scholar]
  53. Hickley, P.; Bailey, R. Food and feeding relationships of fish in the sudd swamps (river nile, southern sudan). J. Fish Biol. 1987, 30, 147–159. [Google Scholar] [CrossRef]
  54. Bailey, R. Guide to the fishes of the river nile in the republic of the sudan. J. Nat. Hist. 1994, 28, 937–970. [Google Scholar] [CrossRef]
  55. Lewis, D. An Illustrated Key to the Fishes of Lake Kainji; Overseas Development Administration: London, UK, 1974. [Google Scholar]
  56. Olaosebikan, B.; Raji, A. Field Guide to Nigerian Freshwater Fishes; Federal College of Freshwater Fisheries Technology: New Bussa, Nigeria, 1998; Volume 106, p. 88. [Google Scholar]
  57. Worthington, E.B.; Ricardo, C. Scientific results of the cambridge expedition to the east african lakes 1930-1.-no. 17. The vertical distribution and movements of the plankton in lakes rudolf, naivasha, edward, and bunyoni. Zool. J. Linn. Soc. 1936, 40, 33–69. [Google Scholar] [CrossRef]
  58. Reed, W.; Burchard, J.; Hopson, A.J.; Jenness, J.; Yaro, I. Fish and Fisheries of Northern Nigeria; Ministry of Agriculture Northern Nigeria: Kaduna, Nigeria, 1967; p. 226.
  59. Stone, R. The last of the leviathans. Science 2007, 316, 1684–1688. [Google Scholar] [CrossRef] [PubMed]
  60. Kaboré, I.; Moog, O.; Alp, M.; Guenda, W.; Koblinger, T.; Mano, K.; Ouéda, A.; Ouédraogo, R.; Trauner, D.; Melcher, A. Using macroinvertebrates for ecosystem health assessment in semi-arid streams of burkina faso. Hydrobiologia 2016, 766, 57–74. [Google Scholar] [CrossRef]
  61. Anne, J.; Lelek, A.; Tobias, W. Postimpoundment changes in water quality and fish stocks in two large west african reservoirs (manantali and sélingué, mali). Int. Rev. Gesamten Hydrobiol. Hydrogr. 1994, 79, 61–75. [Google Scholar] [CrossRef]
  62. Adams, W.M. The downstream impacts of dam construction: A case study from nigeria. Trans. Inst. Br. Geogr. 1985, 10, 292–302. [Google Scholar] [CrossRef]
  63. Froese, R.; Pauly, D. Fishbase. Available online: http://www.fishbase.org (accessed on 21 February 2013).
  64. Davies, P.; Nelson, M. Relationships between riparian buffer widths and the effects of logging on stream habitat, invertebrate community composition and fish abundance. Mar. Freshw. Res. 1994, 45, 1289–1305. [Google Scholar] [CrossRef]
  65. Tawari-Fufeyin, P.; Ekaye, S. Fish species diversity as indicator of pollution in ikpoba river, benin city, nigeria. Rev. Fish Biol. Fish. 2007, 17, 21–30. [Google Scholar] [CrossRef]
  66. Martin, N.; Van De Giesen, N. Spatial distribution of groundwater production and development potential in the volta river basin of ghana and burkina faso. Water Int. 2005, 30, 239–249. [Google Scholar] [CrossRef]
Figure 1. Burkina Faso, overview of the main sampling areas (black circle) and sampling sites (spots).
Sustainability 11 05444 g001
Figure 2. Fishing methods used in our study: cast net (CN) (left), electric fishing (EF) (right).
Sustainability 11 05444 g002
Figure 3. Selection of measured habitat parameters (velocity in m/s, width and depth in m, shading in %, presence–absence of in-stream structures).
Sustainability 11 05444 g003
Figure 4. Relative frequency (%) of dominant fish families belonging to four main fish assemblage clusters.
Sustainability 11 05444 g004
Figure 5. Occurrences of structural elements in the different areas and in total.
Sustainability 11 05444 g005
Figure 6. Effect of temperature on abundance (grey bars) and number of taxa (black bars); the white dashed line indicates the number of fished habitats.
Sustainability 11 05444 g006
Figure 7. Habitat use curves of substrate size (A), wetted width (B), water depth (C), and temperature (D) for Labeo cubie (solid line), Bagrus bajad (dashed line), and Chelaethiops bibie (dotted line). Grey bars represent the mean available habitat conditions.
Sustainability 11 05444 g007
Figure 8. Cumulative sum of pressure indices per sampling area.
Sustainability 11 05444 g008
Figure 9. Number of species and biomass (g/min electrofishing) responses to different levels of human pressure.
Sustainability 11 05444 g009
Table 1. List of pressures and pressure types, including their abiotic description and effects on fish, where Hyd = hydrological pressure, Morph = morphological pressure, Conn = Connectivity pressure, Wq = water quality pressure. Adapted after Schinegger, Trautwein, Melcher, and Schmutz [38].
PressureTypeDescription Effects
Impoundment (Imp)HydVelocity alteration due to impoundment (orthofotos, on site)Loss of fluvial habitat, altered substrate and channel form
HydropeakingHydSite affected by hydropeaking (feedback of local people)Stranding and desiccation
Residual flow (Res flow)HydSite affected by water abstraction (adjacent pumps and rice fields, downstream of reservoirs)Decrease in maintenance flow, geomorphic and water quality impacts
Reservoir flushing (Res flush)HydFauna affected by upstream reservoir flushing (was set yes for dams with bottom outlet)Increased suspended sediment flow
Hydrograph modification (Hyd mod)HydSeasonal hydrograph modification (upstream large dam or series of dams)Changes in channel morphology and physical habitat composition
ChannelizationMorphAlteration of the channel plan form (on site observations, orthofotos)Reduced habitat heterogeneity, riverbed degradation
Cross section (Cross sect)MorphAlteration of the cross section (on site observations)Habitat degradation
In-stream habitat (In hab)MorphAlteration of instream habitat conditions (on site observations)Habitat degradation
EmbankmentMorphArtificial embankment (on site observations)Disrupts lateral connectivity, loss of riverbank habitats
Flood protection (Flood prot)MorphPresence of dykes for flood protection (on site observations, orthofotos)Altered riparian and floodplain habitat
Barriers upstreamConnBarriers on segment level upstream (buffer on orthofotos)Habitat fragmentation
Barriers downstreamConnBarriers on segment level downstream (buffer on orthofotos)Habitat fragmentation
pH Modification (pH mod)WqVery high/low pH, big pH fluctuation between habitats, washing observedPhysiological stress for fish
Eutrophication (Eut)WqArtificial eutrophication(nutrient input, intensive plant growth)Algal blooms, oxygen depletion
PollutionWqIs pollution observed, can diffuse pollution be expected (trash, pesticides observed)Physiological stress for fish
FishingFishAlteration of fish community due to overfishing (observations, feedback of local people)Changes in fish community
AgricultureAgriSite affected by agriculture within a buffer of 1 kmNutrient input, pollution, sedimentation
Table 2. Overview of caught families, genera, and number of species for all sampling sites.
FamilyGenusTotalKougriKoubriBagréNazingaOthers
AlestidaeAlestes332222
Brycinus313111
Hydrocynus2 2
Micralestes322
AnabantidaeCtenopoma1 1
BagridaeBagrus221212
CentropomidaeLates111 11
CichlidaeHemichromis312132
Oreochromis111111
Sarotherodon111111
Coptodon111111
CitharinidaeCitharinus1 1
ClariidaeClarias111111
Heterobranchus11 1
ClaroteidaeAuchenoglanis2 1121
Chrysichthys2 21
CyprinidaeEnteromius635223
Chelaethiops111111
Labeo411332
Leptocypris1 1
DistichodontidaeDistichodus11 11
MalapteruridaeMalapterurus1 1 1
MochokidaeSynodontis756434
MormyridaeHyperopisus211121
Marcusenius211121
Mormyrops1 1
Mormyrus311231
Petrocephalus212121
Pollimyrus311131
Brevimyrus1 1
PolypteridaePolypterus2 1 21
ProtopteridaeProtopterus1 1
SchilbeidaeParailia1111 1
Schilbe211221
693344324632
Table 3. Relative frequency (%) of fish families (in alphabetical order) belonging to four main fish assemblage clusters; dominating families are highlighted in bold.
FamilyAssemblage 1Assemblage 2Assemblage 3Assemblage 4
Alestidae21.53.3-17.9
Bagridae3.10.8-0.4
Centropomidae20.81.50.3
Cichlidae13.369.313.914.2
Clariidae4.45.273.94.1
Claroteidae1.61.4-0.4
Cyprinidae13.19.33.857.9
Distichodontidae0.20.2-<0.1
Malapteruridae2.2---
Mochokidae10.642.42.3
Mormyridae15.64.63.11.6
Polypteridae0.20-0.2
Protopteridae--1.1-
Schilbeidae12.61.20.10.8
Table 4. Measured physicochemical parameter ranges [conductivity (µs/cm), temperature (°C), pH, and oxygen (%)] for all areas and for the aquatic habitats associated with selected key species.
Conductivity (µs/cm)Temperature (°C)pHOxygen (%)
MinMaxMeanMinMaxMeanMinMaxMeanMinMaxMean
Kougri58.627197.828.035.131.77.29.87.94315875.8
Koubri42.526795.729.235.131.86.410.17.61813578.2
Bagré48.2219134.324.031.026.96.89.08.34613173.7
Nazinga67.210277.723.330.225.57.68.67.8759085.6
Others36.927064.928.235.032.57.29.67.8488058.0
Total36.927192.023.335.130.16.410.17.81815876.3
Bagrus bajad55.627179.323.335.127.07.29.67.74315886.6
Chelaethiops bibie46.525574.923.335.129.76.49.87.74615880.1
Labeo cubie48.227171.923.332.426.26.88.97.84310587.2
Lates niloticus36.911775.623.335.126.76.410.17.61810380.3
Table 5. Selected habitat parameters [velocity (m/s), water depth (m), shading (%), and wetted width (m)] for the aquatic habitats associated with selected key species.
Velocity (m/s)Water Depth (m)Shading (%)Wetted Width (m)
MinMaxMeanMinMaxMeanMeanMinMaxMean
Bagrus bajad00.40.010.128.001.87.81.79142.0022.18
Chelaethiops bibie00.70.060.118.000.617.60.80142.0017.95
Labeo cubie00.60.370.081.750.38.90.88100.005.39
Lates niloticus00.40.010.118.001.111.81.7928.6017.06
Table 6. Summary of genera correlating significantly (0.05) with the pressure indices. HPI = hydrological pressure index, MPI = morphological pressure index, CPI = connectivity pressure index, WPI = water quality pressure index, API = agricultural pressure index; The global pressure index (GPI) correlated highly with the number of taxa, each significant at a 0.01 level. Correlation at family level was −0.710, at genus level −0.740, and at species level −0.792.
Pressure IndexCorrelating Genera (Pearson Correlation)
HPIAuchenoglanis (−0.452), Ctenopoma (−0.611), Heterobranchus (−0.478), Hydrocynus (−0.602), Polypterus (−0.468), Schilbe (−0.460)
MPIChrysichthys (0.426), Schilbe (−0.502)
CPIBrycinus (−0.556), Distichodus (−0.437), Hemichromis (0.384), Coptodon (0.545)
WPIAuchenoglanis (−0.370), Citharinus (−0.388), Ctenopoma (−0.459), Hydrocynus (−0.428), Malapterurus (−0.379), Marcusenius (−0.367)
APIAuchenoglanis (−0.516), Citharinus (−0.616), Ctenopoma (−0.727), Heterobranchus (−0.493), Hydrocynus (−0.678), Marcusenius (−0.593), Polypterus (−0.370)
FishingAlestes (−0.483), Auchenoglanis (−0.454), Citharinus (−0.527), Ctenopoma (−0.622), Heterobranchus (−0.414), Hydrocynus (−0.580), Marcusenius (−0.423)
GPICitharinus (−0.451), Ctenopoma (−0.552), Heterobranchus (−0.399), Hydrocynus (−0.523), Marcusenius (−0.396), Schilbe (−0.439), Coptodon (0.469)
CPI = connectivity index.

