1. Introduction
In the semi-arid rural areas of tropical Africa, drought reduces access to water for human consumption and affects both livestock and rain-fed crops. In the same areas, more and more frequent flash floods destroy irrigated crops, damage hydraulic works, and consequently prevent recession agriculture with which smallholder farmers compensate the deficit of rain-fed crops [
1]. The coexistence of different hazards is so frequent that the Sendai framework for Disaster Risk Reduction (2015) recommends a sustainable livelihood development based upon multi-hazard risk assessments [
2]. However, the risk assessments published on tropical Africa (
Table 1) deal with a single hazard at a time, which in 90% of cases, is the flood hazard and, for the remainder, the drought hazard.
The published assessments usually follow two approaches. The first approach performs distance assessments through satellite images, digital elevation models, soil maps, precipitations, and stream-flow datasets. When the approach involves using indicators, it obtains them from literature rather than from ground truth. It neglects the risk reduction actions in progress and proposes few in case of drought. The second approach listens to the community. This is not sufficient to appreciate the risk of events that the community has not yet experienced [
28], to assess the probability of disaster (which is a constitutive element of the concept of risk), or to identify the exposed areas.
Although the importance of local knowledge in adapting to climate change [
29] is unquestionable and there is a broad consensus regarding the need to combine it with scientific knowledge in risk reduction [
30,
31,
32,
33], assessments in tropical Africa which integrate both types of knowledge are still rare [
1,
3,
18].
The Sendai framework recommends improving the understanding of risks at all spatial scales [
10]. Indeed, after Sendai, the subnational assessments have increased. The regional scale is important for action, as it is that in which official development aid and the local authorities themselves operate most often with medium-term programs and projects. However, regional scale risk assessments struggle to estimate the hazard when climate information is scarce [
34], to identify truly expressive indicators of the risk determinants, to take account of the risk reduction measures in place, and to suggest pertinent ones for the future (
Table 1).
At the regional scale, assessments which identify the most exposed communities and suggest how to deal with the risk could help official development aid and the local authorities in risk-informed decision-making, which would certainly aid sustainable livelihood development.
The aim of this article was to develop a multi-hazard risk assessment ranking the communities according to the risk level and identify risk reduction actions using local and scientific knowledge and techniques adapted to unskilled operators and scant information.
To achieve this objective, the multi-hazard risk index (MHRI) was proposed. The risk equation used combines hazard (H), meaning the “potential occurrence of a natural physical event that may cause loss of life, injury or damage to property” [
35]; exposure (E), or “the presence of people, livelihoods, species or ecosystems, environmental functions, services, and resources, infrastructure, or economic, social, or cultural assets in places and settings that could be adversely affected” [
35]; vulnerability (V), “the propensity or predisposition to be adversely affected” [
35]; and adaptive capacity (AC), namely “the ability of systems, institutions, humans and other organisms to adjust to potential damage, to take advantage of opportunities, or to respond to consequences” [
35]: R = H × (E + V − AC). The equation is an adaptation of that proposed by Crichton [
36]. Each risk determinant is expressed by indicators, which were identified after discussion with the communities and visits to the exposed items.
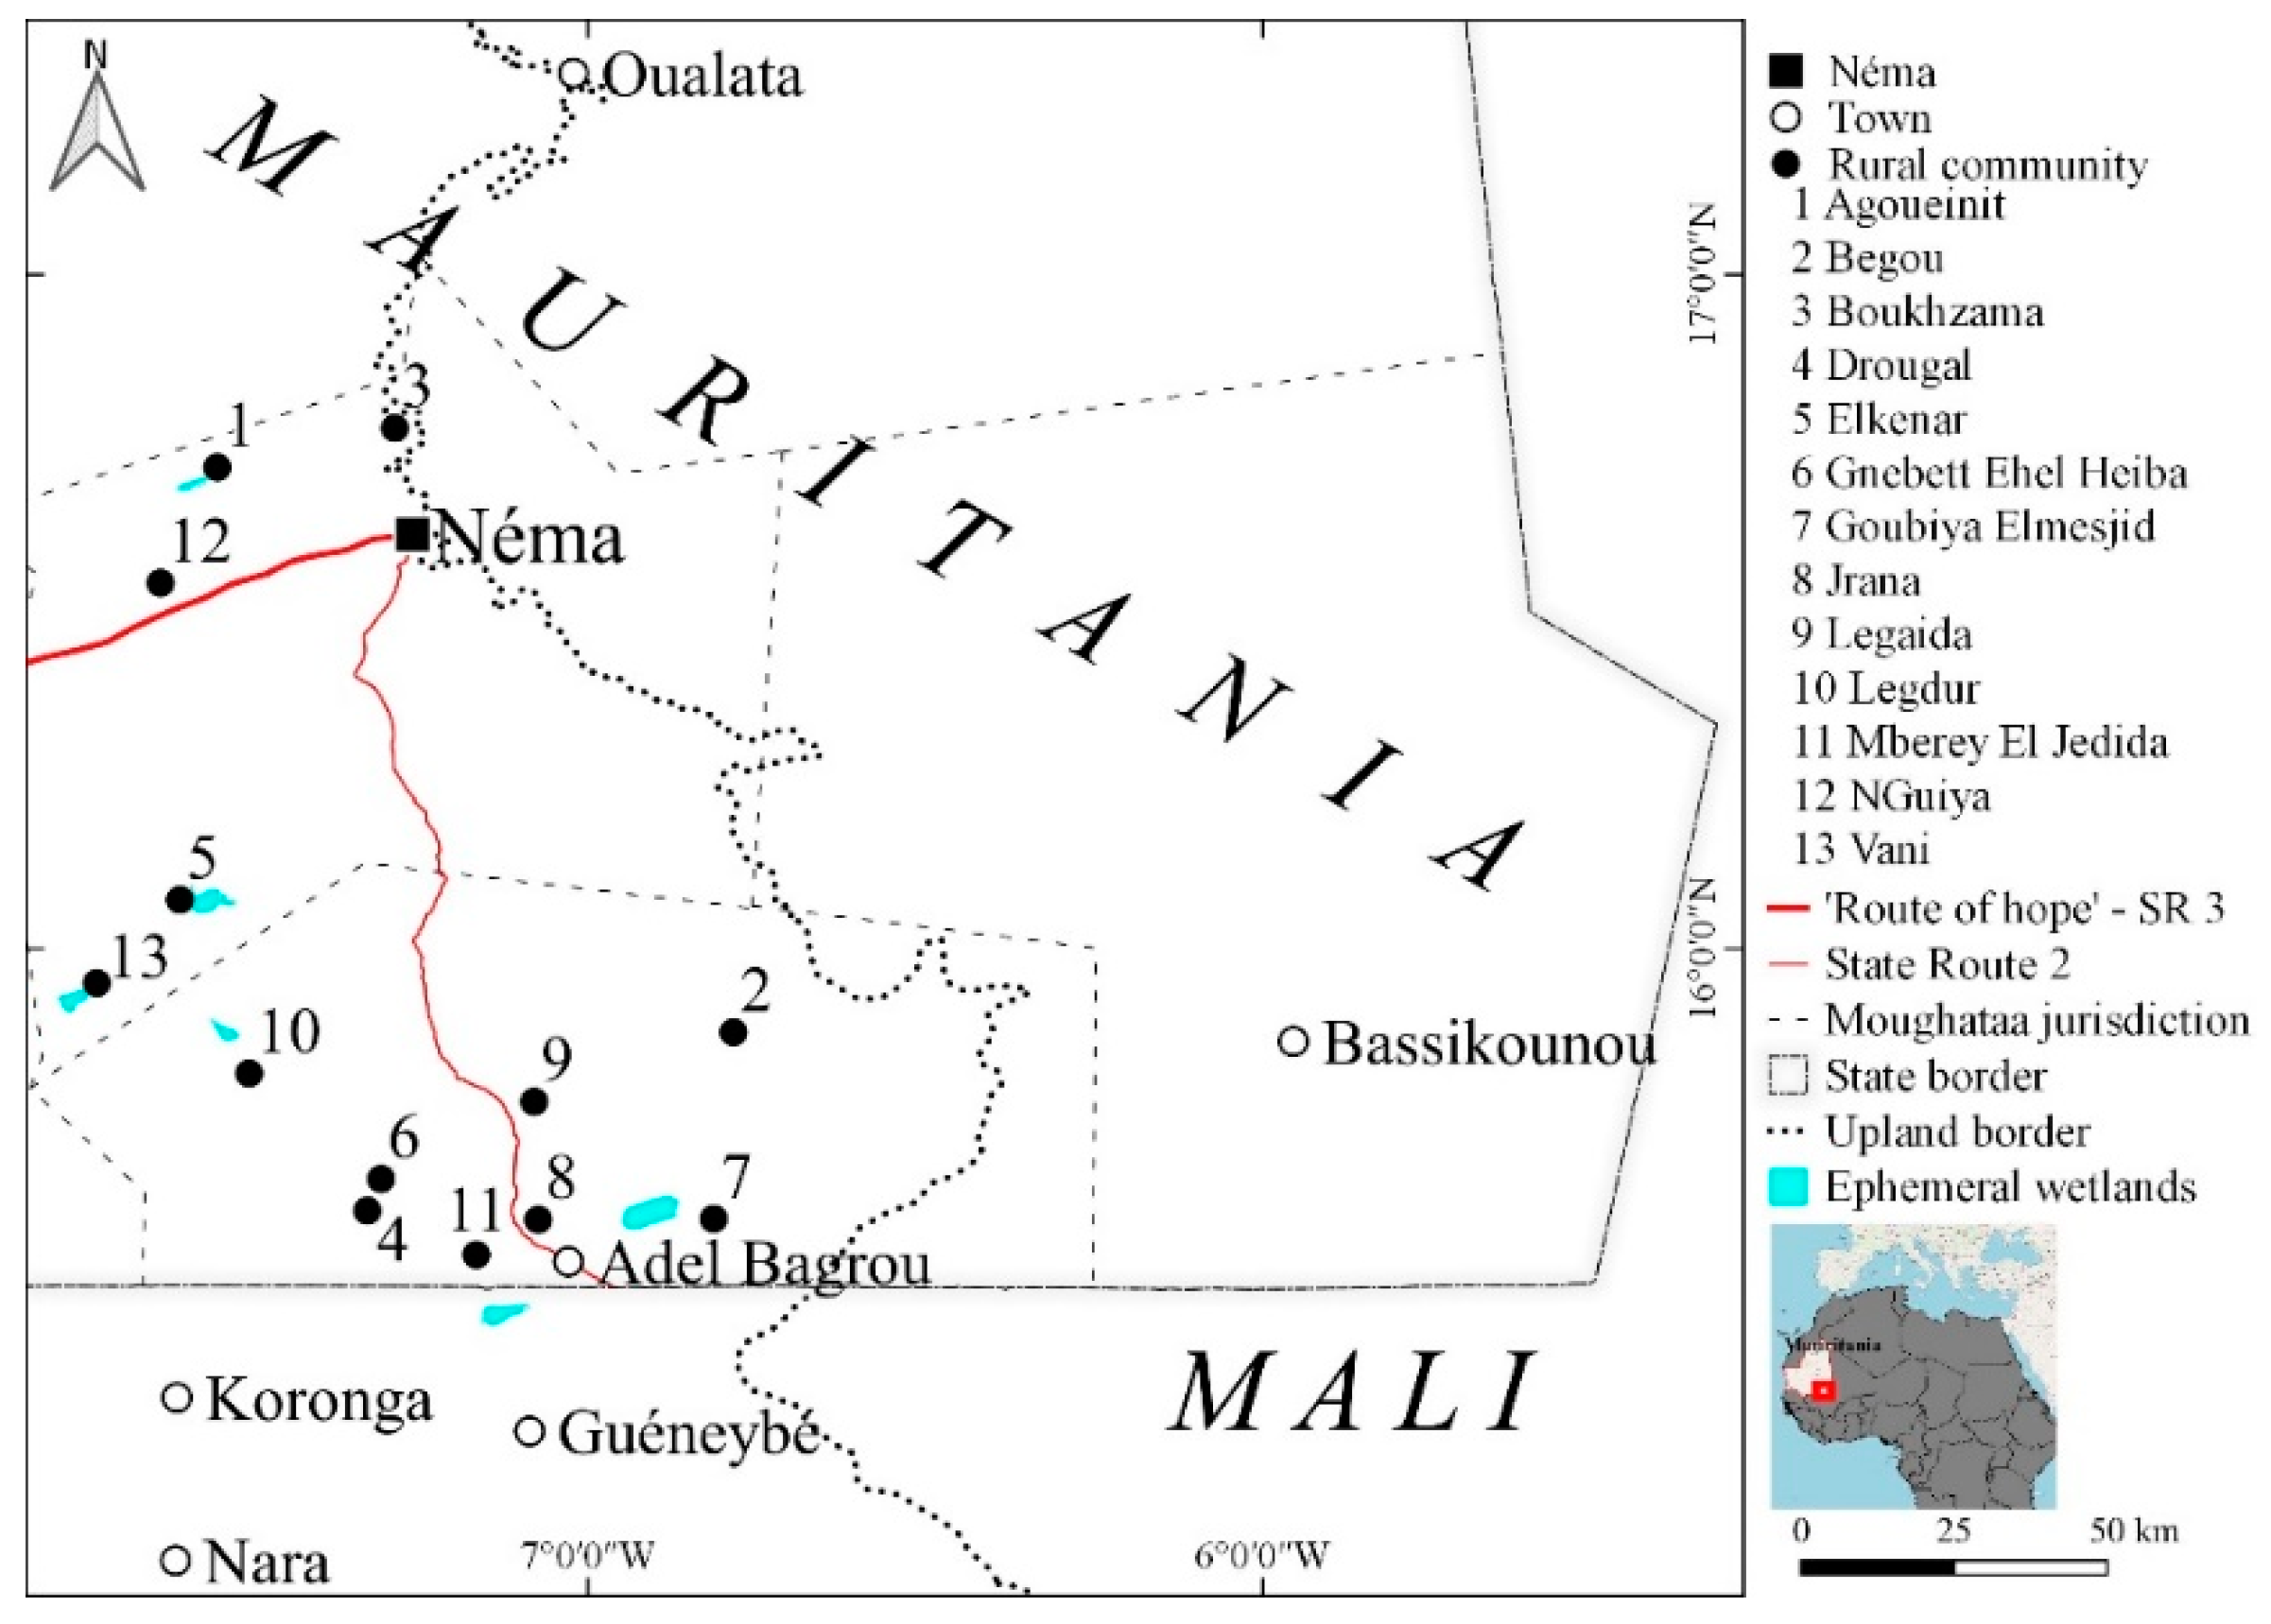
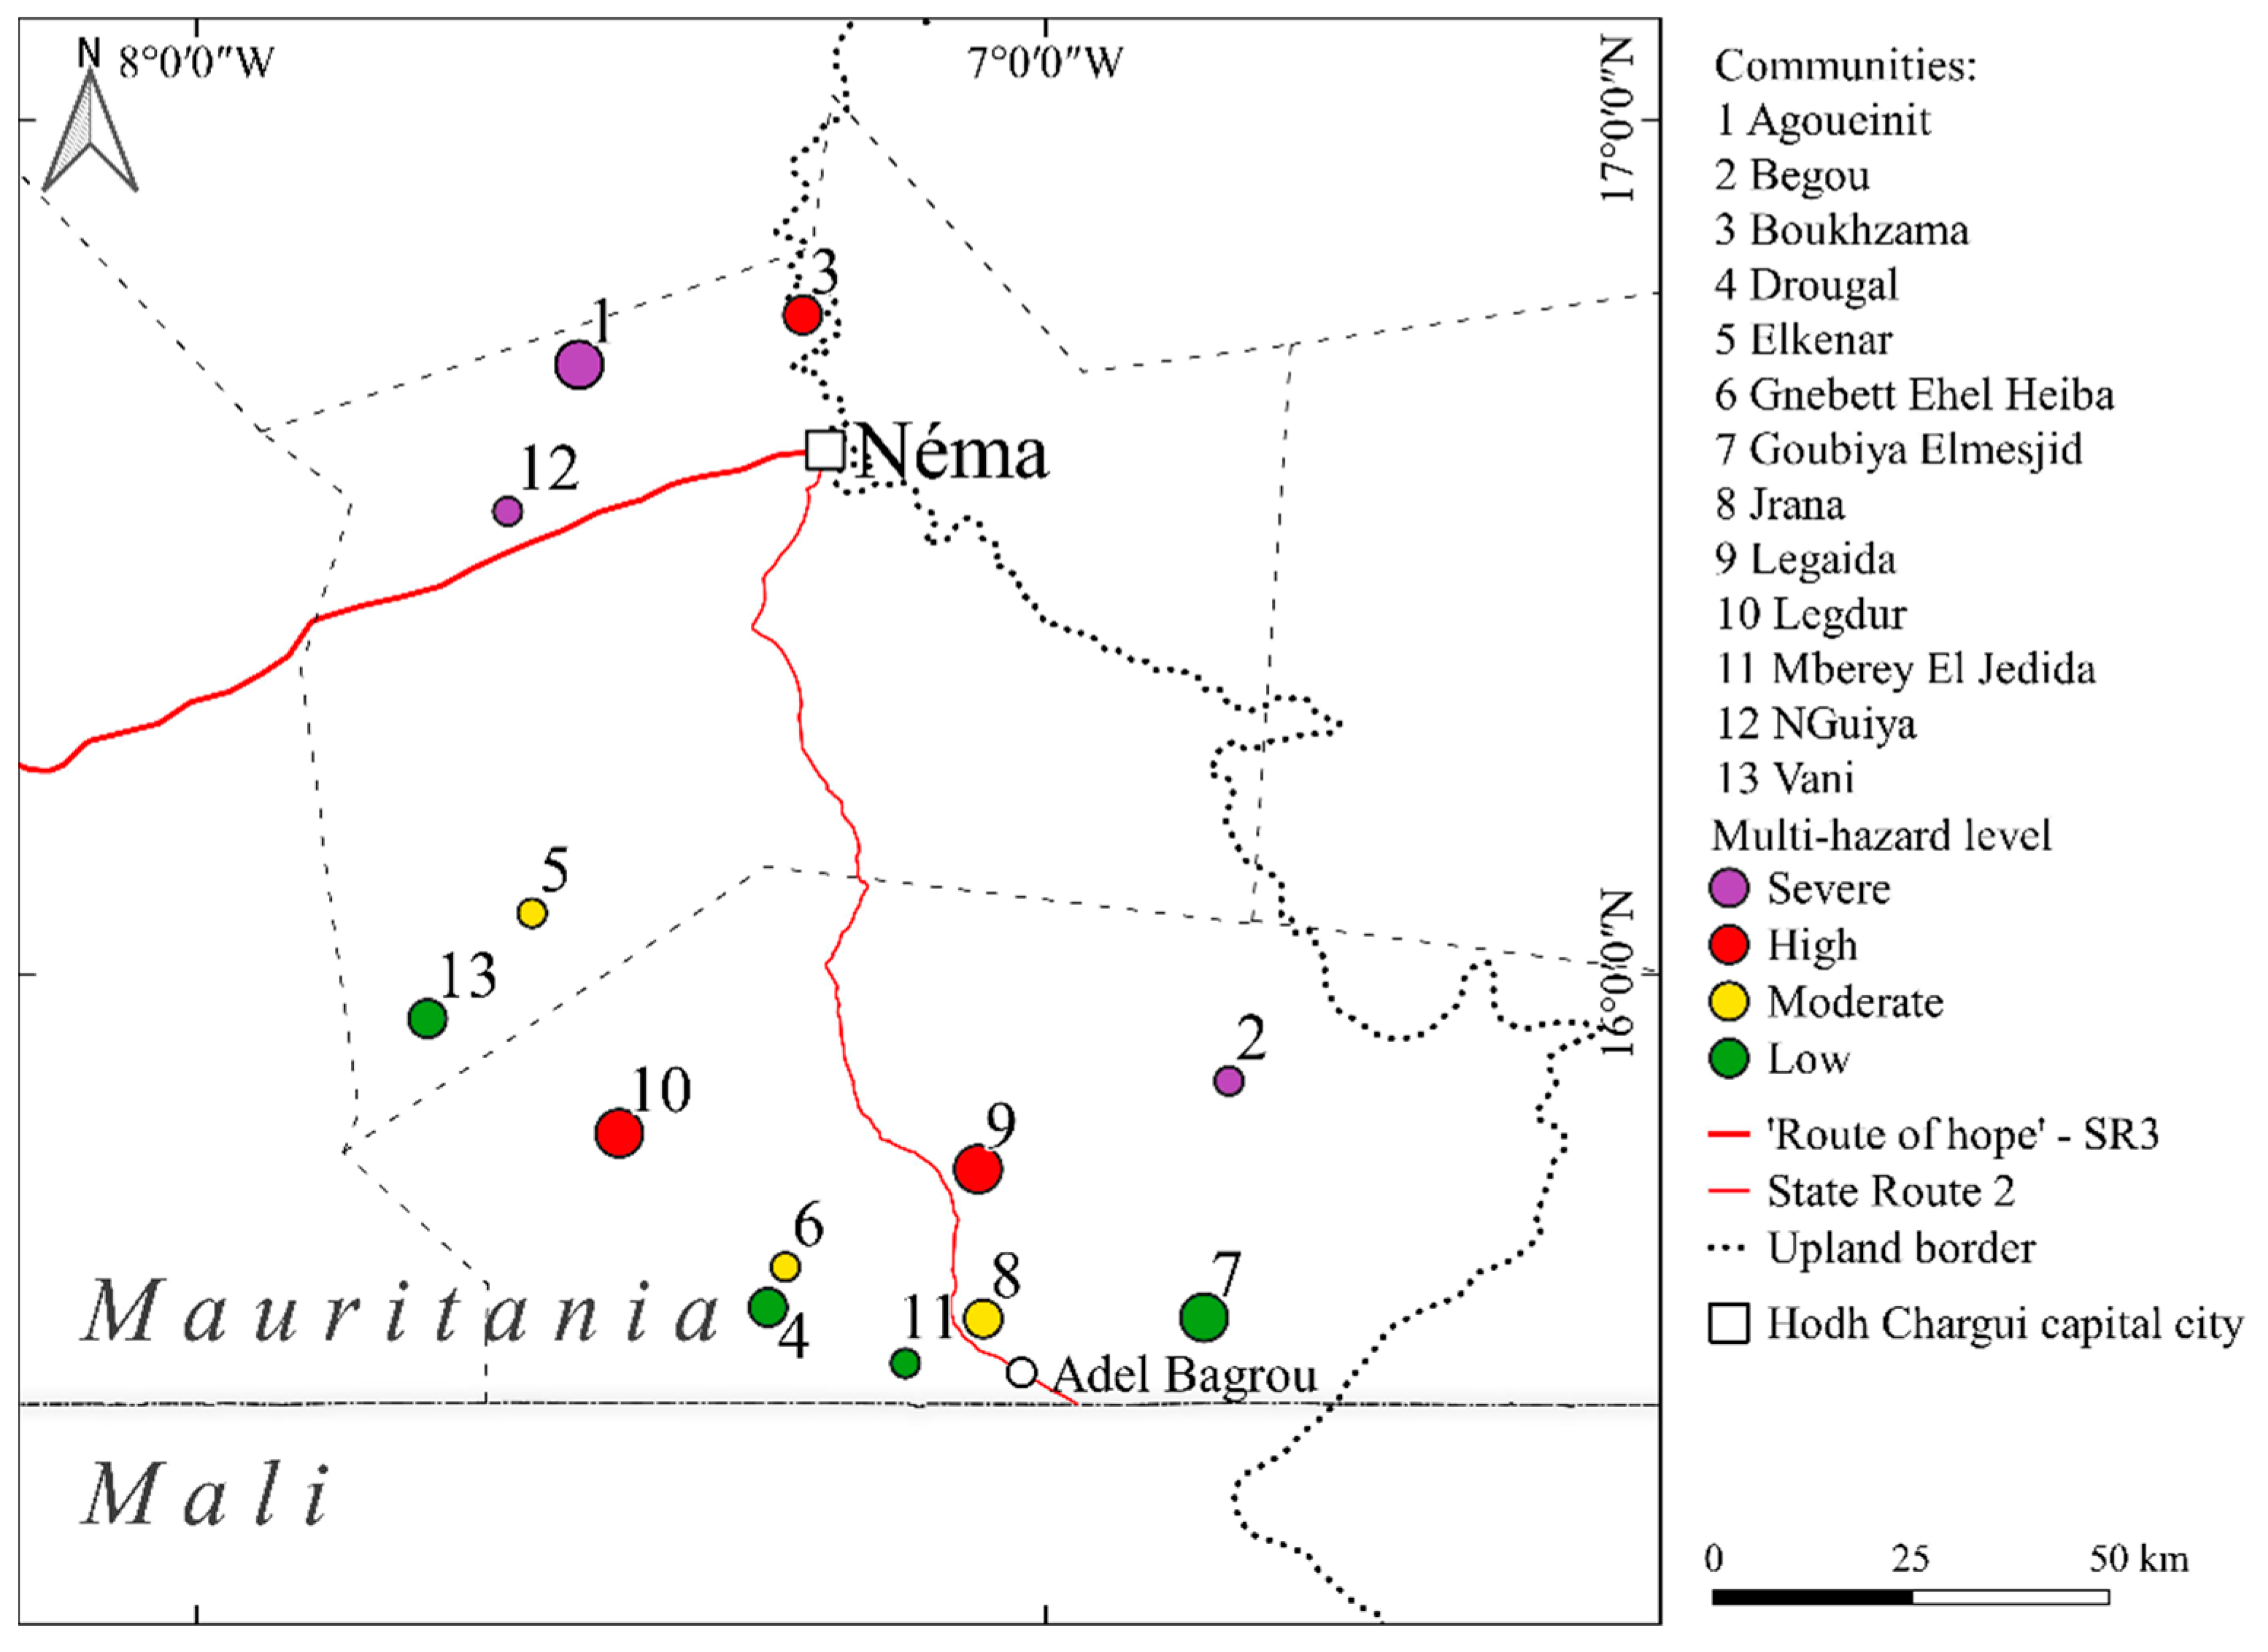
The multi-hazard risk assessment was carried out with 13 rural communities of the municipalities of Adel Bagrou, Agoueinit, Bougadoum, Oum Avnadech, in Hodh Chargui, Mauritania, a landlocked region located 1100 km from the Atlantic Coast (
Figure 1).
Location names in local documents change. This article used the names adopted by the general census of the population of the Islamic Republic of Mauritania in 2013 [
37]. These communities were among the most in need of reducing the hydro-climatic risk, according a preliminary survey on 271 communities (2017) of the Hodh Chargui. The 13 communities can be aggregated into three clusters: One around Néma, the capital of Hodh Chargui; one to the south-west of Néma; and one to the south, around Adel Bagrou, close to border with Mali. The Hodh Chargui is experiencing strong demographic growth: The region increased from 212,000 inhabitants in 1988 to 431,000 inhabitants in 2013 [
37].
The 13 agropastoral communities have between 400 and 2600 inhabitants. These are settlements that have been established mostly in the last 40 years, constituted by the agglomeration of stone dwellings (sometimes made from crude earth bricks). Each stone dwelling is flanked by a construction with a two-pitched roof, under which life takes place during the warm months, and an enclosure for the animals around a tree in the branches of which the fodder is stored.
The key elements of each community are the wells which are, in general, traditional (uncovered, without water pumps), and are, in some cases, flooded during the wet season. In the dry season, they may be found some kilometers away. It is rare for a community to have a borehole with a respective water reservoir. The mosque, the school, and the community leader’s residence are the other significant locations of each community. During the dry season (November–May), the shepherds go to the southern pastures. Only a small part of the livestock remains in the communities for requirements of milk, cheese, and meat. To sell the animals, the shepherds go as far as Senegal, traveling between 100 and 300 km [
38].
Between June and August, rain-fed agriculture is practiced. The herds return to the pastures around the villages of origin. Half of the communities use an ephemeral wetland, at the edges of which they dig wells for pastoral and sometimes human use. In this season, some communities remain isolated because the conditions of the tracks do not allow vehicular access. Poor rainfall leads communities to pick up the runoff with earth embankments to practice recession agriculture from October onward. The embankments are, however, exposed to trampling by the herds which cross them or by the heavy rains. When the embankments are damaged, they no longer retain water and recession agriculture is reduced to small surfaces. The households that can afford it enclose the fields with metal fences to protect the crops from stray livestock. Those who do not have such resources resort to the use of thorny branches, which is prohibited, to preserve the scarce arboreal and shrubby coverage of the region. Later, when the dry season takes hold, irrigated commercial agriculture commences.
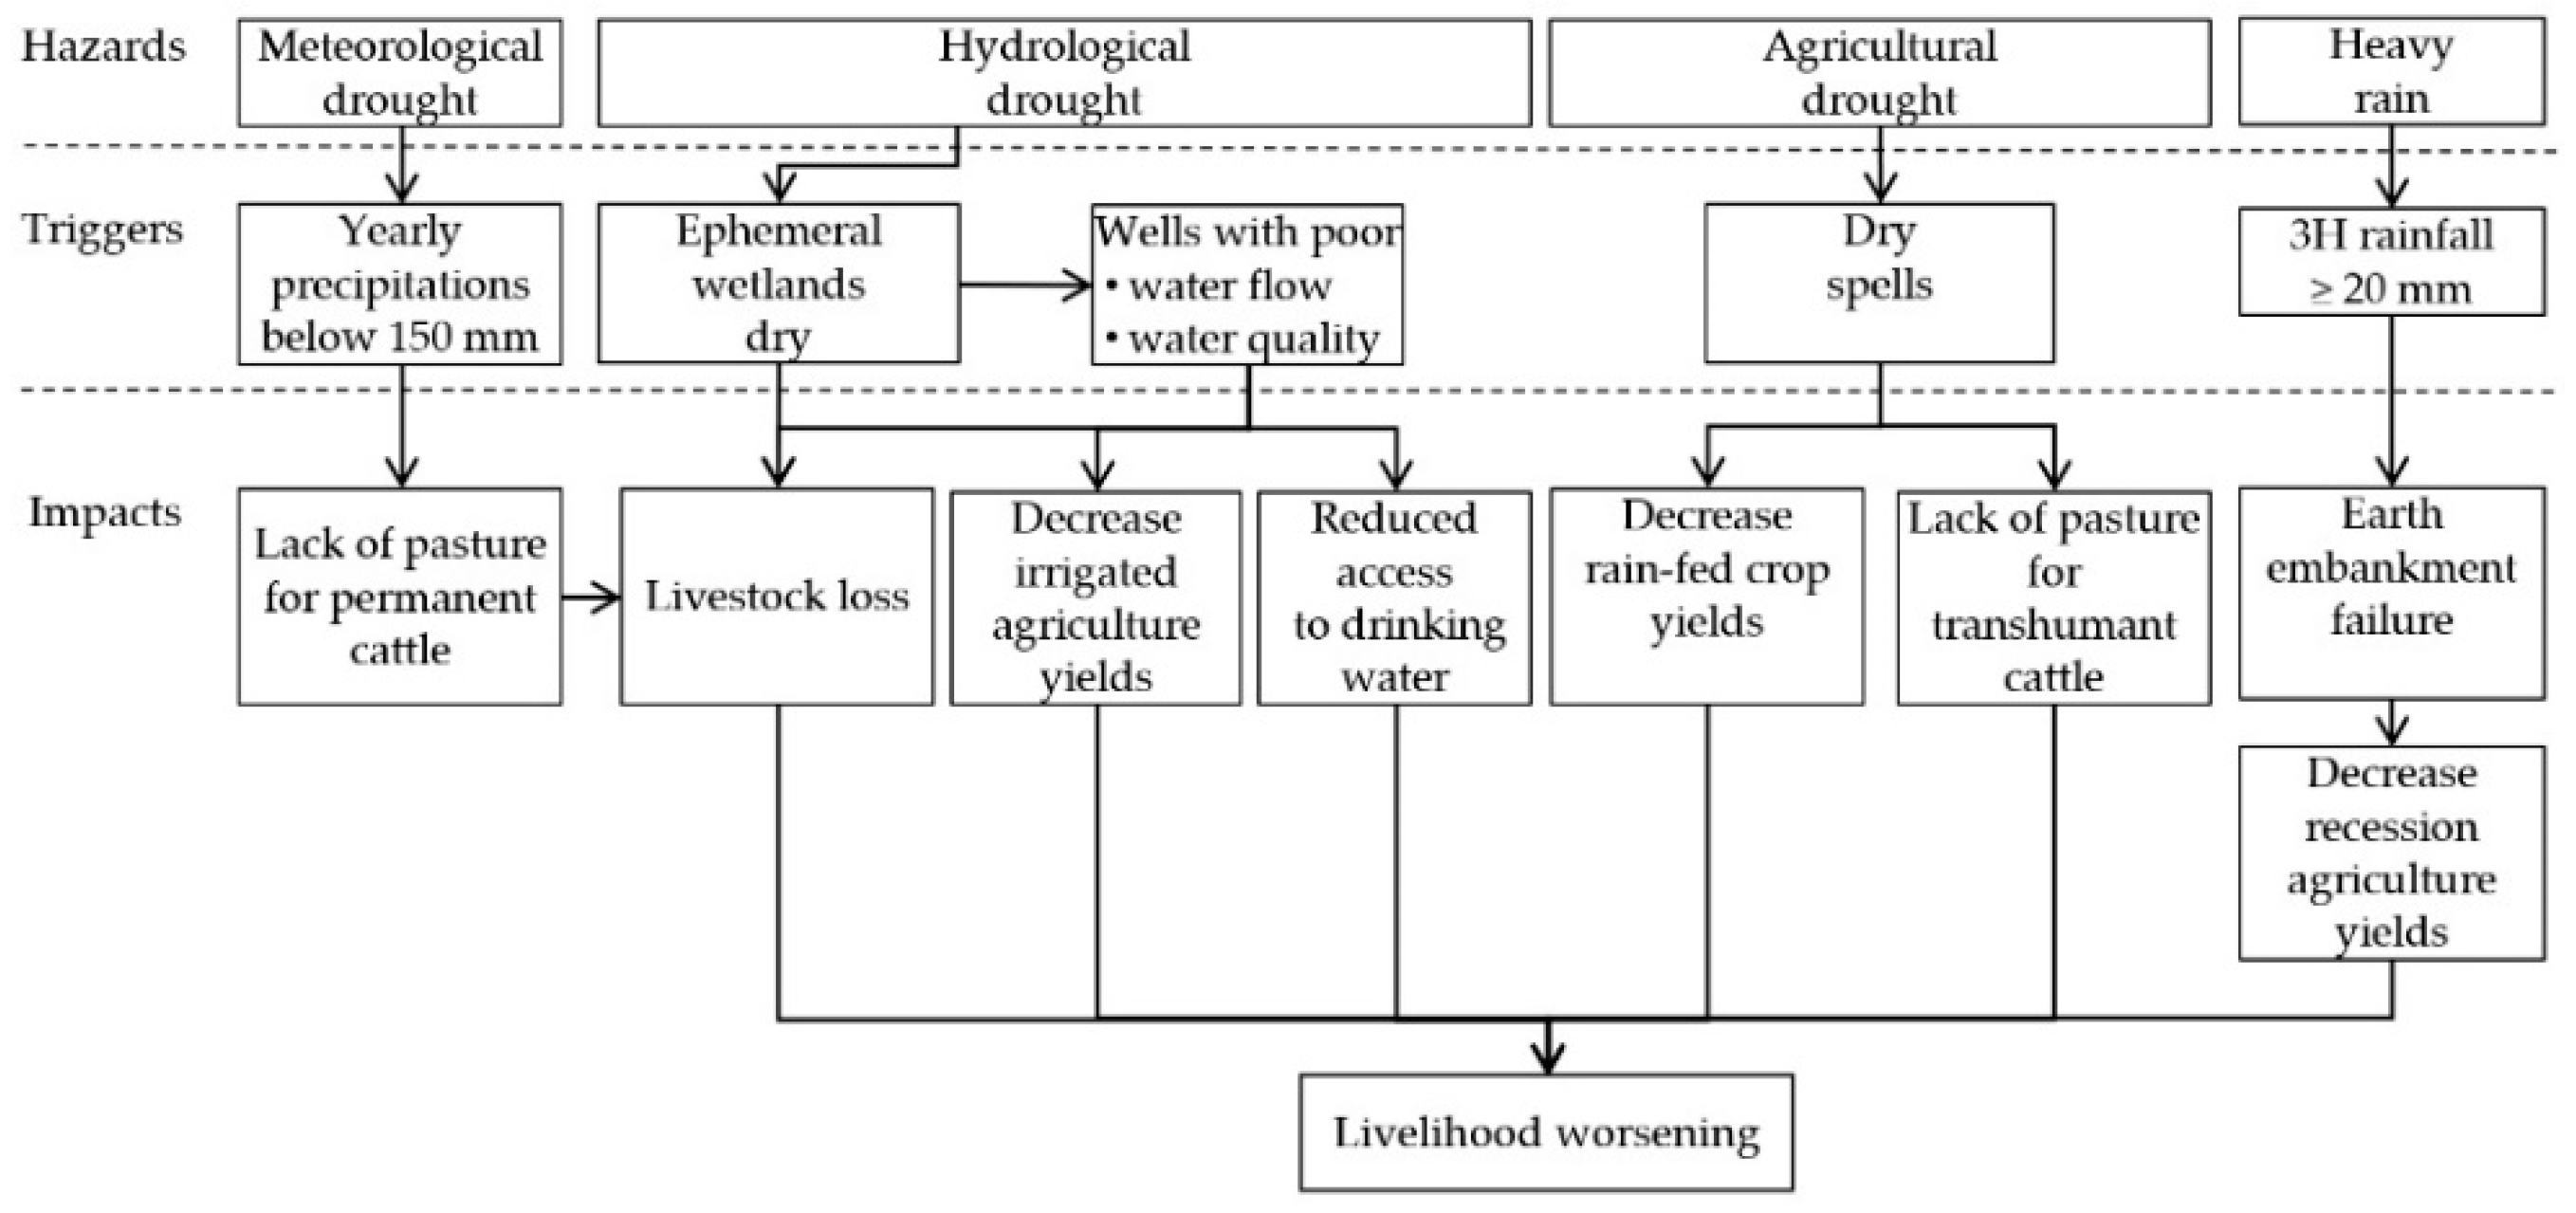
These activities are constantly exposed to drought, which manifests primarily with “an abnormal precipitation deficit” [
35] (meteorological drought). This has effects that continue well beyond the wet season: The availability of fodder (trees, shrubs, grass) drops, the ephemeral wetlands where livestock are watered do not fill up, the surface aquifer does not refill, the pastoral wells and traditional wells used by many communities dry up or have poor quality water, and the possibility of recession agriculture and irrigated gardening fades.
Drought can also manifest with a “shortage of precipitation during the runoff and percolation season primarily affecting water surfaces” (hydrological drought) and with a “shortage of precipitation during the growing season” (agricultural drought) [
35].
The three forms of drought co-exist with heavy precipitations, which damage the earth embankments, as well as make the wells in the flood areas inaccessible and, if flooded, unusable. All these events threaten the livelihood of the Hodh Chargui communities (
Figure 2).
This assessment thus considered meteorological, hydrological, and agricultural drought and heavy precipitations. The four hazards are combined in the multi-hazard risk index (MHRI), respecting the same importance of each risk determinant and the quantitative measurement of the indicators [
39].
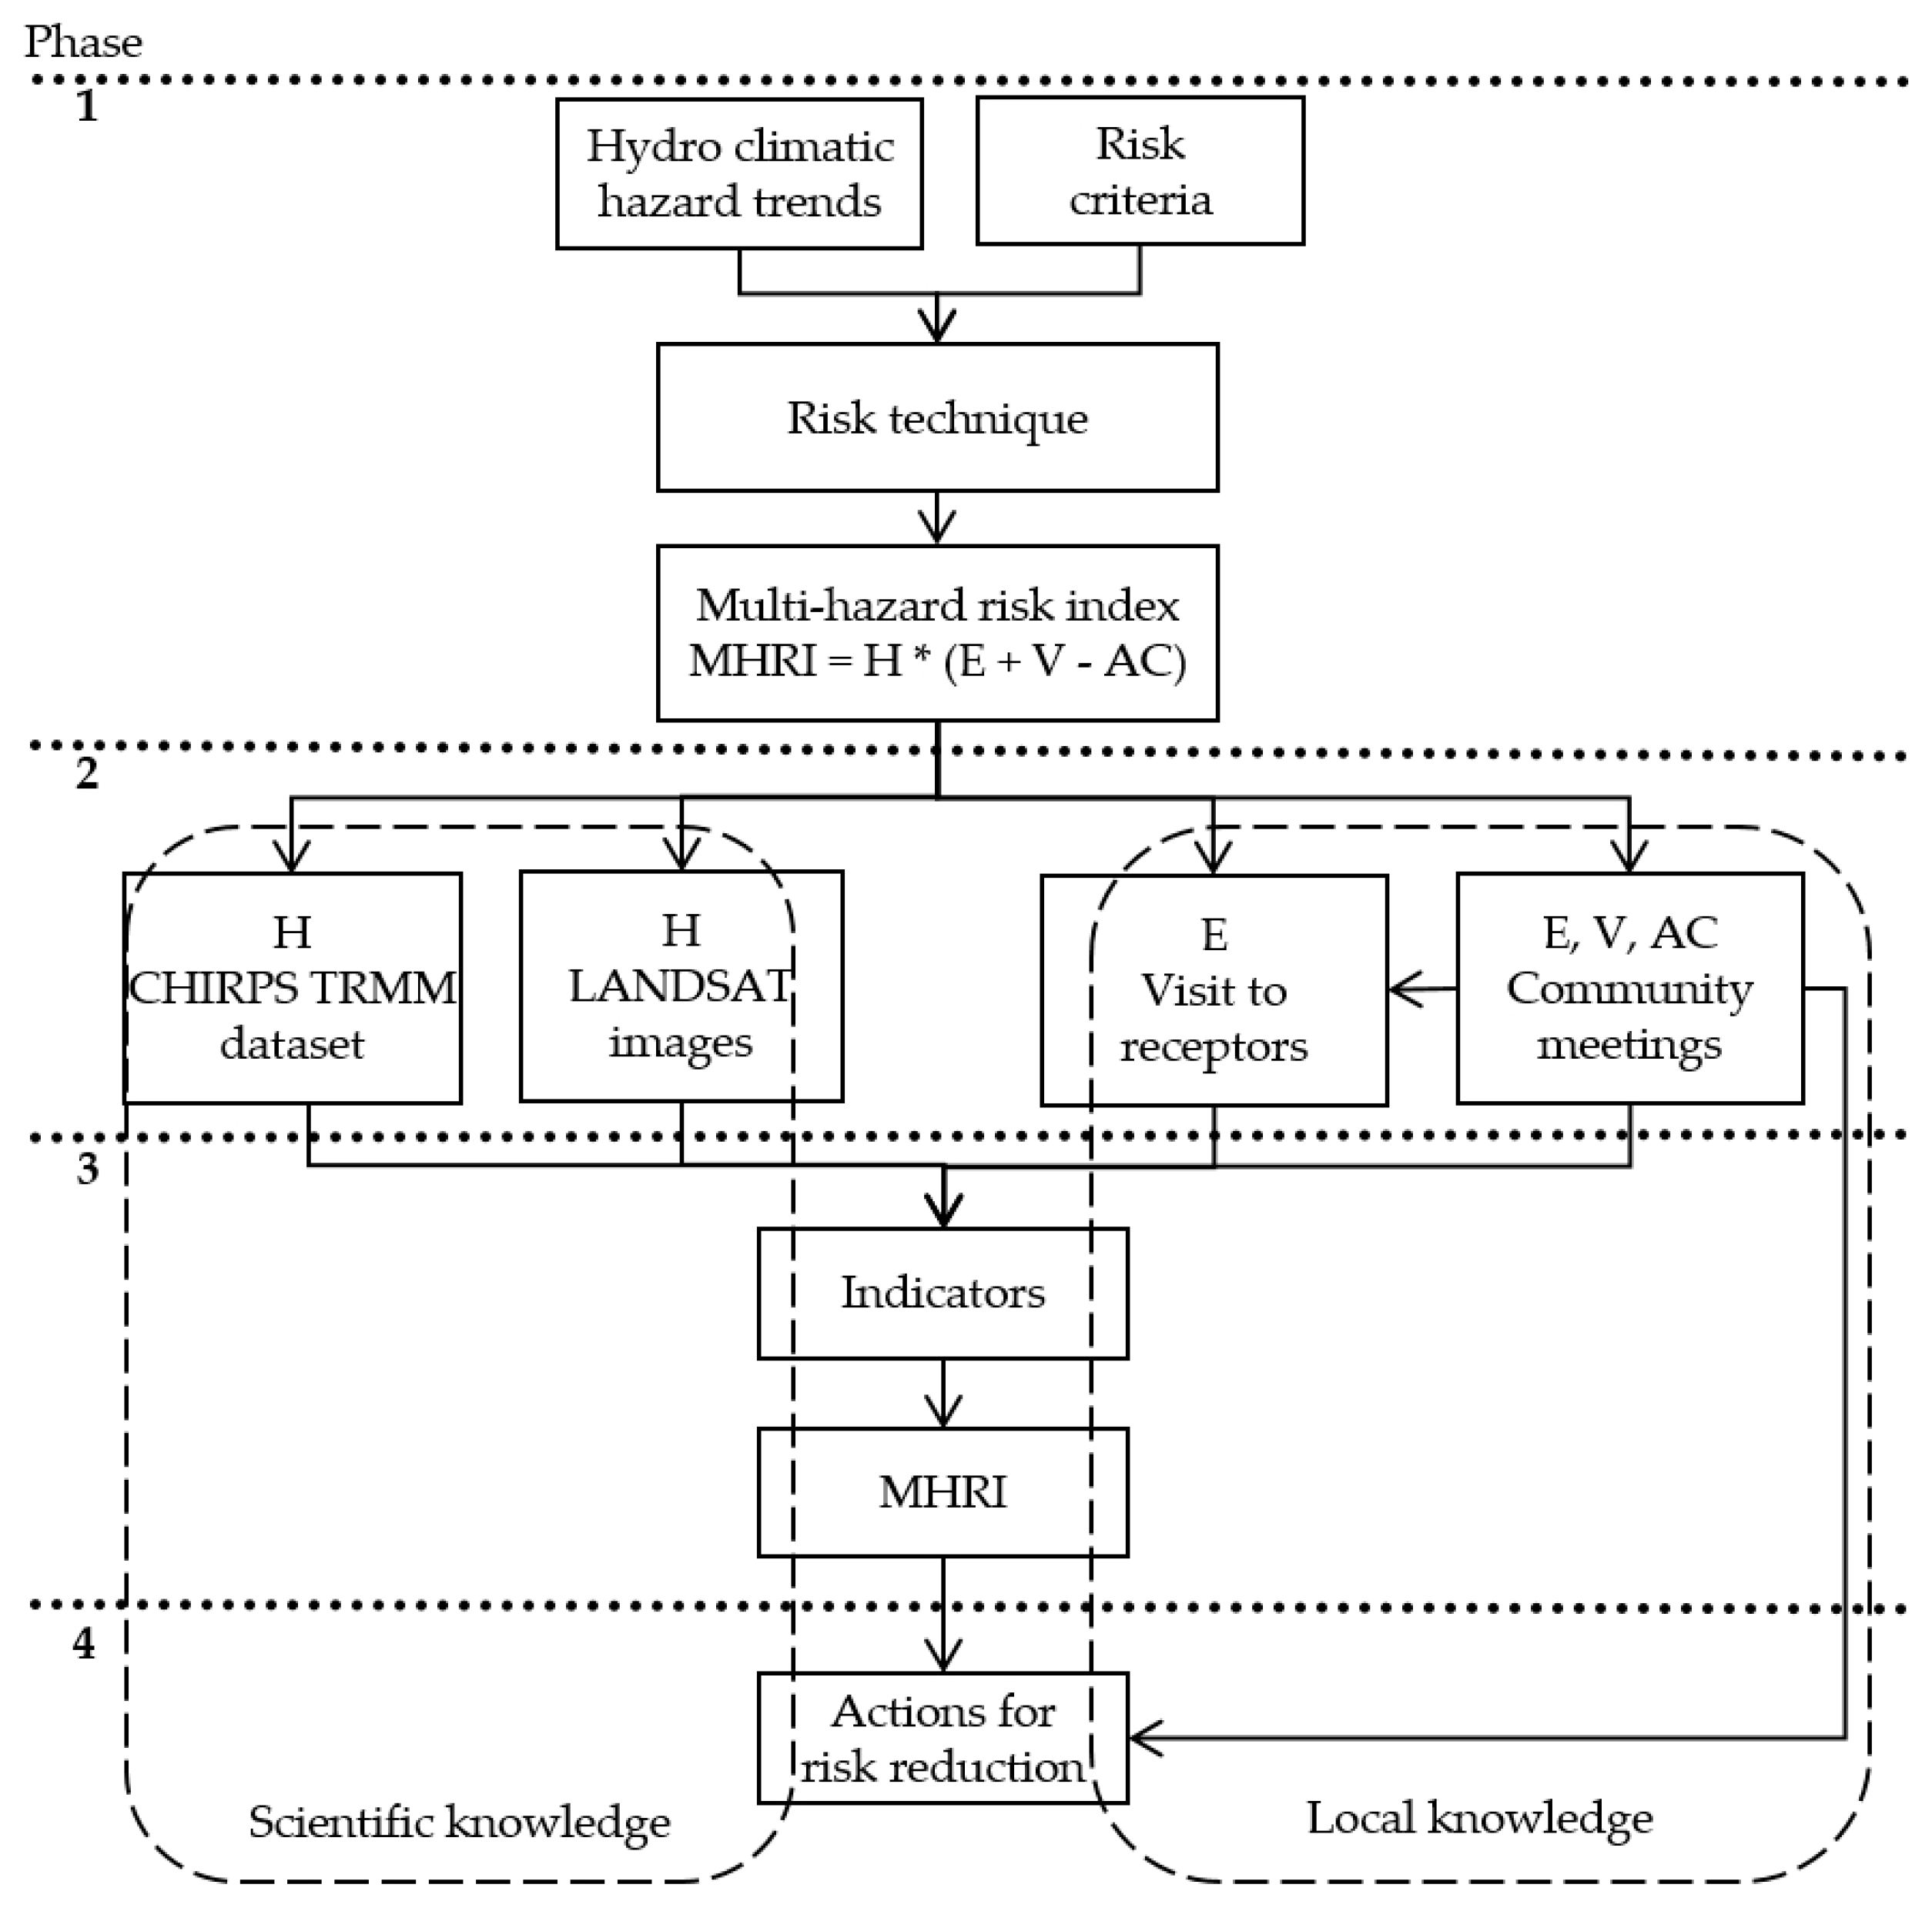
The assessment is organized into four phases (
Figure 3).
The first phase identifies the context: The trend of daily precipitation, the variation in the extension of surface waters, the risk criteria (equation, probability of occurrence, level), and the technique to be used. The second phase identifies the risk: Which datasets to use to determine the hazard and how to ascertain exposure, vulnerability, and adaptive capacity. The third phase identifies the indicators for each risk determinant, collects information from the 13 communities, processes the data, produces the MHRI, and represents it on the map. The final phase identifies the risk reduction actions.
The most significant results obtained by the assessment are the reproducibility of the methodology and the existence of very different risk levels in an apparently homogeneous territory, influenced, above all, by meteorological drought and heavy rains, and the proposal of 12 risk reduction actions.
2. Materials and Methods
The multi-hazard risk was ascertained using the index technique [
40]. This technique fits unskilled operators and can be used in other regions of Mauritania.
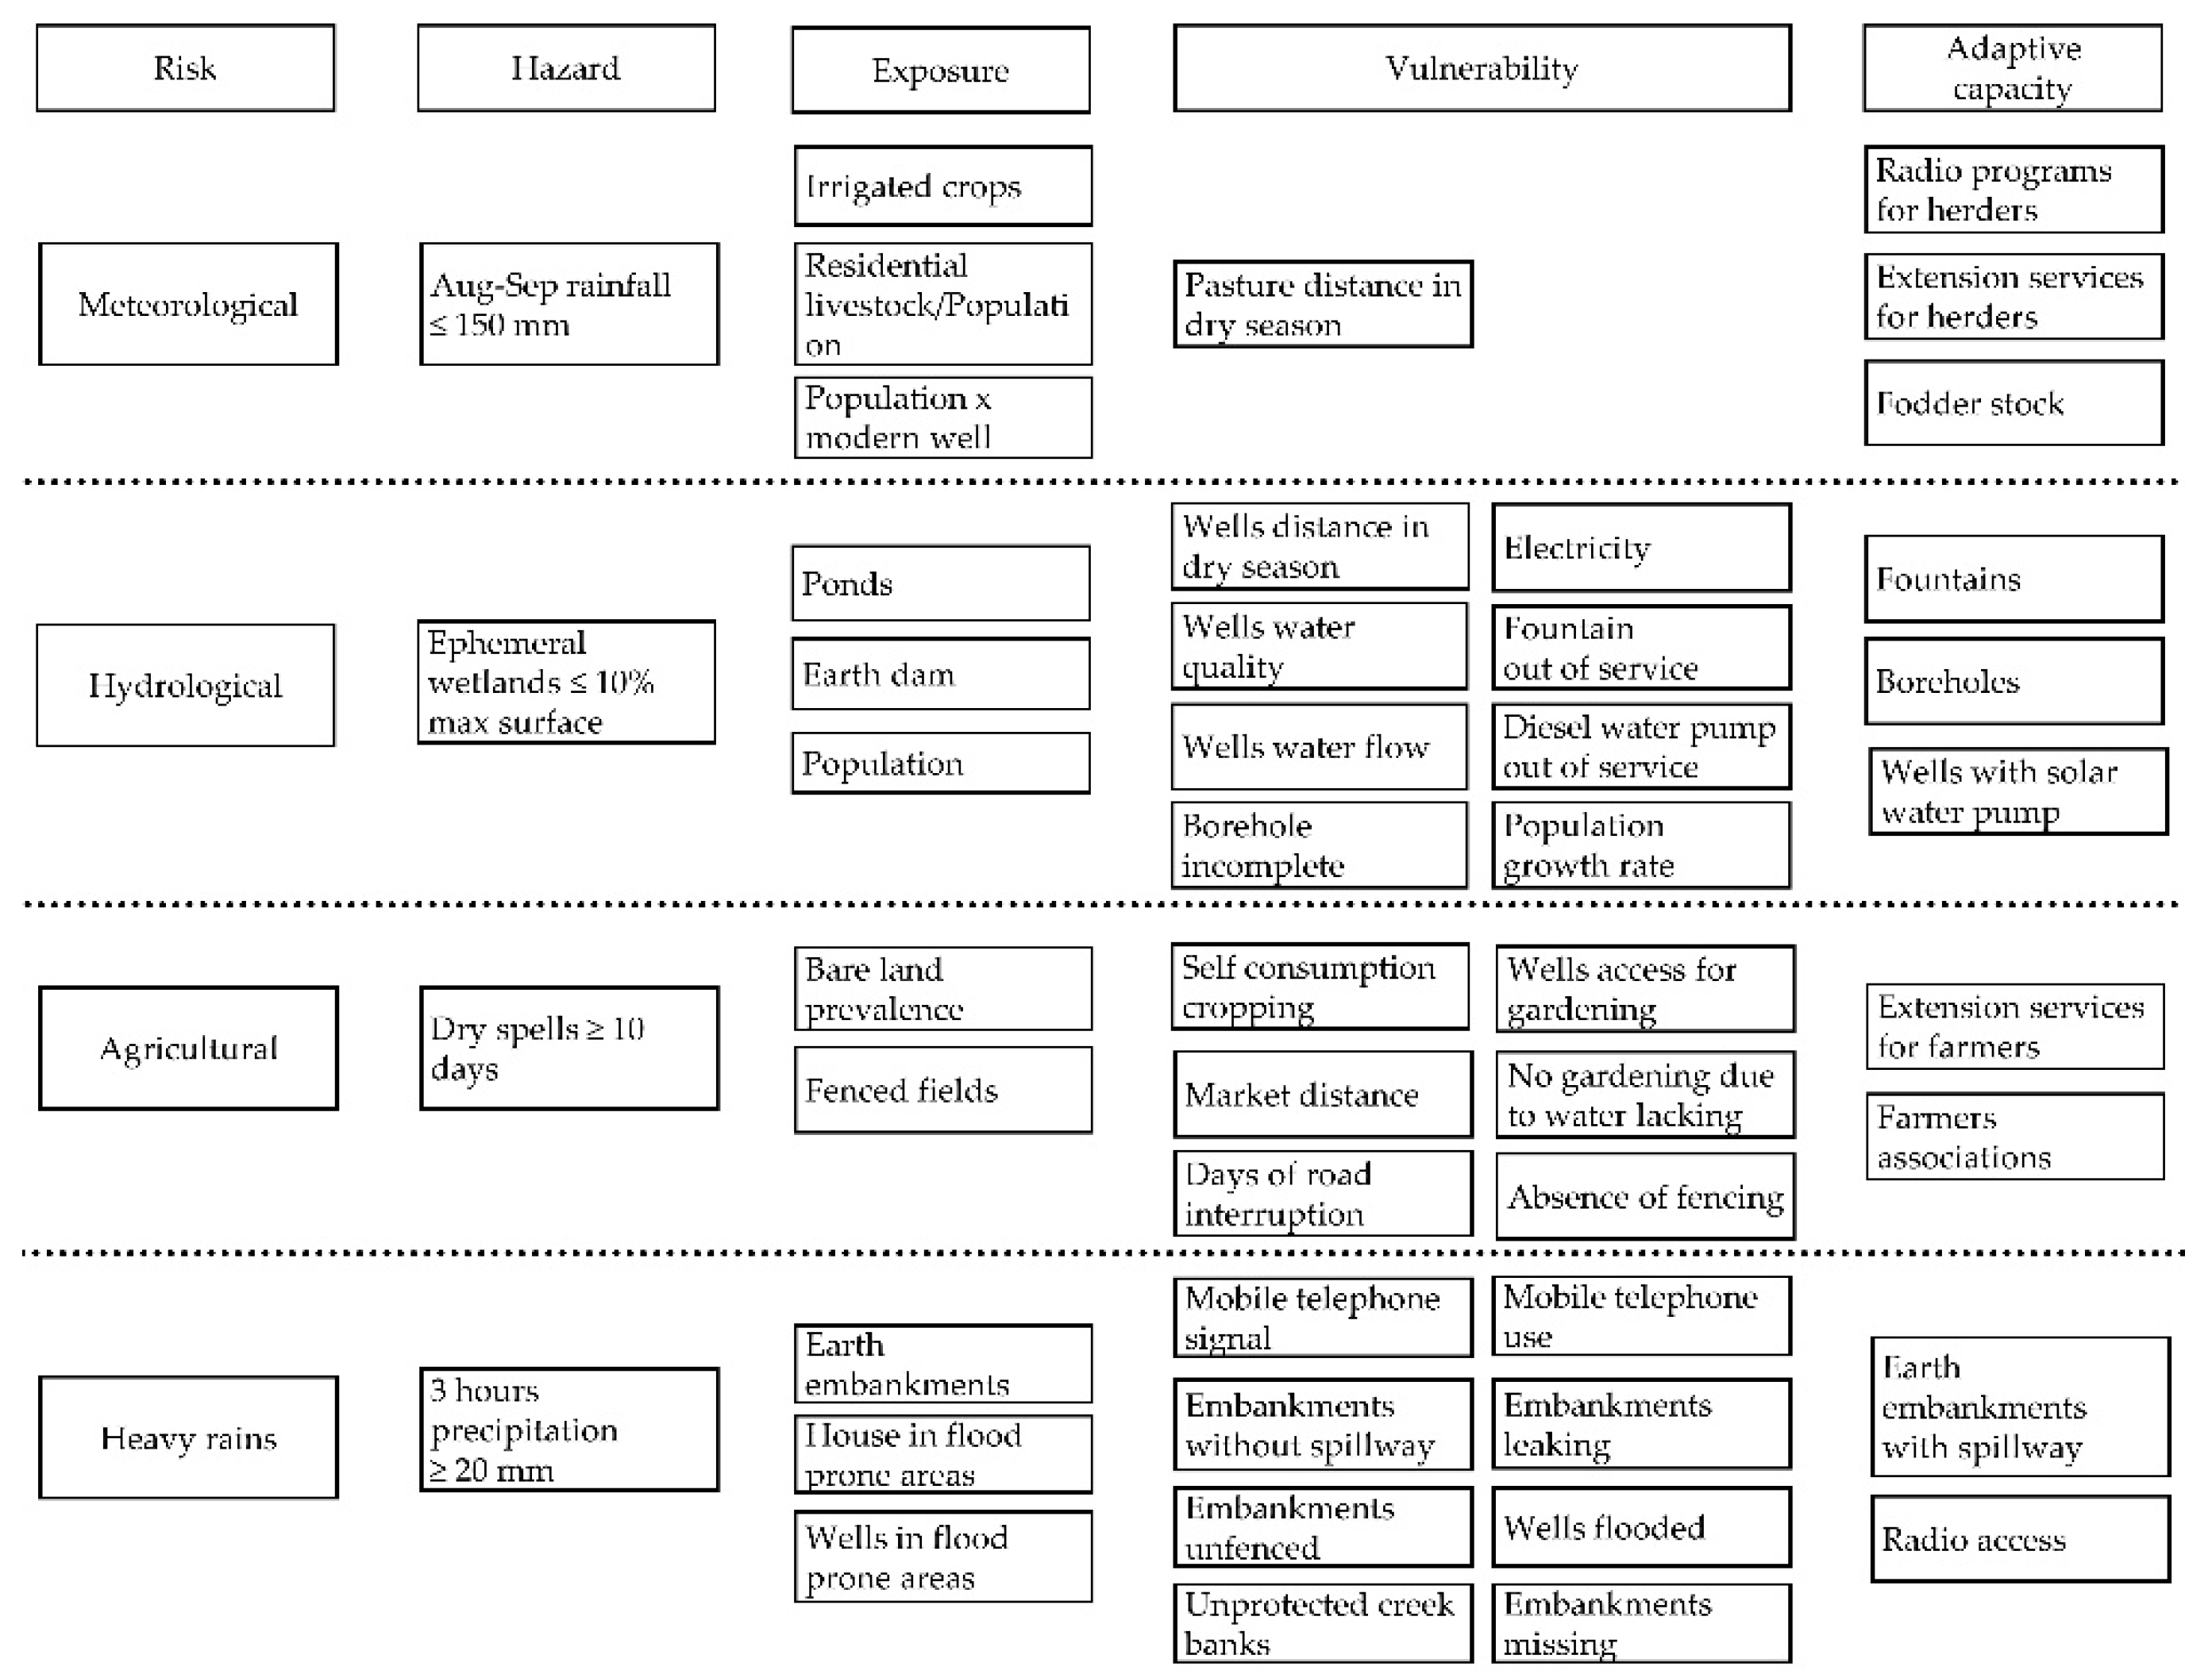
The MHRI adds up the risk indices of the three types of drought and heavy precipitations. The index is made up of 48 indicators that quantitatively scored hazard, exposure, vulnerability, and adaptive capacity. The actual values found for each indicator were normalized within a 0–1 scale. The indicators were then added and normalized in a 0–1 scale for exposure, vulnerability, and adaptive capacity (
Supplementary file 1). Twenty-nine vulnerability and exposure indicators were acquired through a survey in each community (April 2017), fifteen exposure and adaptive capacity indicators were measured during a visit at the end of the dry season (May 2018), and four hazard indicators were acquired from datasets on the daily and three-hourly rainfall and from satellite images (
Figure 4). The survey (April 2017) and the subsequent visit (May 2018) encountered between 12 and 20 inhabitants in each community gathered in two separate groups: Herders (men), and horticulturalists, goat and sheep breeders, and sun-dried tomatoes, milk, yogurt, cheese, dried meat, leather, livestock feed sellers (mainly women). Each group was asked a series of questions (
Supplementary file 2).
The meteorological drought hazard is expressed by the probability of occurrence of rainfall accumulation during the months of July, August, and September of less than 150 mm. That limit was identified based upon the quantity of rain considered the minimum amount necessary to produce plant biomass in an arid Sahelian environment [
41,
42,
43,
44]. Rainfall distribution is derived from the Climate Hazards Group Infra-Red Precipitation with Station (CHIRPS) dataset in the 1981–2018 period. Using these values, we calculated the annual rainfall accumulation and evaluated it on the 38-year historical series (1981–2018) to determine how many years there was a rainfall of less than 150 mm for each community.
The hydrological drought hazard was calculated on six ephemeral wetlands of reference for most of the communities considered. Its determination, due to the absence of localized information, did not use the current indices of hydrological drought [
45]. The analysis was based upon the extension of the ephemeral wetlands as identified by calculating the Normalized Difference Water Index (NDWI) [
46] on the Landsat satellite images. The availability of a limited series of images led us to identify the rainfall accumulation, which determined the years in which the surfaces of the ephemeral wetlands were less extensive. Then, we searched for the frequency of that value in the 1981–2018 rainfall series.
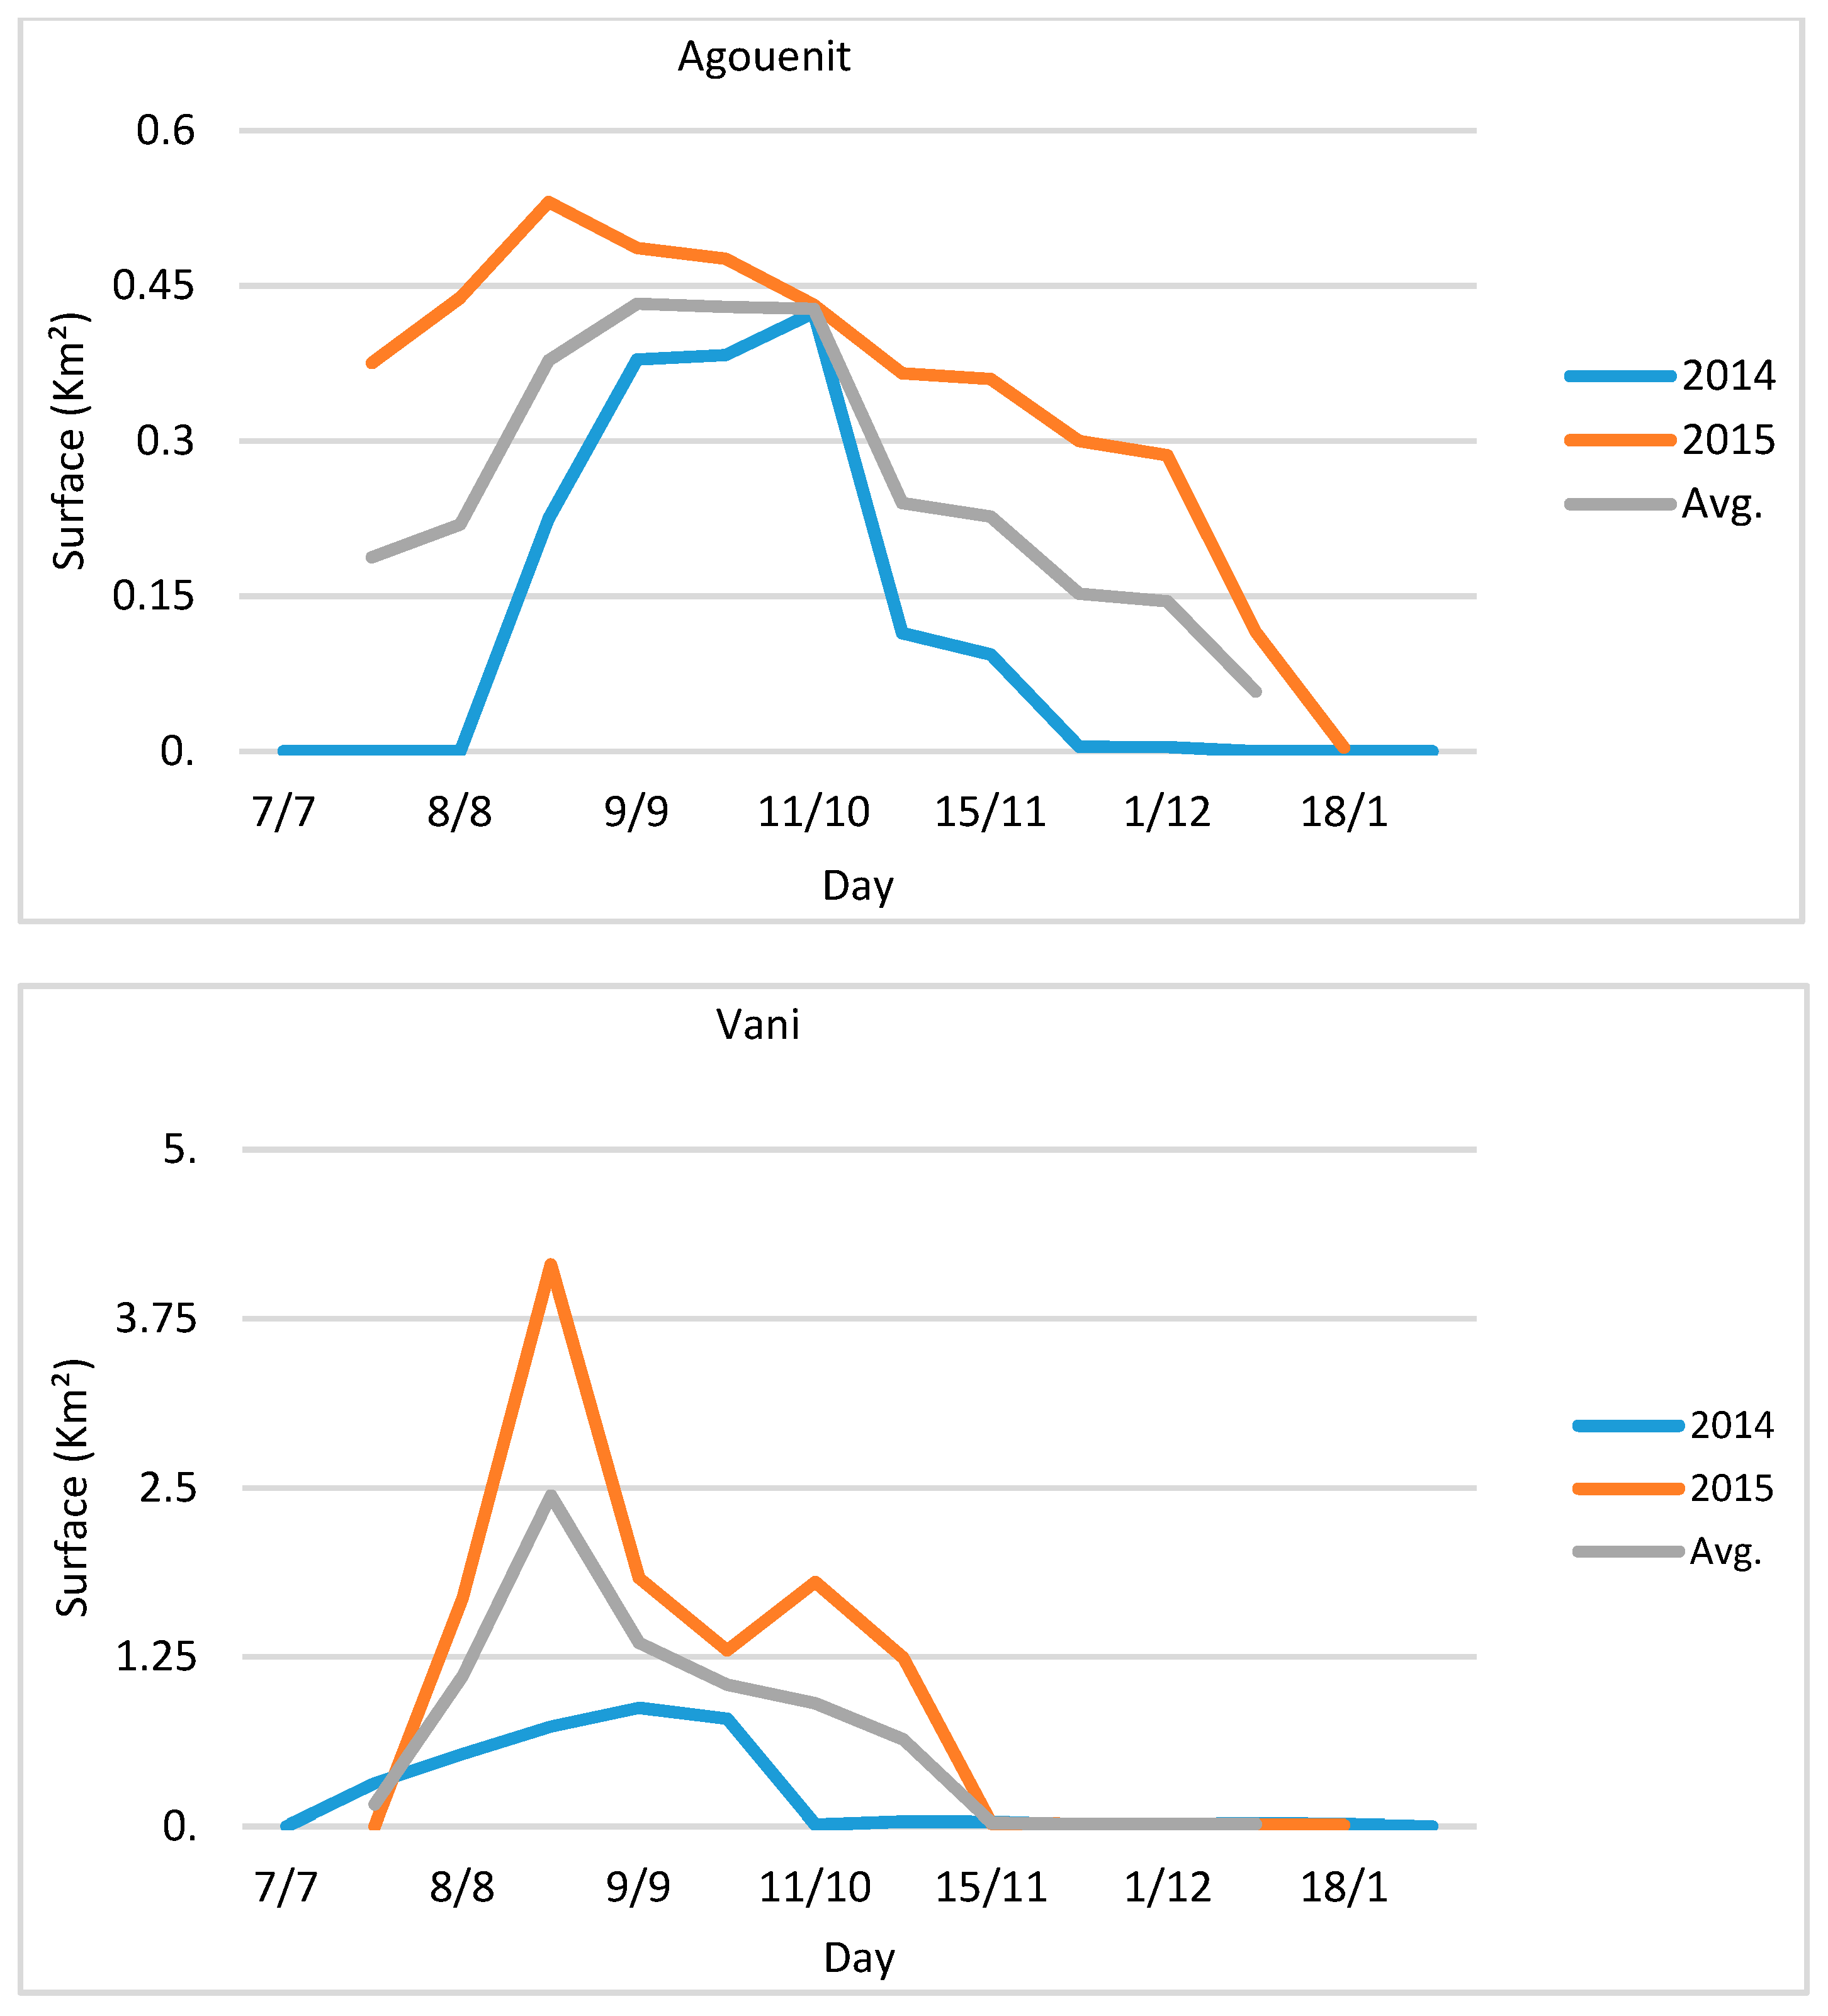
First, the annual surface profile of each ephemeral wetland in a dry year (2014) and in a wet year (2015) was determined. The satellite images were taken on different dates (
t) each year, requiring the construction of the profile by interpolating the surface data with the formula:
The results allowed us to construct the average surface area growth values (
Figure 5).
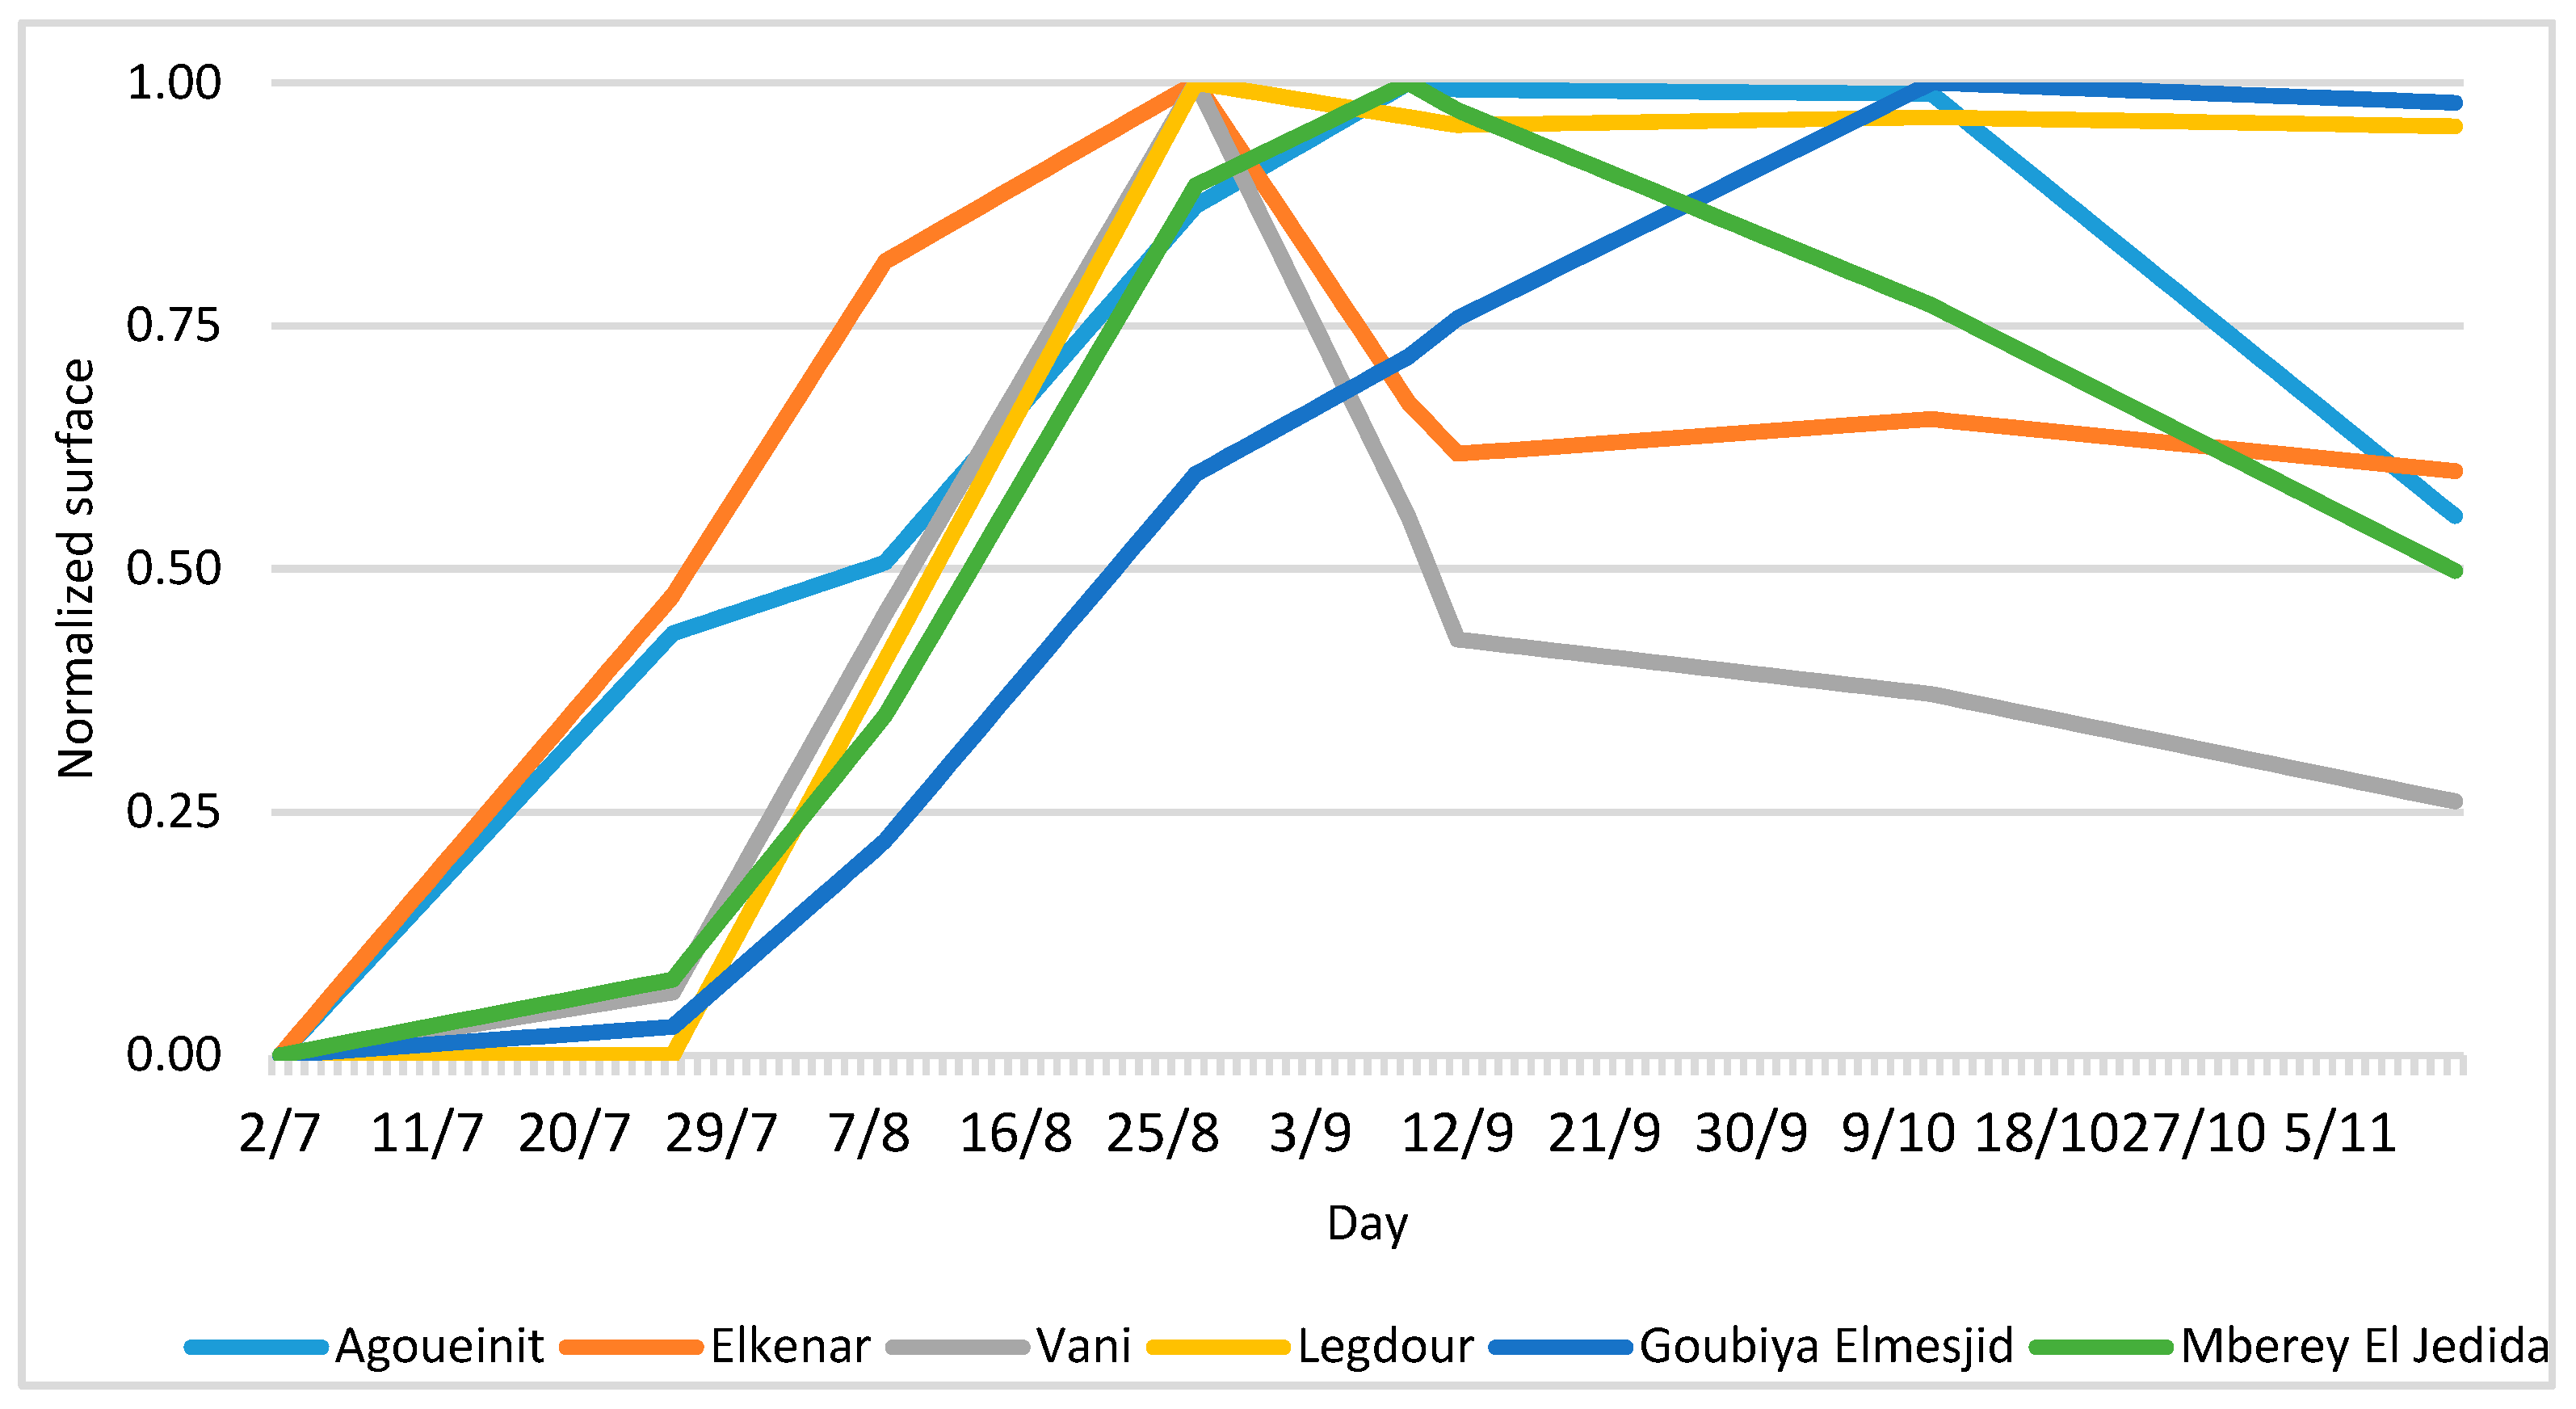
Using those average values, it was possible to calculate a standardized profile of the daily step curves for the July–November period. The standardization was calculated daily, using the maximum value recorded for each ephemeral wetland as a reference (
Figure 6).
With only the 2014 and 2015 years available, we found a rough curve of variation of the surfaces of the ephemeral wetlands. However, with this method, it was possible to discriminate between the various ephemeral wetlands.
Using the CHIRPS estimated rainfall dataset, the rain signal was decomposed at various time intervals from the accumulation of 7, 14, 30, and 60 days before the measurement of the surface of the ephemeral wetland in question, the accumulation of the two central months of the rainy season (August–September), and the entire season. With those values available, we sought to understand which rainfall time interval most influenced the filling of each individual ephemeral wetland, and then analyzed the correlation. The results show a different sensitivity of each individual ephemeral wetland to the August–September precipitations (
Table 2).
The period of rainfall that, on average, most influenced the filling of the ephemeral wetland was the accumulation of rain in the months of August and September. That time interval was used to identify the rainfall that characterized the three years with less surface of the ephemeral wetland. The average value of these three years was used to identify the critical rainfall and, consequently, the probability of occurrence on the entire series (1981–2018).
The adopted method remains more suitable to measure changes in water bodies over time than that proposed by the European Commission Joint Research Centre, which reports the status of the individual pixels that make up the water bodies without, however, reporting the precise date of which they are observed [
47].
The agricultural drought hazard was measured with the probability of occurrence of dry spells of at least 10 consecutive days during the months of July, August, and September, ascertained using the CHIRPS dataset for the period 1981–2018 for each community. The choice of this spell length reflected the need to consider a threshold that could generate a negative impact on rain-fed crops in this region, which is strictly dependent on the specific crops’ resistance to drought stress [
48].
The heavy precipitation hazard is expressed by the probability of occurrence of three-hourly rainfalls higher than 20 mm ascertained using the Tropical Rainfall Measuring Mission (TRMM) dataset for the 1991–2014 period at each ephemeral wetland.
The exposure to meteorological drought is given by the presence of irrigated crops, the number of inhabitants per well, and tropical livestock units [
49] which remain in each community in the dry season: The higher the number, the more the community is exposed to drought. The exposure to hydrological drought is represented by the number of ponds, earth dams, and inhabitants of each community. As for exposure to agricultural drought, this is given by the presence of horticultural activities protected by barbed wire fencing against the intrusion of stray cattle and the presence of pasture and arable surfaces. A proxy indicator is the share of bare land in the territory of each community: The lower it is, the greater the exposure. The exposure to heavy precipitations is given by the number of earth embankments and by the wells and houses in flood prone areas, which could become inaccessible or be flooded.
The vulnerability to meteorological drought is given by the distance of the pastures from the village in the dry season. The vulnerability to hydrological drought is expressed by distant wells with poor water flow and quality and by the lack of boreholes, functioning fountains, or by broken diesel water pumps. It is also expressed by the population growth rate of the community in question, which increases the demand for water. The vulnerability to agricultural drought is still linked to the availability and accessibility of wells for irrigation, the practice of cropping for self-consumption only, the rate of unfenced lots, the distance to the market, and the number of days of road interruption. The vulnerability to heavy precipitations is expressed by the possibility of receiving an early warning by telephone (therefore, the coverage of the area with a mobile phone signal), by the lack of protection of the earth embankments from the crossing of livestock, by the absence of spillways and locks, which reduce the pressure of flash floods on the hydraulic works, and by the presence of creeks without bank protection.
The adaptive capacity is of three types [
50]: Capacity to anticipate risk, to respond to risk, and to recover and to change. For meteorological drought, the existence of radio programs aimed at farmers who report where vaccines and vaccination parks for livestock (anticipate), pastures, water, and fodder banks (recover) are available is paramount. For hydrological drought, the existence of boreholes, fountains or mini aqueducts (respond) which cover the demand for water by drawing from deep aquifers, especially if powered by solar water pumps, which have lower operating costs than diesel water pumps, is important.
Agricultural drought can be overcome if there are extension services (anticipate) and farmers’ associations (recover). For heavy precipitations, radio access counts to receive early warning (anticipate). Spillways and locks in the earth embankments allow the pressure of flash floods on the earth embankments to be regulated, preserving them from collapse (respond).
In order to compare the different hazards, we took a series of precautions [
39]. Each indicator and each determinant has the same significance. The probability of occurrence of each hydro-climatic hazard was calculated observing the same timeframe (1981–2018), except for heavy precipitations (1998–2014).
For each individual risk, the value of every individual determinant ranges between 0 and 1, irrespective of the number of indicators that describe it. Each indicator has the same significance. The MHRI was obtained by adding the values of the four single risks. Its value can theoretically vary from 0 to 8. The absolute interval between the maximum and minimum value was divided into four equal parts to indicate low (0–2), moderate (2–4), high (4–6), and severe (6–8) risk. In reality, the highest value can never be reached because the hazard is always less than 1 and all the communities have risk reduction actions in place that bring the value of the adaptive capacity higher than 0.
The calculation allowed to identify which risk, determinant, and indicators have the greatest effect on the MHRI. The indicators that present the highest value (exposure, vulnerability) or lowest value (adaptive capacity) oriented the identification of risk treatment actions among the best practices developed in the Hodh Chargui region. Each of these were then assessed with the communities, considering the expected impact on sustainable rural development, the successful use in the region, the community participation in construction works, the maintenance requirements, the maintenance local capacities, and the community acceptance. One point was attributed to each criteria. The resulting ranking identified priority actions.
3. Results
3.1. Hazard
3.1.1. Meteorological Drought
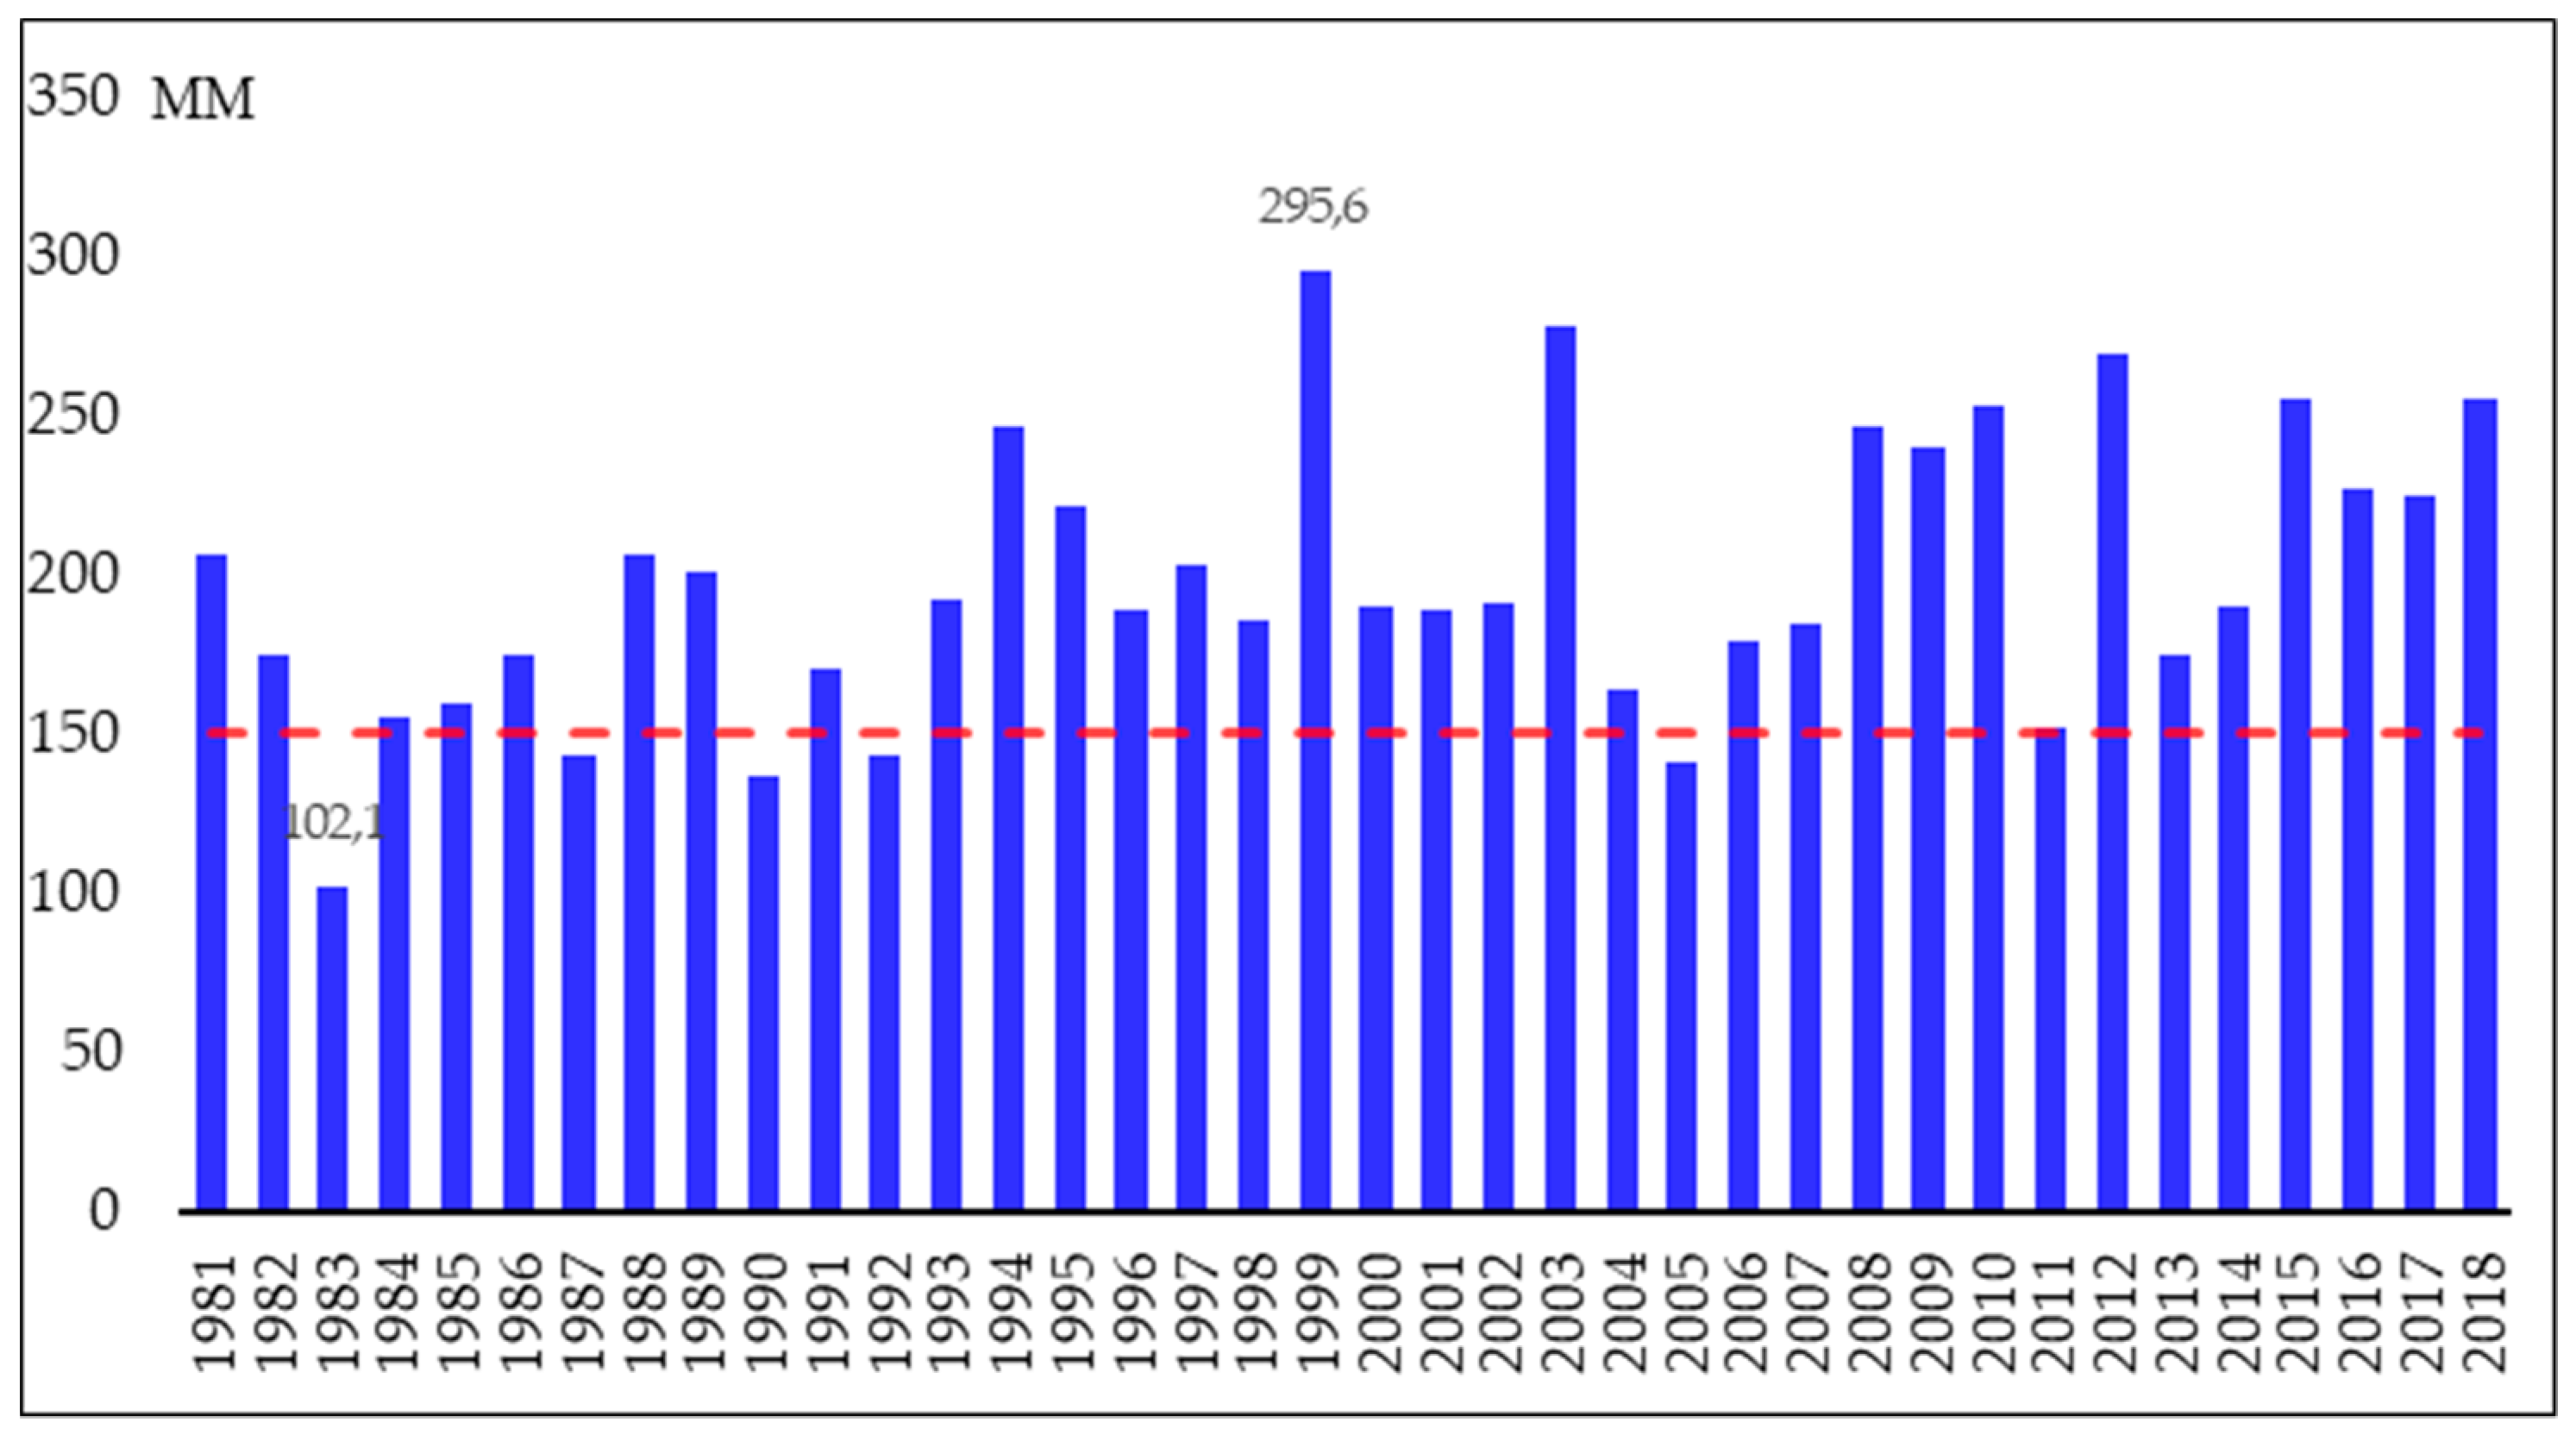
It is somewhat challenging to define meteorological drought in Hodh Chargui. The scarcity of observed data does not allow us to understand the quantity of precipitation that can generate a negative influence on the production system. Furthermore, the production systems are naturally resistant to extreme drought conditions. Literature identified 100–150 mm of the annual rainfall as the threshold within which plant species that are most resistant to drought can produce biomass even in extreme conditions [
41,
42,
43,
44]. For this work, we decided to use the 150 mm threshold for meteorological drought. Using the CHIRPS series, the rain profile of the region was extracted. In the last 38 years, the Hodh Chargui had its driest period during the 1980s, with a minimum of 102 mm in 1983. In the last 13 years, there has been a trend toward the recovery of rainfall, with values that never dropped below 150 mm per year commencing from 2006 (
Figure 7).
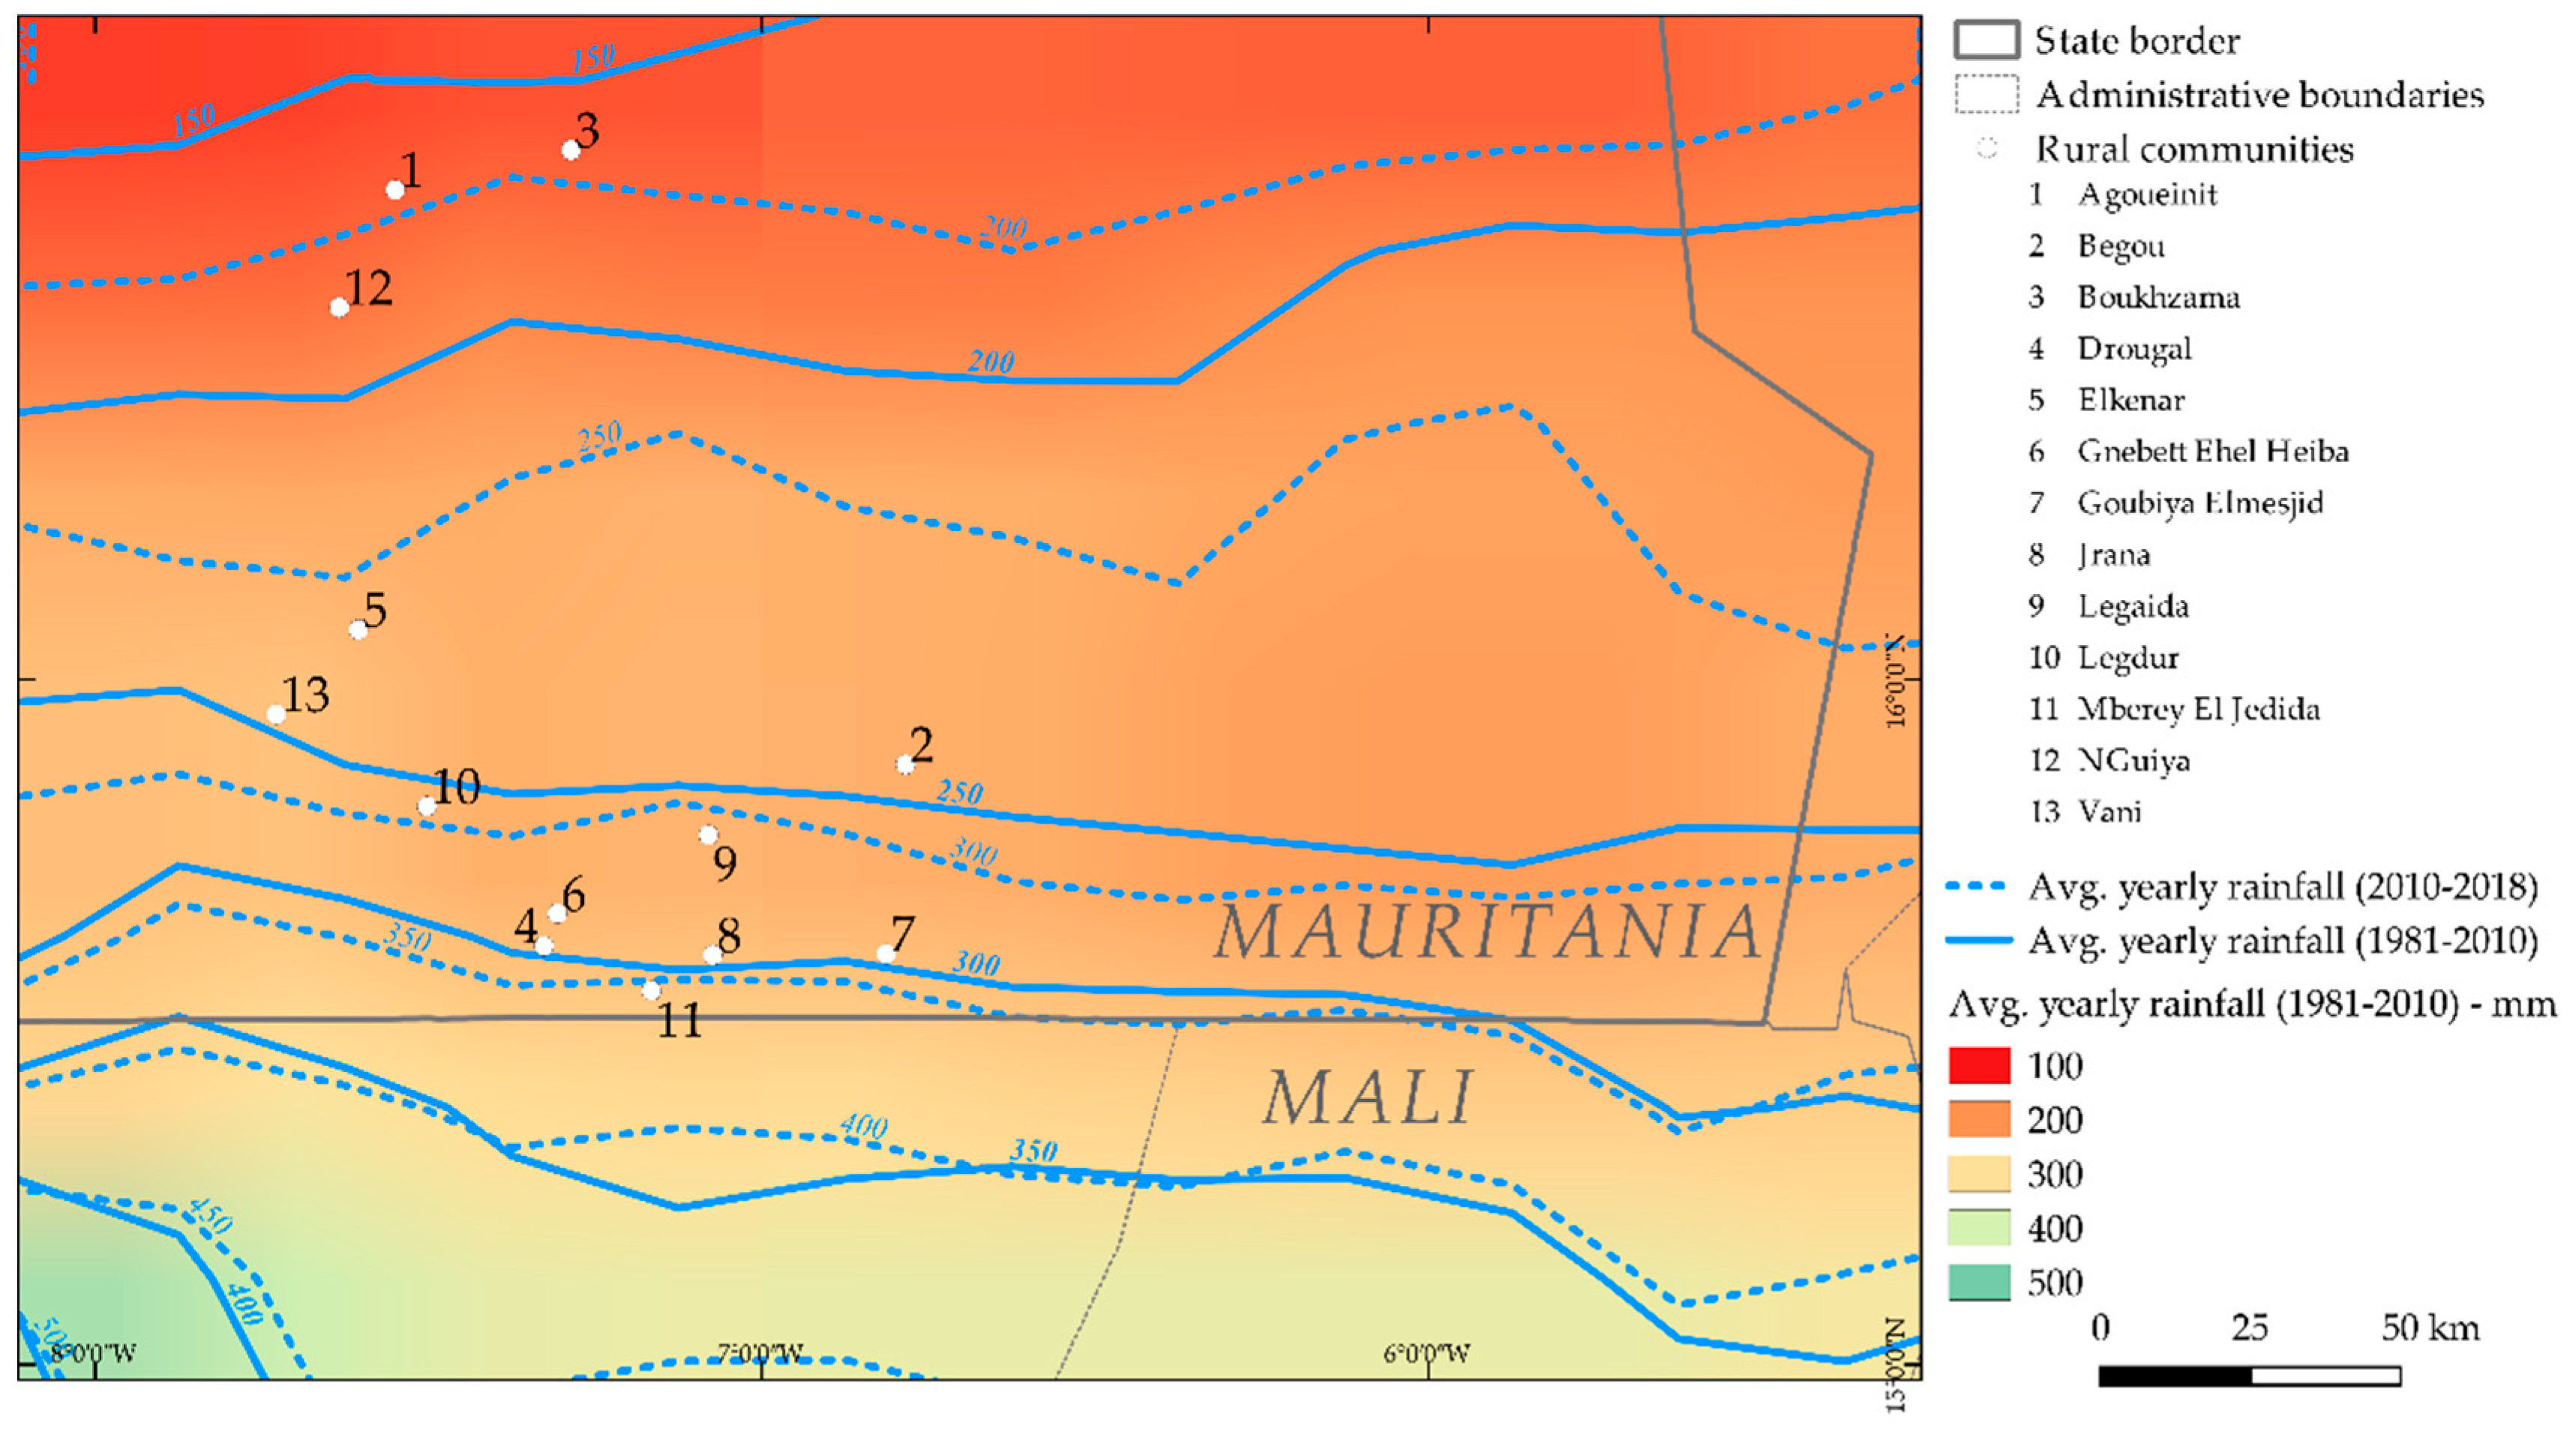
The rainfall distribution follows a south-north gradient starting from 300 to 150 mm/year. Nevertheless, during the 2010–2018 period, there was a recover in rainfall of 30–50 mm/year throughout the region (
Figure 8).
Boukahzama 1, Agoueinit, and NGuiya are the northernmost communities and are most likely to have rainfall of less than 150 mm. Conversely, the five communities on the border with Mali (Drougal, Gnebett Ehel Heiba, Jrana, Mberey El Jedida, and Goubya Elmesjid) have a very low probability of meteorological drought (
Table 3).
3.1.2. Hydrological Drought
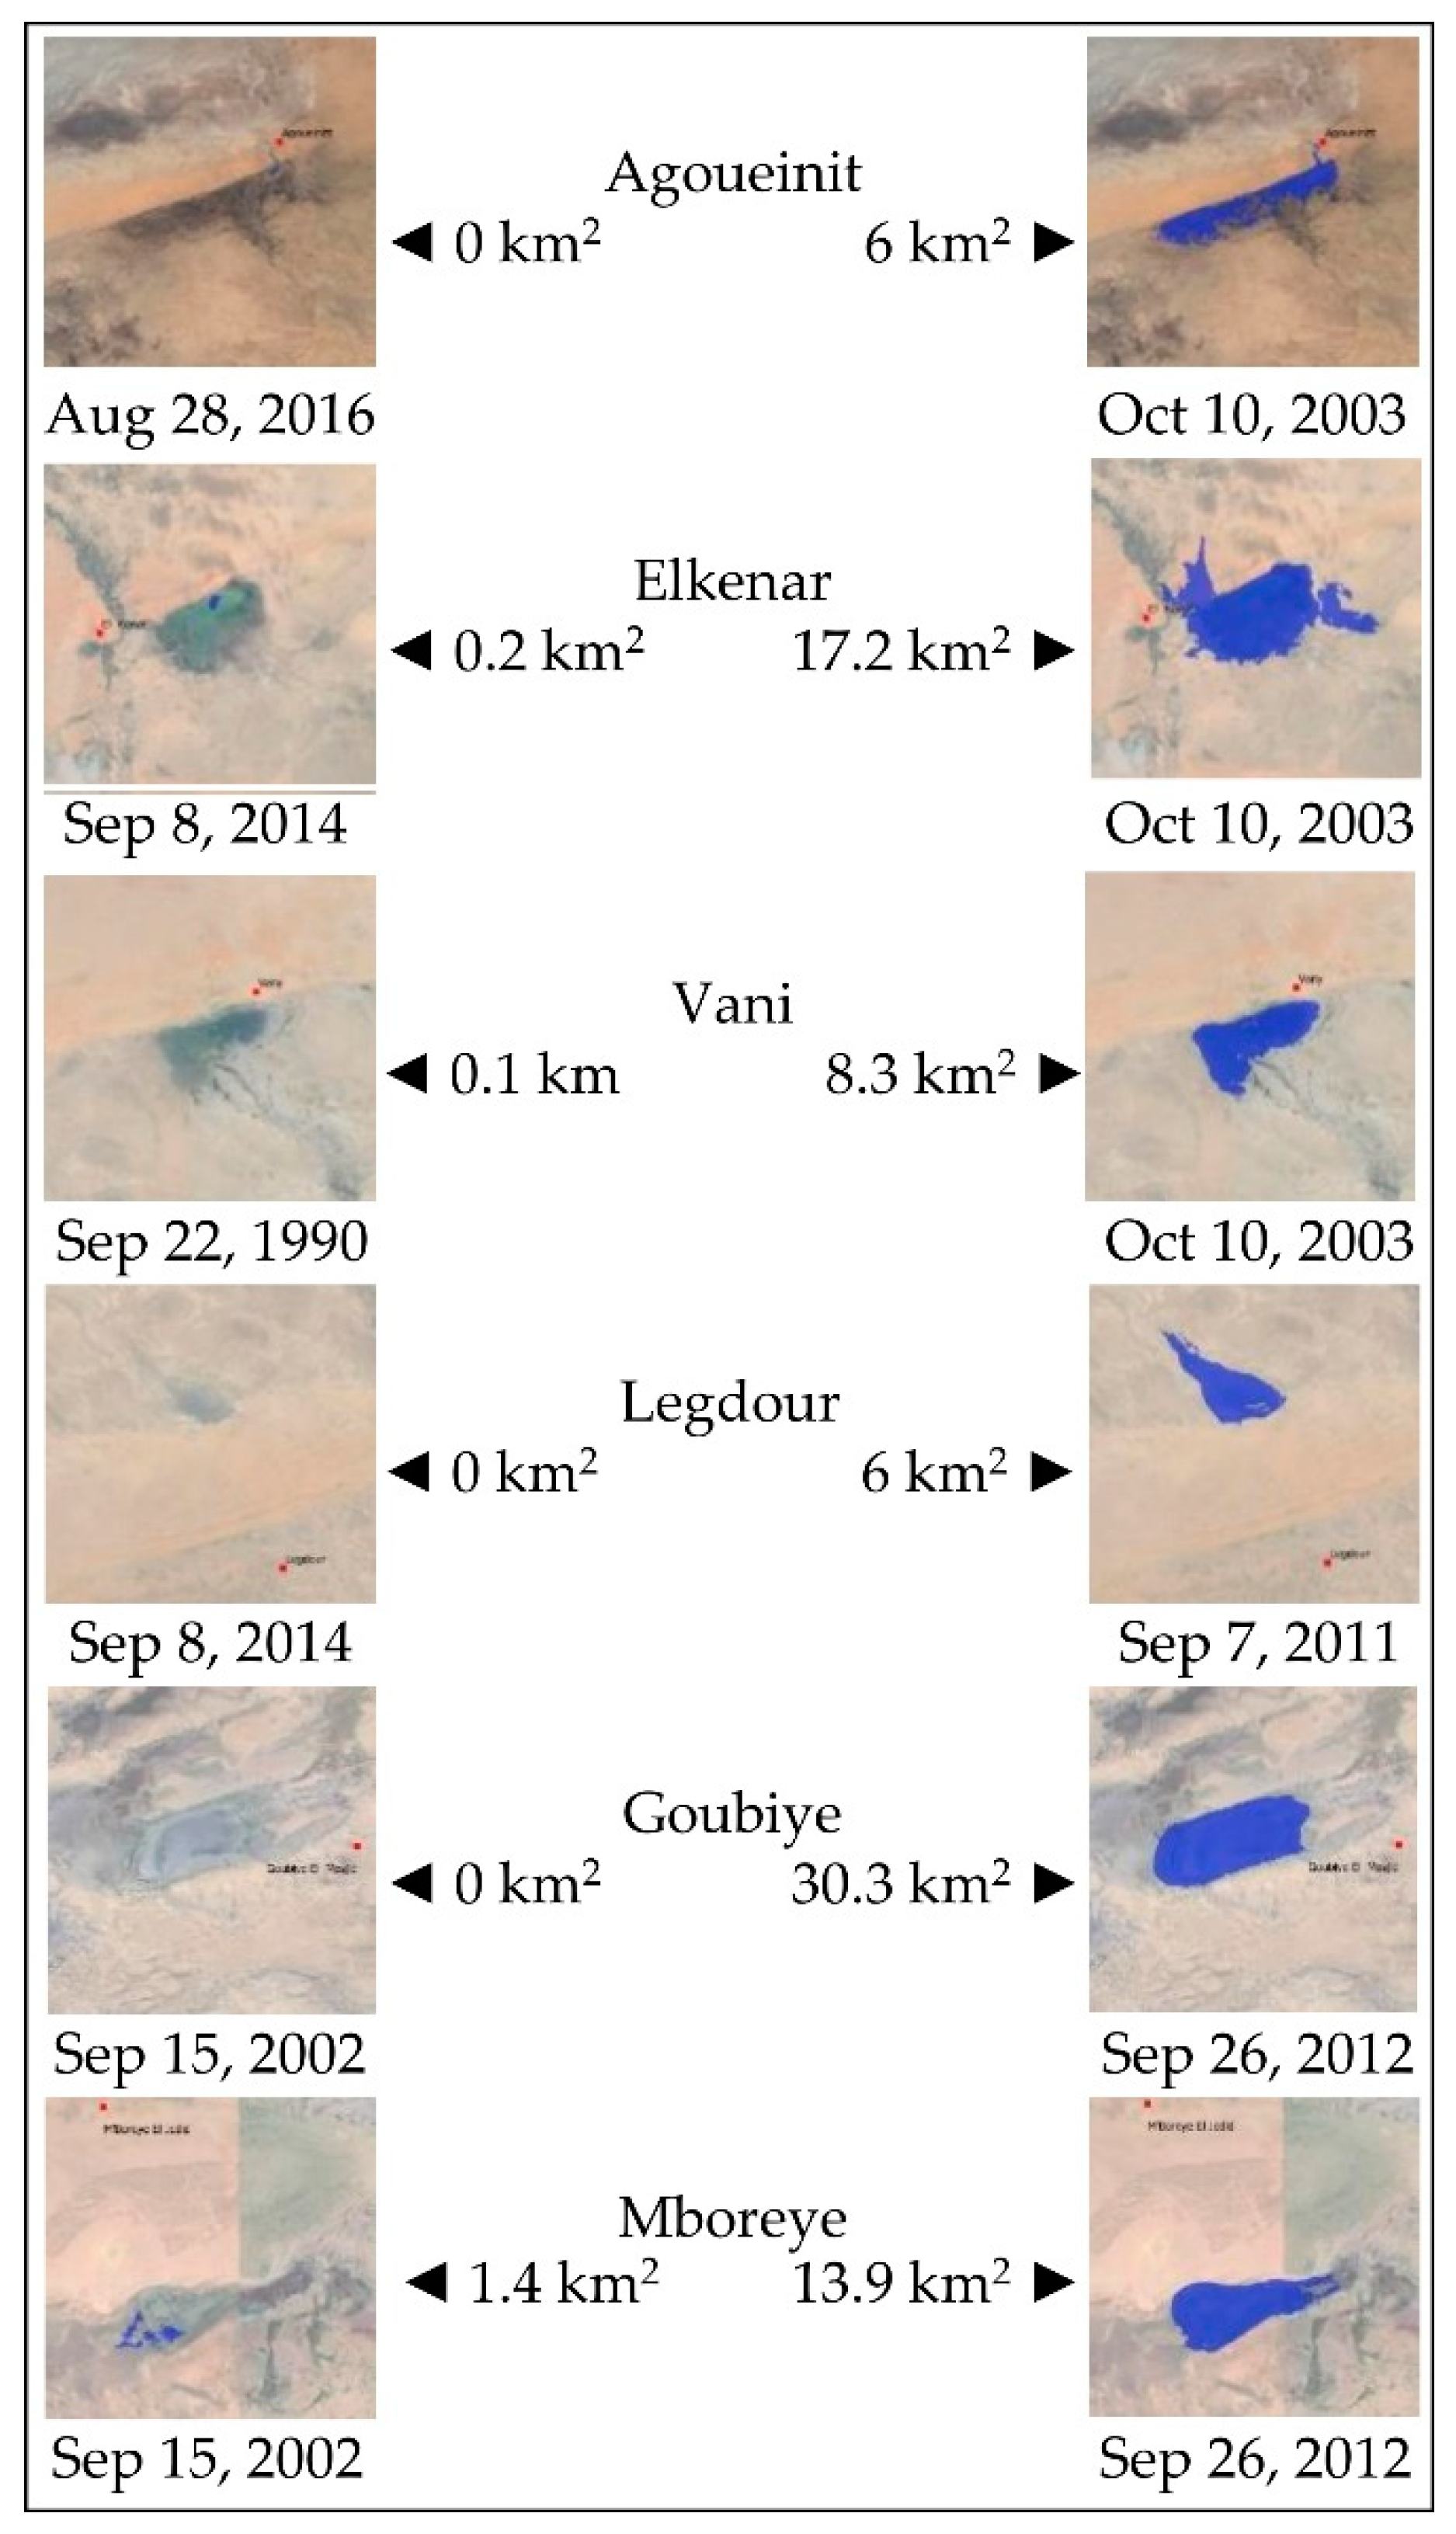
Six ephemeral wetlands constitute the surface water resources of reference for the investigated communities. These are semi-permanent and shallow water bodies of maximum extension between 6 and 30 km
2. All are characterized by weak depth. Despite this, they are a fundamental resource for human and pastoral water supplies, for fishery resources, and in the case of Agoueinit, for recession agriculture. The flood regime is not the same. It is rare for a dry or wet year to affect all six ephemeral wetlands. In 2003, the ephemeral wetlands reached, in total, 78% of the maximum surface, followed by 2011 (70%), 2009 (57%), and 2012 (55%). In 1987, five ephemeral wetlands out of six had a surface reduced to less than 10% of the maximum observed extension. In 2005, it was so dry that the average surface of the ephemeral wetlands dropped to 1% of the maximum average. In 2014, a hydrological drought was experienced by half of the ephemeral wetlands, while two out of six experienced a hydrological drought in 2016. The two southernmost ephemeral wetlands have not suffered drought in the last eight years, while the northernmost has been dry for six years out of eight, and the center-south has been dry for one or two years out of eight (
Figure 9).
According to the described methodology, which attributes the extension of six ephemeral wetlands to rainfall, it is possible to establish the drought probability on the same period used to estimate the meteorological drought probability. It follows that the ephemeral wetland of Agoueinit is particularly prone to drying out compared to all the others (
Table 4).
3.1.3. Agricultural Drought
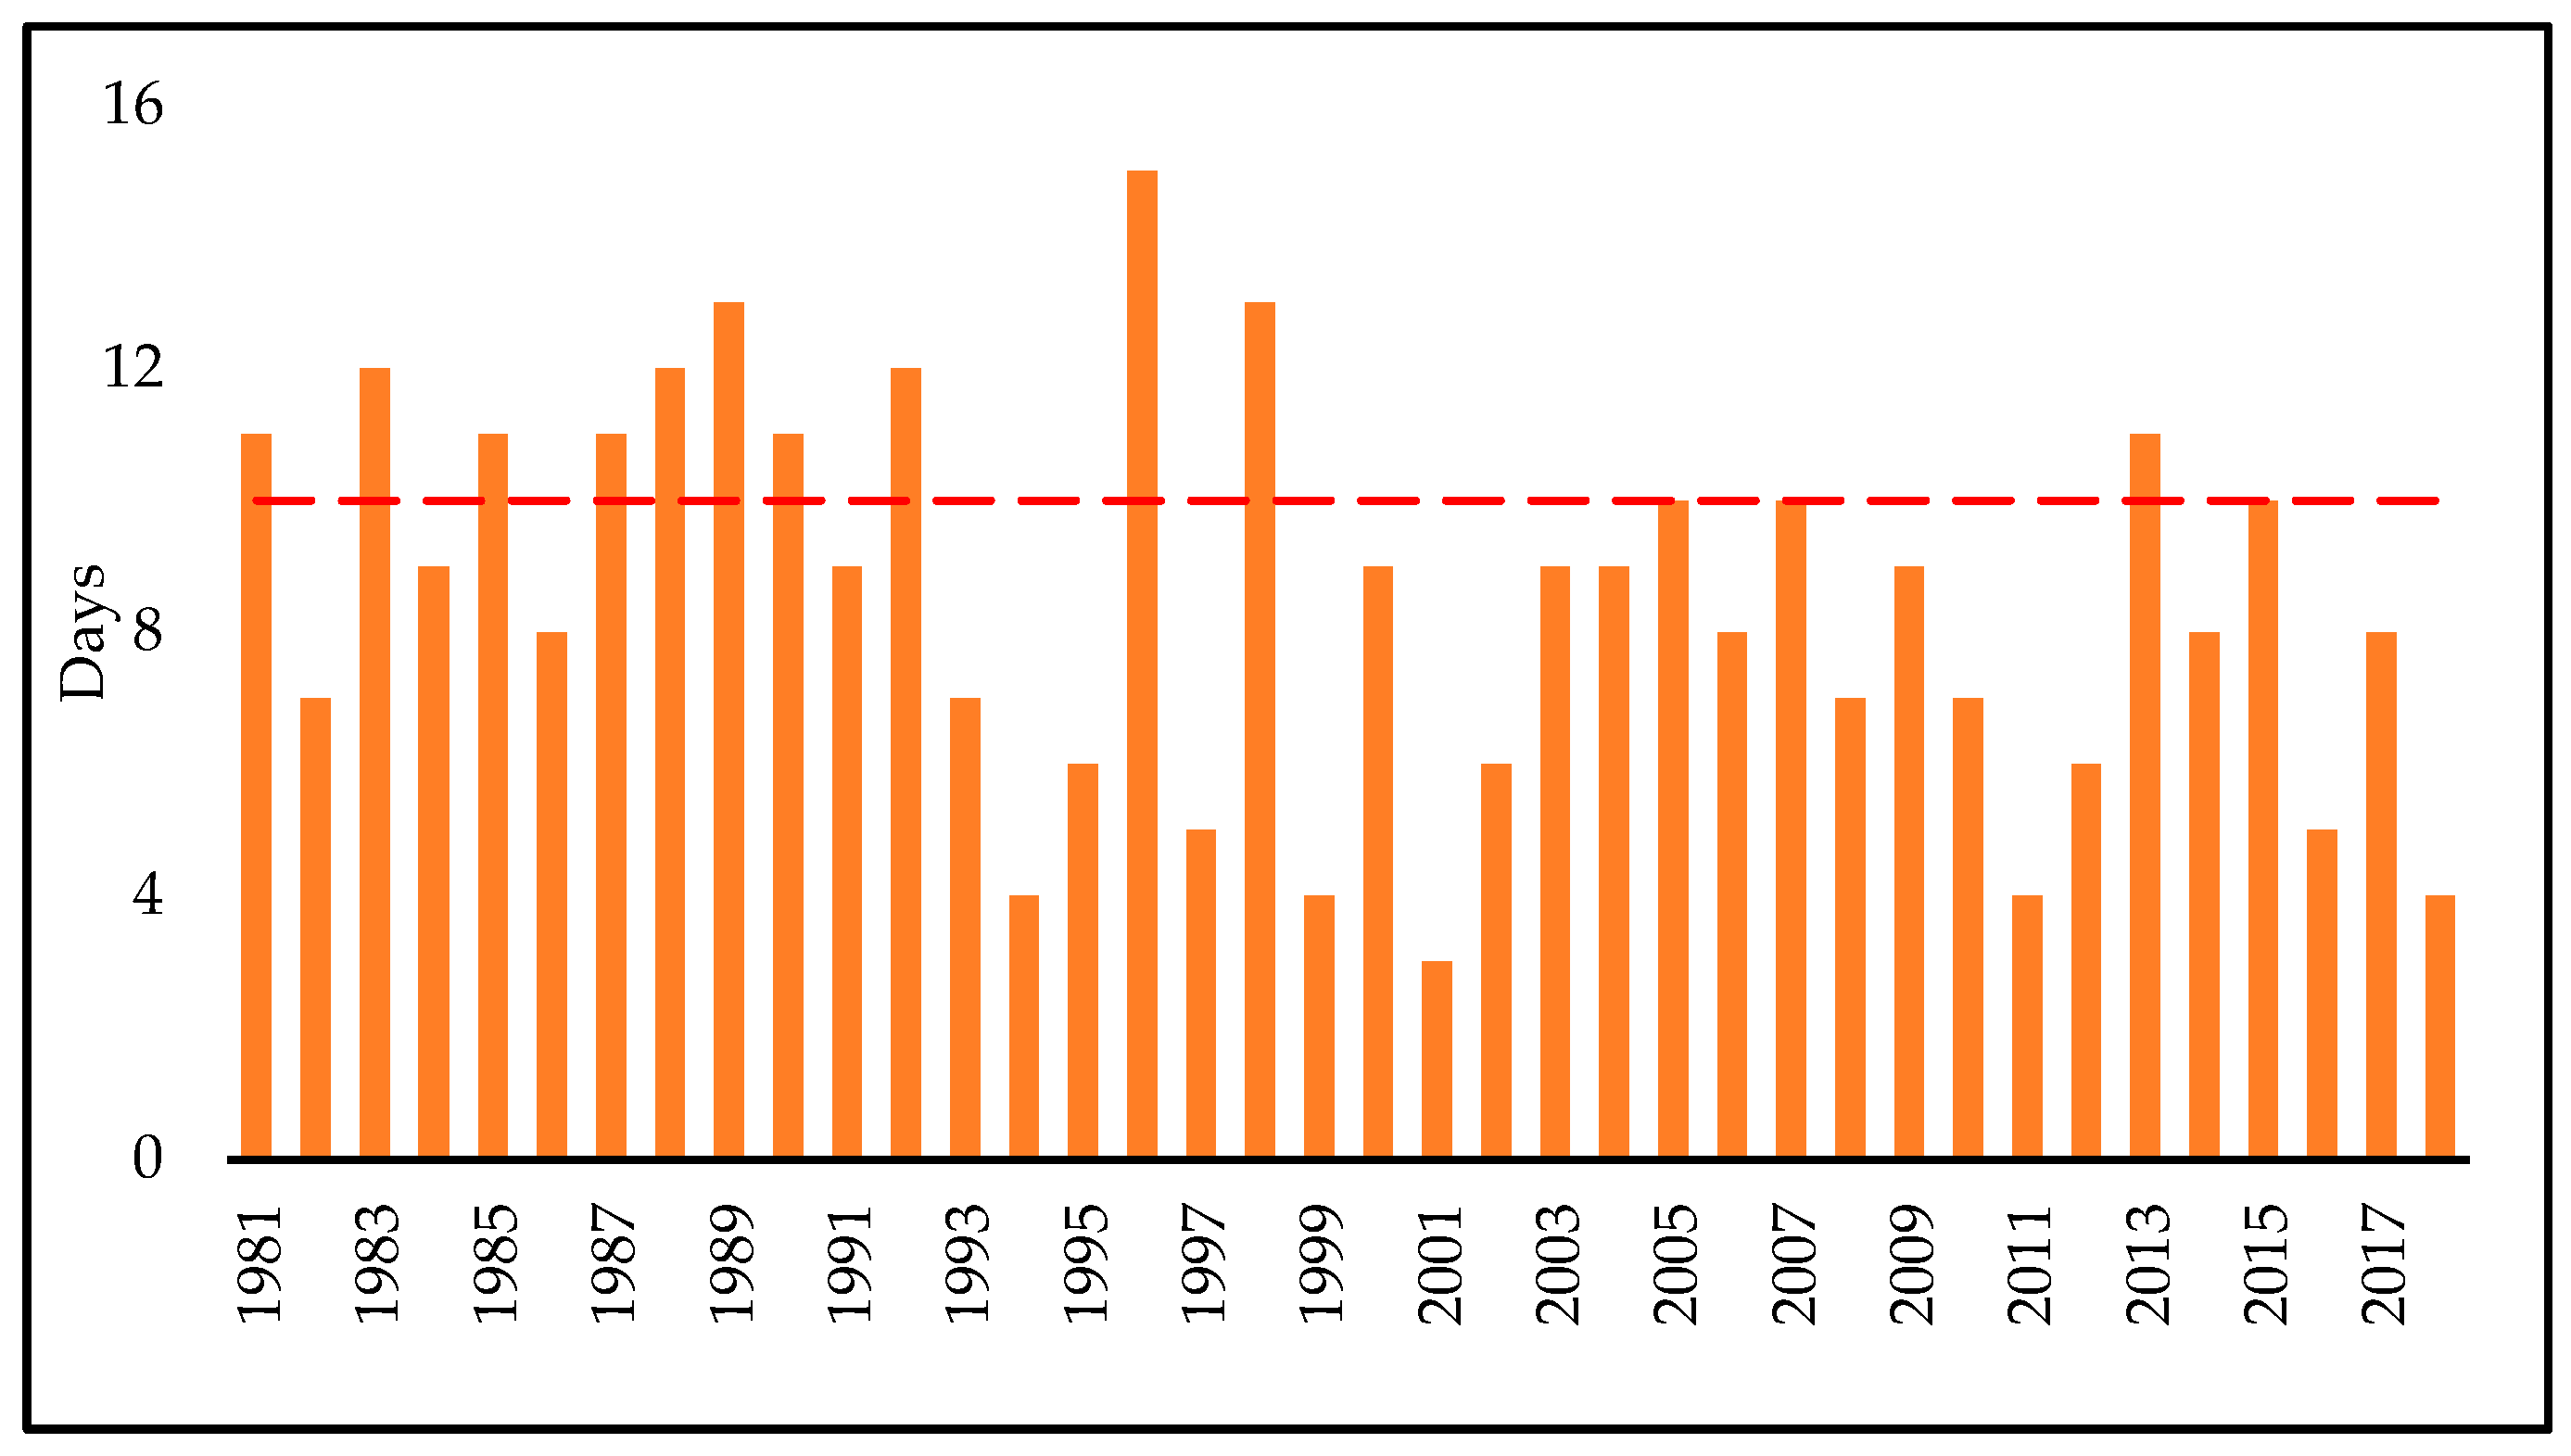
Agricultural drought occurs when drought affects agricultural and pastoral production. The 13 communities in question cultivate in rain-fed conditions, in the form of recession agriculture, and of irrigated gardens. The first type of agriculture is influenced by the rainfall distribution. Pastoral production, which plays a major role in the region’s economy, is influenced by the presence of pastures for transhumant herds during the wet season. Biomass production is therefore relegated to spontaneous herbaceous and shrub species, which are naturally very resistant to water stress conditions. However, lengthy dry spells during the wet season can reduce the availability of fodder. Using the CHIRPS dataset, the daily series of the different communities was extracted and the maximum length of the dry spell during the season was assessed (
Figure 10).
From 2006 onward, rainfall is favorable, although it is always below 300 mm/year. However, there are three years with dry spells equal to or greater than ten days. The frequency of dry spells follows a north-south distribution. Dry spells are more frequent in the northern communities of Boukhzama 1, Agoueinit, and NGuiya, and are less frequent in the southern communities of Drougal, Gnebett Ehel Heiba, Goubya Elmesjid, Jrana, and Mberey El Jedida (
Table 5).
3.1.4. Heavy Precipitations
It is difficult to define heavy precipitation in Hodh Chargui. The data are scarce and only one study has allowed for the definition of a threshold of extreme rainfall (37 mm/day) [
51]. That value does not necessarily involve the generation of conditions favorable to flash floods. Those phenomena are linked to high rainfall intensity in periods of less than one day. As a consequence, the frequency of three-hourly rainfall higher than 20 mm was verified by analyzing the extractions of the three-hourly values from the Tropical Rainfall Measuring Mission (TRMM) dataset in the 1991–2014 period for each of the 13 communities. It follows that Boukhzama 1, Drougal, and Gnebett Ehel Heiba exceed this threshold more frequently than Elkenar, Jrana, and Mberey El Jedida. In this case, there is no decreasing distribution of the frequency of the hazard as it proceeds from north to south (
Table 6).
3.2. Exposure
The exposure to different hazards is represented by 11 indicators: Three for meteorological drought (irrigated crops, residential livestock, and number of inhabitants per well), three for hydrological drought (ponds, earth dams, and population), two for agricultural drought (bare land rate, fenced fields) and three for heavy rains (earth embankments, houses, and wells in flood prone area). The highest values of exposure to meteorological, hydrological, and agricultural drought and to heavy rains are reached respectively in Agoueinit, Vani, Agoueinit, and Boukhzama 1. The exposure to all hazards shows that Agoueinit and Legdur have the highest values and Mberey El Jedida has the lowest value.
3.3. Vulnerability
The vulnerability to the different hazards is represented by 23 indicators: One for meteorological drought (distance to pasture in dry season), eight for hydrological drought (electricity access, distance to wells, borehole not working, diesel water pump broken down, irregularly functioning fountain, wells water flow and quality, population growth rate), six for agricultural drought (wells access for gardening, absence of gardening due to lack of water, gardens fencing, distance to market, cropping for self-consumption, road interruptions), eight for heavy rains (mobile telephone signal and use, earth embankment absence, leaking, lacking spillway, fence, wells flooded, unprotected creek banks). The highest values of vulnerability to meteorological drought are reached by Legaida, while those to hydrological drought are reached by Vani, those to agricultural drought by Goubya Elmejid, and those to heavy rains by Legdur. The vulnerability to all hazards shows that Legaida and Legdur have the highest values, while Agoueinit and Vani have the lowest values.
3.4. Adaptive Capacity
The adaptive capacity to the different hazards is represented by 10 indicators: Three for the meteorological drought (herders/farmers radio programs, extension services for herders, fodder stock), two for the hydrological drought (fountain and boreholes), two for the agricultural drought (solar water pumps and small household farmer’s associations) and two for heavy rains (radio access, and earth embankments provided with spillway). The highest values of adaptation to meteorological drought are reached by Elkenar and NGuiya, those to hydrological drought by Agouenit, those of adaptive capacity to agricultural drought by Boukhzama 1, and those of adaptive capacity to heavy rains by Drougal, Elkenar, Gnebett Ehel Heiba, Goubya Elmesjid, Legaida, Legdur, Nguiya, and Vani. The adaptive capacity to all hazards is highest in Goubya Elmesjid and lowest in Agoueinit, Begou and Legaida.
3.5. Multi-Hazard Risk Level
The interval between the maximum and minimum value of the multi-hazard risk index (MHRI) was split into four parts of the same breadth to represent the severe (0.83–1.09), high (0.56–0.82), moderate (0.28–0.55), and low risk (0–0.27). It follows that NGuiya, Agueinit, and Begou are at severe risk, Legdur, Boukhzama 1 and Legaida are at high risk, Gnebett Ehel Heiba, Jrana, and Elkenar are at moderate risk, and all other communities are at low risk (
Figure 11,
Table 7). Therefore, it can be said that the most northern communities tend to have the highest risk levels and the five southernmost communities tend to have a low to moderate risk level. The value of the risk index was substantially determined by that of agricultural drought and heavy rains (
Table 7).
3.6. The Use of the Multi-Hazard Risk Index for the Identification of Risk Treatment Actions
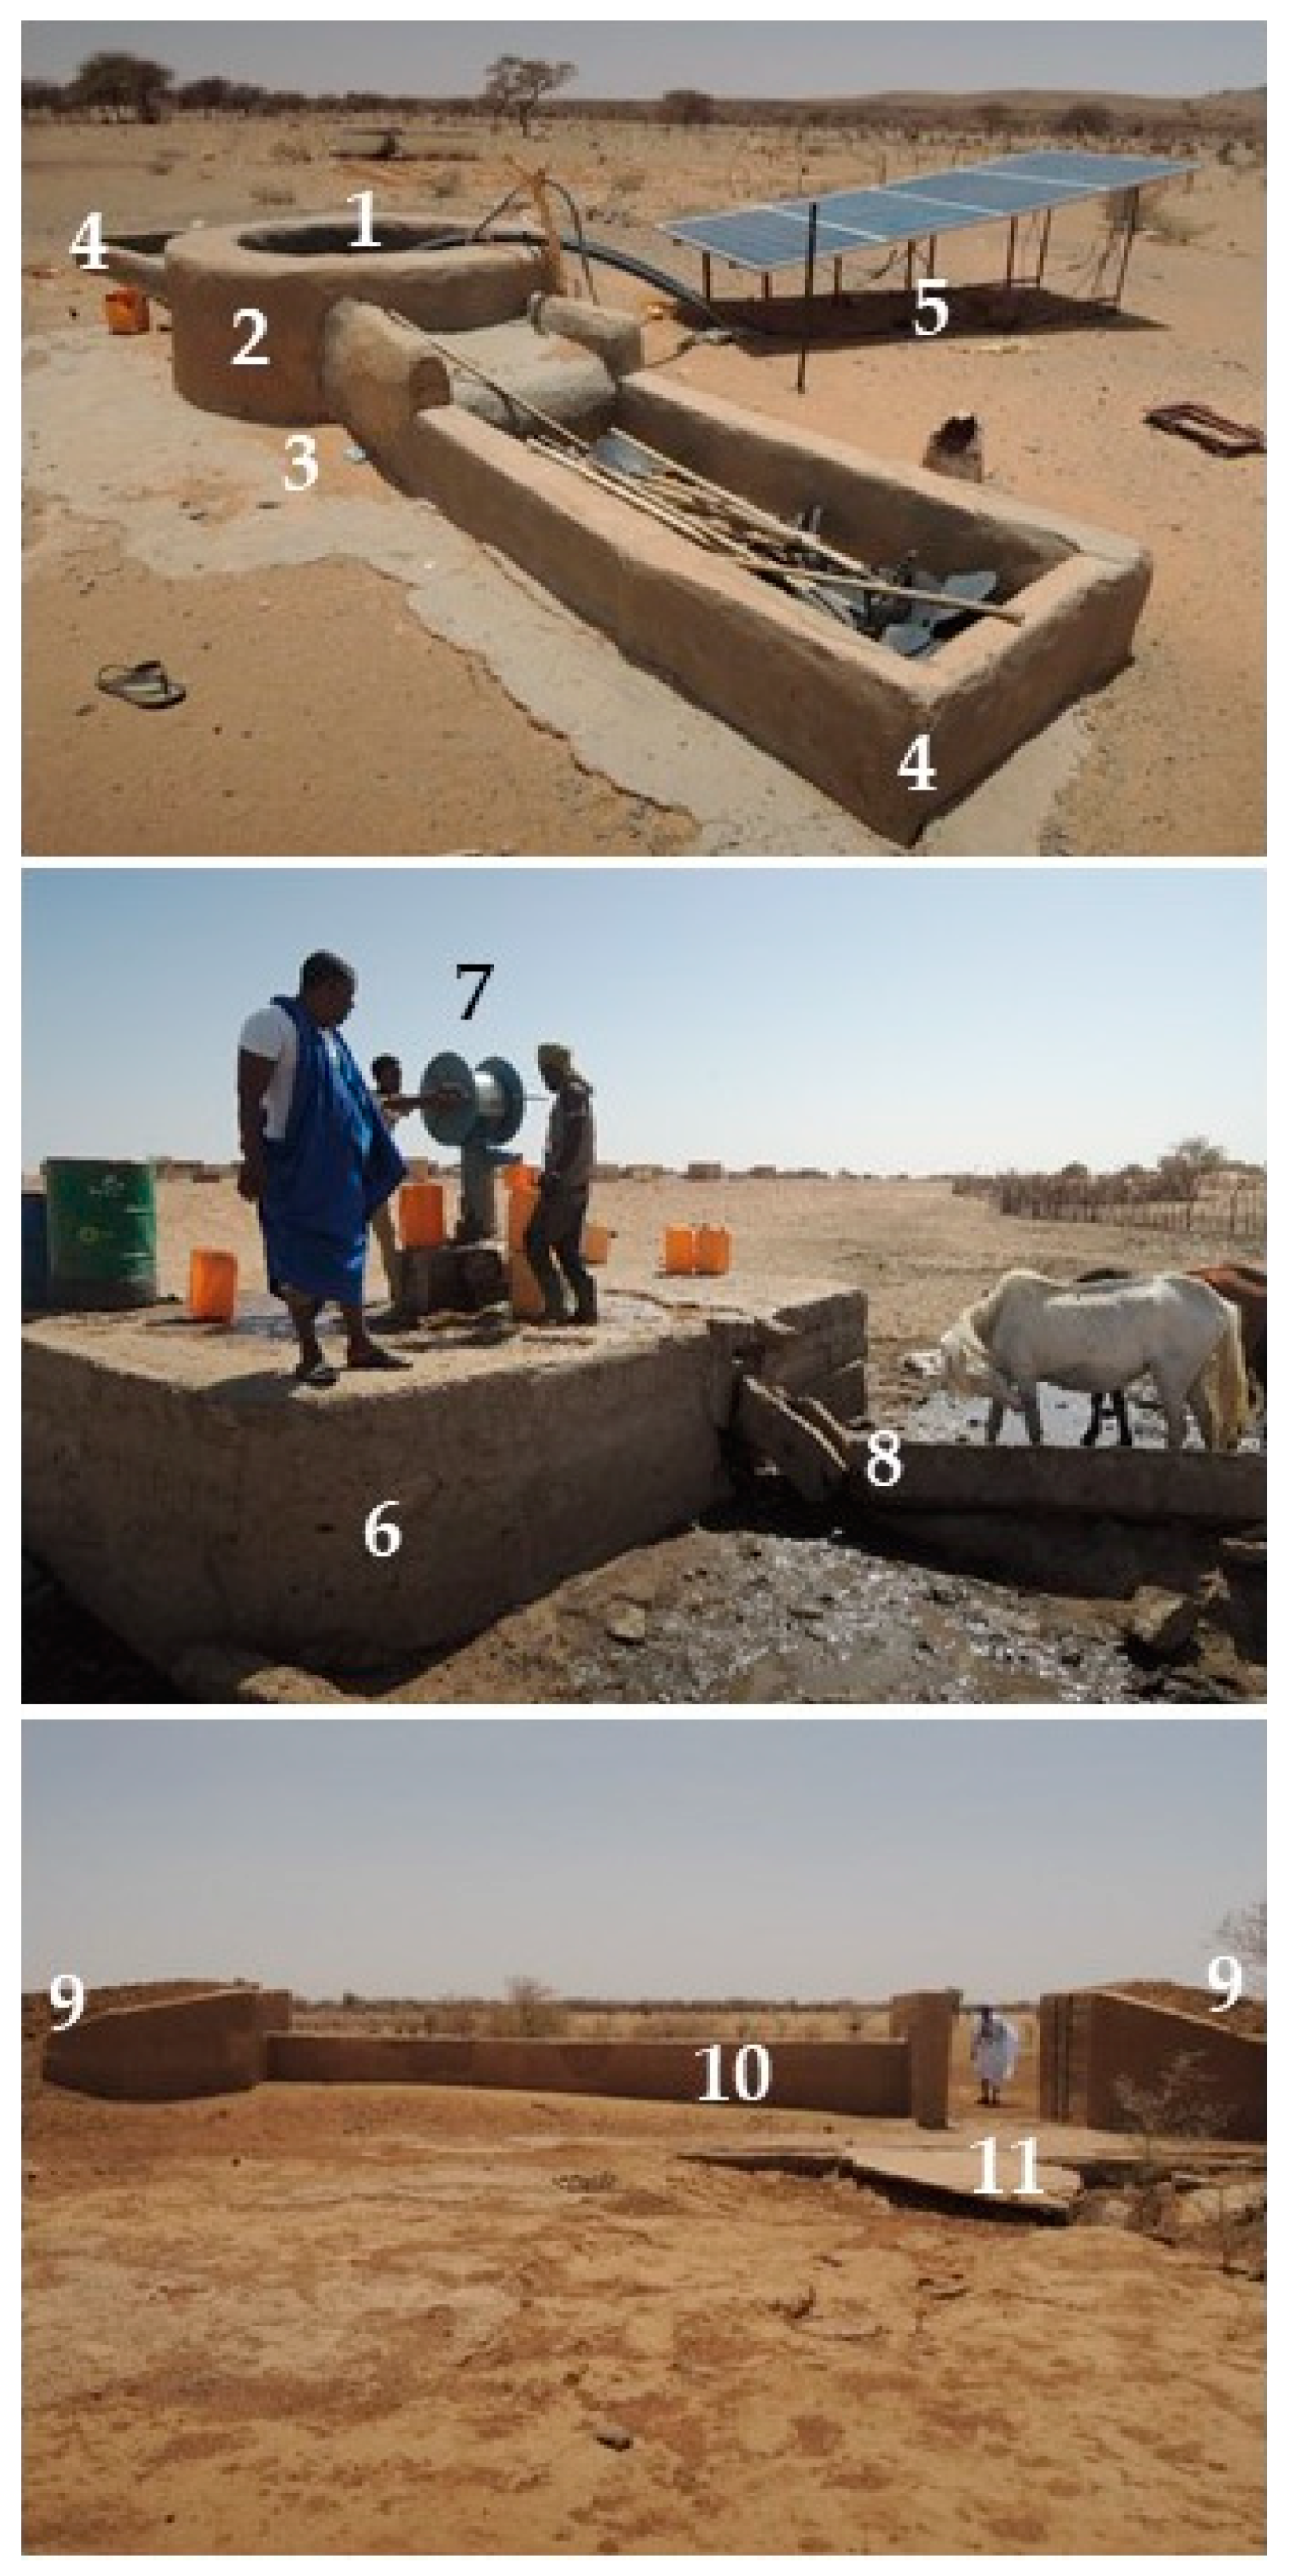
The risk assessment was aimed at the official development aid active in the region and at the regional administration. However, the method may also be of interest for other contexts exposed to similar hazards. In addition to the ranking of the communities according to risk level, the assessment process proposes thirteen risk treatment actions for the six communities at severe and high risk. These actions were identified after a visit to the exposed items. This involves acting on the water supply (well deepening, building or raising the apron of the pastoral wells, covering them, equipping them with pedals or solar-powered water pumps, water troughs for cattle watering, guaranteeing access even in the wet season), protect crops from stray cattle (fencing in metal barbed weir), and reduce the impact of heavy rains (repairing the earth embankments and equipping them with spillways or repairing the existing spillway, locks and fencing in metal barbed wire, gabion wall to protect the riverbank) (
Figure 12,
Table 8).
These measures, compared with those proposed by the literature, are more specific and directly implementable (
Table 9).
4. Discussion
This study reviewed the problems common to the majority of risk assessments published thus far in tropical Africa. The study then proposed a multi-hazard vision, the integration of local and scientific knowledge, a drought and flooding probability estimate, indicators representing the risk determinants, and 12 actions to deal with the risk.
The objective was to define a replicable methodology that would allow us to produce a ranking of the communities and to suggest actions for those that would have been at greatest risk. Therefore, it was necessary to refer to specific communities with their own hazards, exposures, vulnerabilities, and adaptive capacities, rather than representing communities as points of a risk map constructed by superposition of low-resolution information layers, as is often done in assessments at regional scale.
This holistic approach found little evidence in the literature consulted at the regional scale. Local knowledge and visits to the exposed items facilitated the determination of the exposure, vulnerability, and adaptive capacity.
Scientific knowledge was used to determine which of the four hazards pose the highest threat to the sustainable development of livelihoods in the rural Hodh Chargui and considered the method used to rank the communities. Contrary to the indications of the Sendai framework (2015) [
2], the integration of knowledge is still unusual on a regional scale. The systematic review highlighted that only one assessment out of four published on tropical African regions estimated the probability of flooding or drought [
1,
3,
11,
18,
19,
27]. This is likely to result from poor access to local data. In the case of the Hodh Chargui, for example, the only surviving weather station with a continuous series of more than 30 years of daily precipitation data is that of the airport of Néma, which is too little to represent a vast territory such as that in which the 13 communities are distributed. The use of estimated precipitation from satellite (CHIRPS dataset) and the surface area of the ephemeral wetlands (Landsat images) allowed for the estimation of the probability of meteorological, hydrological, and agricultural drought, and the TRMM dataset allowed for the estimation of the probability of heavy precipitation. The low spatial resolution of the Landsat images used (30 m) was adequate for the size of water bodies observed (6 to 30 km
2).
The literature review ascertained that in risk assessments at the regional scale, the indicators are chosen according to the information most easily accessible, rather than according to the information that best represents the risk determinants. In particular, it is rare to find specific indicators for meteorological, hydrological, and agricultural drought. Meeting with the communities and the visits to the exposed items allowed for indicators specific to the context to be identified.
The considerable differences in the level of agricultural drought and heavy rains risks among the 13 communities have generated a differentiated multi-hazard index. The northernmost communities were found to have greater probability of agricultural drought risk, compared to the five southern communities on the border with Mali. However, they are also closer to the large market of Néma (22,000 inhabitants in 2013,) which demands many horticultural products in a region in which they are scarce. Therefore, they would have greater opportunities to diversify their livelihood with commercial gardening if they could improve their access to water. The communities at the foot of the uplands (Boukhzama 1 and Begou) are more exposed to the risk of heavy rains and, therefore, to flash floods.
The discussions with the communities and the visit to the receptors enabled the identification of twelve actions for the six communities at severe and high risk, which are rarely found in literature [
11]. These first concern the improvement of access to water: Well deepening, apron elevation, covering, providing a pedal or a solar water pump, a water trough for cattle watering, and facilitating access in flood prone area during the wet season. Second, they concern earth embankments (creation of spillways and locks, protection with metal barbed wire) and the protection of the riverbanks (gabion wall).
The assessment methodology may be of interest for other semi-arid, agropastoral regions of the Tropics.
The assessment presents four main limits. First, it was based on a review that has only considered the published literature. Grey literature contains other assessments, but its dissemination is ephemeral and it has a temporary inspiring effect on assessment practices. For these reasons, it was not taken into consideration.
Second, the hydrological hazard was calculated in a very simplified manner, seeking to achieve a result despite the scarcity of available information at local scale. The correlation between the dynamics of the surface area of ephemeral wetlands and precipitations in a Sahelian context has been questioned by literature, particularly due to the alteration of the vegetation cover and related erosive processes that have increased the runoff over time [
52,
53,
54]. However, in the specific context of southern Hodh Chargui, the almost flat orography may have limited the erosive processes compared to other areas at the foot of the uplands as Boukhzama 1 and Begrou [
54].
Third, the occurrence probability of heavy precipitations was calculated on a shorter series than the conventional one (24 years instead of 38) due to the time limitations of the dataset used.
Fourth, water flow and the quality of the wells were appreciated qualitatively. Measuring these parameters is possible and would give further solidity to the assessment. However, as the number of investigations increases, the duration of the survey is extended and may risk limiting the comparison between the first and the last investigated communities, which was instead the objective of the assessment.


