Article

Constructing an Evaluation Model for User Experience in an Unmanned Store

1
Department of Industrial Design, Tunghai University, Taichung 40704, Taiwan
2
Digital Innovation, Tunghai University, Taichung 40704, Taiwan
*
Author to whom correspondence should be addressed.
Sustainability 2019, 11(18), 4965; https://doi.org/10.3390/su11184965
Submission received: 9 August 2019 / Revised: 2 September 2019 / Accepted: 3 September 2019 / Published: 11 September 2019
(This article belongs to the Special Issue Selected Papers from TIKI IEEE ICASI 2019)

Abstract

:
Traditional stores feature three characteristics: the goods, convenience, and the service provided to its customers (users). Due to the development of the online/offline omni channel consumption model, the starting point for supplying the user with services is no longer the time at which a user arrives at the store door. Instead, it is expected that services can be merged seamlessly into users’ lives at any point in time. Convenience and quality of service can be maximized and optimized via any medium or device. Therefore, in light of the foreseen commercial requirements of the supply end, we introduce a strategy for implementing intelligent equipment in order to achieve the goals of enhanced efficiency and reduced manpower. We investigate the possibility of traditional stores being replaced by other types of convenient store. This study investigates the experience evaluation of unmanned stores with respect to three dimensions: the economic experience, marketing experience, and qualia experience. A case study approach is implemented in this study. The goal is to investigate the course of the user experience in the X-Store, which was founded by the Uni-President Enterprises Corporation in Taiwan. By determining the relationship between users’ interactions with tangible and intangible objects, it is possible to understand the reasons behind the insufficiency in a bad user experience. It is then possible to deal with the insufficiency represented by an intangible service guidance interface, rather than the single and tangible factor of there being no clerks. Finally, a type I quantification theory is applied to the quantification of qualitative data. It is known that the elements corresponding to higher user ratings include, respectively, entertaining setting, positive sensory experience, and innovative products or facilities. The most representative factors for these elements include an interactive drinks cabinet, a futuristic layout, and facial recognition. In contrast, the elements of lower satisfaction level include a setting far from feelings of hustle and bustle, the experience of being introduced to new ideas (thinking), and facilities that are easy to operate. The most representative factors behind these elements include being unable to perform immersive shopping, there being no memory of limited-edition souvenirs, and apps that are not good to use. The contributions of this study are twofold. Firstly, we provide an evaluation of user experience for the first unmanned store in Taiwan, along with a subsequent ranking of the factors. This could provide companies with a reference for either maintaining or improving upon their current state. Secondly, we analyzed the five-stage experience activities for the embodiment of the interactive relationship between users and other people who were analyzed. Any follow-up changes to user influence can be traced back by means of this approach.

1. Introduction

The purpose of creating “experience” values is to create a minimal discrepancy between the expected value and the experienced value received by the receiving end (the user). Meanwhile, the supplying end (the company) is also able to attain reasonable commercial profits. Lower levels of discrepancy indicate higher satisfaction levels. A win–win situation is the optimal solution [1]. Based on the experience level, this study uses activity theory to carry out a perturbation analysis of the X-Store unmanned store and the user investigation questionnaire in order to determine the actual opinions of customers. The results can serve as a good reference for follow-up studies or for companies to expand their territory of unmanned stores.
“Experience design” deals with the tangible products and the intangible services that are provided. Experience design not only changes the quality of life of the user, it also supplies intangible emotions and value. Traditional stores in Taiwan are independent grocery stores, which are usually located in residential villages or communities. The goal is to provide nearby residents with the ability to conveniently purchase products. Therefore, different grocery stores have different products on display, and their prices are different. However, since the owner is a neighbor to his/her customers, they are acquainted and have a high chance of meeting each other; greetings and conversations during a transaction are inevitable. We often describe a grocery store as being full of hospitality, and this is indeed its intangible service value [2].
Since January 2019, Amazon Go has been operated by Amazon.com, Inc. in order to offer a brand-new way of shopping so that customers do not need to line up or check out. They can simply take goods away. This is referred to in the media and by the public as an unmanned store. Amazon Go has stated that there are still clerks in the store. However, these clerks are not there for the check out. Instead, they work in the kitchen on more complex tasks, such as preparing food materials, arranging stock and displays, and answering questions from customers. These Amazon Go stores have been in operation for ten months, showing successful results in 2018. In Taiwan, Uni-President Enterprises Corporation launched its first futuristic X-Store in June 2018, and its second one in July 2018, with a focus on exploring, experiencing, and transcending. They advocate the release of manpower by means of technology, thus allowing their clerks more time to spend serving their customers. The implementation of technology can also deepen the interaction with customers. Chou [3] proposed a model for carrying out psychological measurements of user experience based on fuzzy measurement approaches. The user experience questionnaire (UEQ) is used as a psychological measurement tool for collecting the scoring results from subjects. These scoring results can be converted into Gaussian fuzzy numbers and aggregated by means of aggregation operations. He also developed a user experience index (UXI) for assessing UX quality in a quantitative way. He carried out a demonstration study of the incidental UX measurement for a touch mouse. Wang et al. [4] proposed a solution allowing designers to process dynamic user demand information using demand evaluation and predictive approaches. They proposed a concept that was oriented towards the knowledge management of user demand based on a four-level hierarchical diagram model. They paid special attention to knowledge collaboration and message intercommunication. Lu et al. [5] proposed a new approach (SimuSurvey) for improving the current training tools for surveyors using a user-oriented approach. Since only a very small number of users participated in the preliminary development of the SimuSurvey project, many tutors and students have doubts regarding the application of the innovative SimuSurvey in practical measurement courses. To resolve this problem, we proposed and applied a re-designed tool that is user-oriented and based on iteration and increments. Hussain et al. [6] and Park et al. [7] proposed an evaluation principle for user-centered experience for the evaluation of immersive VR experiences or experience operating interface.
The purpose of this study is to evaluate a user experience model for the unmanned X-Store in Taiwan, and to determine whether its experience design achieves user satisfaction. The main focus areas of this study are threefold, as follows:
  • Methods for decomposing and introducing activity theory via user experience;
  • Reconstructing the journey of the user experience, and collecting and organizing the insufficiencies of the experience;
  • Quantifying and analyzing user experience evaluation factors.

2. Literature Review

This study is to investigate the user experience model of unmanned stores. Any experience needs people to be involved, and the emergence of unmanned stores is closely related to the social economy. Therefore, we collected and organized relevant literature, data, and theories in order to conclude into relevant theories from the macroscopic and microscopic views of experience. These theories are related to the following topics. (1) The meaning of an experience. (2) The activity theory. By reviewing the context of historical timeline, we investigated development and applications of experiences since the 19th century.

2.1. The Meaning of an Experience

When investigating the “user experience” term, most of the literature in the past traced back to the definition that was made by Norman et al. [8] at the end of the 20th century. However, few studies investigated experiences from aspects of social and economic relationships or elaborated on why people need to emphasize experiences. In this study, we reviewed the social development and historical evolution since the 19th century and summarized the arguments of various scholars in order to explain for the spirit and implication of experiences.

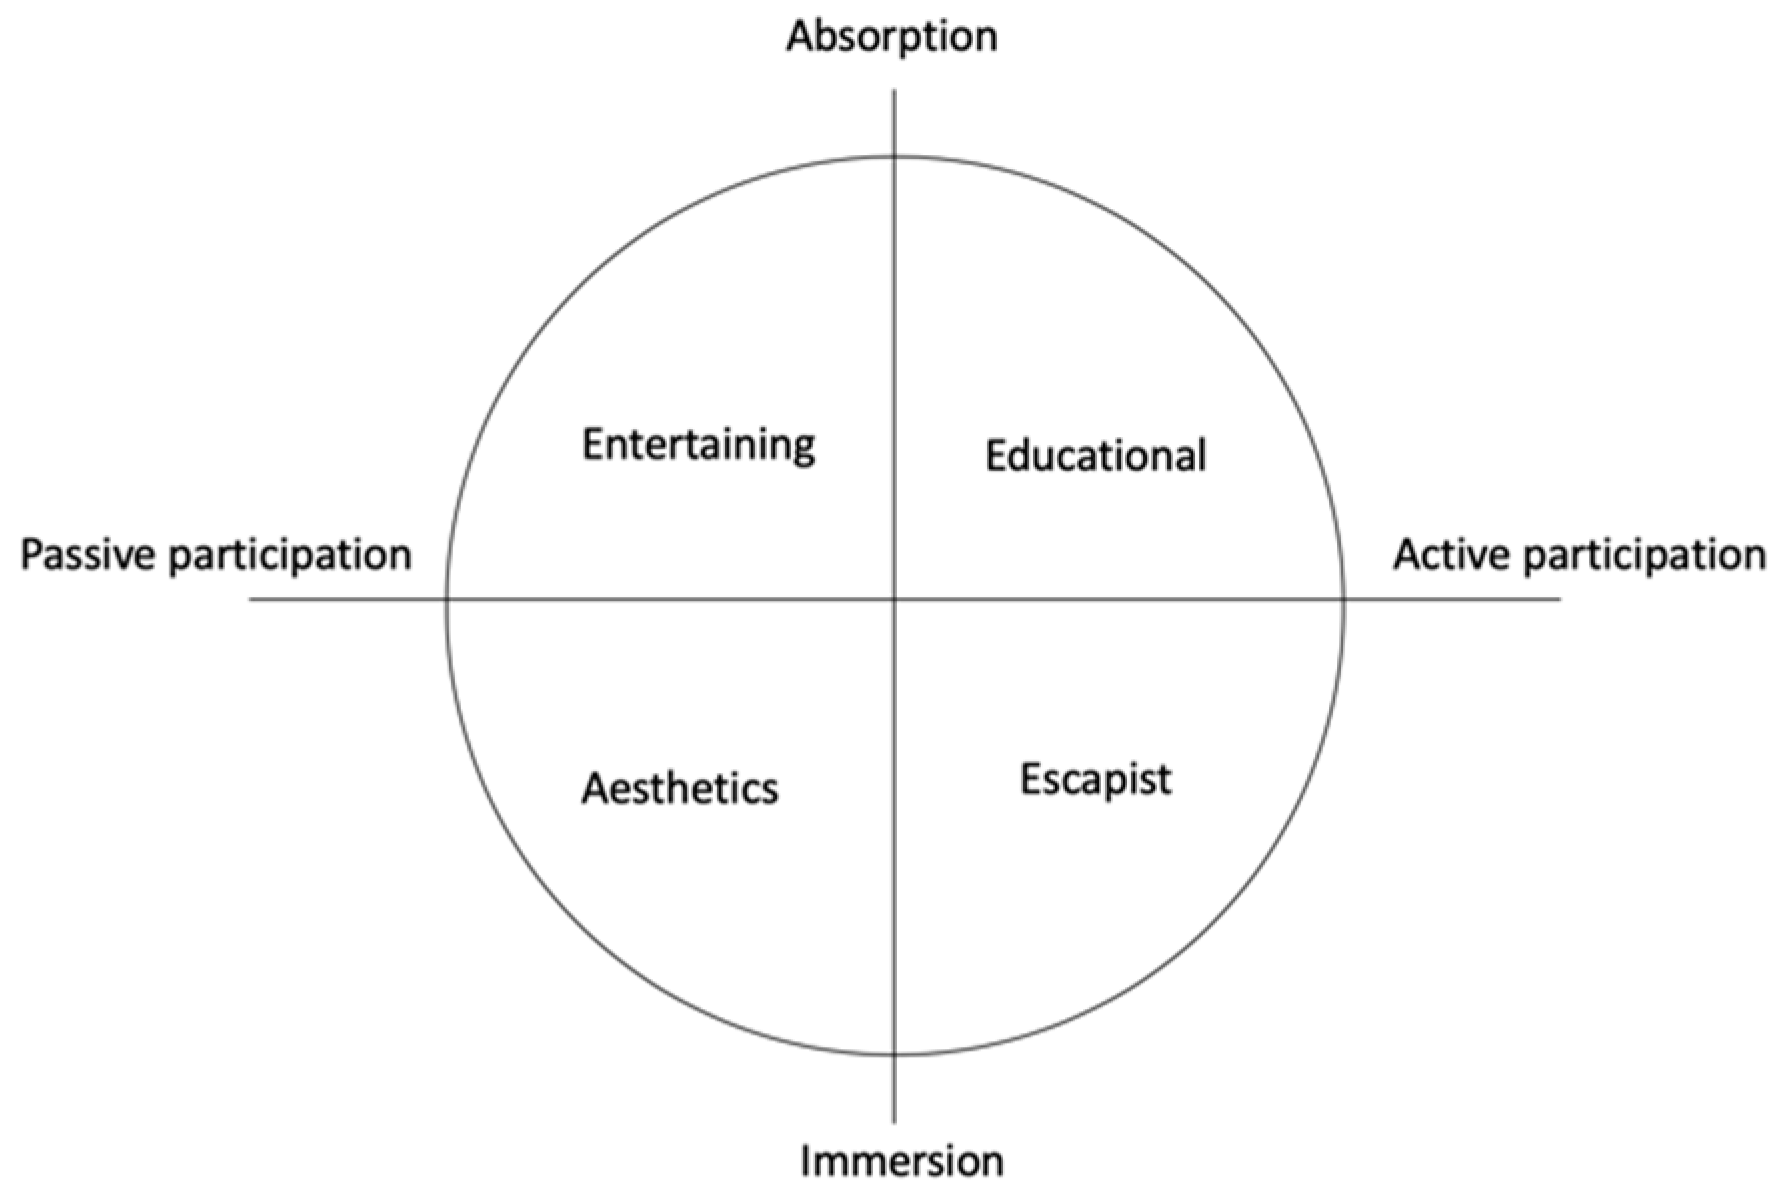
2.1.1. Experience Economy: Four Types of Experience and Four Economic Patterns

The third industrial revolution started from the middle of the 20th century and it is usually called the computer revolution or digital revolution. With the rapid development of technology, human demands can no longer be satisfied by food and clothing. Pine and Gilmore [9] defined an experience by the degree of human participation. The horizontal axis depicts the activeness and passiveness. On the other hand, the vertical axis indicates the degree of absorption and the degree of immersion of the correlation between people and the environment. Human experiences can be divided into four types as follows. (1) Entertainment: Making people happy and attracting people’s attention such as watching a performance or visiting a tourism factory [10]. (2) Education: The object (i.e., people) needs to participate actively into learning both mentally and physically such as the spontaneous games that are helpful of intellectual development. (3) Escapist: The experience that is more indulging than entertainment such as the use of virtual reality devices. (4) Aesthetic: The environment is not changed but it can motivate people to experience with a higher willingness such as walking in a nature park with abundant landscapes as shown in Figure 1.
As to why experiences correlate with economic values, Xia and Lu [11] divided economic pattern into four types in their book of “The Era of Experience Economy” as follows. (1) Product; (2) Goods; (3) Service; (4) Experience. If viewed from the above-mentioned evolution of industrial revolution, the first industrial revolution brought up product demands, the second one enhanced products to goods, and the third one integrated services to enhance to a higher value based on the original goods. They also took IBM as an example in this book that, this company manufactured computers in the 1960s and provided free service after a customer placed an order. As time goes by, the industry went mature and IBM started to charge their customers for the services and eventually services became intangible goods with economic values. Finally, this section is to investigate the way of personalizing people’s participation for the experience. The resulting value needs to continue even after the end of the experience itself. Therefore, providing experiences delivers more economic value than providing products, goods, or services as shown in Table 1.
Finally, Xia and Lu [11] also proposed “transformation” as the new competition foreground as shown in Table 2. They proposed that transformation does not mean to change for a change. Instead, the emphasis of transformation should be on meaningful intentions which should be included into the strategy. The goal is to create a temporary state that is more splendid and eternal.

2.1.2. User-Centered Design Concept

Norman proposed a philosophical education thinking that is different from Dewey’s and is also different from the experience value that is promoted by Pine & Gilmore. He proposed the concept of “user-centered design” in 1986 from the standpoint of a product designer. However, his concept is like the flip side of the coin to the original concept and the main approach is to create designs that can be applied to users via case demonstration. Later in 2013, the User Experience Professional Association (UXPA) gave a more definite definition of user experience as “the design point of view or characteristics that focus on the users during the design process and for planning, design, and development”. In 1995, Norman published the featured article of “What You See, Some of What is in the Future, and How We Go About Doing it” with J. Miller and A. Henderson in a human-machine interaction seminar. They proposed that a company is known for its human-machine interface because it invested a lot of resources in research and paid attention to the details of product implementation. The “user experience team” also plays an important role among all members. It is known that Apple Inc. has been carrying out in-depth research on user experience since more than 20 years ago so that it can supply excellent products. They also proposed that during the earlier stage of research and development of a product, the user experience team needs to carry out cross-department operations so that the demands of user experience will turn into formal documents. During the product development life cycle, one of the emphases is the cross-department operations which make a product gradually consummate. The eventual goal is to make the engineering team and the marketing team move actively toward the design consensus on the human-machine interface.
Pillan et al. [12] discussed a series of problems that are involved in the sustainable smart household solutions and determined the importance of developing design comprehensive approaches. User demands and functional demands were analyzed based on the investigation and analysis on residents. The final conclusion of the user experience design methods and tools for the development of smart household solutions was viewed as the social and technical system. Feng & Wei [13] proposed the first-time user experience (FTUX) and long-term user experience (LTUX) models to distinguish the critical problems of these two types of UX. A tool on a planar coordination of four guardant was designed from the process of data analysis. It integrated two types of user experience data and can locate the user experience state of a product in a qualitative way. This model was further applied to the identification of user experience problems in online fitness applications and the result was successful. Feng et al. [14] proposed providing a variety of products for customers’ selection and customer experience should be emphasized by each industry. The study also analyzed the relationship between customer experience and the business model of digital companies. Ma et al. [15] proposed a research framework of environmental experience design (EXD). It can be defined as an attempt with awareness, which is affiliated to experience design and environmental psychology in order to create a construction environment that meets customer demands. The EXD research framework that was proposed in their study is specifically suitable for transforming relevant design functions into solutions that are helpful of improving the user health and well-being of an architectural environment.

2.1.3. Experience Marketing: Five Experience Modules

From the aspect of psychological territory, marketing professor and the founder of global brand center, Bernd Schmitt proposed that various tangible products or intangible services need to satisfy people’s psychological needs in addition to supplying basic functions. Moreover, consumer experience can be shaped. The argument of including user demands into products or services is the same as that which was proposed by the other three scholars. Schmitt further proposed five experience modules and their application approaches in order to deliver experience images to users. These approaches include (1) Sensory experience: Stimulating users’ senses and emotion and further supplying values by products or services. For example, cooking coffee in the store and consumers will smell it when they pass by. (2) Emotional experience: Triggering consumers’ underlying emotions. For example, a commercial that shows a lady enjoying a chocolate when she is taking a bath. This image delivers a sense of stronger enjoyment when female audiences are enjoying the same chocolate next time. This is due to the fact that emotional demonstration can trigger consumers’ earlier experiences or emotional symbols [16]. (3) Thinking experience: Shaping creativity to guide consumers’ thinking or to create consumer demands. (4) Mobile experience: Whether the experience that is supplied to users meets users’ life patterns. (5) Association experience: Affecting users via possible connecting approaches from others’ or the users’ standpoint.
According to the aforementioned description, the experience activities have the same main discussion on the human-centered experience even if they are viewed from four different aspects. Therefore, the elements of experience economy and experience marketing are adopted in this study as the basic elements of quantifying user experience.

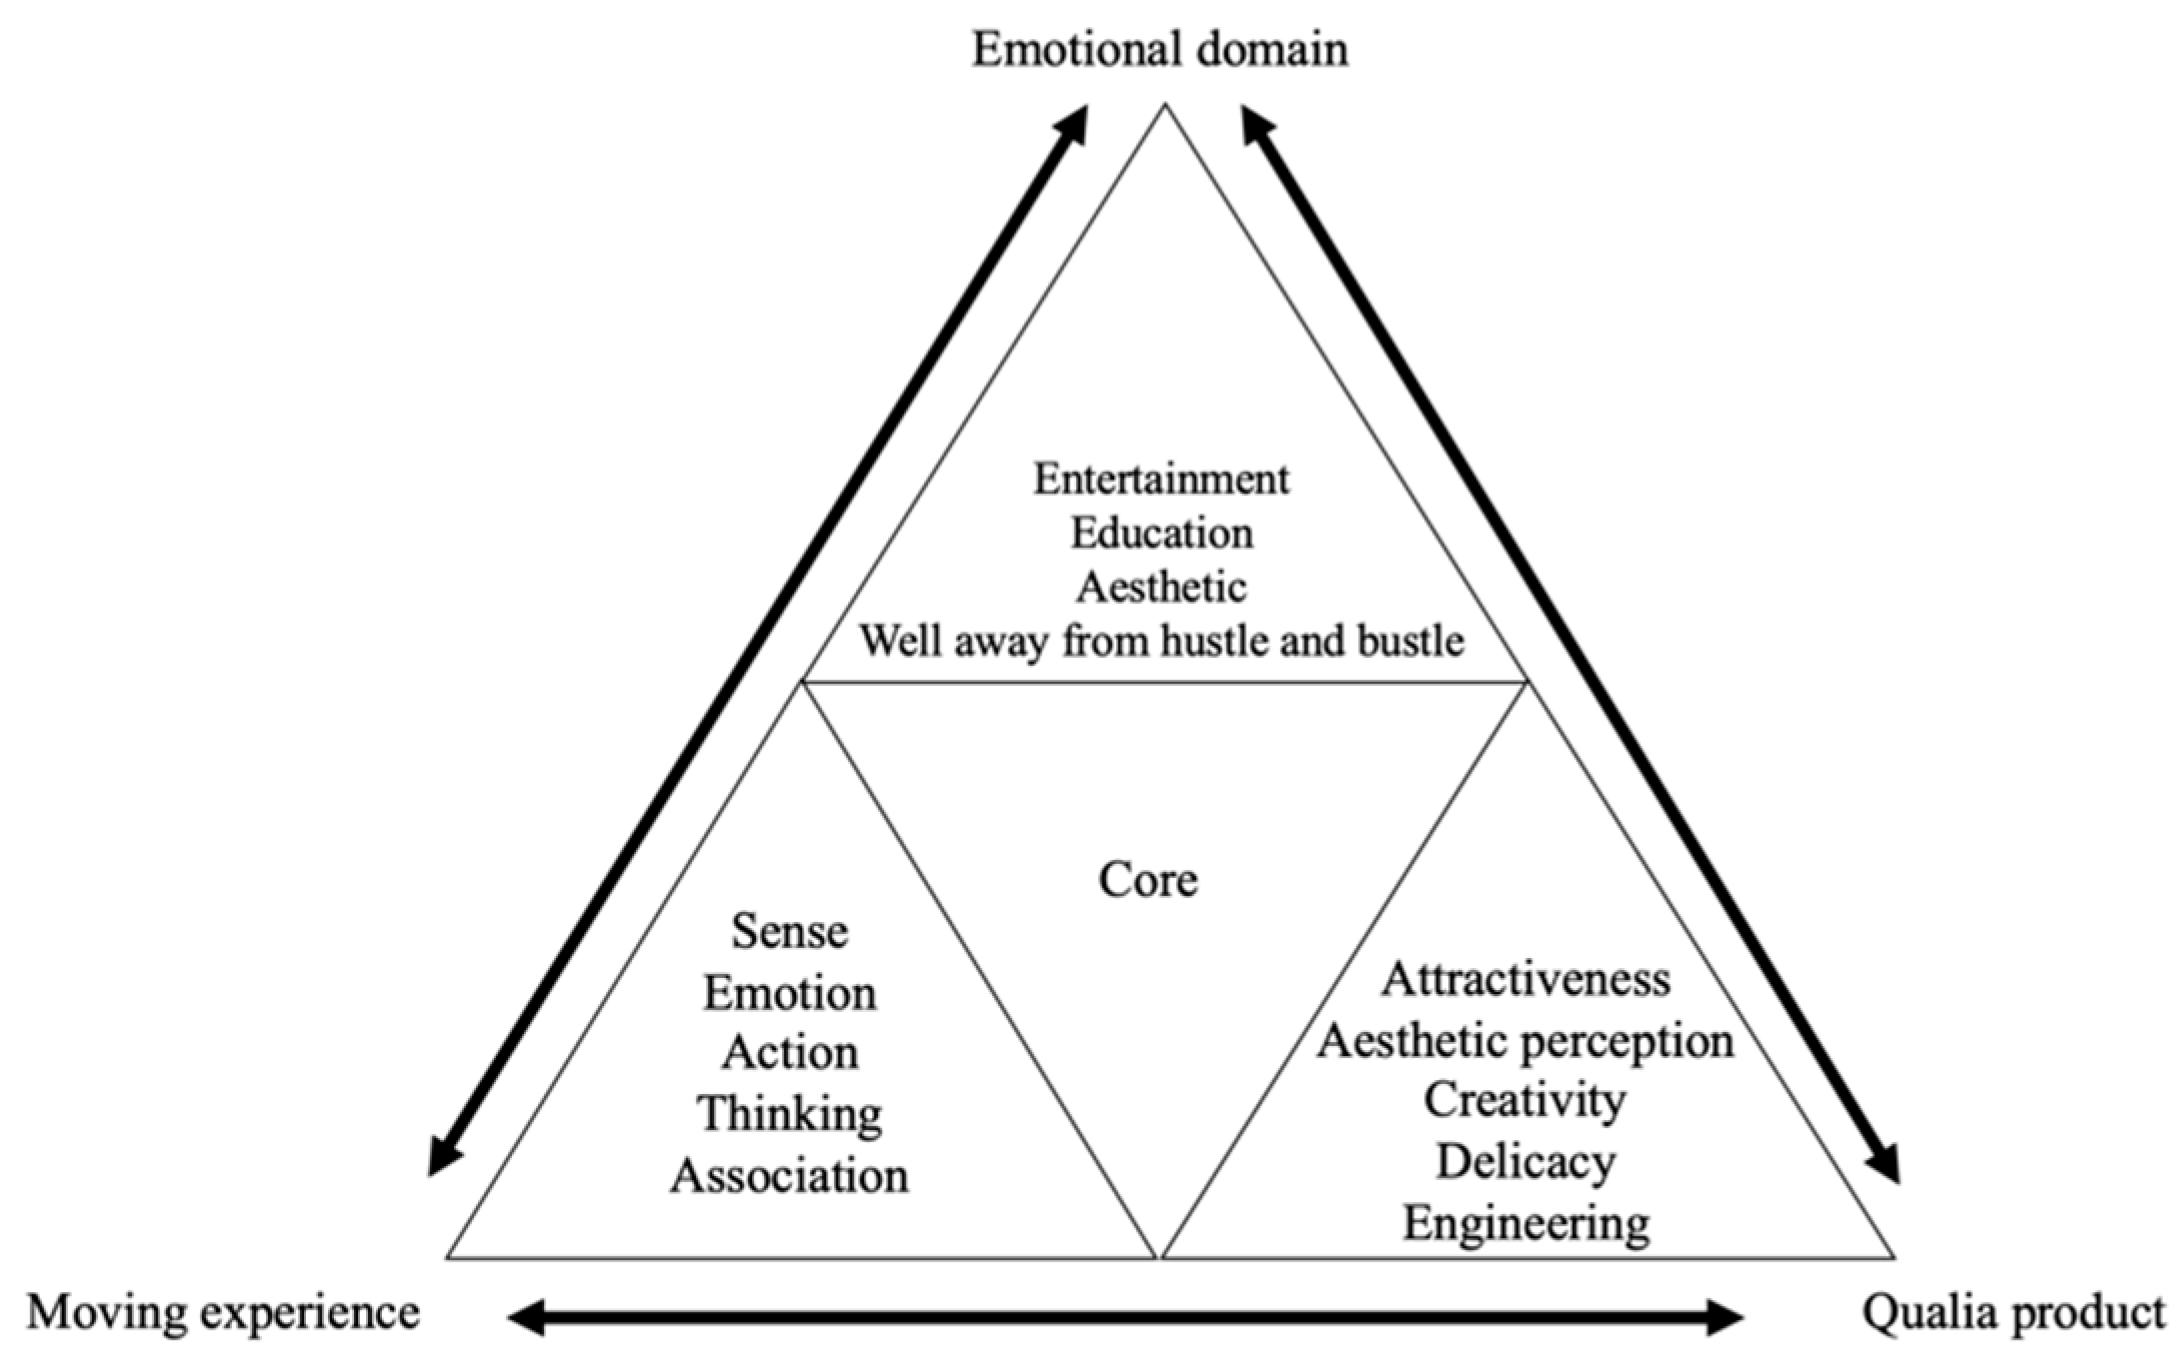
2.1.4. Qualia Experience: Value-Added Experience

The term “qualia” came from Latin and it represents “quality”. Searle [17] proposed that qualia is a type of soul phenomenon, awareness state, and sense activity. As a result, qualia is a feeling that can only be perceived by firsthand experience. By summarizing the qualia experiences that have been developed for the last decade, this study is based on the qualia experience model that was proposed by Lin [18], who proposed that an experience consists of three main elements as follows. (1) Emotional domain: This theory originated from the experience economy that was proposed by Pine & Gilmore. The descriptive experience comprises four elements as follows. (a) Entertainment, (b) Education, (c) Aesthetic, and (d) Escapist. (2) Moving experience: This is delivered through the five experiences that were proposed by Schmitt and they include sense, emotion, action, thinking, and association. (3) Qualia product: attractiveness, aesthetics, creativity, delicacy, and engineering.
Follow-up scholars also investigated social design, service innovation, or qualia products from the qualia point of view [19,20]. These arguments have the same meaning as the value-added experience. Therefore, the qualia experience model was selected in this study as the framework of analyzing user evaluation (Figure 2).
Therefore, in order to allow users to obtain favorable experience from the activity system, it is expected to reach the result of “not only the customers are happy, but also they would like to enjoy again” via their experience of the unmanned store. The goal is to match the provider and recipient of demands so that the demand can be exchanged in the unmanned store. The resulting interaction is also the highest ambit of the value co-creation.

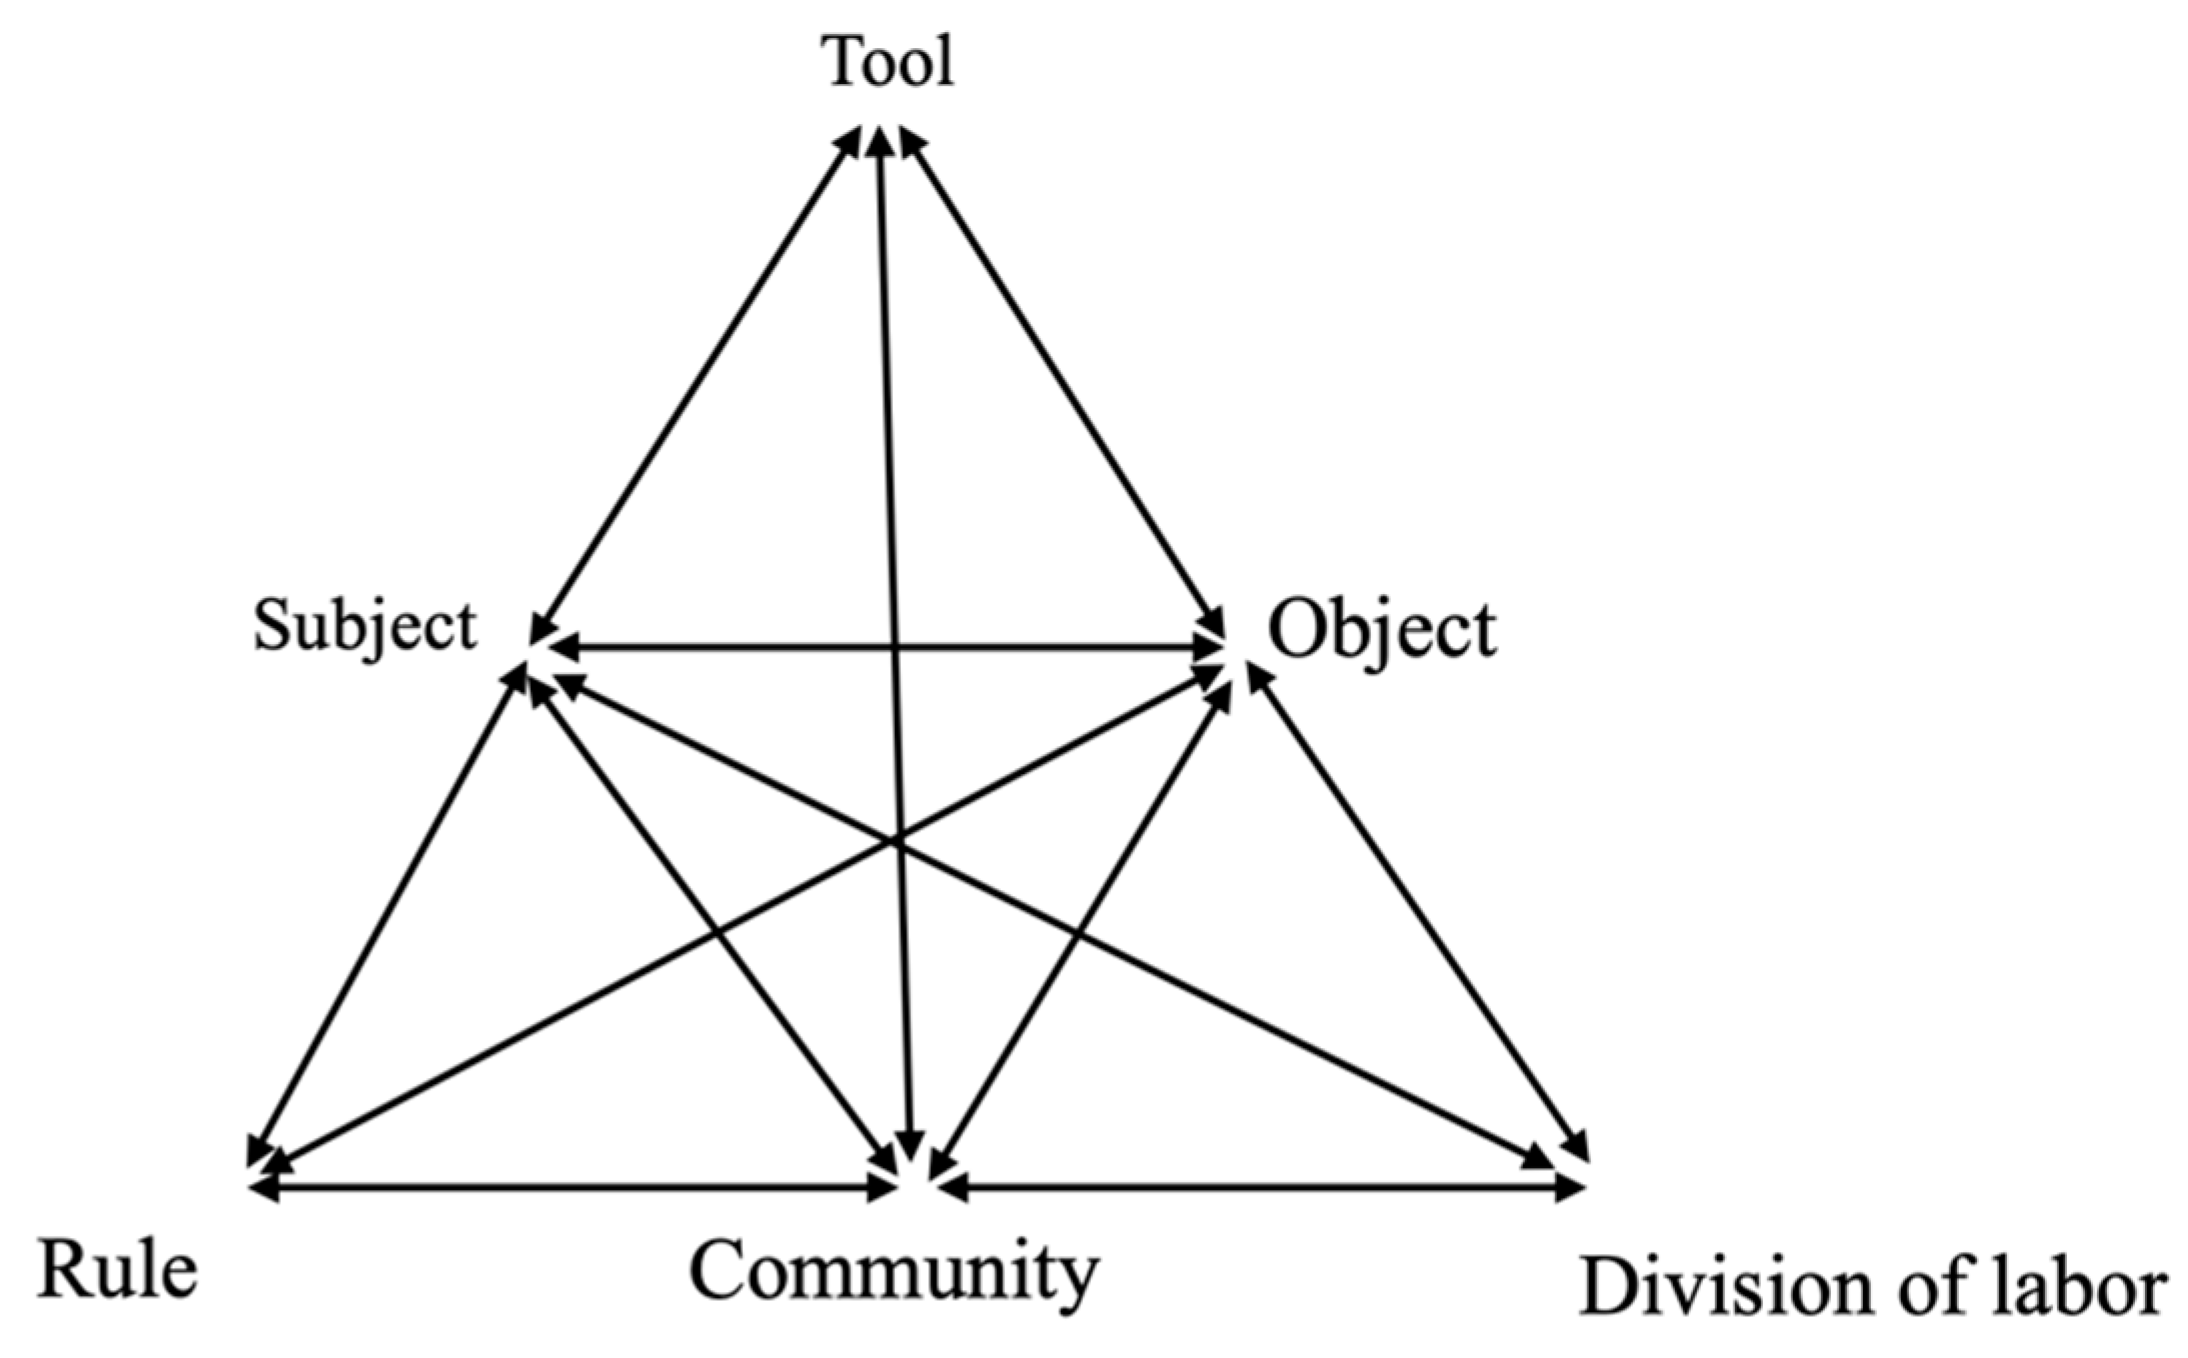
2.2. Activity Theory

In addition to investigating the importance of experience design and the user-centered experience, another topic to be explored is the experience activity. The activity theory originated from Russian cultural and historical activities. Scholars such as Vygotsky [21] emphasized that there is a strong correlation between people’s learning progress and the interaction with the environment. He also proposed that human interactions can only be accomplished by the concept of mediation. The mediation could be tangible tools, symbols, or intangible methods or principles. His colleagues including Leont’ev continued his idea and his students including Engeström carried out further investigation on the development predicament and the expanded learning [22,23,24,25,26].
The activity system model that was proposed by Engeström extended Vygotsky’s triangular activity model framework. In addition to the three elements including subject, object, and instrument, the subject moves toward the object via the instrument and moves toward the community via rules. The community needs the division of labor to reach the object. The instrument, rule, and division of labor are the mediation that was mentioned earlier. They can assist the subject or the community in reaching the object. However, the object might affect the subject or the community as shown in Figure 3. The activity system varies with time and the object name might seem different. However, the object is motivated by the motivation and in other words, the motivation is embedded into the same activity system [27].
Engeström [26] further explained that, the expanded learning that is based on the activity system could present four levels of contradictions as follows. Level 1 deals with the six elements of the activity system and these include subject, instrument, object, community, rule, and the division of labor. There could be internal inconsistency. Level 2 involves the inconsistency between the elements in the activity system. Layer 3 deals with the contradiction between the new and the old activity system. Layer 4 involves the inconsistency between the activity system itself and the other objects’ activity system. Engeström called the deviation to the standard script as disturbances [23]. Contradictions in an activity system could form assistance to reach the object. On the contrary, contradictions could possibly cause disturbances that hinder the original development. Recent scholars applied the activity theory to medicine or education. The former one discusses the doctor-patient interaction under the context of activity theory and proposed solutions to the resulting doctor-patient disturbances [28,29]. Scholars of the later one proposed using the activity theory to present the progress of educational activities. However, teachers understand more about the problems they are facing and the current environment. During the process of resolving the problems, they can expand their educational professionalism. Therefore, the activity theory is used in this study to investigate the stress or the unpleasant perception of disturbances during the course of user experience in order to propose a solution to the giver end.
Carlson et al. [30] utilized the activity theory to supply a useful theoretical framework in order to support the proposed experience and evidence. In a study of the overall customer experience of group-oriented activity tours under unique backgrounds and conditions, it was found that paying attention to the creation of personal experience is not enough. It is required to sustain the consumers in participating in the group consumption and experience activity tours since meaningful social interactions can boost customers’ experience of group tours. O’Keefe et al. [31], Song and Kim [32], Camacho et al. [33] and Hirsh & Segolsson [34] applied the activity theory extensively to educational activities and the evolution relationship between the individual elements of public transportations in city.
By reviewing the above-mentioned literature, whether it is the user-centered perspective or the experience economy and experience marketing, the effect of good experience on the enhancement of user satisfaction and the indirect effect of enhancing the economic value can be evaluated. Therefore, the design of the follow-up questionnaire survey in this study is based on the theories of experience economy, experience marketing, and qualia experience that were discussed in this section.

3. Research Methodology and Process

This study is to investigate the user experience model of unmanned stores. A single case study was adopted, and qualitative research observation and interviews were carried out after the collection of relevant literature. The in-depth investigation of individual user experience behaviors allowed the researchers to explore the essence that is behind the experience events so that they can propose the gap analysis of an experience design. The final stage adopts the quantitative research so that the research in the earlier stage can be developed into the experience model. The flowchart of the user experience evaluation model that was constructed in this study is shown in Figure 4.
This study is to analyze the evaluation of users’ experience of an unmanned store based on the qualia experience and the activity theory. Therefore, the resulting data consists of three parts as follows. (1) The disturbance and deficiency during the user experience progress. (2) User evaluation ranking. (3) The affecting factors that are behind the ranking of user evaluation. The research results and analysis are described in sequence. The elements of user experience were used during the analysis but without unique insight. As a result, a questionnaire survey was carried out in order to master and present the analytical data by utilizing the disturbance characteristics of the activity theory.
This study is to investigate the ways of experience activities in an unmanned store based on the perspective of activity theory. The results were presented by the approach of user experience journey. The analysis was carried out on the data before, during, and after the experience and the journey can be divided into five segments as shown in Figure 5. This approach can continue the evaluation of the questionnaire survey and the factors that affect the evaluation.

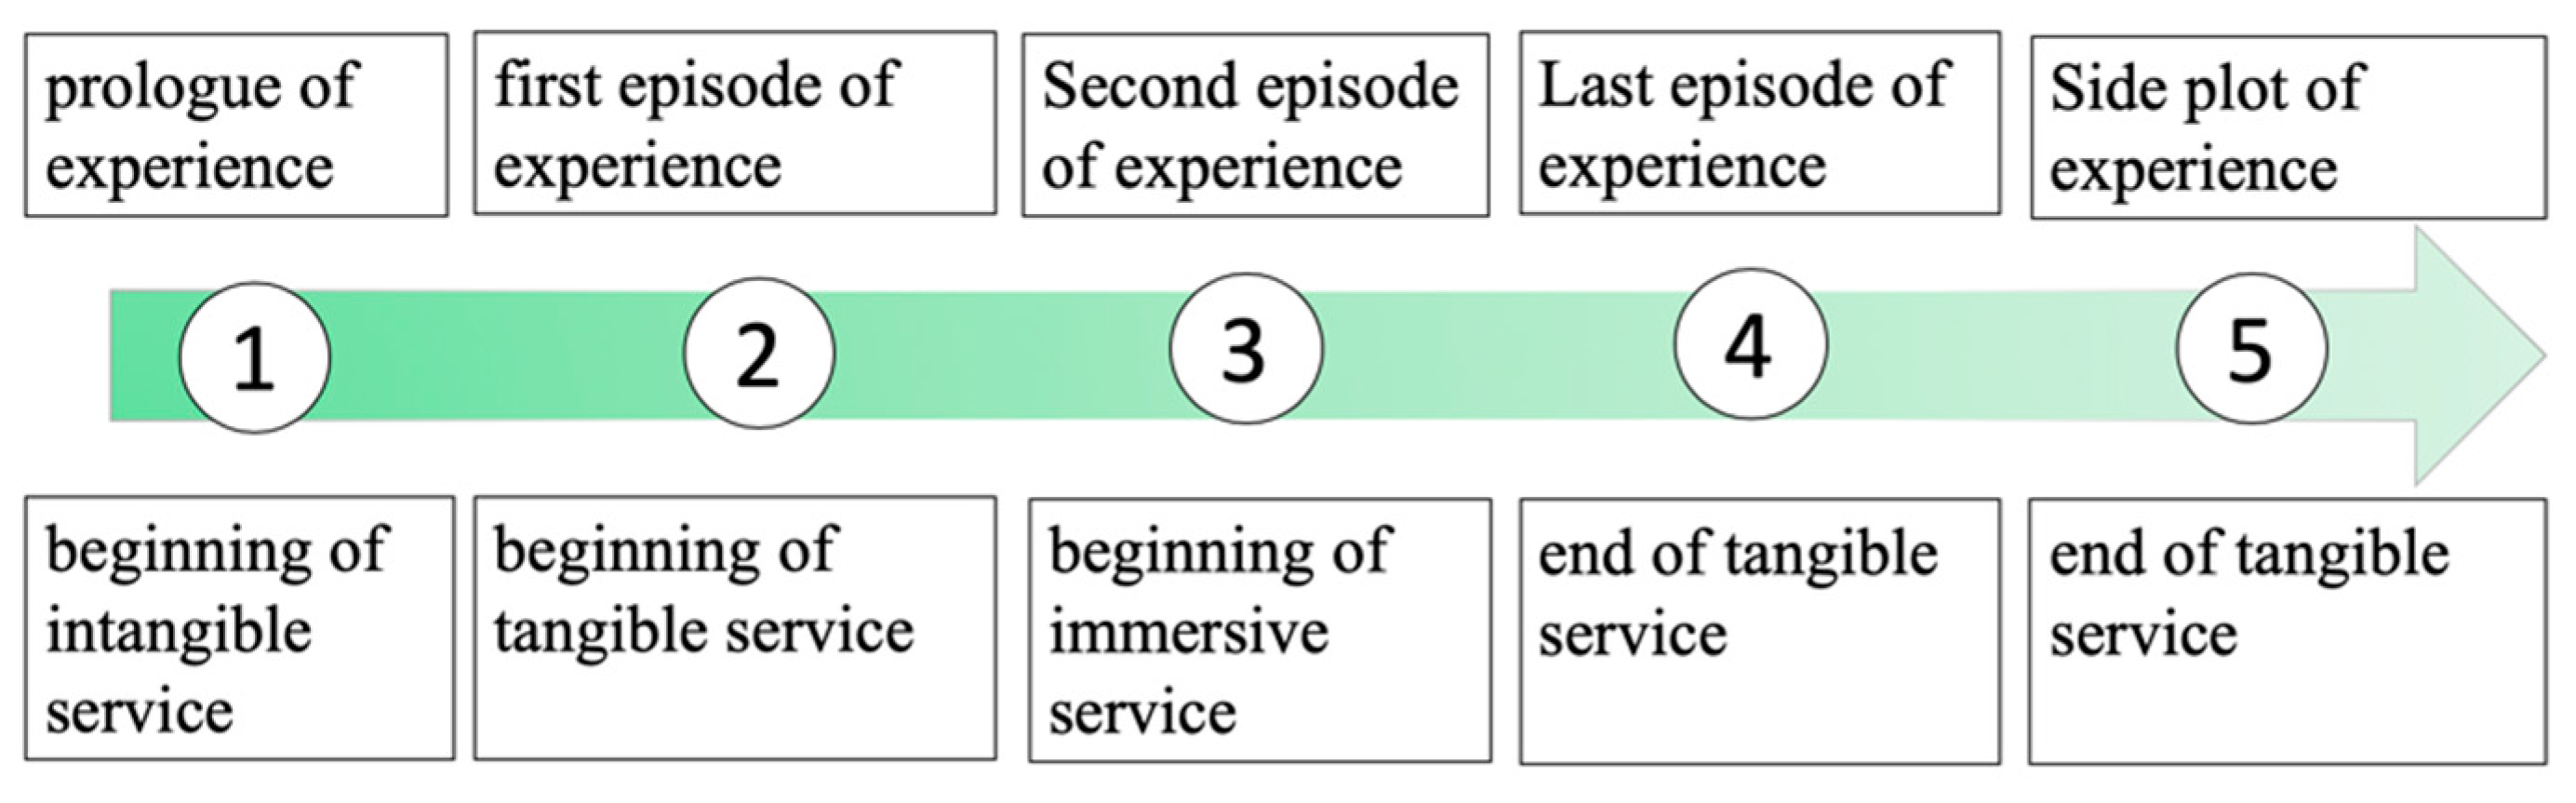
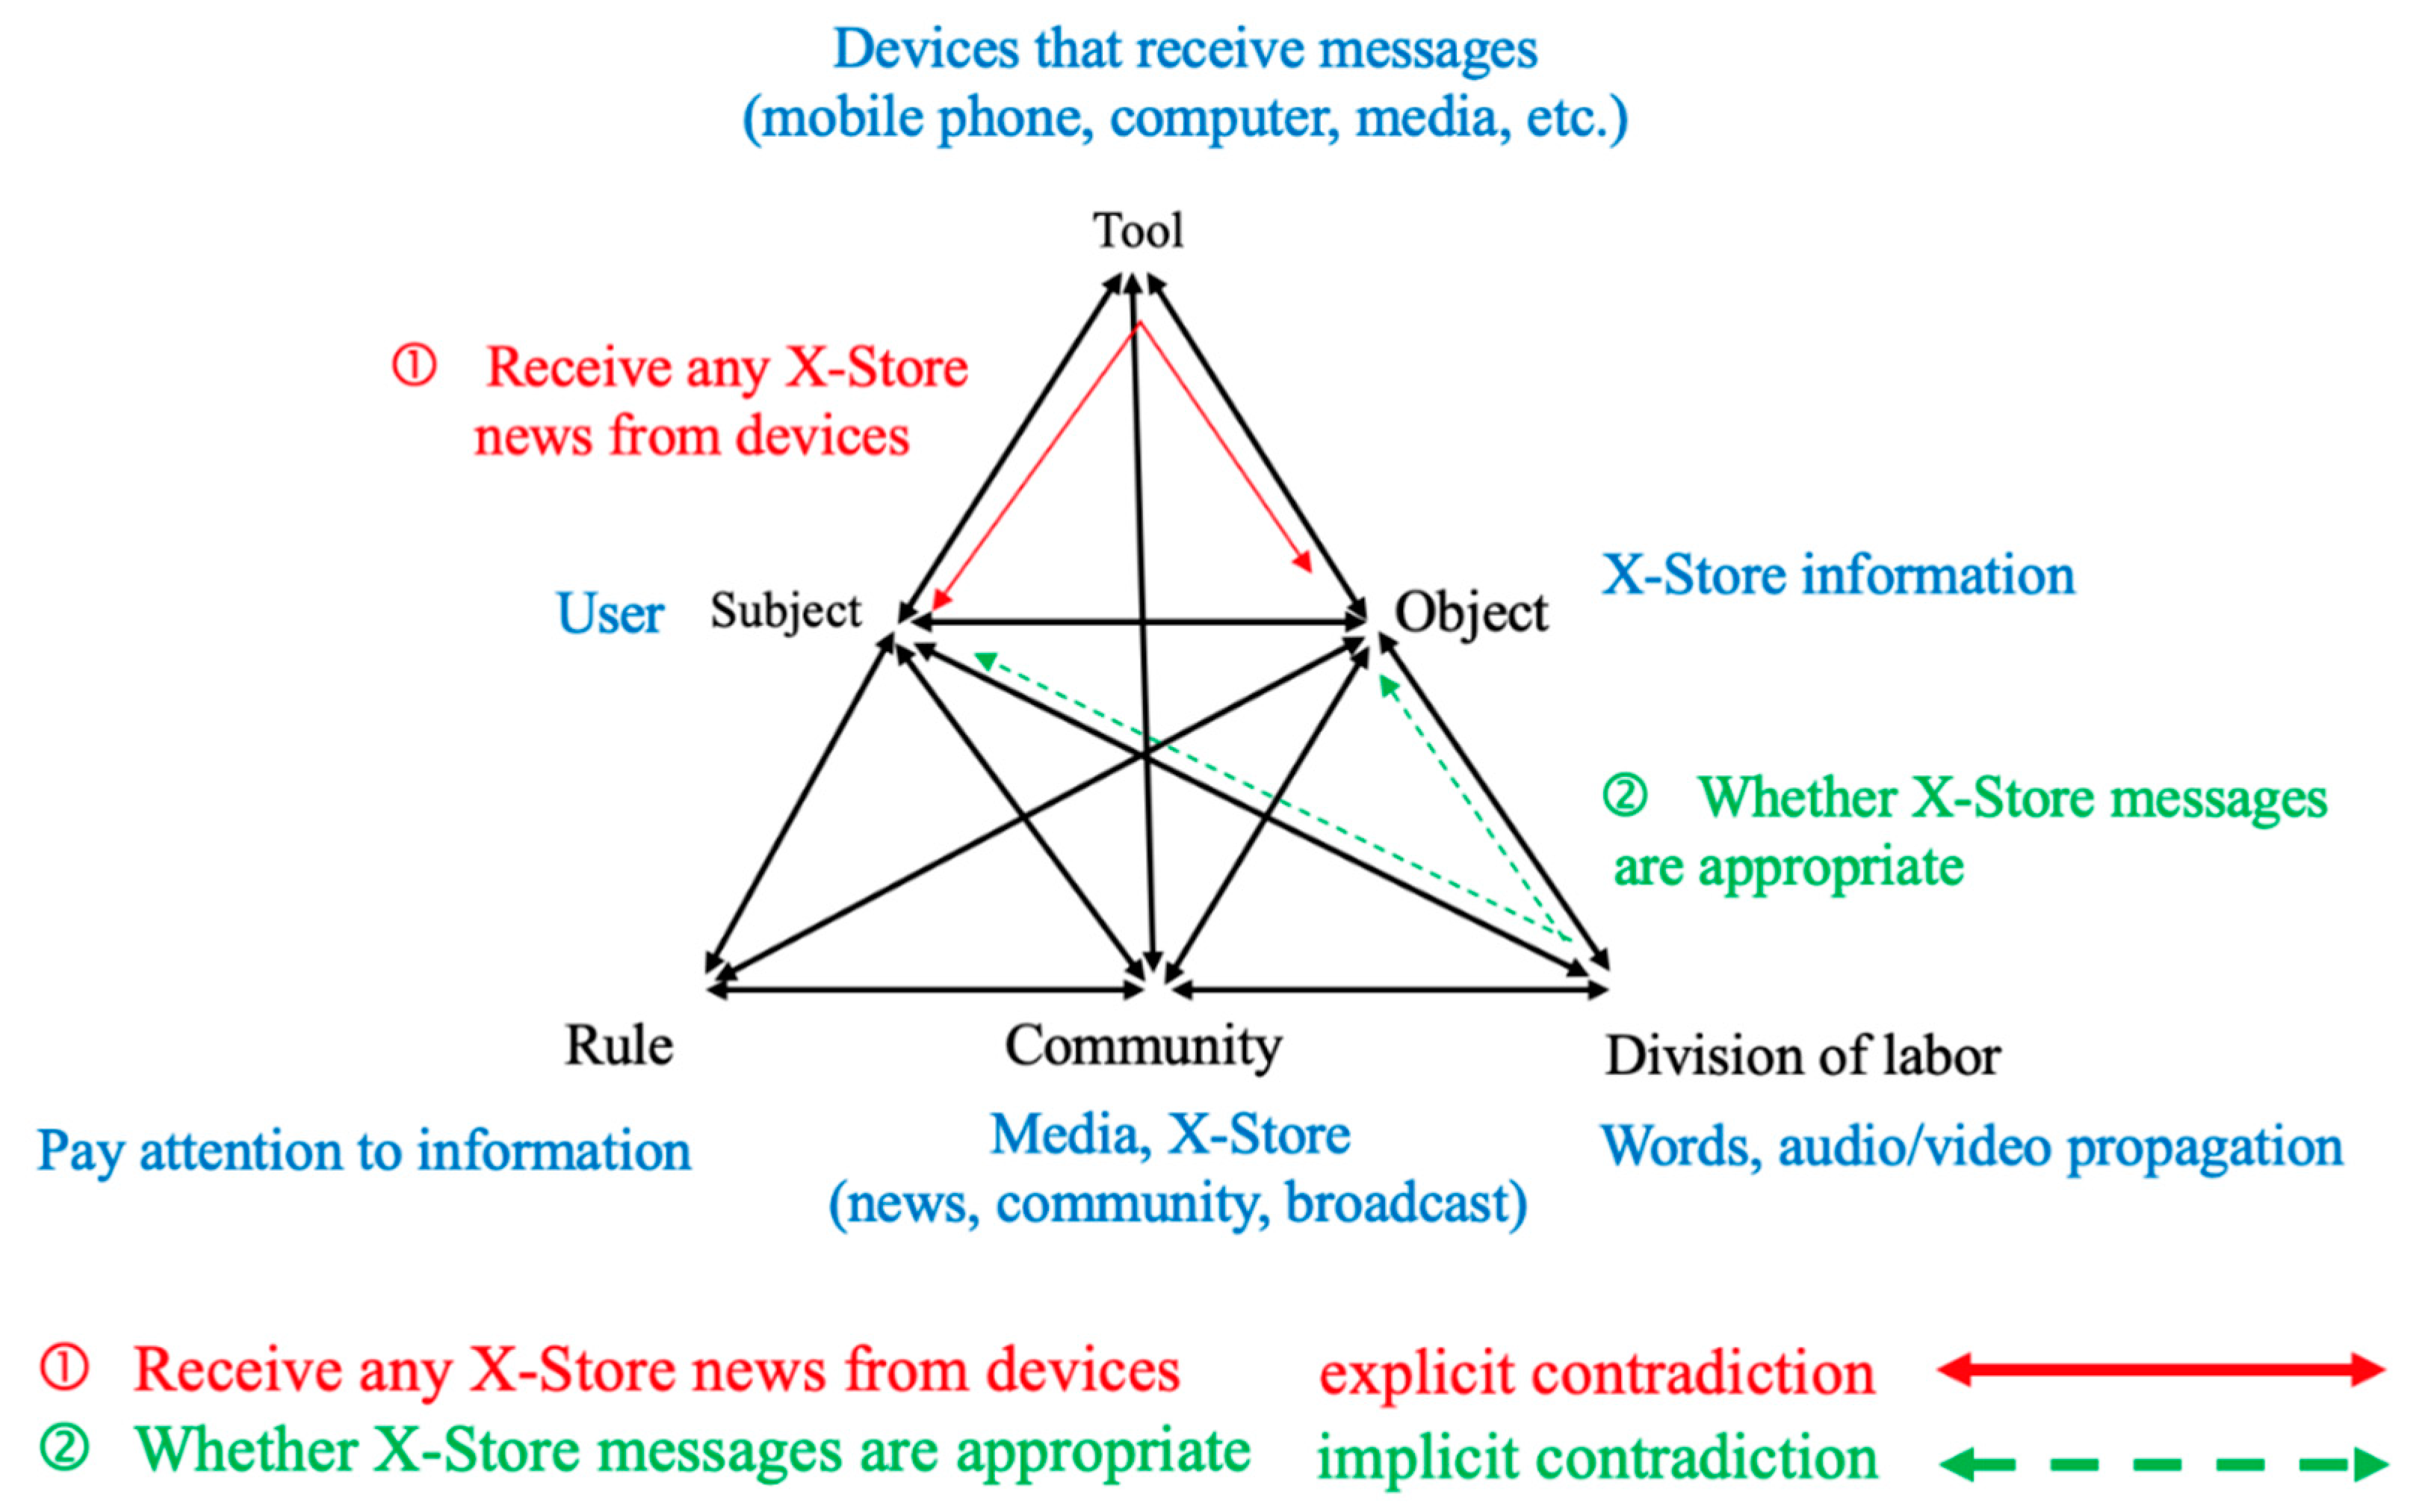
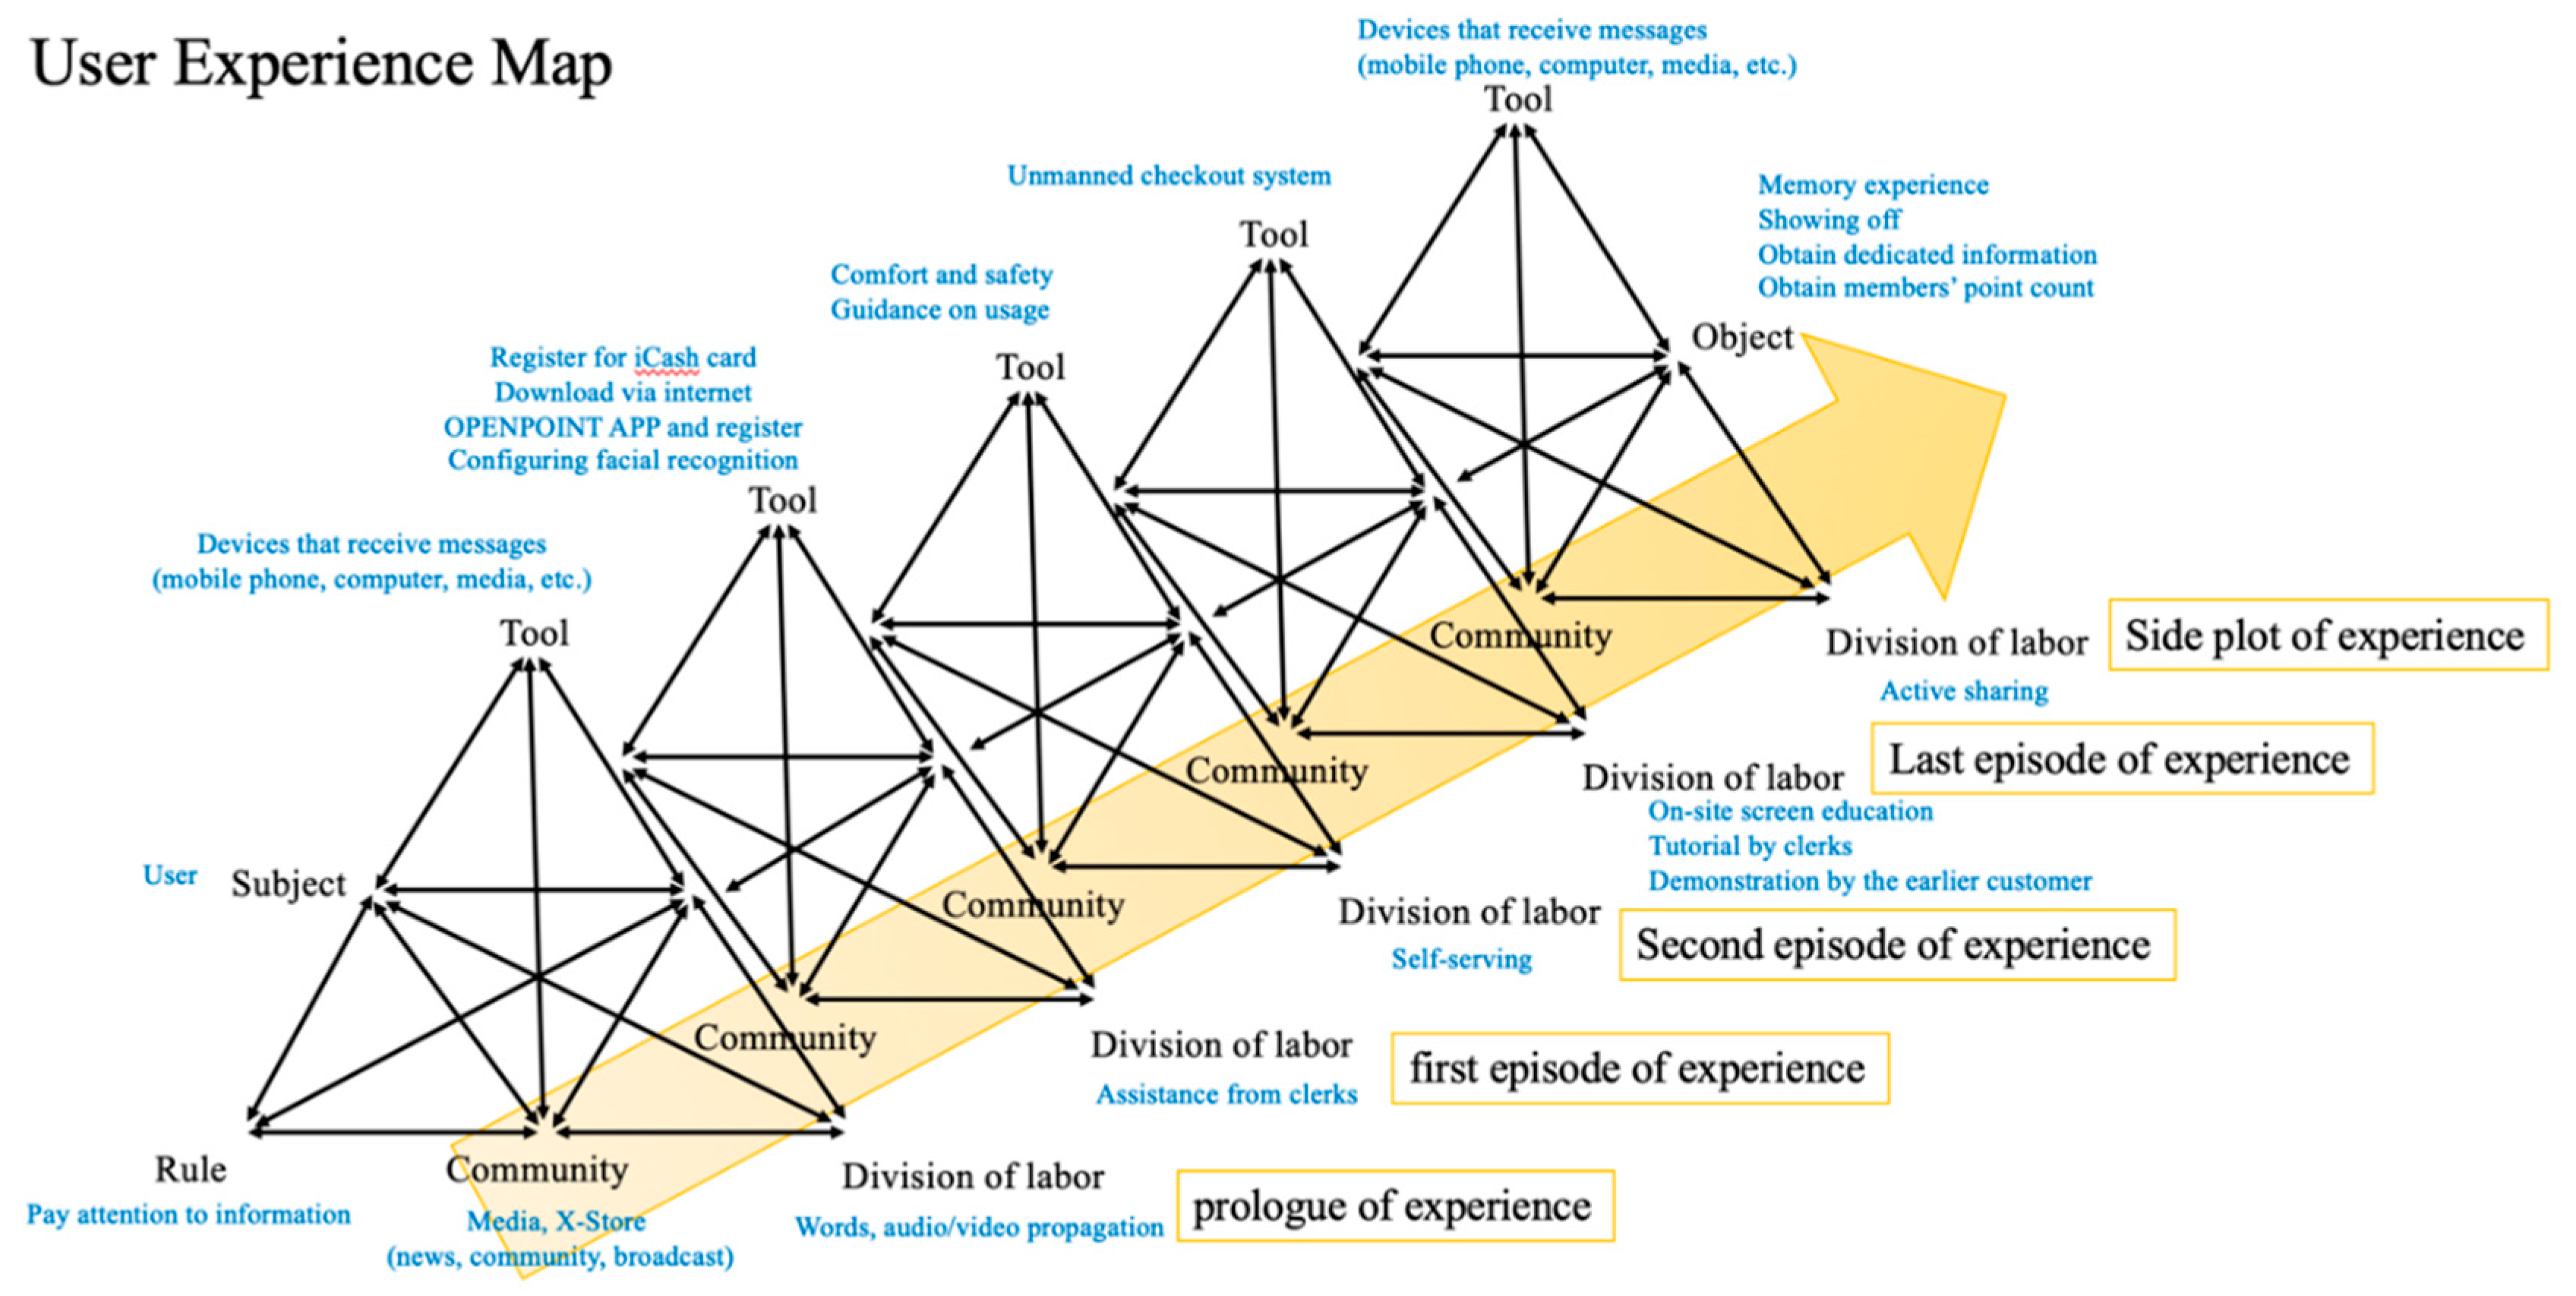
3.1. Five Segments of User Experience Journey

In this study, the activity theory is used to analyze the scenarios of five segments of journey and the essence of the vocabularies that were used during the user interviews in order to determine the disturbance factors to which the users are subject to.
Description of the actual scenario: The rapid recirculation of information allows users to learn the latest news. Prior to the formal operation of the X-Store, the operation of brand strategy includes releasing messages on the official website and announcing news by inviting media interviews. This is also the approach that allows potential customers to understand in advance the new retailing approach by the unmanned stores. Moreover, these messages also guide the public into learning the trend and operating models of new retailers and unmanned stores. During this stage, the users were served by the X-Store in an intangible way.
Arrangement of the meaning of interview transcript: Summarizing the behaviors of the interviewees before the experience and transforming the data into interviewee context as shown in Table 3 in order to further analyze the activity system during this stage.
Analysis of experience activity system: (see Figure 6)
  • Interaction tool: Devices that receive the information (e.g., smartphone, computer, radio)
  • Object: Obtaining the information of the new pattern of unmanned stores
  • Rule: Paying attention to news
  • Stakeholder: Media, X-Store
  • Division of labor: words, audio/video broadcasts
  • Explicit contradiction: Receiving X-Store news from devices
  • Implicit contradiction: Whether the X-Store news is appropriate
It is known from the above analysis that users can understand the establishment of the new style X-Store (object) via devices (tools) that receive messages. The users themselves should be willing to pay attention to news (rule) so that they will access to the news or advertisements that are released by relevant media or the X-Store official agent (community). Media and the X-Store are also willing to devote their time and efforts to developing texts and images in order to reach the object (division of labor). Disturbance conclusion: It is known from the interviewee context that, if the X-Store messages are incomplete or incorrect, users might develop misunderstanding or negative impression before the experience (before entering into the X-Store).

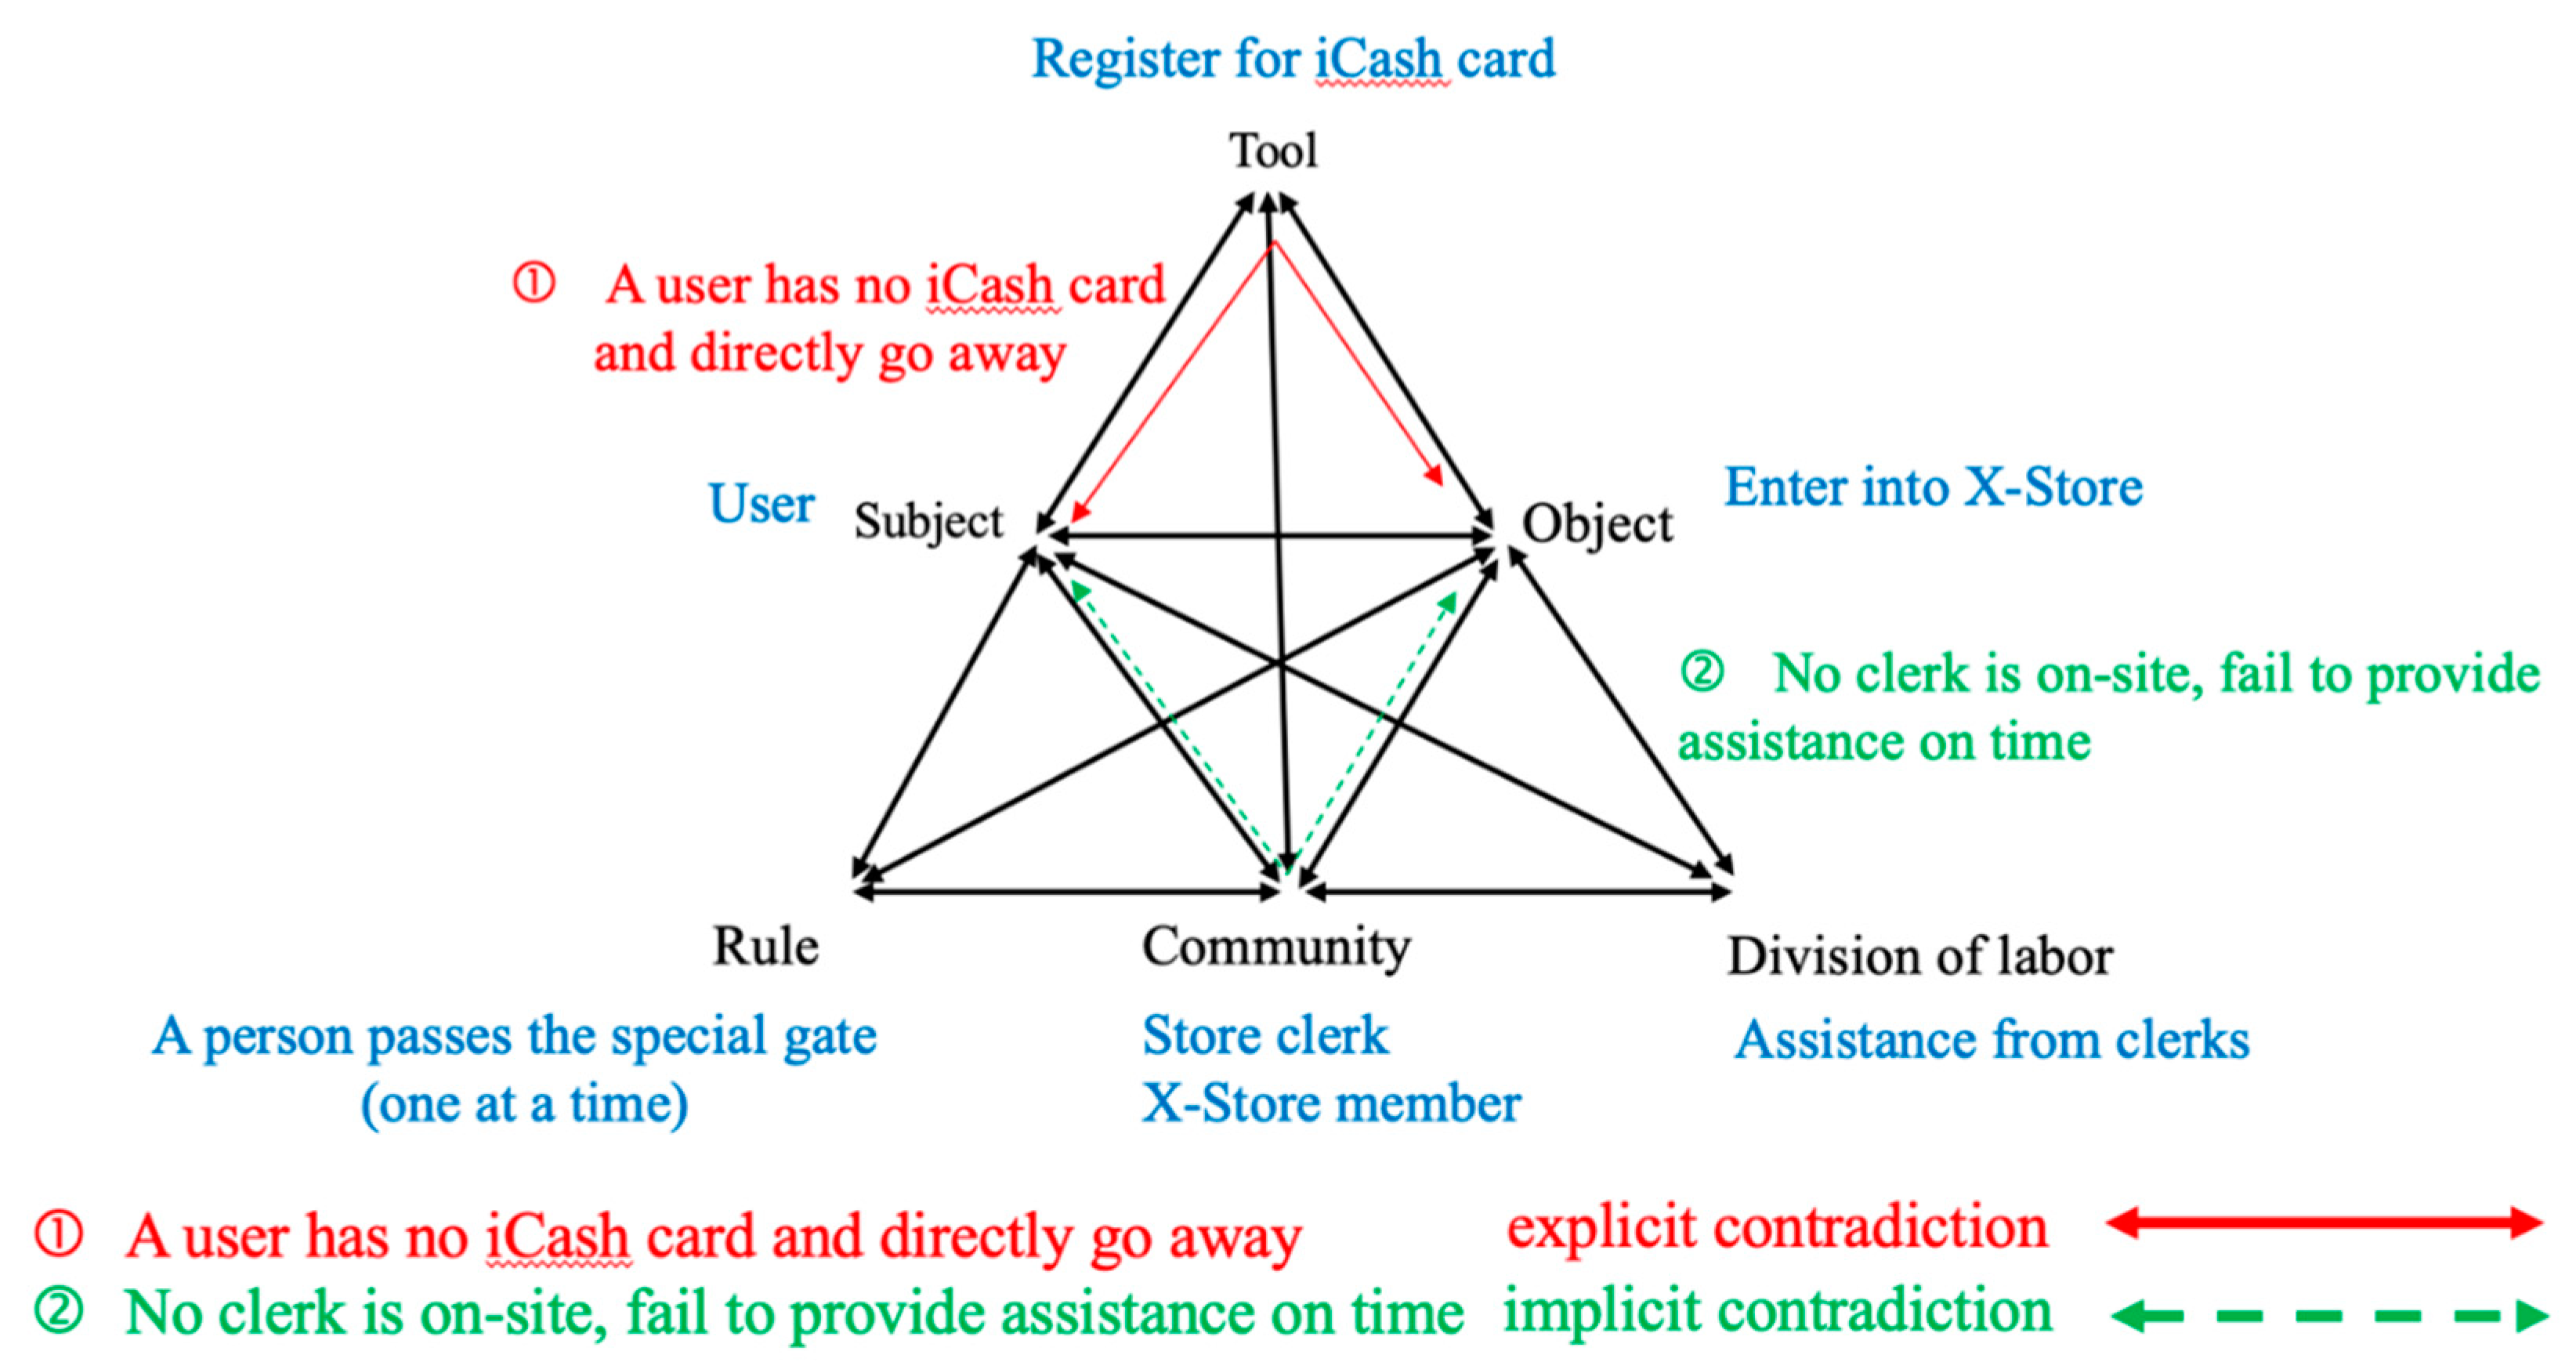
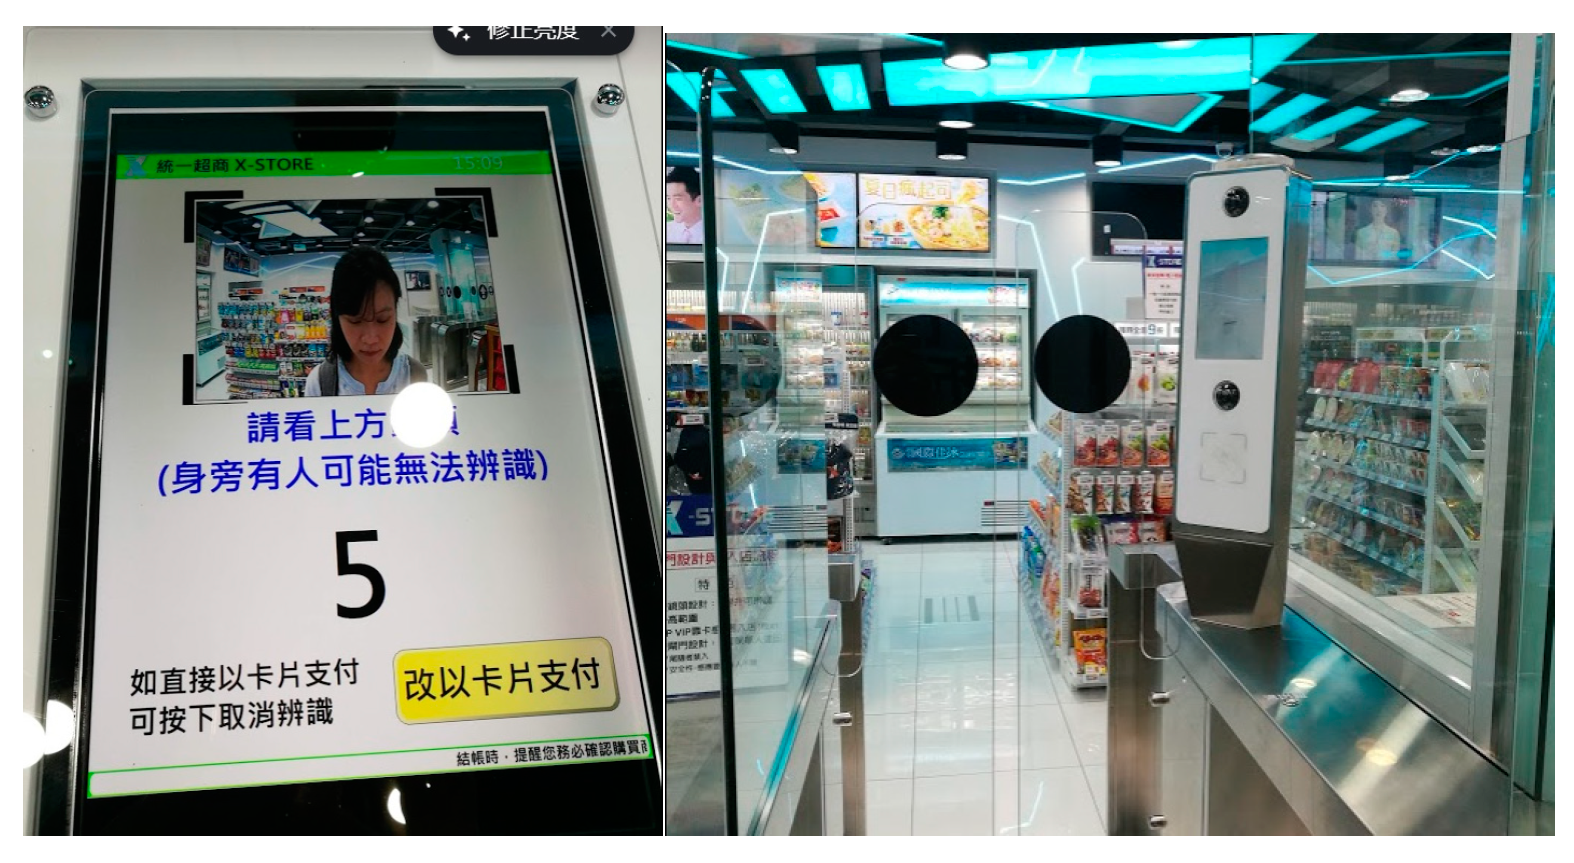
3.2. First Episode of Experience: Beginning of the Tangible Service

Description of the actual scenario:
Scenario 1: A user did not know X-Store is an unmanned store and entered to experience. However, he found the purchase can only be done by iCash cards so he decided to leave.
Scenario 2: A user saw the rule of purchase on-site. She needs to buy an iCash card in a 7-Eleven convenience store and register as a member to enter into the X-Store.
Analysis of the experience activity system:
  • Interaction tool:
  • iCase 2.0 card
  • Downloading OPENPOINT app and register
  • Facial recognition configuration
  • Object: Enter the X-Store
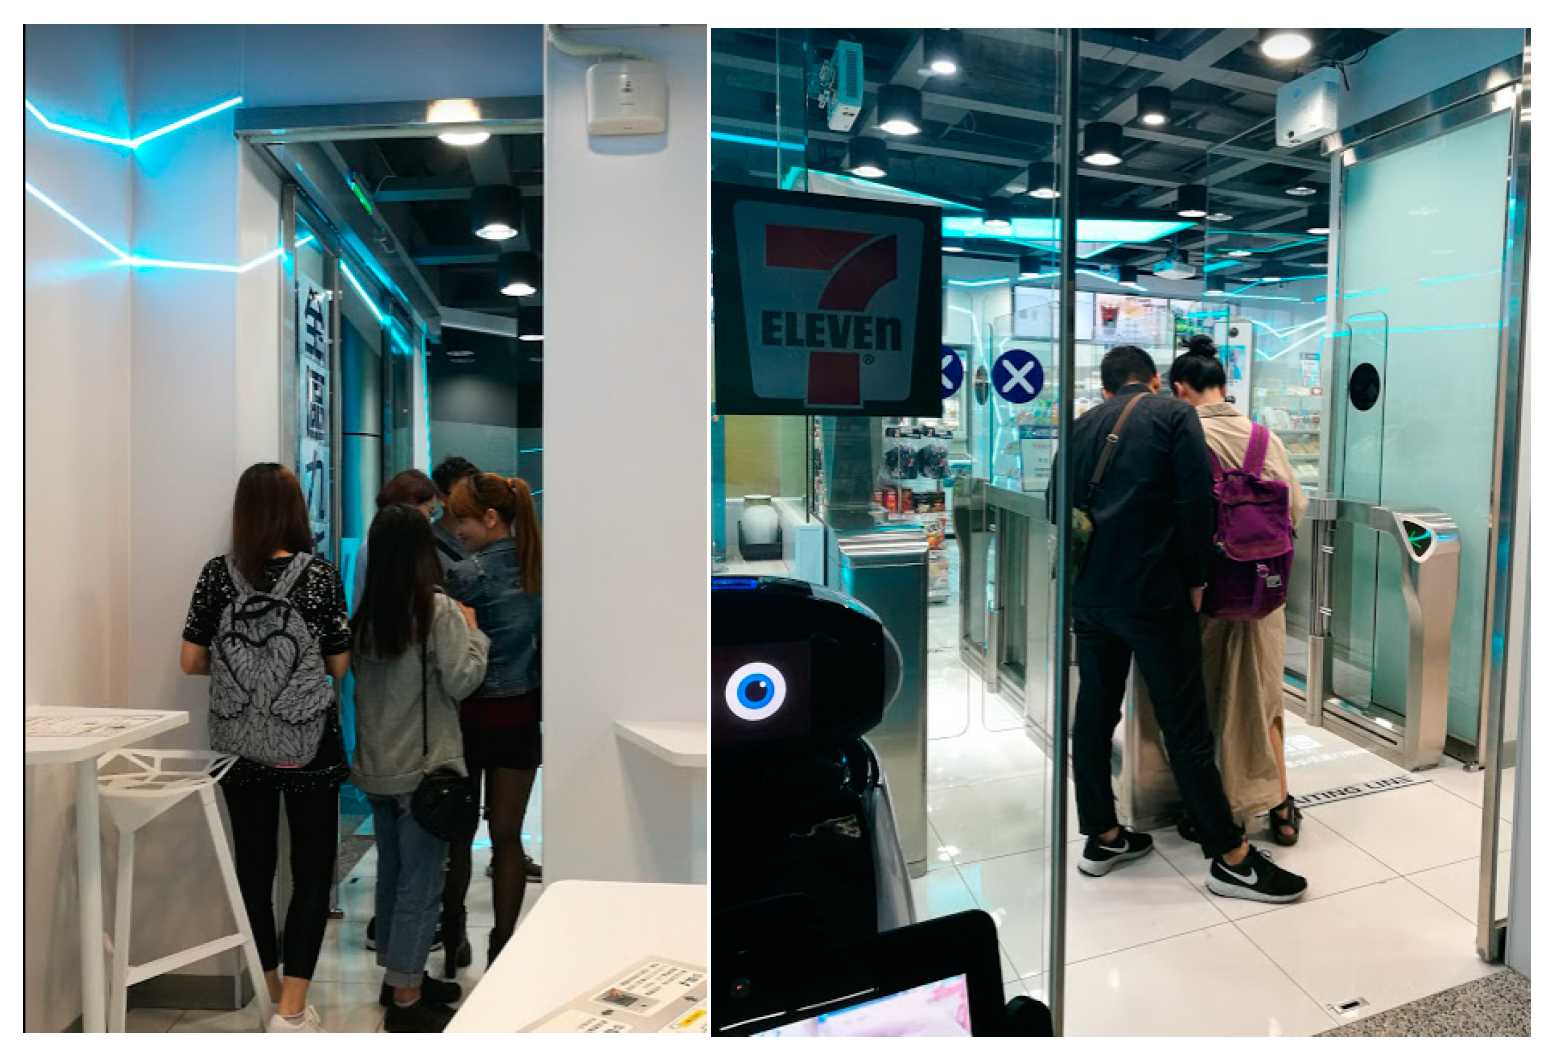
  • Rule: 1. Arrive on-site. 2. Pass the special gate (one at a time)
  • Stakeholder: clerks and other users
  • Division of labor: Assistance from the clerks
  • (Scenario 1) Explicit contradiction: A user does not have any iCash card and will go away.
  • Implicit contradiction: No clerk is available and therefore no assistance is provided (as shown in Figure 7).
It is known from the analysis of Scenario 1 that, when a user entered the X-Store, he realized that he has no iCash2.0 card (as a tool), his immediate response is to go away without experiencing the store. Therefore, the tool became the explicit disturbance during this stage. However, the factors that indirectly caused the user’s inconvenience and leaving are due to the fact that there was no clerk or apparent guidance to the user to buy an iCash card. Therefore, this is the implicit contradiction. Disturbance conclusion: When a user needed assistance, he did not know how to find a clerk or there was not clear instructions so he went away directly.
• (Scenario 2) (as shown in Figure 8)
Explicit contradiction: 1. A user took 10 min to register and felt unsettled and that there was something wrong with the facial recognition configuration.
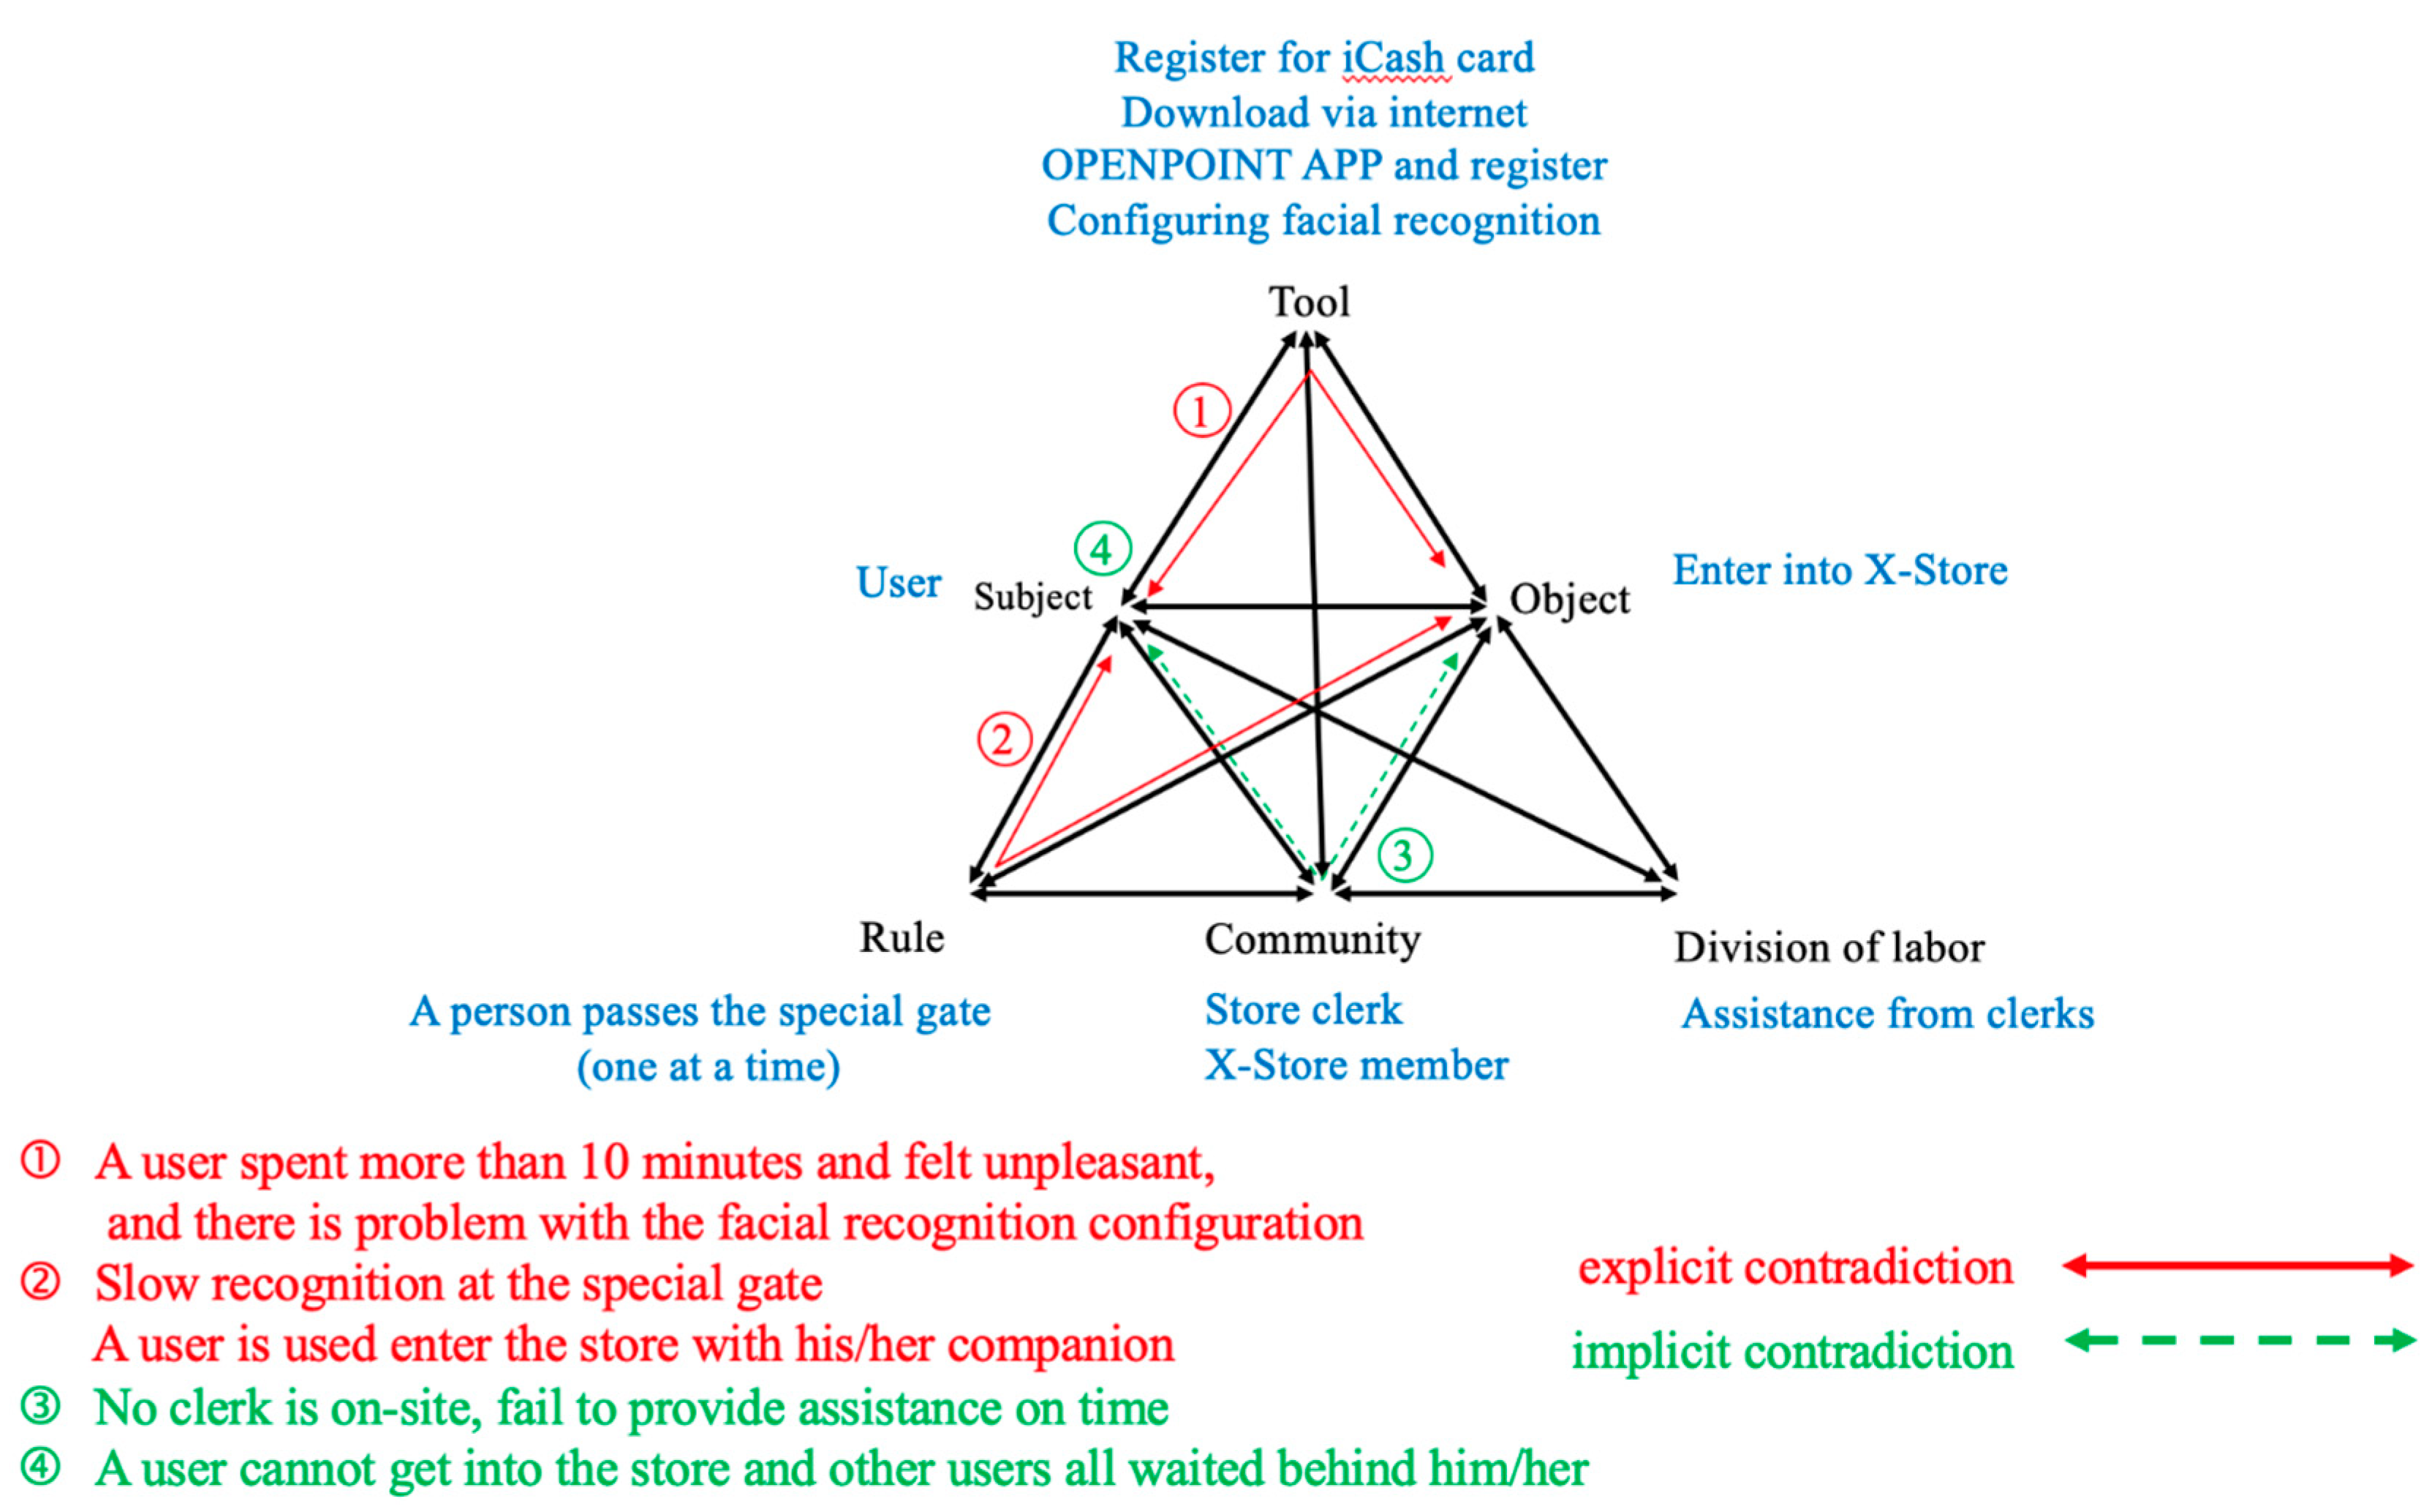
  • The gate is slow in recognition and a user got used to entering the store with his/her companion.
    Implicit contradiction: 1. No clerk is on-site and therefore no immediate assistance.
  • A user cannot enter the store and the users behind him all waited after him at the door.
It is known from the analysis of Scenario 2 that the explicit interferences for a user who has iCash2.0 card include (1) Something wrong with the app design of registration. It took 8~10 min on average to complete the registration and the user started to feel uncomfortable. (2) The gate allows only one person at a time. Moreover, other users who stand behind should keep a regulated distance to the former one. This is different from the typical gate design and a user might not be able to operate smoothly. Disturbance conclusion: (1) The registration process is complicated, or the instructions are not clear enough. This makes a user feel uncomfortable and may lead to them leaving directly. (2) Insufficient instructions or guidance cause inconvenience to customers or make clerks even busier in assisting the customers.

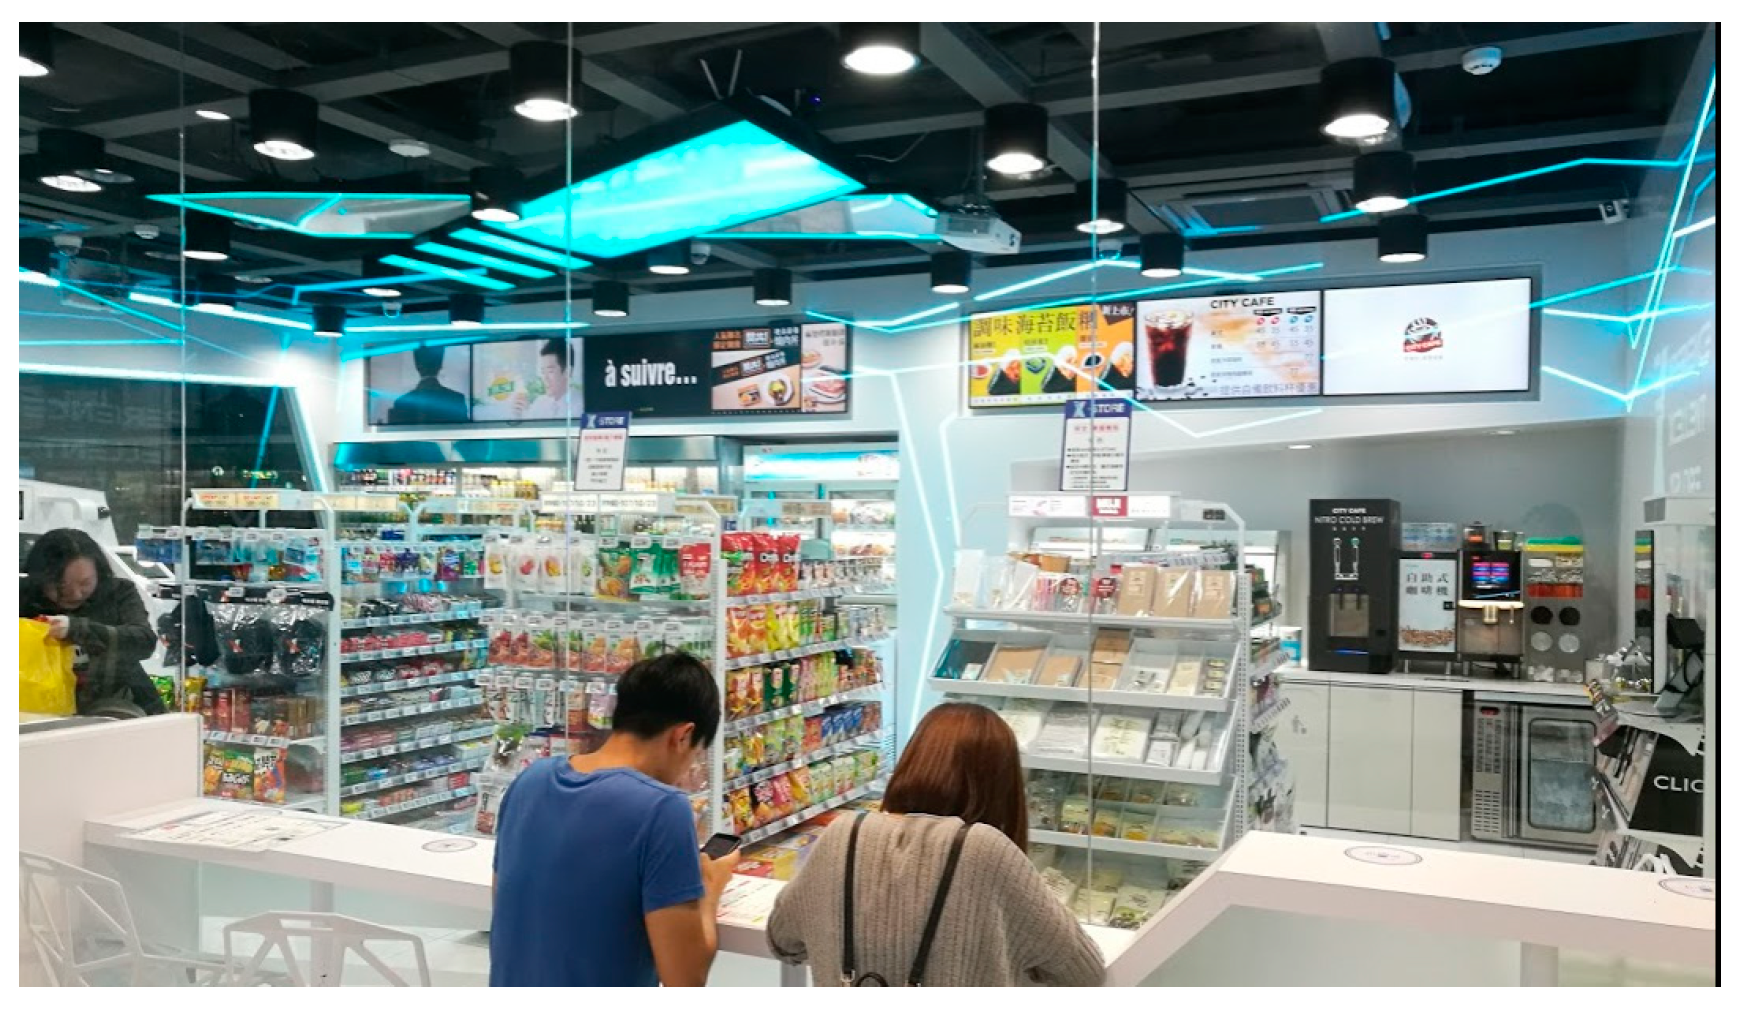
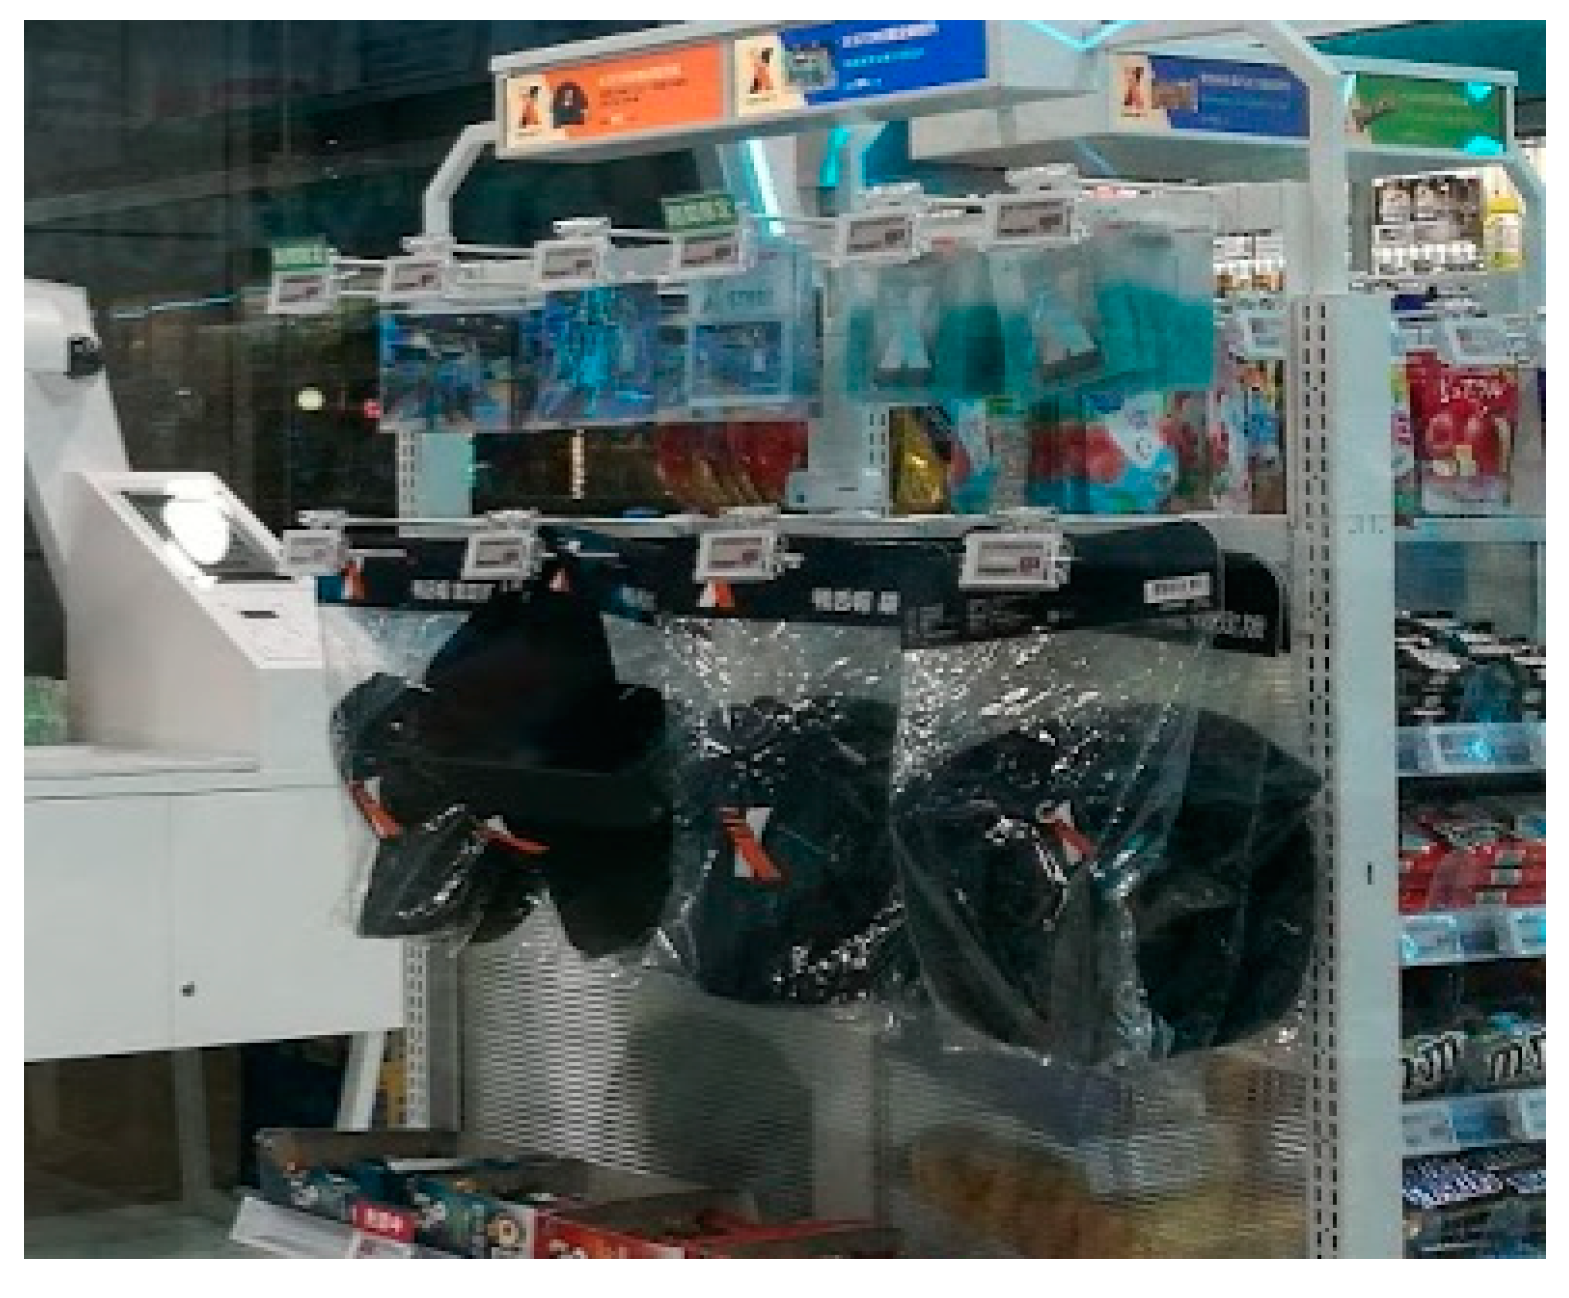
3.3. Second Episode of Experience: Beginning of the Immersive Service

Description of the actual scenario: A user is attracted by the self-checkout platform in the store. She took a look for a while and went along to see the goods. She found the electronic tags are different from traditional ones and stayed for a while. She then went to the self-drinks area which is at the end of the aisle and discussed the goods or configuration and then returned back to the cashier. When she passed by the self-drinks area, she saw no handle on the cabinet and the cabinet door opened when she reached out for a drink. The interaction between the drinks cabinet and the user caused surprise.
Analysis of the experience activity system: (see Figure 9)
  • Interactive tools:
  • Self-drinks area/automatic drinks cabinet
  • Goods area
  • ATM/add-value machine/coin machine
  • Guidance and instructions
  • Object: experience and shopping
  • Rule: experiencing and shopping in the regulated area
  • Stakeholder: X-Store members and clerks
  • Division of labor: Clerks replenished the goods on time and assisted the customers
  • Explicit contradiction: 1. Customers are confused with no clerk helping them. 2. Surprise with the automatic drinks cabinet.
  • Implicit contradiction: 1. No clear guidance on the automatic machine (which replaces the clerks). 2. Users are affected by other new systems such as Amazon Go.
It is known from the above analysis that during the second episode of the experience, the object is to allow users to use the facility or service that are provided by the X-Store in order to experience the shopping. The contradictions during this stage include positive energy of boosting the experience such as the design of the automatic drinks cabinet made users surprised and delighted. Some contradictions became the interference of negative experience. Disturbance conclusion: (1) Insufficient instructions or guidance of the self-serving area caused concerns or made customers unpleasant when no clerk was available. (2) User perception was affected by other new/old systems. For example, Amazon Go offers similar services as an unmanned store but its checkout method is different from X-Store’s.

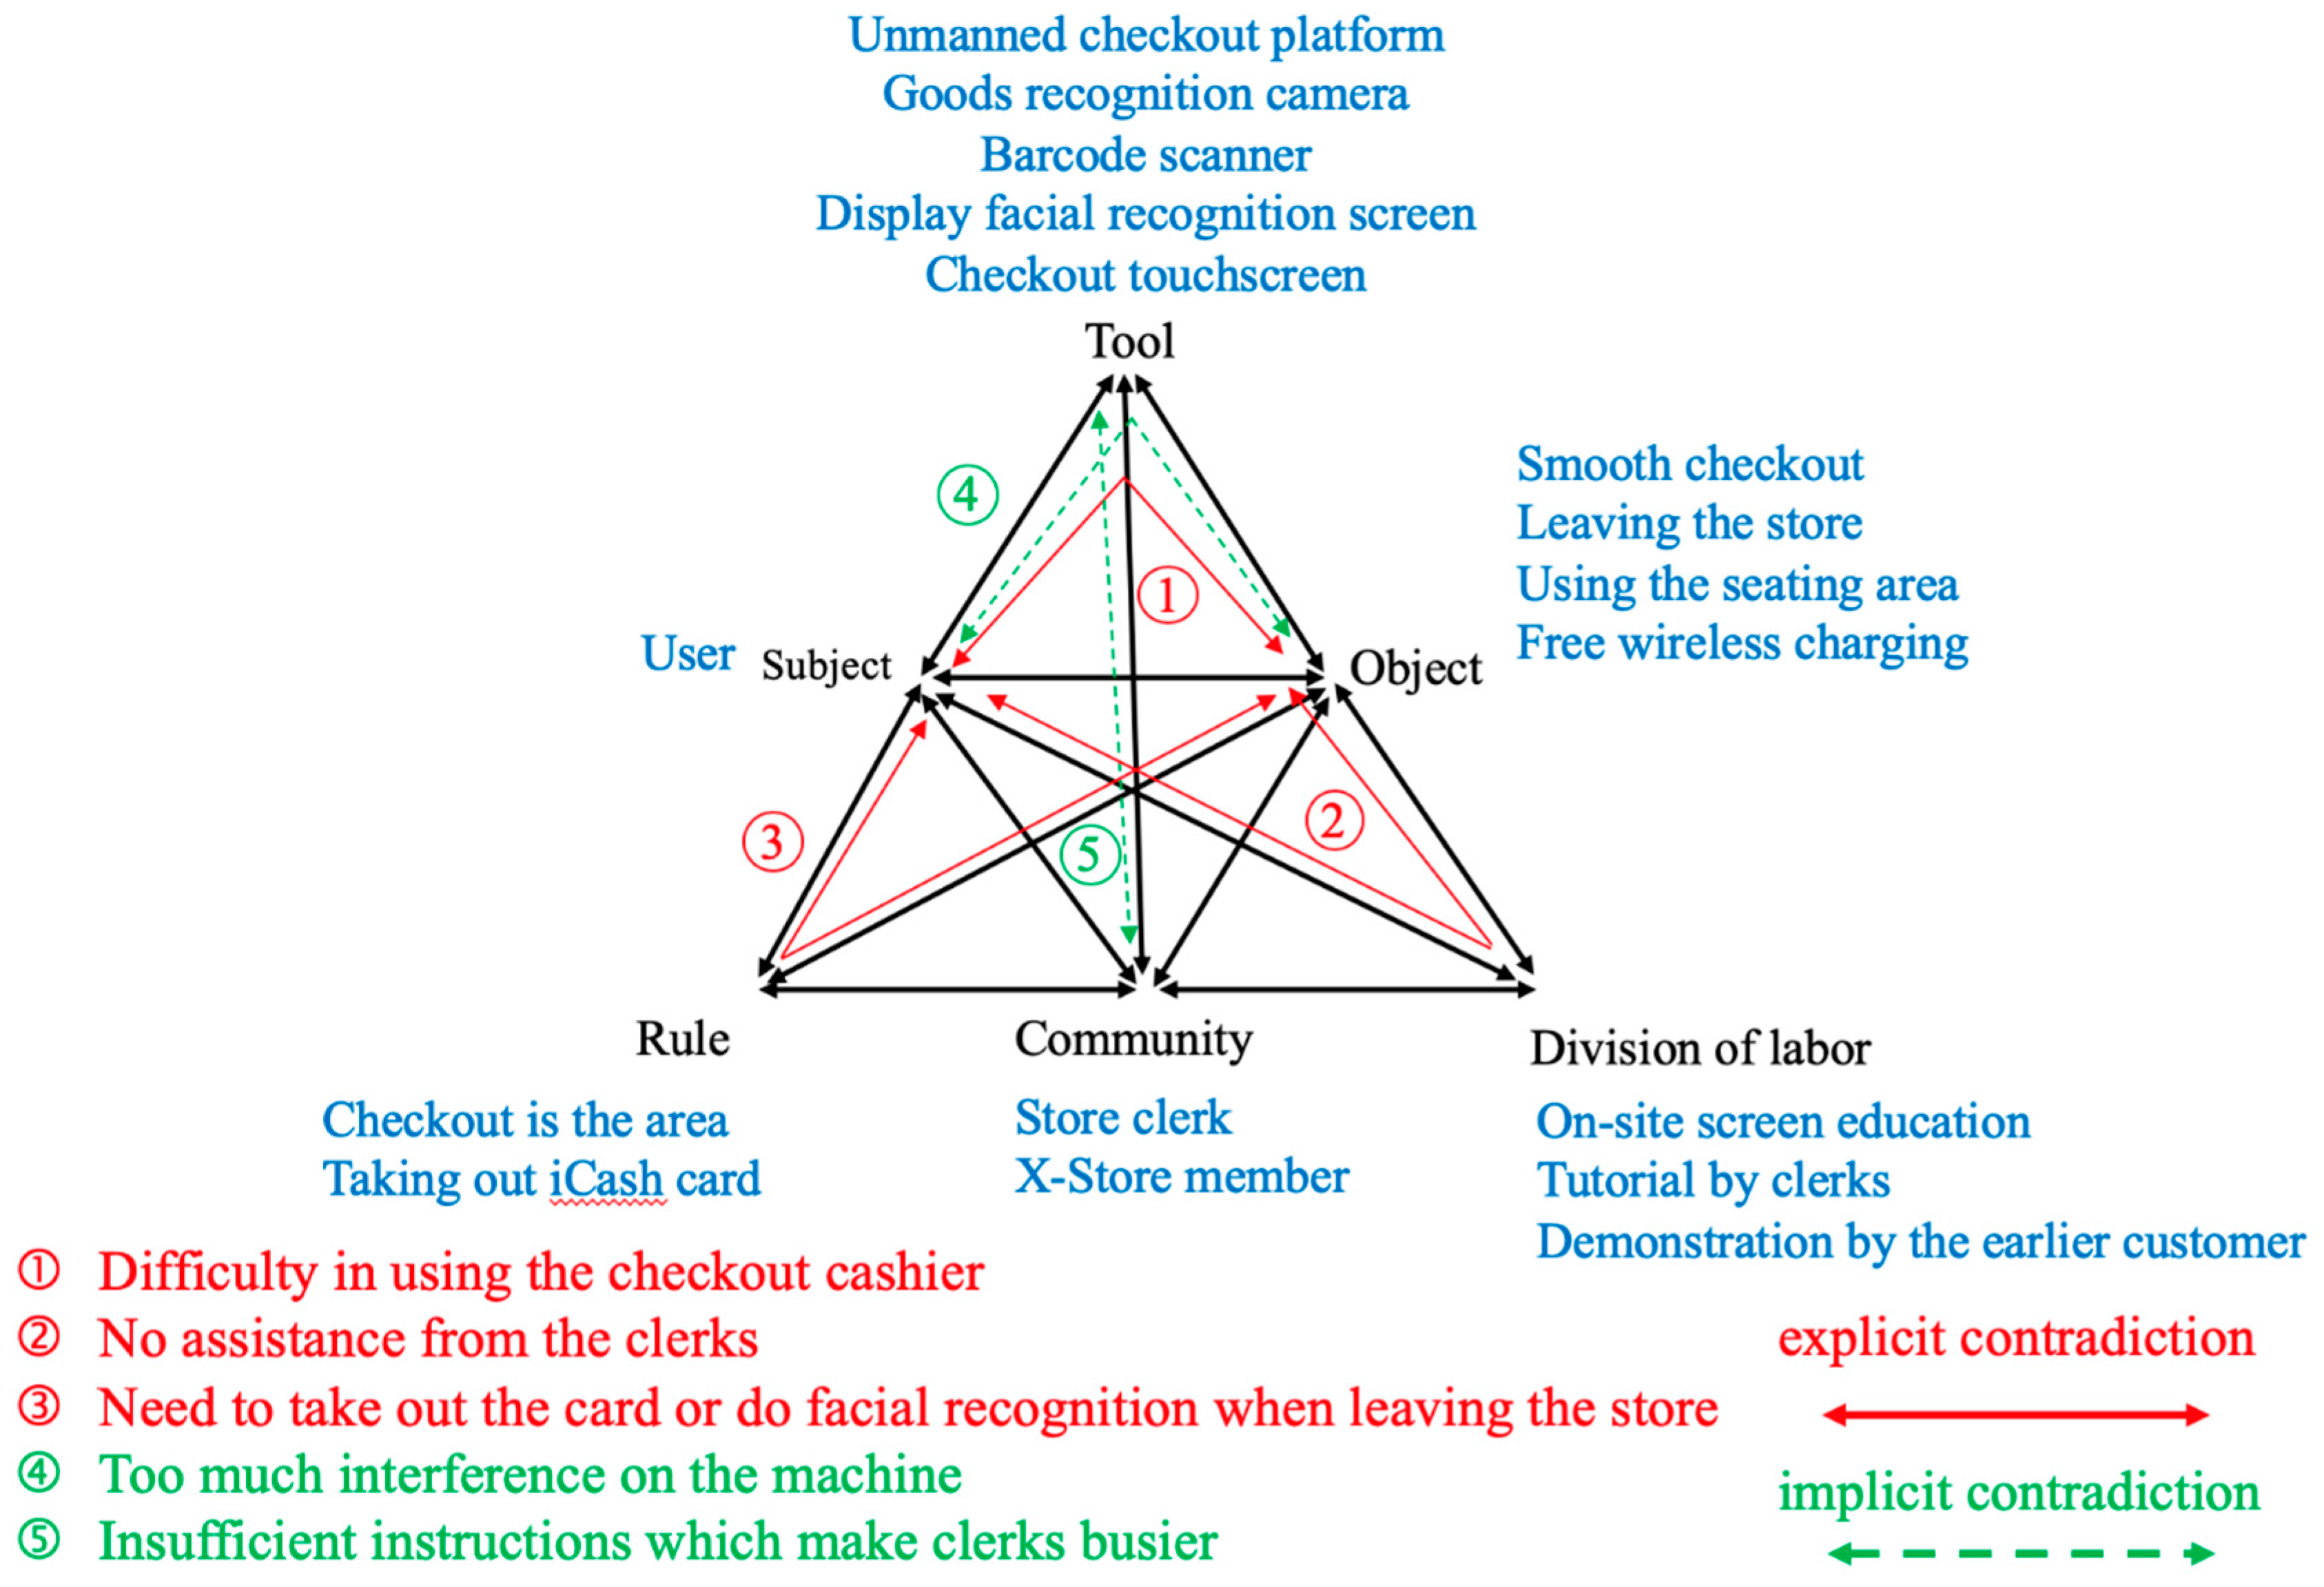
3.4. Last Episode of Experience: End of the Tangible Service

Description of actual scenario: A user is trying the self-checkout for the first time. He learned how to use this and that there is a camera which recognized the goods and the user at the cashier. However, the facial recognition failed and he could only use cards (i.e., iCash, EasyCard, and iPass) for checkout. When leaving the door, he needed to use the iCash card or by facial recognition again. After leaving the door, he could use the seating area and charge his cellphone.
Analysis of the experience activity system: (see Figure 10)
  • Interactive tools:
  • Goods-recognizing camera (top)/barcode scanner (front)
  • Facial recognition screen (top)/touchscreen (desktop)
  • Platform and coffee cups and tools on the platform
  • Object: Check out smoothly, leave the door and use the free charging service at the seating area
  • Rule: Check out in the defined area and took out iCash card
  • Stakeholder: X-Store members and clerks
  • Division of labor: Tutorials on the screen on-site, instructions by clerks, and demonstration by the former user
  • Explicit contradiction: 1. Difficulty in using the checkout machine. 2. No clerk to assist. 3. Needed to take out his/her iCash card again or pass the facial recognition when leaving the store.
  • Implicit contradiction: 1. A user was interfered by so many machines at the cashier. 2. Insufficient instructions made clerks busier than expected.
It is known from the above analysis that during the last episode of the experience, a user’s object is to check out by himself. The disturbance conclusion is as follows. 1. Disturbance in using the checkout machine due to the interface and the operation problems. 2. Insufficient instructions or guidance on the checkout machine so that a user felt inconvenienced. 3. Needed to take out iCash card or pass the facial recognition again when leaving the store (repetitive actions).

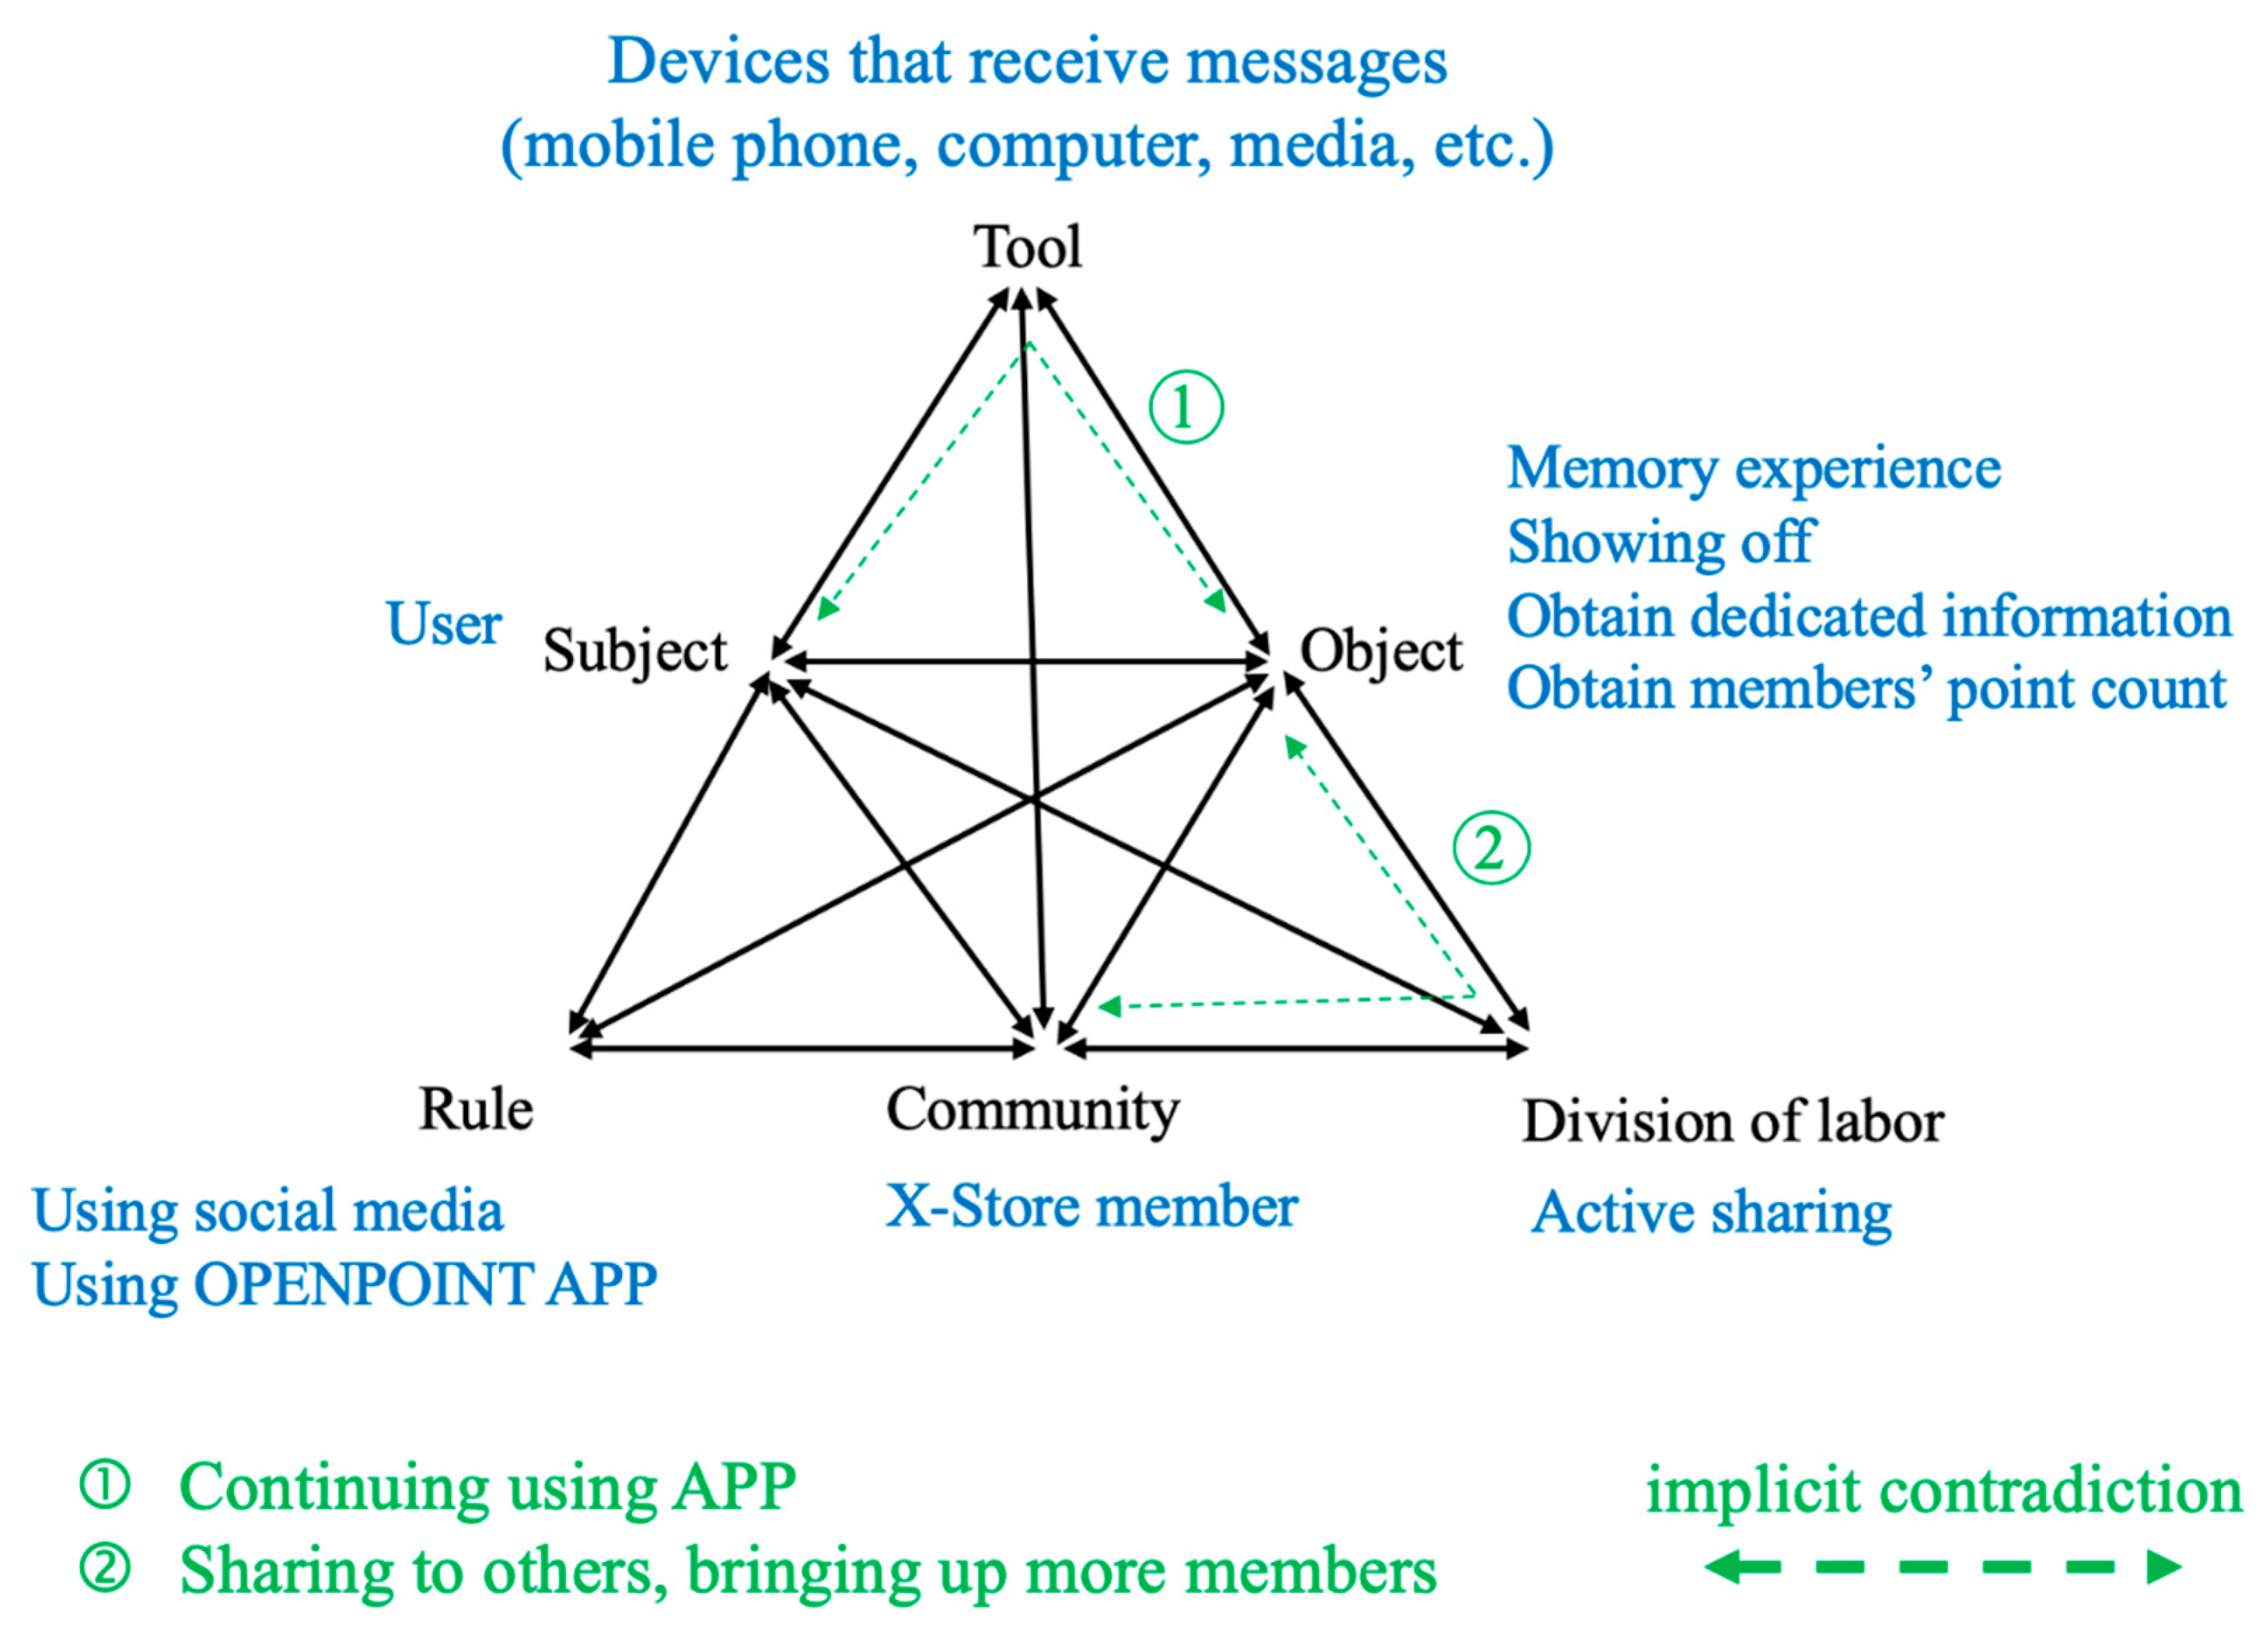
3.5. Side Plot of Experience: Continuous Fermentation of the Experience

Description of the actual scenario: After the experience, since a user has bound Open Point, he/she might visit the X-Store again if his/her experience of the unmanned store was good. He/she might even share his/her experience with friends or communities. Moreover, the bound Open Point keeps reminding the user about the remaining reward points for gifts or lucky draw activities. All of these lead to more interactions imperceptibly.
Analysis of the experience activity system: (see Figure 11)
  • Interactive tool: Devices that receive information
  • Object: Obtaining the information of unmanned stores’ new patterns
  • Rule: Using social media and the Open Point app
  • Stakeholder: X-Store members
  • Division of labor: Sharing actively
  • Implicit contradiction:
3.
Continuing using the app
4.
Sharing it to others and this might indirectly increase or reduce the member count
Finally, from the five episodes of the experience journey, the contradictions that appeared during various stages can be decomposed for the users and transformed into disturbances. The results can be summarized into Figure 12, which is the disturbance chart of the five stages. This can be further organized into the experience gaps of the user journey as shown in Table 4.
After the experience gaps of the users were determined, the next stage of research is to investigate the users’ evaluation of the X-Store. Therefore, the interview transcripts of those 20 participants in the second stage of interviews and users A~G in the fourth interviews were collected for further investigation. The vocabularies that were used by these participants were classified and the times of using these vocabularies were recorded. The classification principle is based on the three main elements of qualia experience which are respectively emotional scene, moving experience, and qualia design. After that, the essence of each vocabulary that was used by the participants was converted into general-purpose language, which served as the options in the follow-up questionnaire (such as the evaluation vocabulary counts in Table 5).

4. Case Study of User Experience Evaluation

In this study, the three elements of qualia experience were selected as the main constituent elements and they include emotional domain, moving experience, and qualia product. The scores of each of these three elements were calculated by the weighted arithmetic means. The items with the highest and the lowest evaluation scores can also be determined. After that, the quantification theory type I was used for analysis to determine the reliability of the data by determining the multiple correlation coefficient and the factors (smaller items) that caused the evaluation differences. The results are described as follows.
• Emotional domain
Via the quantification statistical questionnaire, it is known from Table 6 and Table 7 that the “entertainment feeling” has the highest score and the weighted arithmetic mean is 1.8, which indicates the range of agree to very agree. A total of 88 participants (84.61%) agreed with this domain. The multiple correlation coefficient is 0.696 by the quantification analysis and this indicated a strong correlation reliability. Among the items of “entertainment feeling”, the “automatic drinks cabinet” had the highest score as shown in Figure 13. On the contrary, the “escapist (away from the hustle and bustle)” had the lowest score with a weighted arithmetic mean of 2.5. The count of participants who agree or neither agree nor disagree reached 54 (51.92%). This is more than half of the total participants. The factors that had the lower scores indicated that the users were not able to do “immersive shopping”. Figure 14 shows users are studying how to check out in the unmanned store.
• Moving experience
Via the quantification statistical questionnaire, it is known from Table 8 and Table 9 that, the “sensory (stimulating) experience” has the highest score and the weighted arithmetic mean is 1.9, which indicates the range of agree to strongly agree. A total of 84 participants (80.7%) agreed with this domain. The multiple correlation coefficient is 0.7 by the quantification analysis and this indicated a strongly correlation reliability. Among the items of “sensory (stimulating) experience”, the “futuristic layout” had the highest score as shown in Figure 15. On the contrary, the “guiding to other ideas” had the lowest score with a weighted arithmetic mean of 2.13, which indicated neither agree nor disagree or agree. The factor that had the lower scores is “memory of limited souvenirs” as shown in Figure 16.
• Qualia product
Via the quantification statistical questionnaire, it is known from Table 10 and Table 11 that the “creative” has the highest score among all qualia products and the weighted arithmetic mean is 1.6, which indicates the range of agree to strongly agree. The multiple correlation coefficient is 0.916 by the quantification analysis and this indicated a strongly correlation reliability. Moreover, among the items of “creative”, the “facial recognition is available” had the highest score as shown in Figure 17. On the contrary, the “easy-to-operate” had the lowest score with a weighted arithmetic mean of 2.1, which indicated neither agree nor disagree or agree. The factor that had the lower scores is “app is not good enough” as shown in Figure 18.

5. Conclusions

Via the case study of users experiencing the X-Store unmanned store, the results of the questionnaire survey were analyzed by the activity theory with the users as the principal object. The analysis was to determine the gaps that were found during the course and the essential factors behind the evaluation when a user is shopping in an unmanned store or a store with few clerks.
By reviewing the experience patterns, experience economy types or the experience models that were proposed by several scholars, Taiwanese scholars proposed three main elements of the qualia experience model and they include the emotional domain, moving experience, and the qualia product, which incorporated the essence of various experience types that were proposed by scholars. The conclusions of this study are described for each stage of the research process.
  • Experience gaps of user experience
    • Insufficient or wrong online messages before the experience and this leads to higher or lower customer expectation.
    • When arriving at the unmanned store, the guidance or instructions of the self-serving area are insufficient so that a user gave a lower evaluation score since no clerk is available. The clerks could be busier later.
    • The registration process is complicated, or the instructions are not clear so that a user could simply go away without entering the store.
    • A user could be affected by the way of operating in other unmanned stores so that there could be a divide in his/her expectation of the on-site operation.
    • It is difficult to use the cashier machine since the interface and the operation are problematic.
    • Insufficient instructions or guidance on the cashier machine so that a user could feel inconvenienced.
    • When leaving the store, it is required to take out the iCash card or pass the facial recognition again (repetitive actions).
    • Bad experience could lead to bad word-of-mouth marketing results.
  • Summary of vocabularies that were used during the interviews
During the four visits to the X-Store, the results that were obtained from the preliminary interview of the 21 participants and the observation of the behavior of those 50 users indicated that, the users presented similar perceptions or preferences during the interview process. Therefore, the factors behind the vocabularies that were used by these users during these two interviews were described as follows.
  • Representative factors of the emotional domain
    • Entertainment feeling: light and sound effect, vivid commercials on screen, navigating robots, interactive automatic drinks cabinet
    • Education feeling: explanation of the collection of facial recognition data, new technology that is not available in other stores, labor-saving designs
    • Heart-warming feeling: futuristic environment, equipment with technological feeling, goods arranged tidily
    • Away from the hustle and bustle: futuristic environment, immersed in shopping, light and sound effect
  • Representative factors of the moving experience
    • Sensory experience: limited drinks, vivid commercials on screen, futuristic arrangement
    • Positive emotion: smooth self-operation, multiple goods, tasteful instant foods
    • Guiding to other ideas: memory of limited souvenirs, aftertaste of special goods, smart equipment and applications
    • Perceiving the labor-saving effect: self-checkout, self-serving drinks, small-scale stores
    • Triggering imagination: equipment with technological feeling, notification of discounts actively, discussing X-Store with other friends
  • Representative factors of the qualia product or facility
    • Aesthetics: special arrangement, goods arranged tidily, clean environment
    • Attractiveness: interactive drinks cabinet, goods that are limited, self-checkout with the drinks
    • Creativity: interactive drinks cabinet, several ways of checkout, facial recognition is available, navigating robots
    • Delicacy: consistent overall arrangement, fast facial recognition, sensors of automatic drinks cabinet work perfect
    • Easy to operate: app is easy to use, convenient access, fast checkout, drinks cabinets are convenient
Finally, among the experiences that are provided by the X-Store, the “entertainment feeling”, “sensory experience”, and “creativity” had the higher evaluation scores. The result was between agree to strongly agree. The factors which had higher scores included interactive drinks cabinet, futuristic arrangement, and facial recognition machine. On the contrary, the experience factors which had lower evaluation scores included away from the hustle and bustle, guiding to other ideas, and app is not easy to operate. The results are summarized in Table 12 as follows.

Author Contributions

Conceptualization, C.-H.L.; methodology, C.-H.L.; validation, Y.-W.W.; formal analysis, C.-H.L.; investigation, Y.-W.W.; resources, C.-H.L.; data curation, Y.-W.W.; writing—original draft preparation, Y.-W.W.; writing—review and editing, C.-H.L.; visualization, Y.-W.W.; supervision, C.-H.L.; project administration, C.-H.L.; funding acquisition, C.-H.L.

Funding

This work was supported by the Ministry of Science and Technology of the Republic of China under grant MOST 107-2221-E-029-021.

Conflicts of Interest

The authors declare no conflict of interest.

References

  1. Collins, C. Five Minutes with J.D. Power; Profiles: New York, NY, USA, 1996; p. 23. [Google Scholar]
  2. Hsiao, X.R. Grocery Stores in Early Taiwan; SunKids Culture Enterprise Co. Ltd.: Tai Pei, Taiwan, 2003. [Google Scholar]
  3. Chou, J.R. A psychometric user experience model based on fuzzy measure approaches. Adv. Eng. Inform. 2018, 38, 794–810. [Google Scholar] [CrossRef]
  4. Wang, Y.H.; Yu, S.H.; Xu, T. A user requirement driven framework for collaborative design knowledge management. Adv. Eng. Inform. 2017, 33, 16–28. [Google Scholar] [CrossRef]
  5. Lu, C.C.; Kang, S.C.; Hsieh, S.H.; Shiu, R.S. Improvement of a computer-based surveyor-training tool using a user-centered approach. Adv. Eng. Inform. 2009, 23, 81–92. [Google Scholar] [CrossRef]
  6. Hussain, J.; Hassan, A.U.; Muhammad Bilal, H.S.; Ali, R.; Afzal, M.; Hussain, S.; Bang, J.; Banos, O.; Lee, S. Model-based adaptive user interface based on context and user experience evaluation. J. Multimodal User Interfaces 2018, 12, 1–16. [Google Scholar] [CrossRef]
  7. Park, W.J.; Heo, H.Y.; Park, S.J.; Kim, J.M. A Study on the Presence of Immersive User Interface in Collaborative Virtual Environments Application. Symmetry 2019, 11, 476. [Google Scholar] [CrossRef]
  8. Norman, D.; Miller, J.; Henderson, A. What, You See, Some of What’s in the Future, and How We Go about Doing It: HI at Apple Computer. In Mosaic of Creativity, Proceedings of the CHI ’95 Conference on Human Factors in Computing Systems, Denver, CO, USA, 7–11 May 1995; ACM Press: New York, NY, USA, 1995; p. 155. [Google Scholar]
  9. Pine, J.; Gilmore, J. Welcome to the Experience Economy. Harv. Bus. Rev. 1998, 76, 97–105. [Google Scholar] [PubMed]
  10. Wang, C.J. The Model of Enjoyment Experience on Tourism Factory. Master’s Thesis, National Changhua University of Education, Changhua, Taiwan, 2014. [Google Scholar]
  11. Xia, Y.L.; Lu, W. The Era of Experience Economy; Cite Publishing Ltd.: Taipei, Taiwan, 2003. [Google Scholar]
  12. Pillan, M.; Costa, F.; Aureggi, M. The Complexity of Simple Goals: Case Study of a User-Centred Thermoregulation System for Smart Living and Optimal Energy Use. Sustainability 2019, 11, 3632. [Google Scholar] [CrossRef]
  13. Feng, L.; Wei, W. An Empirical Study on User Experience Evaluation and Identification of Critical UX Issues. Sustainability 2019, 11, 2432. [Google Scholar] [CrossRef]
  14. Feng, L.; Sun, B.P.; Wang, K.; Tsai, S.B. An Empirical Study on the Design of Digital Content Products from a Big Data Perspective. Sustainability 2018, 10, 3092. [Google Scholar] [CrossRef]
  15. Ma, N.; Chau, H.W.; Zhou, J.; Noguchi, M. Structuring the Environmental Experience Design Research Framework through Selected Aged Care Facility Data Analyses in Victoria. Sustainability 2017, 9, 2172. [Google Scholar] [CrossRef]
  16. Li, D.L.; Yang, C.T.; Lin, R.T. A Study of In-depth Experience of Customers in the Design of Service Domains. In Proceedings of the 15th Symposium of Chinese Institute of Design, University of Science and Technology, Southern Taiwan, 13 February 2010; pp. 1054–1059. [Google Scholar]
  17. Searle, J. The Rediscovery of Mind; MIT Press: Cambridge, MA, USA, 1992. [Google Scholar]
  18. Lin, R.T. Investigating qualia experience designs from service innovation thinking. J. Design. Sci. 2011. [Google Scholar]
  19. Hong, C.I.; Chen, J.L.; Lin, R.T. Investigating the Qualia Experience Model of Tourism Factory from the Standpoint of Social Design. J. Design 2017, 22, 69–92. [Google Scholar]
  20. Chien, C.W.; Chen, S.J.; Lin, R.T. The Research on Transforming the Intangible Qualia Experience to Tangible Products. J. Arts 2017, 101, 57–77. [Google Scholar]
  21. Vygotsky, L.S. Mind in Society; Harvard University Press: Cambridge, MA, USA, 1978. [Google Scholar]
  22. Engeström, Y. Learning by Expanding: An Activity-Theoretical Approach to Development Research; Orienta-Konsultit: Helsinki, Finland, 1987. [Google Scholar]
  23. Engeström, Y. Chapter 2 the tensions of judging: Handling cases of driving under the influence of alcohol in Finland and California. In Interactive Expertise: Studies in Distributed Working Intelligence; Department of Education, University of Helsinky: Helsinky, Finland, 1992; pp. 29–63. [Google Scholar]
  24. Engeström, Y. Activity theory and individual and social transformation. In Perspectives on Activity Theory; Engeström, Y., Miettern, R., Punamakl, R., Eds.; Cambridge University Press: Cambridge, UK, 1999. [Google Scholar]
  25. Engeström, Y. Activity theory as a framework for analyzing and redesigning work. Ergonomics 2000, 43, 960–974. [Google Scholar] [CrossRef] [PubMed]
  26. Engeström, Y. Disturbance management and masking in a television production team. In From Teams to Knots: Activity-Theoretical Studies of Collaboration and Learning at Work, 1st ed.; Engeström, Y., Ed.; Cambridge University Press: Cambridge, UK, 2008; pp. 22–47. [Google Scholar]
  27. Engeström, Y.; Sannino, A. Studies of expansive learning: Foundations, findings and future challenges. Educ. Res. Rev. 2010, 5, 1–24. [Google Scholar] [CrossRef] [Green Version]
  28. Chen, J.Y. Analysis of the Application of Activity Theory to the Doctor-patient Interaction of the Information Technology Mediation. Master’s Thesis, Chia Nan University of Pharmacy and Science, Tainan City, Taiwan, 31 July 2014. [Google Scholar]
  29. Cheng, S.P. Applying Activity Theory to Explore the Service Delivery Model of Telehealthcare: Perspectives on Service Promoting Process of Patients with Stroke Disease. Master’s Thesis, Chia Nan University of Pharmacy and Science, Tainan City, Taiwan, 16 June 2014. [Google Scholar]
  30. Carlson, J.; Rahman, M.M.; Rosenberger, P.J.; Holzmüller, H.H. Understanding communal and individual customer experiences in group-oriented event tourism: An activity theory perspective. J. Mark. Manag. 2016, 32, 900–925. [Google Scholar] [CrossRef]
  31. O’Keefe, M.; Wade, V.A.; McAllister, S.; Stupans, I.; Burgess, T.A. Improving management of student clinical placements: Insights from activity theory. BMC Med. Educ. 2016, 16, 1–10. [Google Scholar] [CrossRef] [PubMed]
  32. Song, B.S.; Kim, T.Y. Teacher (de)motivation from an Activity Theory perspective: Cases of two experienced EFL teachers in South Korea. System 2016, 57, 134–145. [Google Scholar] [CrossRef]
  33. Camacho, T.D.; Foth, M.; Rakotonirainy, A.; Rittenbruch, M. Understanding urban rail in-vehicle activities: An activity theory approach. Transport. Res. F-Traf. 2017, 46, 70–86. [Google Scholar] [CrossRef] [Green Version]
  34. Hirsh, Å.; Segolsson, M. Enabling teacher-driven school-development and collaborative learning: An activity theory-based study of leadership as an overarching practice. Educ. Manag. Adm. Lead. 2019, 47, 400–420. [Google Scholar] [CrossRef]
Figure 1. Four types of experience. Source: Pine and Gilmore [9].
Sustainability 11 04965 g001
Figure 2. Qualia experience model.
Sustainability 11 04965 g002
Figure 3. Activity system model. Source: Engeström [26].
Sustainability 11 04965 g003
Figure 4. Flowchart of user experience evaluation model.
Sustainability 11 04965 g004
Figure 5. Five segments of user experience journey.
Sustainability 11 04965 g005
Figure 6. Experience prequel of the activity system.
Sustainability 11 04965 g006
Figure 7. First episode of experience for the activity system (Scenario 1).
Sustainability 11 04965 g007
Figure 8. First episode of experience for the activity system (Scenario 2).
Sustainability 11 04965 g008
Figure 9. Second episode of experience for the activity system.
Sustainability 11 04965 g009
Figure 10. Last episode of experience for the activity system.
Sustainability 11 04965 g010
Figure 11. Side plot of experience for the activity system.
Sustainability 11 04965 g011
Figure 12. Summary of the disturbances of five stages.
Sustainability 11 04965 g012
Figure 13. X-Store automatic drinks cabinet.
Sustainability 11 04965 g013
Figure 14. Users studying the way of checking out in the X-Store.
Sustainability 11 04965 g014
Figure 15. Real scene of the X-Store.
Sustainability 11 04965 g015
Figure 16. Dedicated souvenirs of X-Store.
Sustainability 11 04965 g016
Figure 17. Facial recognition system at the entrance and the cashier.
Sustainability 11 04965 g017
Figure 18. Users who would like to understand app registration.
Sustainability 11 04965 g018
Table 1. Four types of experience economy.
Economic ModelAgricultureIndustryServiceExperience
Economic productPrimary productProcessed productServiceExperience
Economic functionExcavate and extractManufactureProvideDemonstrate
Product propertyReplaceableTangibleIntangibleUnforgettable
Characteristic featureNaturalStandardizedCustomizedPersonalized
Supply mannerMass storageInventory after productionDistribution by demandDemonstration during a certain period of time
SellerDealerManufacturerProviderDemonstrator
BuyerMarketUserCustomerCustomer
Demanding elementCharacteristicDistinguishing featureBenefitUnique perception
Source: Xia and Lu [11].
Table 2. Transformation as the new competition foreground.
Primary ProductGoodsServiceExperienceTransformation
What is the ProductMaterialProductOperationCircumstanceIndividual
StartNew material discoveredNew invention developedNew product plannedNew script portrayedNew target determined
ExecutionExtraction is the core activity of dealersManufacturing is the core activity of manufacturersProviding is the core activity of suppliersDemonstration is the core activity of demonstratorsGuidance is the core activity of nucleus of activities
CorrectionThe impoverished evoked others to exploreA question evokes the patching to objectsA response evokes a questionForgetting evokes the preservation of memoryA relapse evokes stronger determination
ApplicationTrade that links marketsTransaction that links usersInteraction that links customersCircumstance that links customersPerseverance that links willing minds
Source: Xia and Lu [11].
Table 3. Transforming into the interviewee context – before the experience.
UserInterview Context UnitTransformed into Interviewee Context
#CI learned online that this store allows you to check out automatically. I thought this is not something special since there are already many overseas supermarkets offering this kind of service with no checkout operator by using this facility. You need only ask a consumer to scan the barcode so that he/she can check out.I learned online in advance to see how others are discussing the way of checking out in the X-Store.
#DI bought a drink by myself. The process was quite smooth since I’ve already seen others online.I saw videos of others entered the X-Store for operations.
#EWhen I took a drink, I did not know whether it counts when I picked it up or when I took it to the cashier.I know the way of checking out in Amazon Go is simply taking the item but do not know X-Store’s.
Table 4. Summary of experience gaps in the journey.
User Experience JourneyScenarioDisturbances of the Activity Theory
Prologue of experienceIntangible servicesInsufficient or wrong messages which lead to higher or lower customer expectations.
First episode of experience Beginning of the tangible services 1. Do not know where to find a clerk when needing assistance.
2. Insufficient instructions or guidance which lead to inconvenience of customers or made customers busier.
3. Complicated registration process or unclear instructions so that customers might simply go away.
Second episode of experience Immersive services1. Insufficient instructions or guidance of the self-serving area when no clerk is available so that there are concerns or unpleasant feelings.
2. Customers’ perception might be affected by other systems.
Last episode of experienceEnd of the services 1. Trouble in using the checkout cashier due to interface or operation problems.
2. Insufficient instructions or guidance of the cashier which lead to inconvenience of customers.
3. Needed to take out the iCash card or pass the facial recognition again when leaving the store (repetitive actions).
Side plot of experienceContinuous fermentation of the services Bad experience could lead to bad word-of-mouth marketing results.
Table 5. Counts of evaluation vocabularies.
Vocabularies used by Interviewees (Count)Category (Item)No.Item (Small Category)
Special light and music (1)
Many short commercials (screen) (3)
Seems like in an amusement park with many robots (1)
Interactive drinks cabinet (7)
X1-1 Entertainment1Light and sound effects
2Vivid commercials on screen
3Navigating robots
4Interactive automatic drinks cabinet
Other purpose of registering the facial recognition (1)
Machines and facilities that are not familiar with (3)
Special checkout platform (2)
Labor-saving configuration (5)
X1-2 Education1Explanation of the collection of facial recognition data
2New technology that is not available in other stores
3Labor-saving designs
Futuristic decorations (8)
Special checkout platform (2)
Machines and facilities that are not familiar with (3)
Tidy arrangement (2)
X1-3 Heart-warming and delighted1Futuristic environment
2Equipment with technological feeling
3Goods arranged tidily
Overall environment is comfortable (3)
Futuristic decorations (8)
Seems like in an amusement park with many robots (1)
Special light and music (1)
X1-4 Away from the hustles and bustles1Futuristic environment
2Immersed in shopping
3Light and music
Tasteful limited drinks (3)
Many short commercials (screen) (3)
Special light and music (1)
X2-1 Sensory experience1Limited drinks
2Vivid commercials on screen
3Futuristic arrangement
Smooth checkout (2)
Goods are largely identical but with minor differences (4)
Buy and eat (2)
X2-2 Positive emotion1Smooth self-operation
2Multiple goods
3Tasteful instant foods
Instant noodles and hats of limited edition (2)
Advanced equipment and applications (2)
Special checkout platform (2)
Cabinets that automatically open and close (10)
X2-3 Guiding to other ideas1Memory of limited souvenirs
2Aftertaste of special goods
3Smart equipment and applications
Labor-saving design (5)
No need for clerks to make drinks (3)
Require not much manpower due to the smaller scale (1)
X2-4 Perceiving the labor-saving effect1Self-checkout
2Self-serving drinks
3Small-scale stores
Machines and facilities that are not familiar with (3)
Special checkout platform (2)
Seems like in an amusement park with many robots (1)
Get other friends to see (2)
APP for collecting reward points and redeem for gifts (2)
X2-5 Triggering imagination1Equipment with technological feeling
2Notification of discounts actively
3Discussing X-Store with other friends
Futuristic decorations (8)
Tidy arrangement (2)
Overall environment is comfortable (3)
X3-1 Aesthetic 1Special arrangement
2Goods arranged tidily
3Clean environment
Cabinets that automatically open and close (10)
Instant noodles and hats of limited edition (2)
Fast self-checkout (4)
X3-2 Attractive1Interactive drinks cabinet
2Goods that are limited
3Self-checkout with the drinks
Cabinets that automatically open and close (10)
Expectation of checkout by facial recognition (1)
Convenient access by facial recognition (5)
Seems like in an amusement park with many robots (1)
X3-3 Creative1Interactive drinks cabinet
2Several ways of checkout
3Facial recognition is available
4Navigating robots
Special light and music (1)
Futuristic decorations (8)
Machines and facilities that are not familiar with (3)
X3-4 Delicate1Consistent overall arrangement
2Fast facial recognition
3Sensors of automatic drinks cabinet work perfect
APP for collecting reward points and redeem for gifts (2)
Access by facial recognition is very convenient (5)
Cabinets that automatically open and close (10)
Shortened checkout time (2)
X3-5 Easy to operate1Apps is easy to use
2Convenient access
3Fast checkout
4Drinks cabinets are convenient
Table 6. User evaluation table of emotional domain.
When experiencing the X-Store, which description can describe the degree of your perception?Entertainment feelingAnswer countPercentageWeighted average
Strongly agree3432.69%Between strongly agree and agree
1.8
Agree5451.92%
Neither agree nor disagree1211.54%
Disagree43.85%
Strongly disagree00%
Education feelingAnswer countPercentageWeighted average
Strongly agree1716.35%Between agree and neither agree nor disagree
2.3
Agree4038.46%
Neither agree nor disagree3937.50%
Disagree87.69%
Strongly disagree00%
Aesthetic feelingAnswer countPercentageWeighted average
Strongly agree2928%Between strongly agree and agree
1.9
Agree5552.88%
Neither agree nor disagree2019.23%
Disagree00%
Strongly disagree00%
Feeling of away from the reality (Away from the hustle and bustle)Answer countPercentageWeighted average
Strongly agree1716.35%Between agree and neither agree nor disagree
2.5
Agree3331.73%
Neither agree nor disagree4139.42%
Disagree109.62%
Strongly disagree32.88%
Table 7. User evaluation factors of emotional domain.
 
 
Valid Sample Size: 104
Dependent Variable: Y
Independent Variable:ItemsCategory Count
X1-1 Entertainment4
X1-2 Education3
X1-3 Aesthetic (warms the heart and delights the eye)3
X1-4 Escapist (away from hustle and bustle)3
 
 
No.ITEM (Small Category)ScorePartial Coefficient of Correlation
X1-1 Entertainment1Sound and light effect−2.63699340.611282557
2Vivid commercials on screen−0.3886291
3Navigating robots−1.9610108
4Interactive automatic drinks cabinet1.0067396
X1-2 Education1Explanation of the collection of facial recognition data−0.81570780.308052416
2New technology that is not available in other stores−0.0941243
3Labor-saving design0.80293475
X1-3 Aesthetic (warms the heart and delights the eye)1Environment of futuristic feeling−0.3152480.257239272
2Equipment with technological feeling−0.2440858
3Goods arranged tidily0.75408063
X1-4 Escapist (away from hustle and bustle)1Environment of futuristic feeling0.299528380.046000371
2Immersed in shopping−0.0473321
3Sound and light effect0.00165714
Constant 15.3846154
Multiple correlation coefficient = 0.696663652863141
Coefficient of determination (square of multiple correlation coefficient) = 0.485340245220615
Table 8. User evaluation factors of moving experience.
After experiencing the X-Store, what was your perception at the moment?Stimulus to the sensesAnswer countPercentageWeighted average
Strongly agree3028.85%Between strongly agree and agree
1.9
Agree5451.92%
Neither agree nor disagree1918.27%
Disagree10.96%
Strongly disagree00%
Positive emotionAnswer countPercentageWeighted average
Strongly agree2927.88%Between agree and neither agree nor disagree
2.0
Agree4543.27%
Neither agree nor disagree2927.89%
Disagree10.96%
Strongly disagree00%
Guiding to other ideasAnswer countPercentageWeighted average
Strongly agree2322.12%Between agree and neither agree nor disagree
2.13
Agree4745.19%
Neither agree nor disagree3129.81%
Disagree32.88%
Strongly disagree00%
Perceiving the labor-saving effectAnswer countPercentageWeighted average
Strongly agree4038.46%Between strongly agree and agree
1.92
Agree4139.42%
Neither agree nor disagree1413.46%
Disagree99%
Strongly disagree00%
Triggering imaginationAnswer countPercentageWeighted average
Strongly agree2524.04%Between agree and neither agree nor disagree
2.06
Agree4644%
Neither agree nor disagree3129.81%
Disagree21.92%
Strongly disagree00%
Table 9. User evaluation factors of moving experience.
 
 
Valid Sample Size: 104
Dependent Variable: Y
Independent Variable:ItemsCategory Count
X2-1 Sensor experience3
X2-2 Positive emotion3
X2-3 Guiding to other ideas3
X2-4 Perceiving the labor-saving effect3
X2-5 Triggering imagination3
 
 
Category (Item)No.ITEM (Small Category)ScorePartial Coefficient of Correlation
X2-1 Sensor experience1Limited drinks−1.4011787440.241764885
2Vivid commercials on screen−0.230242463
3Futuristic decorations0.373454508
X2-2 Positive emotion1Smooth self-operation−0.6918114820.396809763
2Multiple goods1.18988394
3Tasteful instant foods2.352715702
X2-3 Guiding to other ideas1Memory of limited souvenirs−1.5974462040.371228342
2Aftertaste of special goods−0.36725341
3Smart equipment and applications0.815841197
X2-4 Perceiving the labor-saving effect1Unmanned checkout−0.460799380.279724299
2Self-serving drinks0.826927104
3Small-scale store1.348587804
X2-5 Triggering imagination1Equipment with technological feeling−0.9570445460.403806726
2Notification of discounts actively1.013818621
3Discussing X-Store with other friends0.817540882
Constant 19.91346154
Multiple correlation coefficient = 0.700527914959168
Coefficient of determination (square of multiple correlation coefficient) = 0.490739359637039
Table 10. User evaluation factors of qualia product.
How would you like to describe X-Store to others?AestheticsAnswer countPercentageWeighted average
Strongly agree3230.77%Between strongly agree and agree
1.86
Agree5552.88%
Neither agree nor disagree1615.38%
Disagree10.96%
Strongly disagree00%
AttractivenessAnswer countPercentageWeighted average
Strongly agree3735.58%Between strongly agree and agree
1.82
Agree5048.08%
Neither agree nor disagree1514.42%
Disagree21.92%
Strongly disagree00%
CreativityAnswer countPercentageWeighted average
Strongly agree5149.04%Between strongly agree and agree
1.6
Agree4442.31%
Neither agree nor disagree76.73%
Disagree21.92%
Strongly disagree00%
DelicacyAnswer countPercentageWeighted average
Strongly agree3432.69%Between strongly agree and agree
1.96
Agree4442.31%
Neither agree nor disagree2221.15%
Disagree43.85%
Strongly disagree00%
Easy-to-operateAnswer countPercentageWeighted average
Strongly agree2826.92%Between agree and neither agree nor disagree
2.1
Agree3937.50%
Neither agree nor disagree3230.77%
Disagree43.85%
Strongly disagree10.96%
Table 11. User evaluation factors of qualia product.
 
 
Valid Sample Size: 104
Dependent Variable: Y
Independent Variable:ItemsCategory Count
X3-1 With aesthetic perception3
X3-2 Attractive3
X3-3 Creative4
X3-4 Delicate3
X3-5 Easy-to-operate4
 
 
Category (Item)No.ITEM (Small Category)ScorePartial Coefficient of Correlation
X3-1Aesthetics1Special arrangement−0.384250.309845879
2Goods arranged tidily0.7432077
3Clean environment0.9467652
X3-2Attractiveness1Interactive drinks cabinet−0.4949360.30231535
2Goods that are limited0.6092559
3Self-checkout with the drinks0.5033414
X3-3Creativity1Interactive drinks cabinet−3.084650.704571753
2Several ways of checkout−0.049453
3Facial recognition is available1.844772
4Navigating robots0.4941689
X3-4Delicacy1Consistent overall arrangement−0.772870.259038883
2Fast facial recognition−0.296057
3Sensors of automatic drinks cabinet work perfect0.2517705
X3-5Easy-to-operate1App is easy to use−2.0042320.611501267
2Convenient access−1.878118
3Fast checkout−0.41567
4Drinks cabinets are convenient1.2430368
Constant 20.586538
Multiple correlation coefficient = 0.916737111017968
Coefficient of determination (Square of the multiple correlation coefficient) = 0.840406930717571
Table 12. Conclusion of user evaluation.
Qualia ExperienceEmotional DomainMoving ExperienceQualia Product
All itemsEntertaining
Educational
Aesthetic perception
Away from hustle and bustle
Sensory experience
Emotional experience
Action experience
Association experience
Thinking experience
Creative
Aesthetic perception
Attractive
Delicate
Easy-to-operate
Items with a higher level of satisfactionEntertaining
(weighted average 1.8)
Sense experience
(weighted average1.9)
Creative
(weighted average 1.6)
Factors of itemAutomatic drinks cabinetLayout with futuristic feelingFacial recognition is available
Items with a lower level of satisfactionAway from hustle and bustle
(weighted average 2.5)
Guiding to other ideas (thinking)
(weighted average 2.13)
Easy-to-operate
(weighted average 2.1)
Factors of itemNot able to immerse in shoppingNo memory of limited souvenirsAPP is not good enough

