Article

Mapping the Emotional Experience of Travel to Understand Cycle-Transit User Behavior

1
Department of Geography, Planning, and Sustainability, School of Earth and Environment, Rowan University, Glassboro, NJ 08028, USA
2
Office of Sustainability, West Chester University, West Chester, PA 19383, USA
*
Author to whom correspondence should be addressed.
Sustainability 2019, 11(17), 4743; https://doi.org/10.3390/su11174743
Submission received: 23 June 2019 / Revised: 25 August 2019 / Accepted: 28 August 2019 / Published: 30 August 2019
(This article belongs to the Special Issue Sustainable Mobility: Social, Technological and Environmental Issues)

Abstract

:
People experience emotions during travel. Driving, riding a bicycle, taking transit, and walking all involve multiple mental processes, potentially leading to various ranges of emotions such as fear, anger, sorrow, joy, and anticipation. Understanding the link between emotions and transportation environments is critical to planning efforts aiming to bring about a more environmentally sustainable society. In this paper, we identified, geo-coded, analyzed, and visualized emotions experienced by cycle–transit users, or CTUs, who combine bicycling and public transit in a single trip. We addressed two research questions: (1) What types of emotions do CTUs experience, why, and where? (2) How can mapping and understanding these emotions help urban planners comprehend CTU travel behavior and build a more sustainable transportation system? Based on 74 surveys completed by CTUs in Philadelphia, USA, we performed a content analysis of textual data and sketch maps, coded for emotional content, attached emotions with geo-referenced locations using GIS, and finally created four types of emotional maps. Overall, CTUs expressed 50 negative and 31 positive sentiments. Anger was the most frequently identified emotion, followed by disgust, fear, sadness, and joy. Twenty-five transportation planners reviewed the maps; the majority found that the maps could effectively convey an emotional account of a journey, opinions on routes and locations, or emotions attached to them. This paper advances theory and practice in two ways. First, the method privileges a heretofore little examined form of knowledge—the emotional experience of CTUs—and transportation planners confirm the value of this knowledge for practice. Second, it extends the study of emotional geographies to the transportation environment, pointing out venues for additional planning interventions. We conclude that mapping emotions reveals a more comprehensive understanding of travel experience that aids in better transportation planning and happier neighborhoods.

1. Introduction

The experience of travel—from leisurely drives and evening strolls to crashes and road rage incidents—can elicit strong emotions. Fear, anger, sorrow, joy, and anticipation are only some of the emotions that may be elicited by the act of walking, riding a bicycle, driving a car, taking transit, traveling in an airplane, or by the actions of other travelers sharing spaces with us. The emotions experienced can be intense or mild; they can endure in our memories or fleetingly be replaced by other thoughts. Such experiences, however, occur because the environment—including the transportation environment—interacts with people’s biological endowment and psychological state to affect how they feel [1].
Understanding the link between emotions and non-motorized transportation is critical to planning efforts aiming to bring about a more environmentally sustainable society. Non-motorized forms of mobility are essential to reducing the use of fossil fuels and managing the environmental crisis that humanity now faces, though people are extraordinarily reluctant to give up their cars [2]. While the use of non-motorized transportation (such as walking and biking) has risen [3], vehicle miles traveled (VMT) have also increased [4]. These combined transportation and sustainability trends unfold against the backdrop of calls to increase the constituency that understands the environmental hazards of the 21st century—of which climate change is the main cause [5]. Mobility is closely connected to human emotions and a person’s pursuit of his or her own interests, and these connections yield a powerful motivator for human actions [6]. Any effort to increase an advocacy constituency around sustainability and climate change mitigation, therefore, must fully understand the conditions that affect decisions around non-motorized transportation usage. Ballas and Dorling [7] specifically call for future work that explores the link between emotional states and individual behaviors—such as a person choosing amongst different transportation modes—that yield a more sustainable society when aggregated.
Researchers have begun to acknowledge and study how emotions are affected by travel behavior. In recent years, for example, the field of happiness studies—which encompasses analysis of both positive and negative emotions—has influenced scholars of travel behavior. The study of happiness is a wide-ranging field of inquiry that focuses on understanding how people achieve positive mental states. This focus necessitates the study of emotions, feelings, and sentiments that can inhibit or support positive mental states. Safety experts have long examined the ways in which distractions, including intense emotions, can create dangerous situations and contribute to risky behavior. More recently, studies of the association between emotions and travel behavior have contributed to research on subjective well-being and how it is affected by travel [8,9,10]. Only a few researchers, however, have measured the full range of emotions experienced during travel or attempted to link those emotions to specific locations and interactions along travelers’ routes. In part, this gap in our knowledge is due to the difficulty of identifying and geo-referencing emotions, but it is also due to the complexity of any study of human emotions.
In this paper, we analyze a survey of cycle–transit users (or CTUs—people who combine bicycling and public transit in a single trip), conducted in Philadelphia, Pennsylvania [11], and create maps to visualize the emotions of these travelers. Responses to two open-ended questions in this survey, including one that invited respondents to illustrate a specific multimodal trip with words and sketch maps, provided an opportunity to assess a novel method of linking emotions to locations along travelers’ routes.
Two research questions organize our work on this study:
  • What types of emotions do CTUs experience as they travel, what are the reasons behind those emotions, and how do those emotions relate to specific geographic locations?
  • How can mapping and understanding these emotions help urban planners comprehend CTU travel behavior and build a more sustainable transportation system?
In conducting this study, we demonstrate the methodological and practical value of mapping and visualizing emotional responses to travel. In particular, by using content analysis—a technique that quantifies communication artifacts (in this case, text comments, sometimes linked to hand-drawn visualizations of geographic features)—together with geographic information system (GIS) tools, subjective impressions of travel experiences are linked to quantitative, objectively geo-referenced locations. Our results suggest that data that go beyond traditional socio-economic indicators used in travel behavior analysis (e.g., household income, demographics, vehicle ownership, and attitudes towards modal choices) hold potential to understand mode choices and other aspects of travel behavior. This work is critical given the limited options available to local government policymakers to improve well-being [12]. Yet, Mulgan [12] also notes that people who spend more time in the outdoors report increased feelings of well-being and positive emotions. By understanding the barriers as well as the enticements to cycle, local governments can initiate policies that increase the likelihood that people will spend time outdoors. One of the implications of our analysis is that we can better plan for “happy neighborhoods” [13] by understanding geographies that promote positive sentiments and emotions for CTUs. Our work will inform future government policies aimed at creating a more sustainable society.
We start with a literature review on the intersection of human emotions, travel behaviors, and places. We then describe our research methodology and the data sets we used for this study. Next, our findings are documented, including the types of CTU emotional responses experienced, the reasons behind them, and how the locations of those emotional responses can be depicted in map form. Expert transportation planners’ perceptions of the potential utility of these results for professional practice are discussed. The final sections focus on the implications of this study, methodological challenges that we identified, and recommendations for future research.

2. Literature Review

2.1. Happiness Studies: Yielding Insight into the Range of Human Emotions from Psychological Research to Planning Interventions

Researchers have produced frameworks and categorizations of human emotions that reflect the historical lineage of multiple ways of conceptualizing and understanding this concept [14]. Psychologists took the lead in this effort, but neuroscience and other medical sciences, history, sociology, economics, and other fields have also made important contributions. In this study, we have used a categorization of human emotions originally developed by Robert Plutchik, an American psychologist known for his development of a psycho-evolutionary theory of emotions, in which emotions are understood to be adaptations to physical and social environments [15]. Plutchik categorized emotions in a “wheel” format of eight primary emotions organized in contrasting pairs: Joy and sadness, anger and fear, trust and disgust, and surprise and anticipation (see Figure 1).
Researchers in the field of sentiment analysis have built on Plutchik’s model to assess the emotional and sentiment content of text and other documentation (see, for example, [16]). Mohammad and Turney [17] developed a word–emotion association lexicon for this purpose, which we also use in our analysis. The method permits analysis of relationships between human emotions and travel behavior, but has not been widely nor deeply explored for this purpose.
Reacting to the not-so-distant past, in which emotions were rarely acknowledged in formal research studies, Kwan [18], citing Anderson and Smith [19], argued for explicit analyses of emotions in everyday life: “If the world is imbued with complex emotional geographies, [geospatial technology] practices are more relevant to real lives if they allow us to take the spatial, temporal, and social effects of feelings into account”. [18] (p. 24). A growing number of scholars recognize this importance of human emotions in a variety of contexts, including physical and space-based contexts. Geographers have led the way in linking human emotions to place and space [7], and urban planners have seen value in this line of inquiry.
With mounting evidence that happiness and other emotional states are influenced by the environment, and that such states have impacts on health, Pfeiffer and Cloutier [13] outlined the need to study the role that urban planners can play in increasing mental and emotional health among a population. In addition, as reported by Pfeiffer and Cloutier [13] (p. 275), Diener [20] found that “people from diverse cultures and varying levels of affluence spend similar amounts of time thinking about happiness and ascribe similar importance to it”. Planners’ significant role in government efforts to shape the environment, such as facilitating outdoor access and designing transportation infrastructure to be safe and appealing to users of all modes of travel, provides an excellent starting point. Due to the fact that outdoor access and physical activity have been shown to improve feelings of happiness, planners have a clear policy direction to prioritize access to these opportunities. Interventions can take a variety of forms [7]. This signals the broad applicability of including happiness planning for diverse communities. There is also clear evidence that access to mobility affects emotions and happiness [21], though it is an open question as to how varying transportation environments exert an influence. This paper will help fill that gap.

2.2. Connection between Human Emotions, Travel Behavior, and Place

The connection between emotions and travel behavior is, to some extent, intuitive and straightforward: It would not be difficult for most people to remember times when their travels, whether to a grocery store down the block or to destinations on other continents, elicited a strong emotional reaction of one kind or another. However, this intuitive link between travel behavior and the emotional and psychological lives of travelers has not often been studied. Schiefelbusch [22] argued that this is so because of the origins of traffic and transportation planning in the empirical worlds of engineering and economics. Sheller [23] and Sheller and Urry [24], as others in the field of “mobility studies” (represented by geographers, sociologists, anthropologists, and other disciplines) have done, explored the many emotions that connect human beings to cars and the mobility that cars permit. Nevertheless, analyzing the link between transportation and emotions in travel behavior remains uncommon. This is problematic because it is well known that mobility is essential for individual benefits along with societal advancement [25]. Scholars have also sought to understand how different transportation environments limit or amplify human emotions by either removing or connecting the human body with the surrounding environment. Further still, some transportation environments become places of non-engagement, while others offer deep relatedness [6]. All of these issues signal the complexity involved in studying the human behavior resulting from emotions and mobility, and how variation may occur across transportation environments. Kwan cites the complexity involved in studying the socio-spatial mediation of emotions as increasingly of interest to feminist scholars. She describes how several scholars have begun the process of using geospatial technology to not only express the emotions of research participants, but also to effect broader social change given such visualizations [18].
Research on happiness and subjective well-being has found connections between both affect (positive and negative) and emotions, on the one hand, and various features of travel behavior, on the other. Morris and Guerra [26,27] identified significant, albeit small, associations between trip mode, duration, and purpose with mood. Controlling for demographic and individual-specific attributes, bicycle trips were associated with the strongest positive emotions, while car passengers and drivers experienced less positive emotions; alternatively, transit users more regularly experienced negative emotions. Other researchers have focused on a generalized sense of satisfaction with travel [28] or have developed composite indices to represent subjective well-being as measured by a “satisfaction with travel” scale [29,30], in both cases incorporating positive and negative feelings or affects, a concept related to emotions. These researchers concluded that bringing the concepts of emotions and affect into travel behavior analysis holds the potential to improve planning and design of transportation systems and infrastructure.
Artists and geographers have addressed these associations too, at both epistemological and ontological levels. The San Francisco Emotions Map [31,32], part of a series that included similar maps created in Paris, Greenwich, and six other cities, was an art and mapping project that collected geo-referenced data from volunteers wearing a finger cuff sensor, which recorded the wearer’s galvanic skin response (GSR). Participants later interpreted their body’s responses by identifying the emotions they felt and providing explanatory comments. The resulting map combined comments with participant-interpreted emotional responses to specific locations in the South Mission neighborhood of the city. This work carefully linked the process of knowing with the places in which emotions were experienced. Similarly, Keenan [33] demonstrated a place-based ontology of risk perception that was influenced by fear, and he linked this ontology to the transportation environment. While geographers have long known that place affects emotion [34], the most recent evidence signals that both ways of knowing and the understanding of reality are affected by the transportation environment. This paper extends the analysis to cyclist’s and transit users’ environments—ones that have yet to be examined.

3. Materials and Methods

The research design for this study built upon data collection and analysis described in a survey of CTUs in Philadelphia, Pennsylvania, and San Francisco, California [11]. The original paper, published in 2014, assessed the distances traveled on bicycle by CTUs and included two types of CTUs: People who bicycled to transit stops and stations and people who traveled on transit with their bicycles. The paper concluded that transit catchment areas could be much larger for CTUs than for traditional transit users who accessed transit buses and rail on foot. CTUs in both cities took advantage of larger catchment areas to reduce their travel costs. Our paper focuses on only the Philadelphia CTU responses. Philadelphia CTUs were surveyed from 3 to 9 December 2012, at several major transportation centers and transit stations (e.g., 30th Street Station, Jefferson Station, Suburban Station, and the Wissahickon Transit Center). In total, 297 surveys were disseminated: 10 surveys were completed on site, 130 were directly handed to CTUs, and 157 were left on bicycles parked outside transportation centers and transit stations. All surveys not completed in person were accompanied by an addressed and stamped envelope to ease the return process. This process generated 74 usable surveys.
The majority of Philadelphia CTUs surveyed were college educated, white, and male; 74% of respondents had a bachelor’s degree or higher, 74% identified as white, and 78% identified as males. The average age of CTUs surveyed was 38, reflecting a wide range of ages for respondents (the oldest being 65 and the youngest being 19). Reported household income was also diverse with an even distribution across categories. A large majority of respondents (77%) reported possessing a license to drive, and 61% reported having access to a car. A full report of demographic and socioeconomic characteristics for CTUs surveyed can be found in Table 1.
A significant resource from the original surveys—sketch maps and/or written text comments completed by 65% of the total 150 respondents—were only acknowledged in that article and not fully analyzed [11]. The evident emotional content of many of these responses to open-ended questions required tools not available with standard descriptive statistical analysis. To study them more fully, sketch- and text-based content analysis and qualitative mapping were required.

3.1. Data

Of the 74 respondents who participated in the Philadelphia survey, 59 drew sketches and 62 provided comments. The quality and details provided in those sketches varied. All sketches included points for origin and destination and a brief description of the commute pattern or transportation options. One third of the sketches offered detailed descriptions of the surrounding built environment. Figure 2a, for example, includes a river (characterized by curved lines and three fish), bridges, the Center City skyline, and a crown to represent King of Prussia, a suburban employment center. The accompanying text includes details about the routes and modes of transportation the respondent chose to commute from home to work, as well as some emotions associated with this commute. Figure 2b, on the other hand, offered only minimal information.
The open-ended comments (n = 62) mostly focused on general opinions, feelings, or emotions related to the daily commute of CTUs. In many cases, participants described a specific incident or issue. These hand-written comments were transcribed for content analysis, as described in Section 3.3.

3.2. Context

Philadelphia has an extensive network of bicycle infrastructure, which makes travelling through the city by bike both convenient and enjoyable. The network is the product of Philadelphia’s commitment to balancing roadway design in order to safely accommodate all users. As of the most recent update to the Philadelphia Pedestrian and Bicycle Plan in 2015, there were over 284 street miles of bicycle infrastructure throughout the city [35]. Correspondingly, of the ten most populous cities in the U.S., Philadelphia has the largest number of bicycle commuters; census data show 2.1% of Philadelphians commute by bicycle [36]. To understand the factors that lead some of these bicyclists to combine bicycle trips with public transit, we examined survey responses.
The CTUs surveyed at 30th Street Station, for example, biked to the transportation hub to access bus, trolley, subway, and regional rail operated by the Southeastern Pennsylvania Transportation Authority (SEPTA), in addition to the intra-city train service operated by Amtrak. Though 30% of respondents did not take their bicycles on transit with them, both SEPTA and Amtrak allow bicycles to travel on vehicles, subject to some restrictions. Philadelphia has a compact urban form and the area surrounding 30th Street Station is replete with bicycle infrastructure. When surveyed as to why they combine cycling and transit, the most common reason CTUs cited was speed; 70% of respondents said that transit is faster than riding their bicycle alone [11]. Speed as a primary motivating factor also explains the choice to bicycle in the first place.

3.3. Methodology

We conducted this study in two phases. In phase 1, we addressed the first research question related to the emotions experienced by CTUs when combining cycling with public transit use, the reasons for those emotional responses, and the locations where those emotions were experienced. We explored the second research question related to the implications of emotional maps on the practice of urban planning in phase 2.

3.3.1. Phase 1: Analyzing CTU Emotions and Creating Emotional Maps

We performed content analysis and coding to address the initial part of our first research question—what types of emotions do CTUs experience and why? Content analysis converts communication artifacts (in this case, 62 comments and 59 sketch maps with notes) into coded categories based on a consistent and unambiguous rule of coding [37]. A reliability analysis is used to test the tendency for different people to consistently recode the same data in the same way [38]. We addressed the second part of the question—what types of locations CTU emotions are attached to—by creating a series of emotional maps following a qualitative GIS/geovisualization methodology. Qualitative GIS/geovisualization can be accomplished through a plethora of qualitative data collection using various methods such as content analysis, discourse analysis, grounded theory, and visual analysis [18,39,40,41,42]. Emotional maps can be defined as maps that “chart human feelings onto a cartographical landscape” [43] (p. 130). Most researchers collect emotional data in three ways: Biometric measurements, extraction from user generated content (e.g., social media), and surveys [44]. They work with emotional maps according to three categories: Maps of emotions, using maps to collect emotional data, and emotions while using maps [45]. We collected emotional data from surveys and created “maps of emotions”.
Our study methodology involved the following four major steps. First, hand-drawn maps were converted into GIS features using Arc-GIS 10.4TM, documenting origins, destinations, and segments traveled by bicycle and on transit vehicles. Second, content analysis was completed on written comments both from the sketch and the comment box. We focused on expressions of emotions in graphic and written formats. Hand-written comments were transcribed and coded for emotional content using the NRC (National Research Council, Canada) Word-Emotion Association Lexicon [17]. The lexicon associates words with two broad sentiments—positive and negative—and eight emotions from the middle ring of Plutchik’s wheel of emotions: Anger, anticipation, disgust, fear, joy, sadness, surprise, and trust. Examples of generating emotion keywords from textual data include: “contrary” with negative sentiment; “responsive” with trust, anticipation, and positive sentiment; “confirmed” with trust and positive sentiment.
Emotions and sentiments were initially coded by two project team members and then recoded by another member. The recoder followed the constructed rules and categories developed by the original coders. We compared the coding results and calculated a percent reliability for each sentiment or emotion category. The percent reliability was derived by calculating the number of cases identically categorized by the recoder and original coders for each emotion or sentiment category and dividing it by the total number of cases in the data set. The mean percent reliability ranged from 96% to 99%. Overall, the results of the percent reliability for each category were high, indicating the dependability of the categories that the original coders chose for the data set. In order to understand the context of these emotions, participants’ qualitative expressions of space were visualized on top of quantitative data (e.g., presence of bike lanes, crashes). This process helped us integrate the precision of quantitative analysis that GIS permits and the subjectivity of respondent perceptions expressed in words and images.
Third, coded emotions attached to locations were included as attributes in GIS shape files, namely points referring to particular locations (e.g., home, workplace, station, street intersection) and lines referring to roads or routes (e.g., regular roads/bus routes, bike paths, rail or subway lines). Finally, we created four types of maps using ArcGIS ArcMap, ArcGIS Online, and Adobe Illustrator. Colors for the emotional maps were chosen following the emotion color wheel (see Figure 1) by following eight colors to represent eight types of emotion.

3.3.2. Phase 2: Understanding Implications of CTU Emotional Maps

We answered our second research question based on our understanding of the maps created, as well as expert opinions, by conducting a 10-question online survey of Philadelphia-area transportation planners. We distributed the survey to two transportation planners for a pilot test. Based on received feedback, we modified the questions or added additional explanations and then finalized the survey. We next approached 39 transportation planners from 12 public, private, and nonprofit organizations in four counties of the Philadelphia metro area (Philadelphia, Bucks, Chester, and Montgomery) through email invitations in January of 2019 and received 25 responses (a 64% response rate) within a two week period. We shared our four maps and asked if this type of visualization could effectively convey an emotional account of a journey (Map type 1) or a set of opinions (Map types 2, 3, and 4). For each map, we also asked what aspects of the map the participants found most significant or how the information depicted in the map might be useful to the participants. The last two questions asked whether or how CTU’s emotional experience in the transportation environment (such as feeling anger, fear, happiness) might influence the work of transportation planners.

4. Results

4.1. Phase 1 Results—CTU Emotions and Emotional Maps

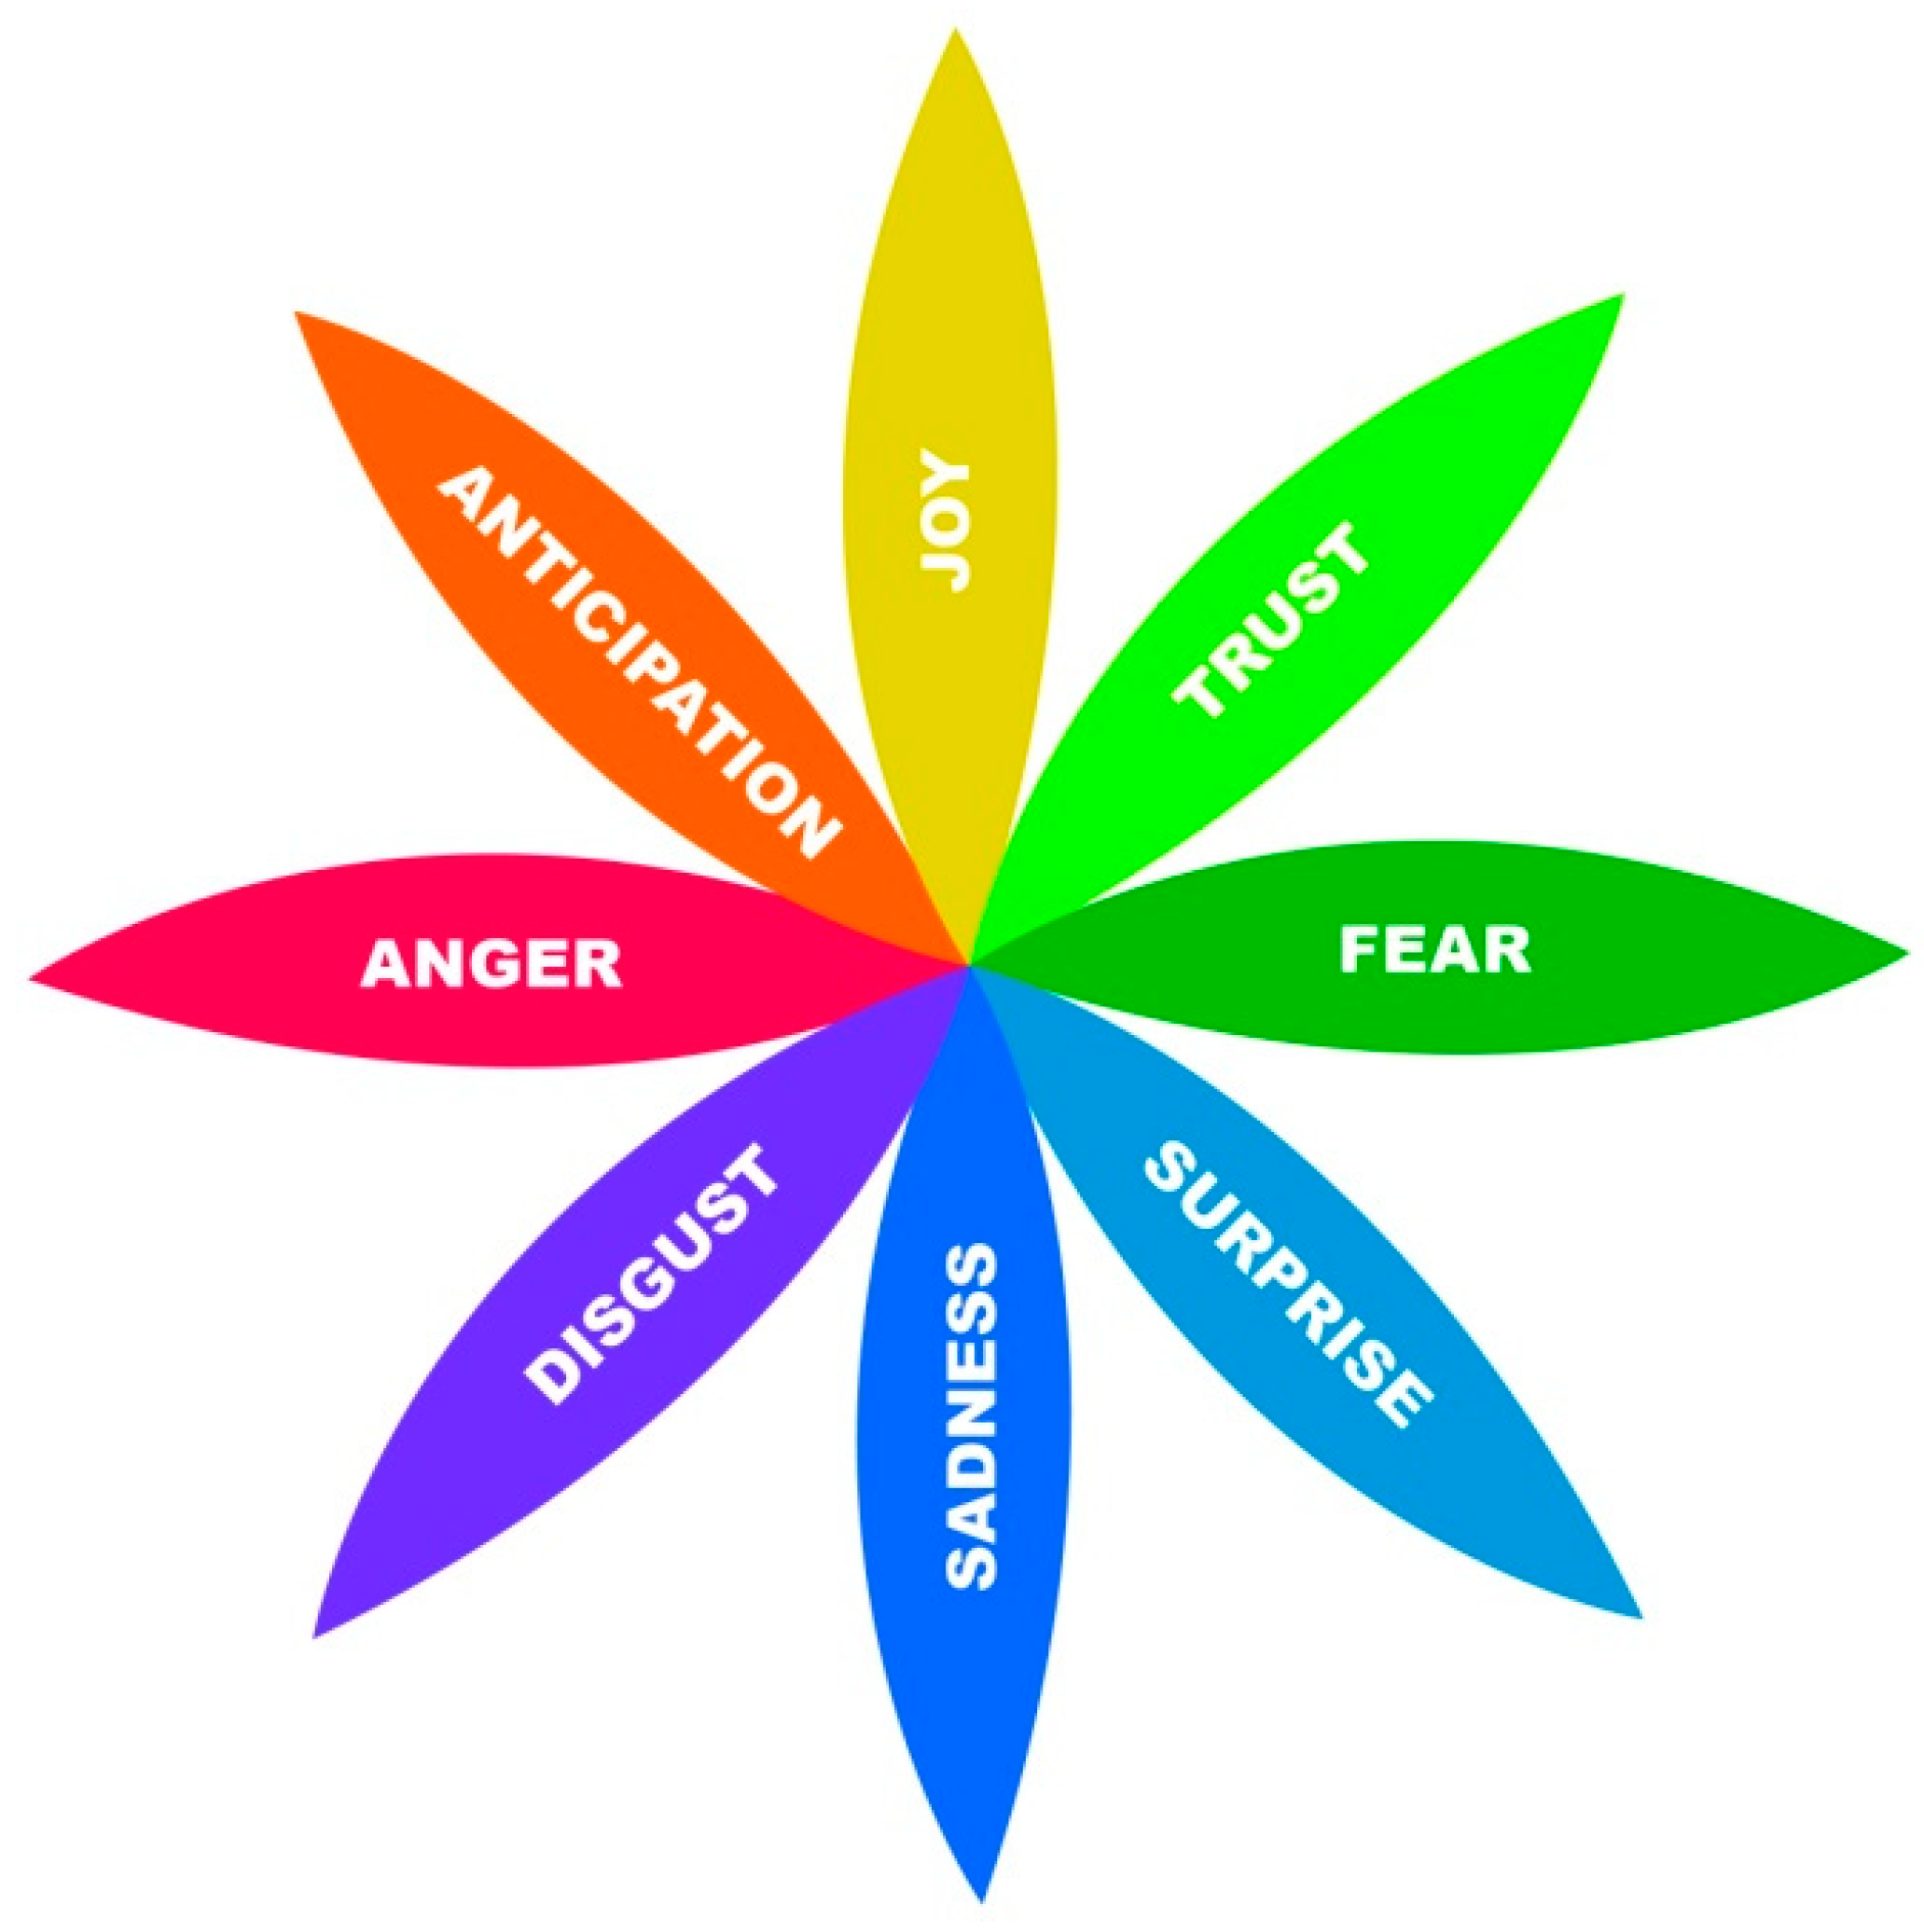
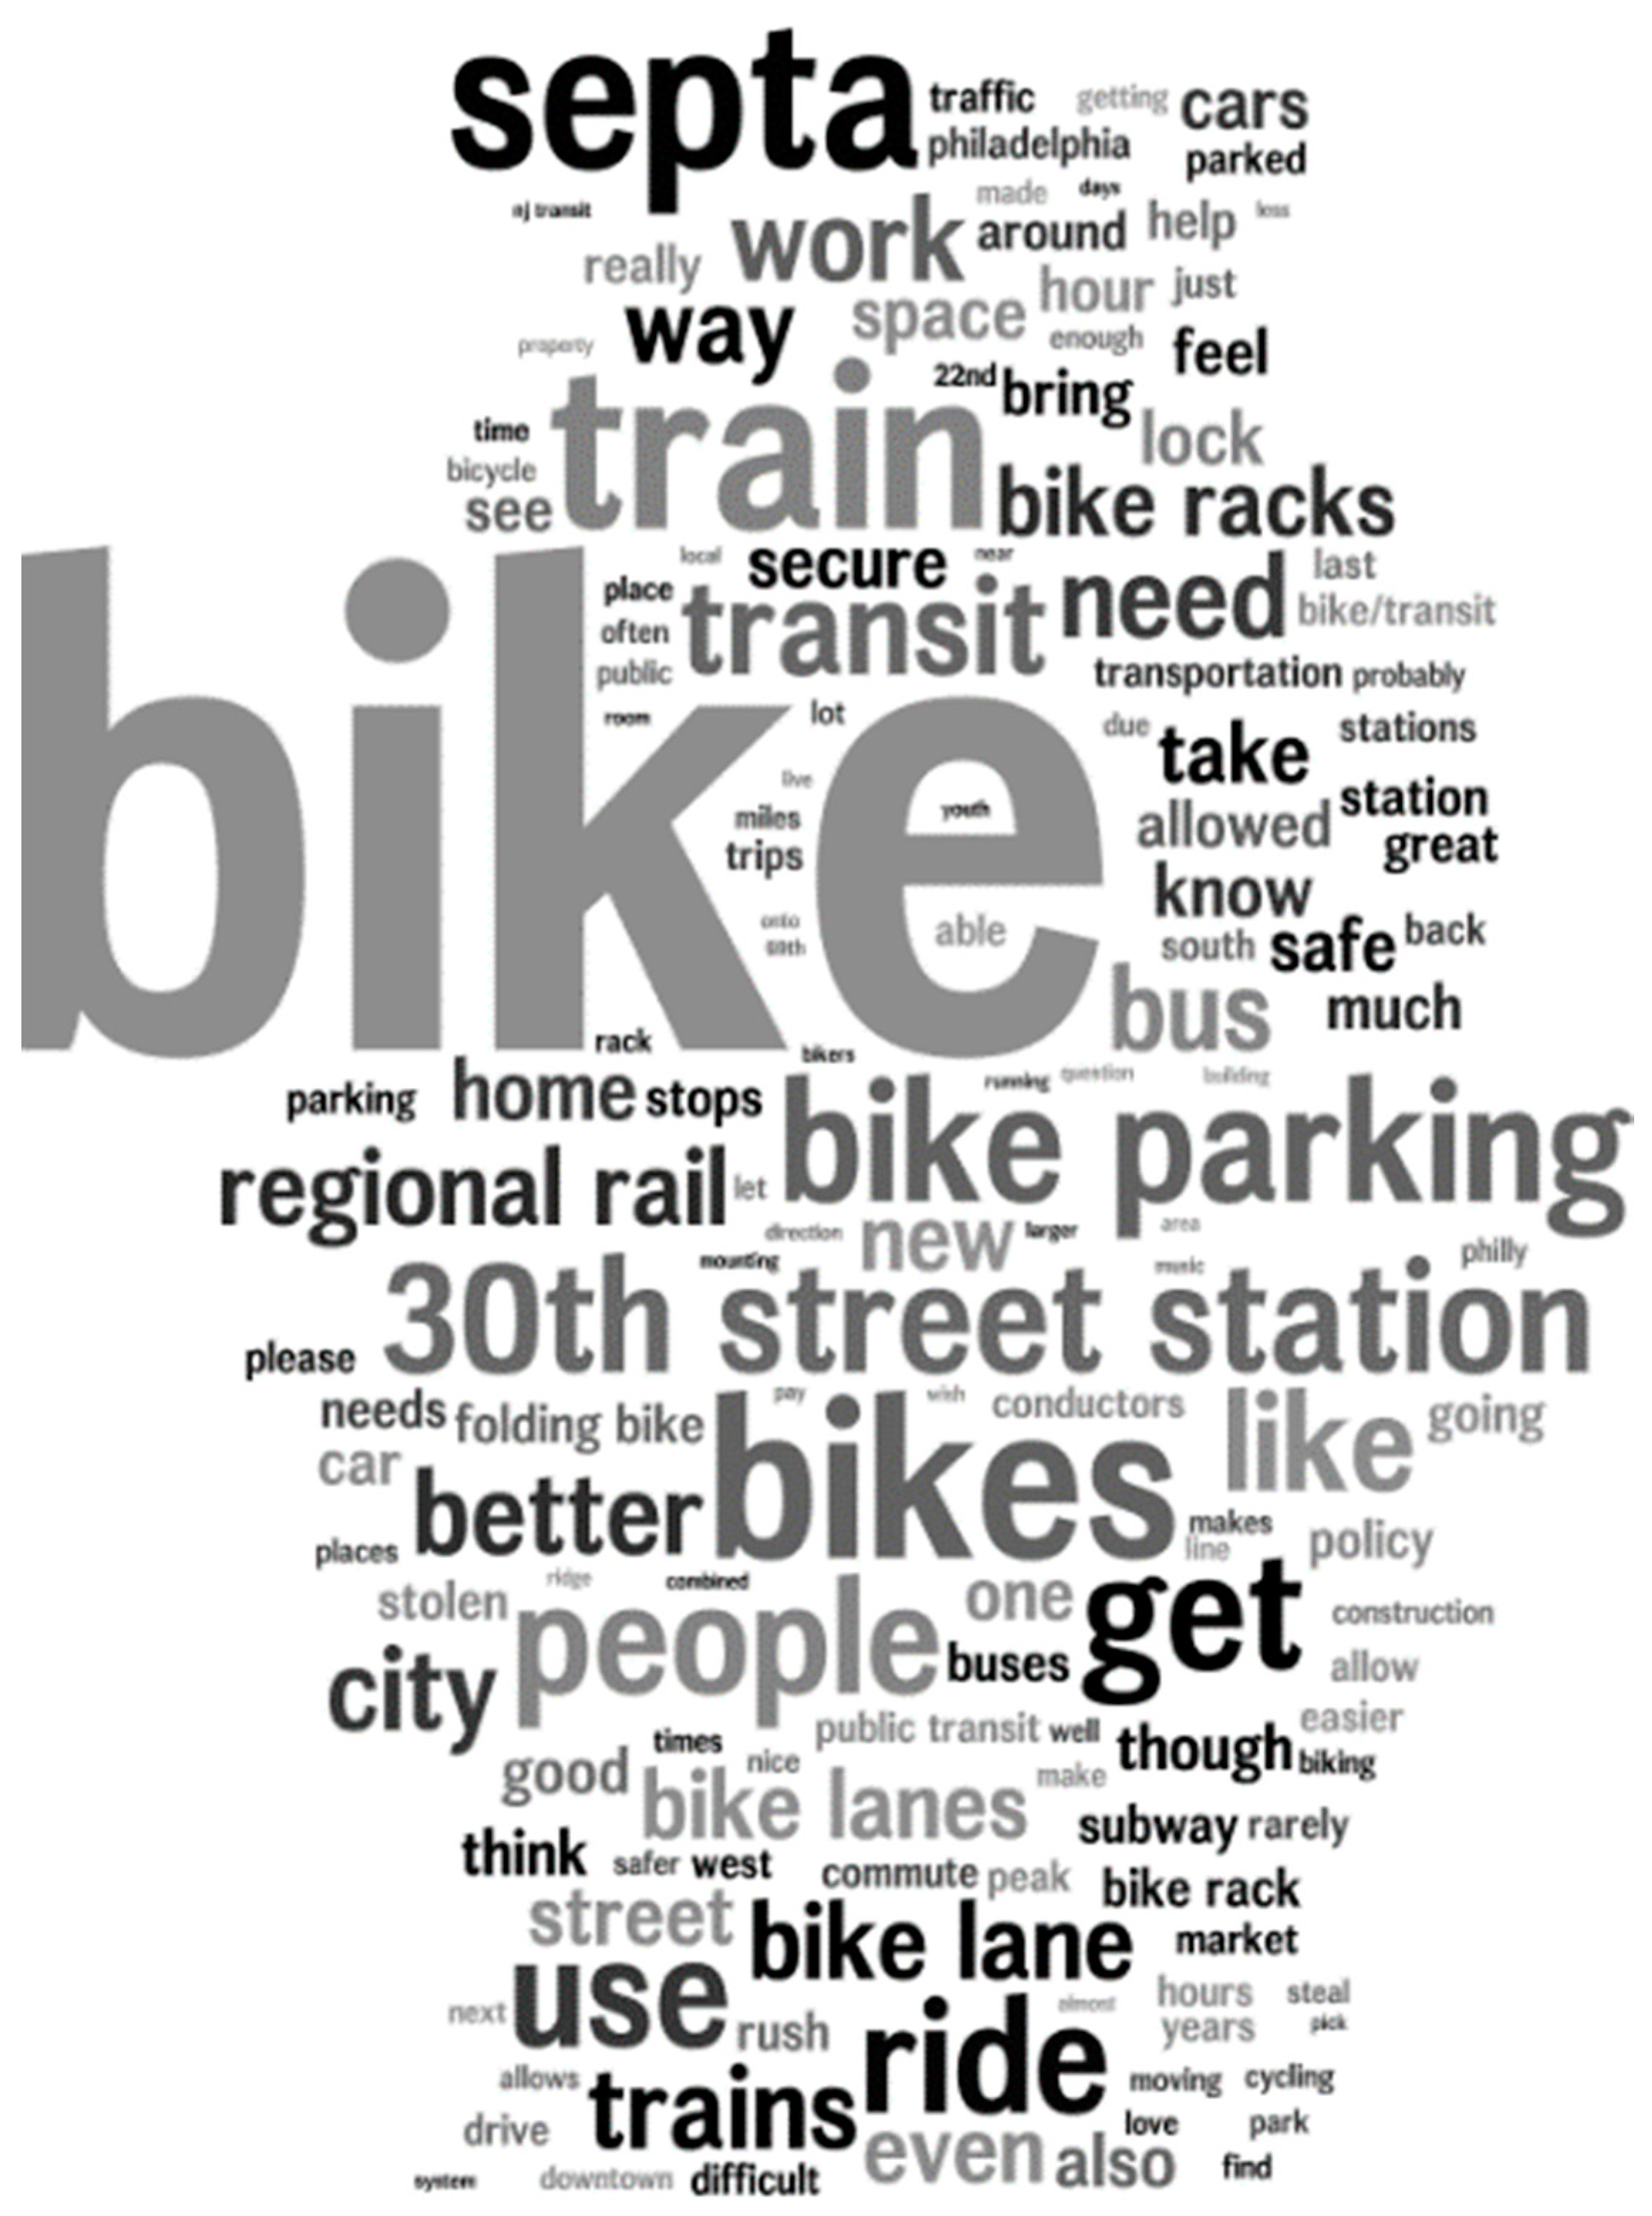
4.1.1. Negative Emotions Prevail amongst CTUs

Respondents offered 50 negative sentiments and 31 positive sentiments. Three did not have any sentiment or emotion content. Among emotions, anger was the most frequently identified (n = 34), followed by disgust and fear (n = 32 for both), sadness (n = 29), and joy (n = 24). (See Table 2). Figure 3 shows a word cloud based on our analytical results. The following words were mostly used in textual data: Bike/bikes, train/trains, SEPTA, bike parking, 30th Street Station, people, ride, transit, city, bike lanes, bike racks, need, get, and home. The word cloud results link the sentiments with specific features of the transportation environment. Figure 4 shows the locations and routes used by participants.
CTU negative emotions were associated with seven distinct themes. Some themes were location specific (e.g., station facilities, road conditions), while the others were service specific (e.g., on-board facilities, bike parking and security), although all of those service-related issues were experienced in certain locations. Table 3 presents these themes, their definitions, sample keywords or phrases that fell under each theme, and the number of times negative emotions were expressed under each theme. Most CTUs had negative emotions related to on-board facilities, particularly on regional trains. They complained about bike-on-rail restrictions, lack of signage, or lack of bike racks. There were significant issues with transit staff, their lack of courtesy, and sometimes lack of knowledge about their own policies. A second major theme was bike parking and security-related issues that also triggered negative emotions. CTUs reported that they had to miss trains due to lack of parking spots in the station or parking spots that were disrupted due to construction. Negative emotions also prevailed due to theft or attempted theft. The third major theme was road conditions. CTUs primarily talked about unsafe bike lanes, illegal car parking on bike lanes, carelessness of pedestrians or vehicle drivers, or lack of crosswalks. The other categories were commuter adaptations, station facilities, transit logistics, and conditional use of transit.

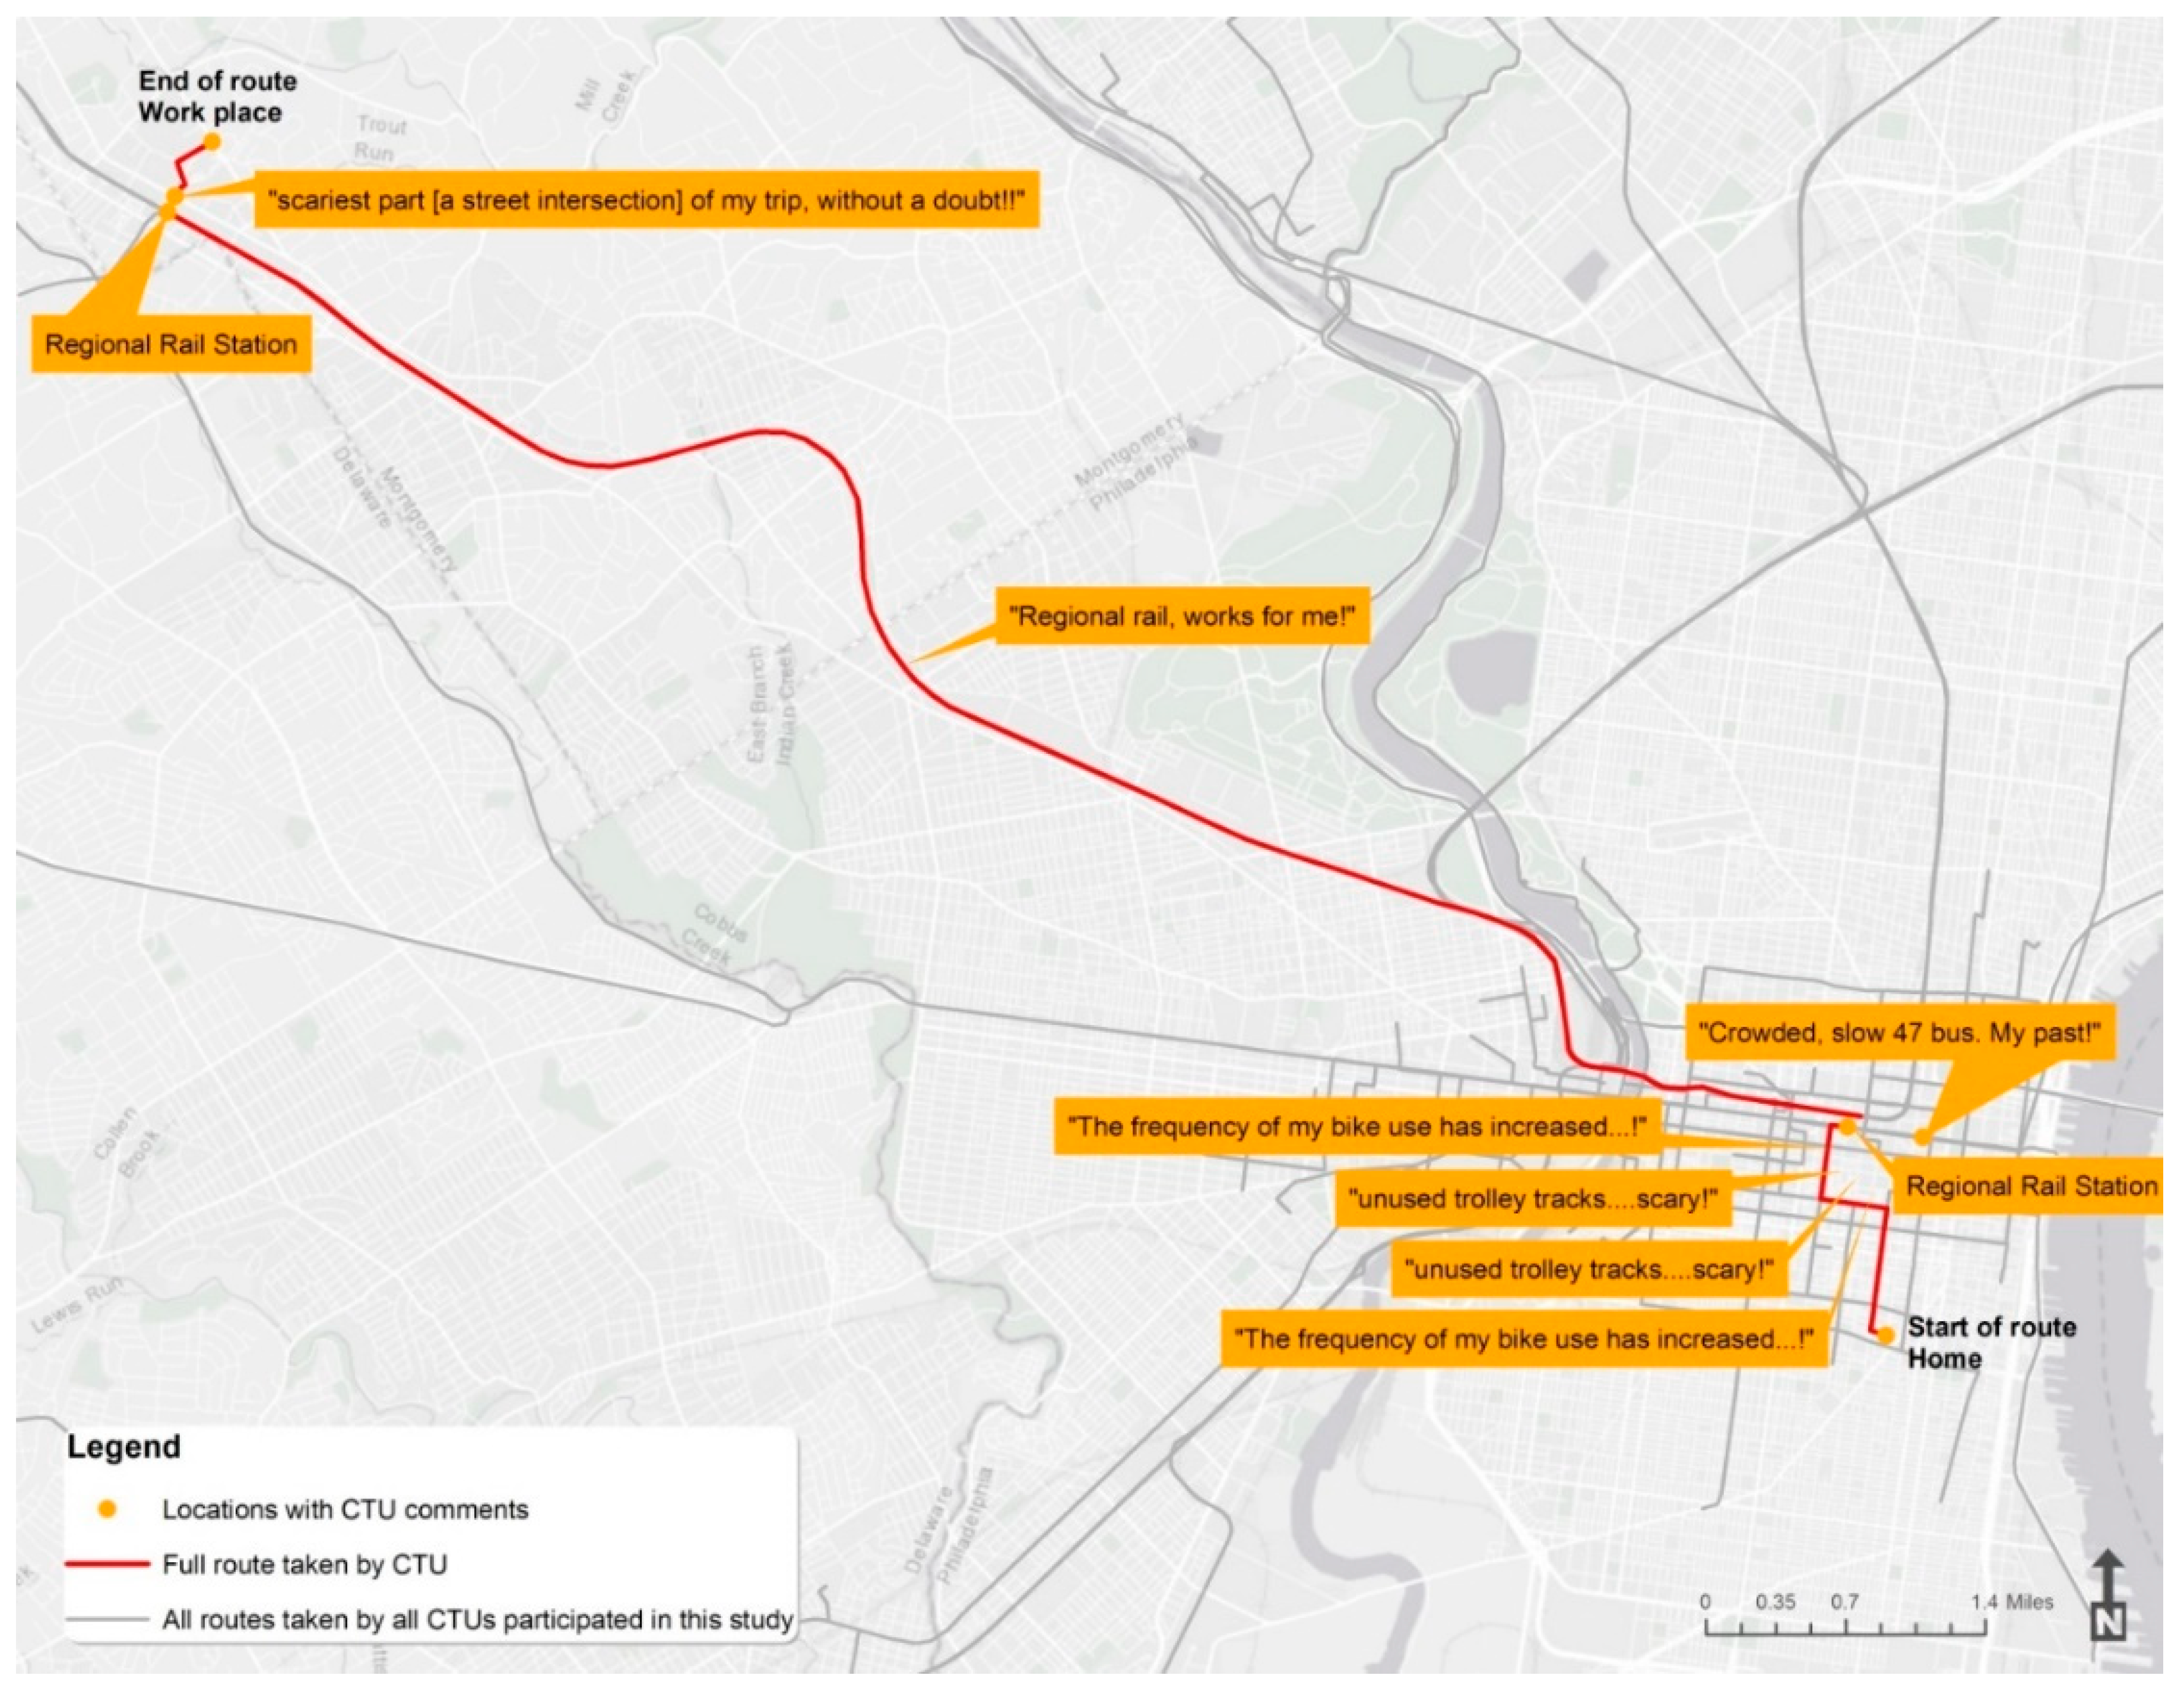
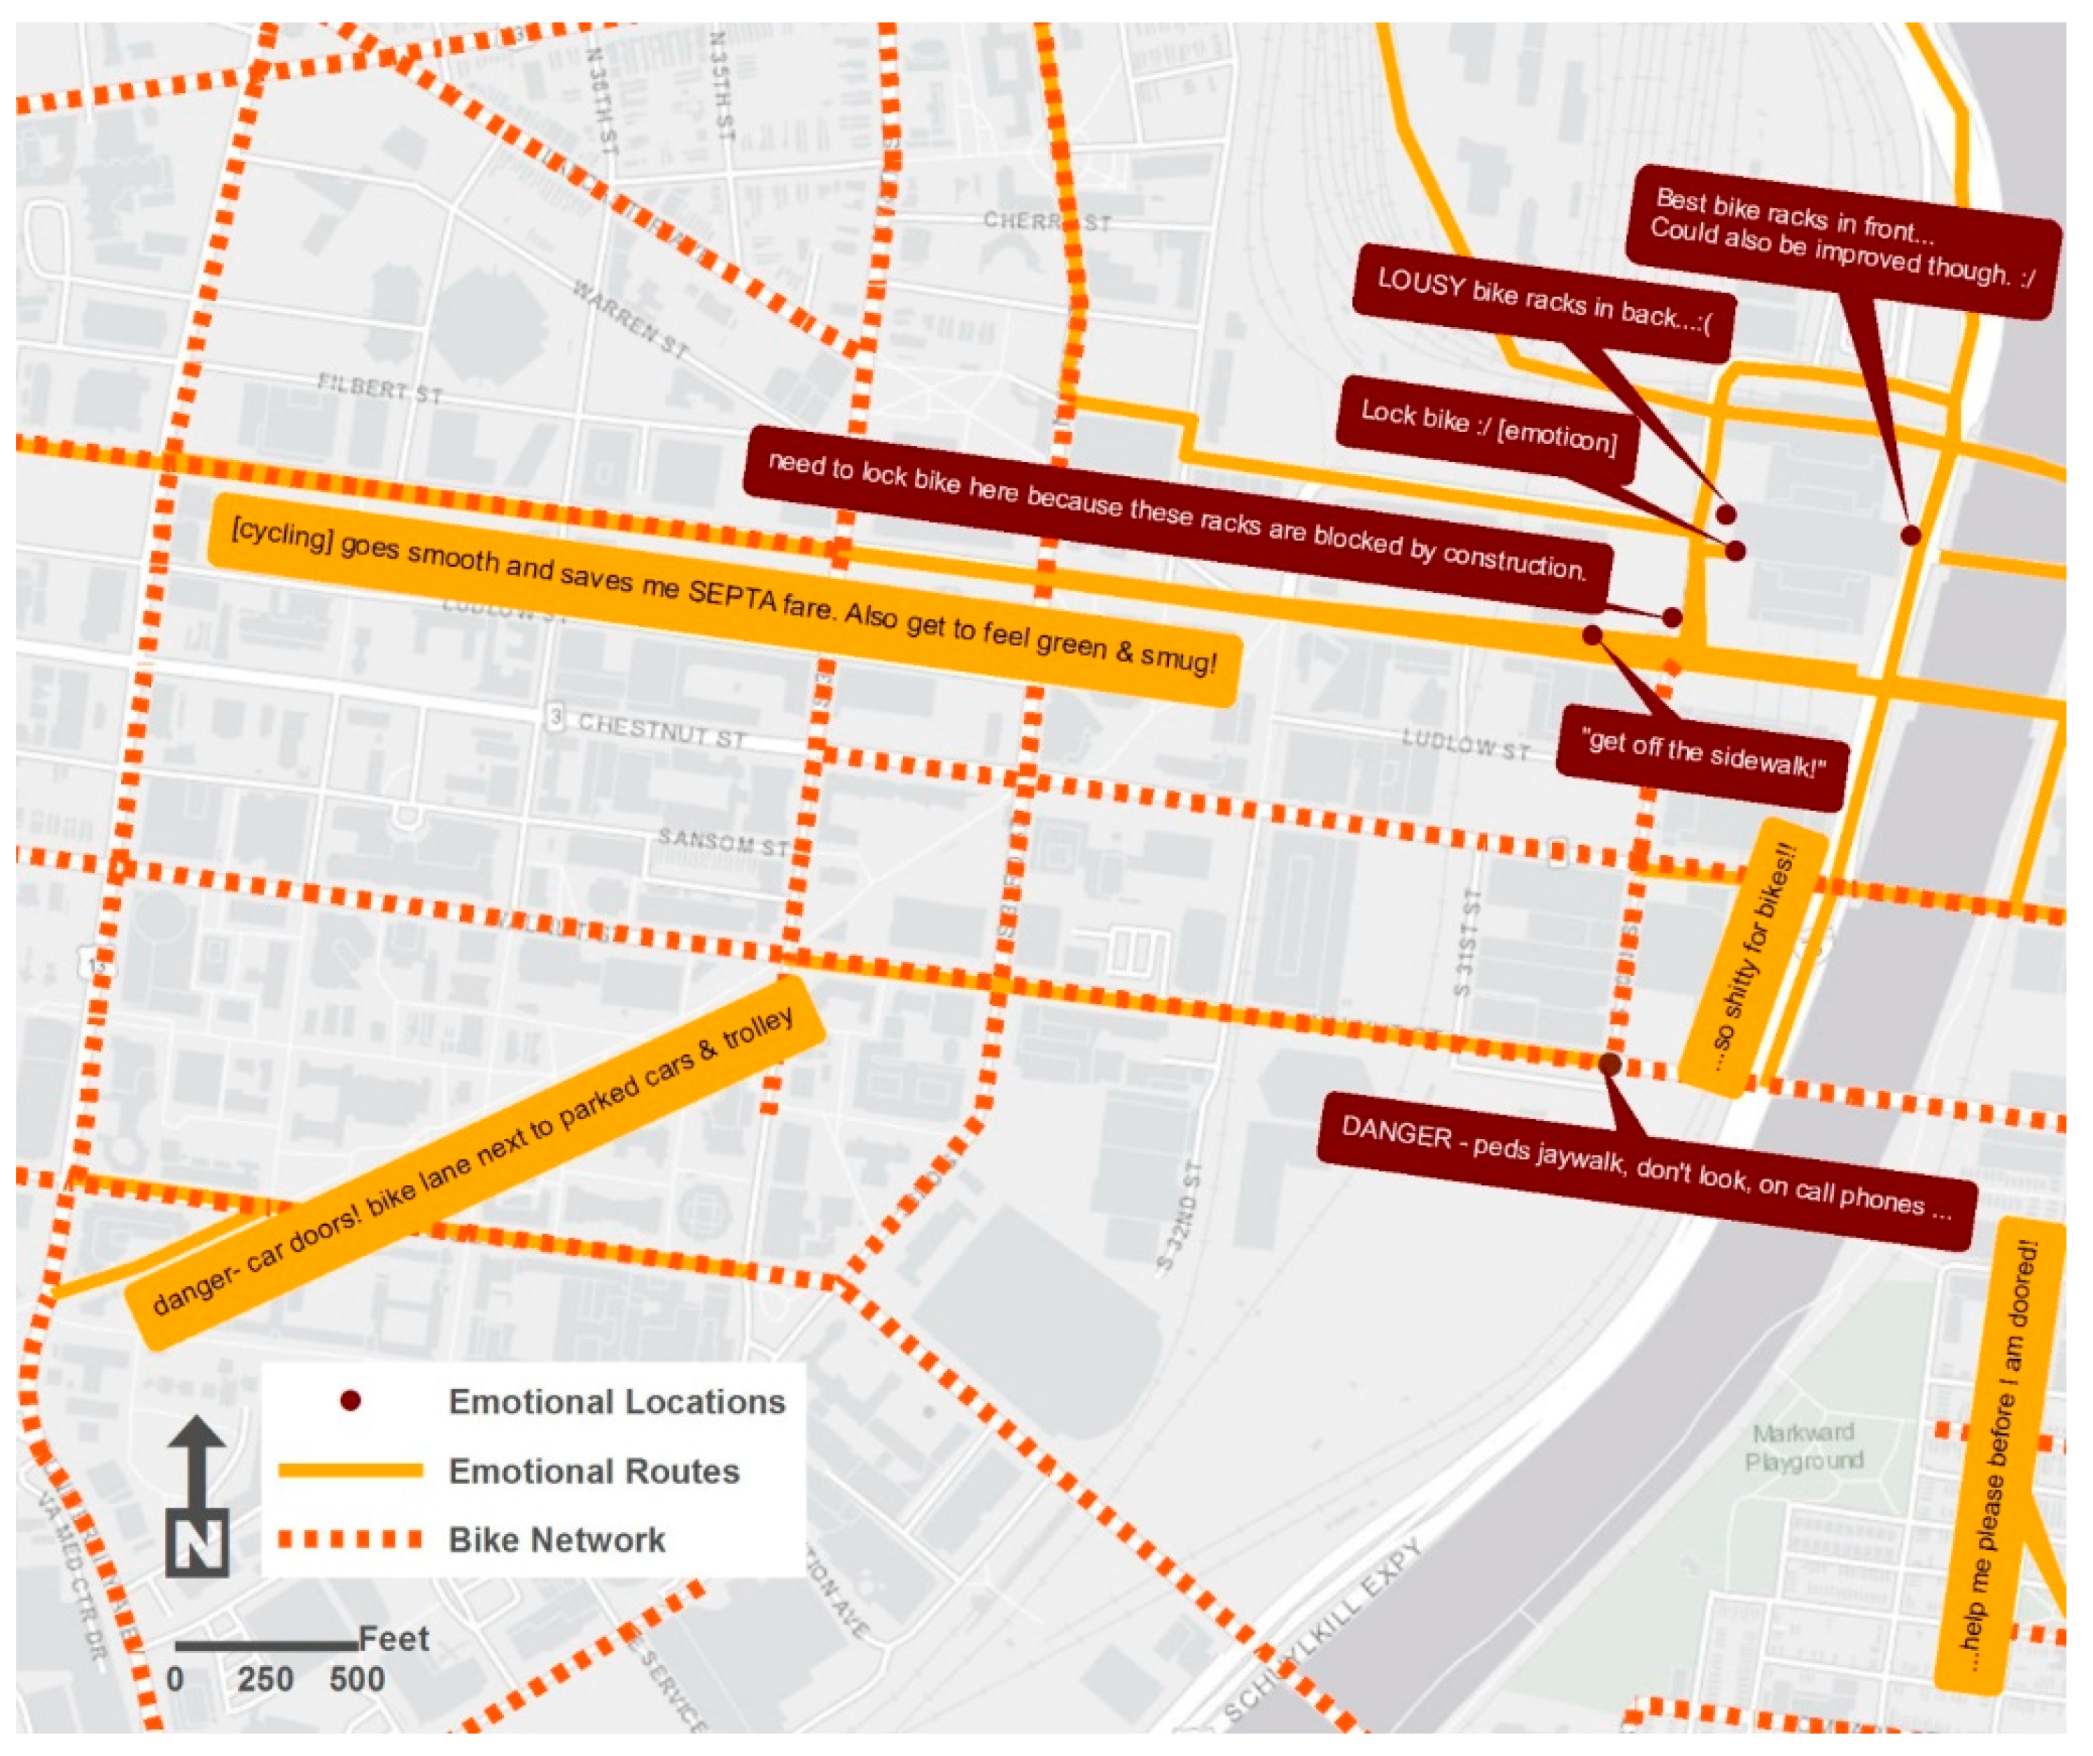
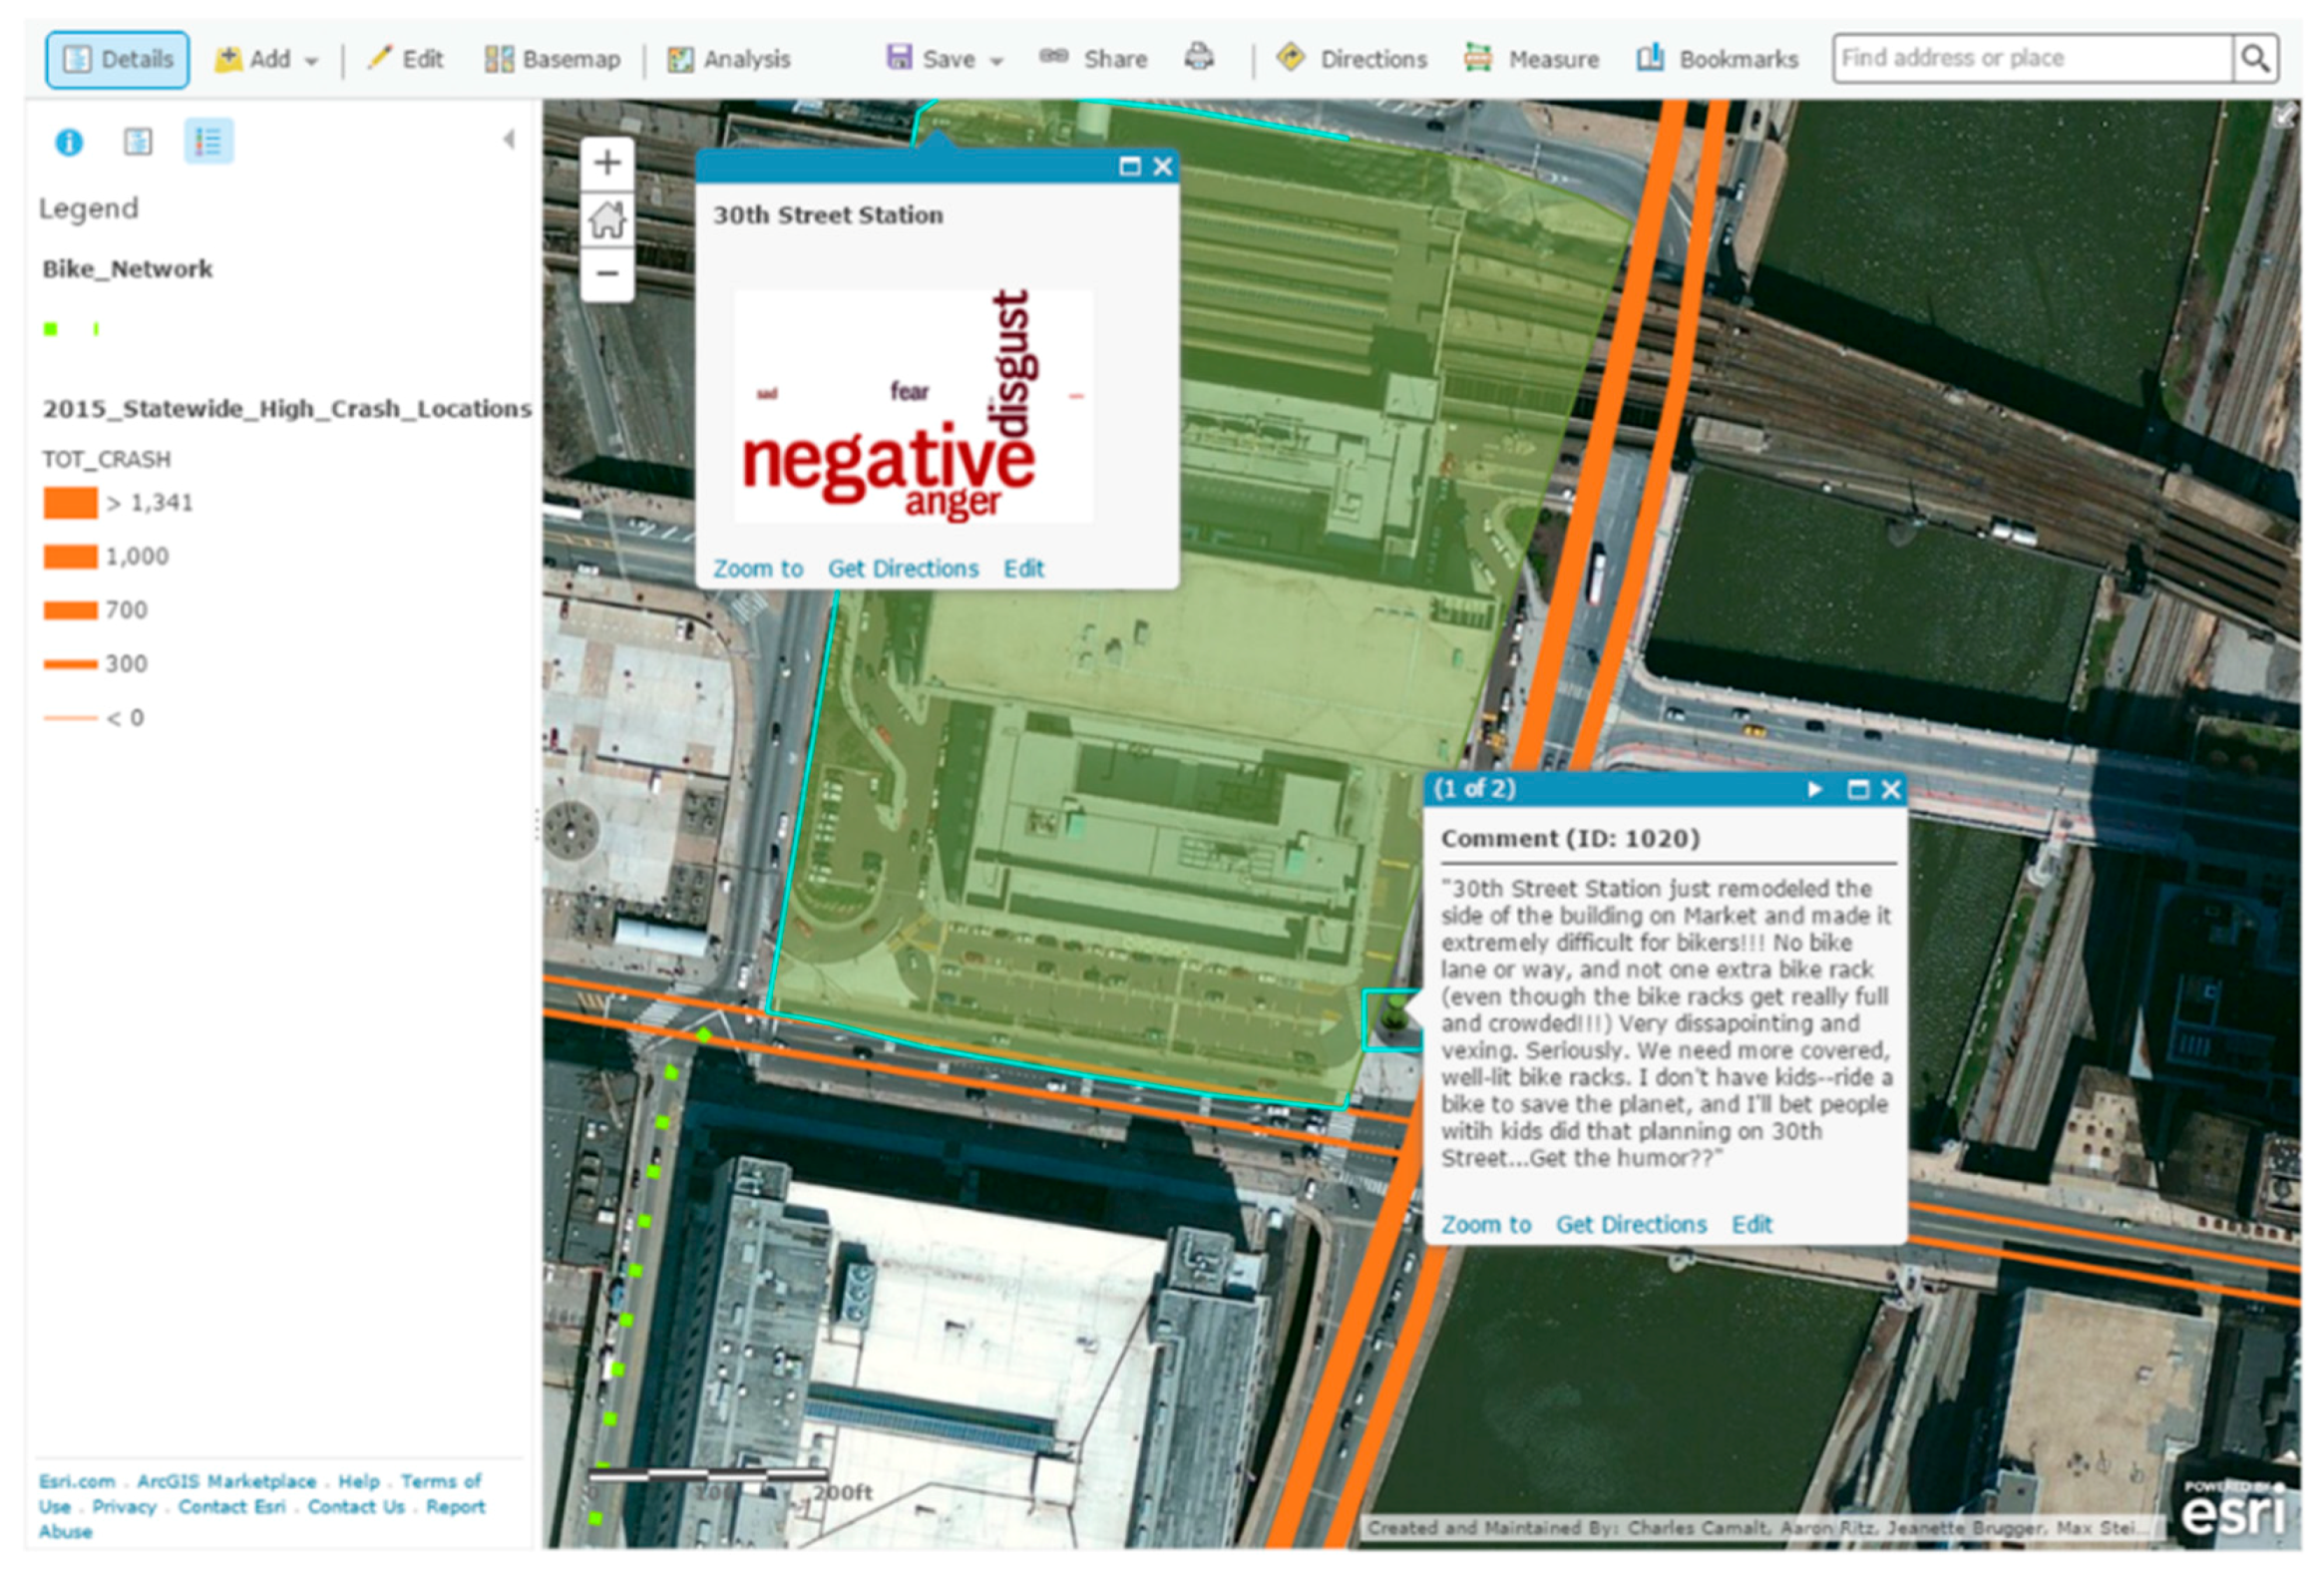
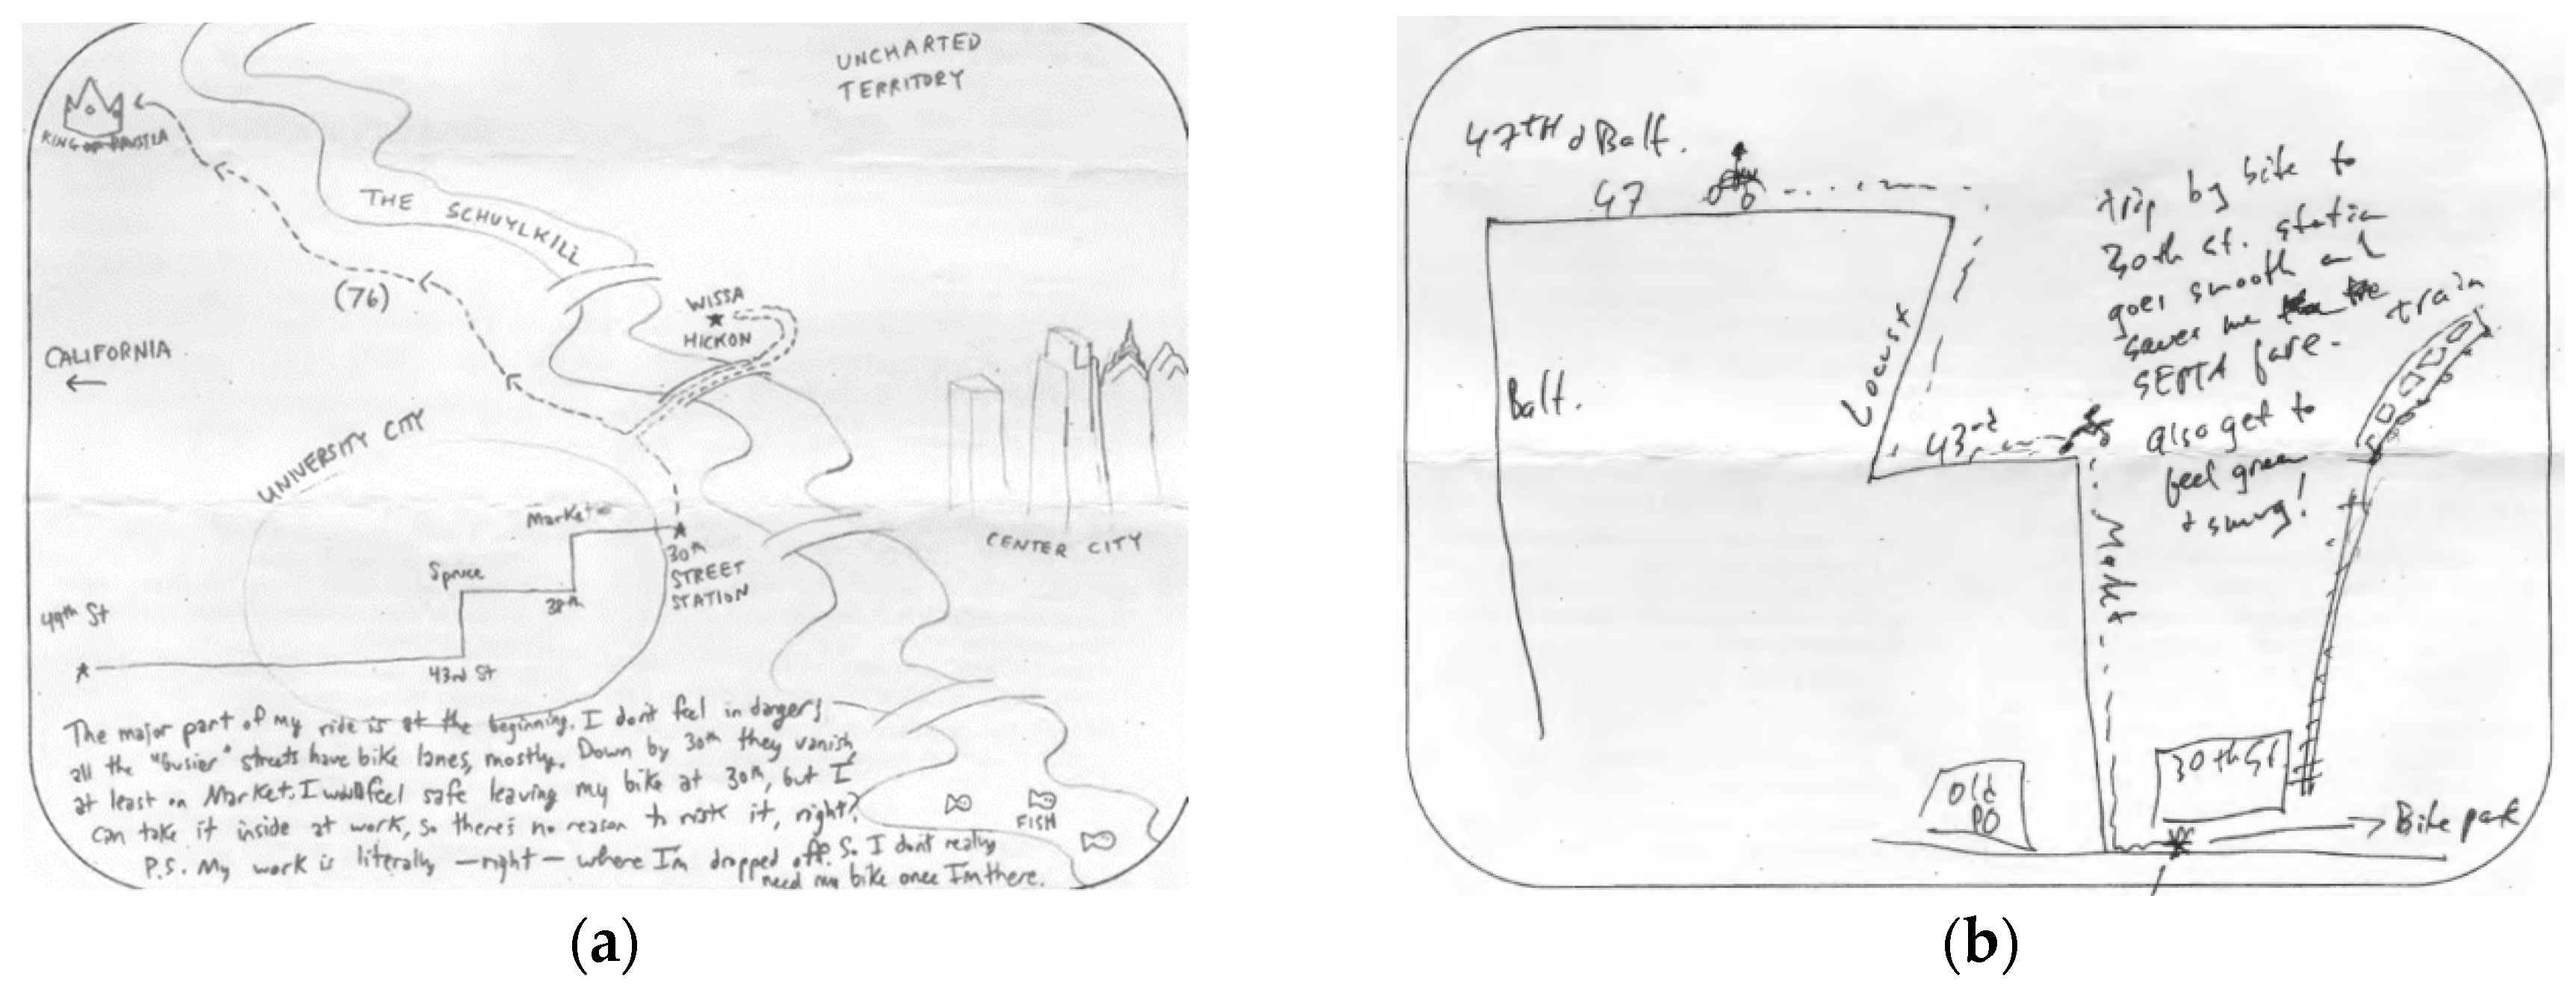
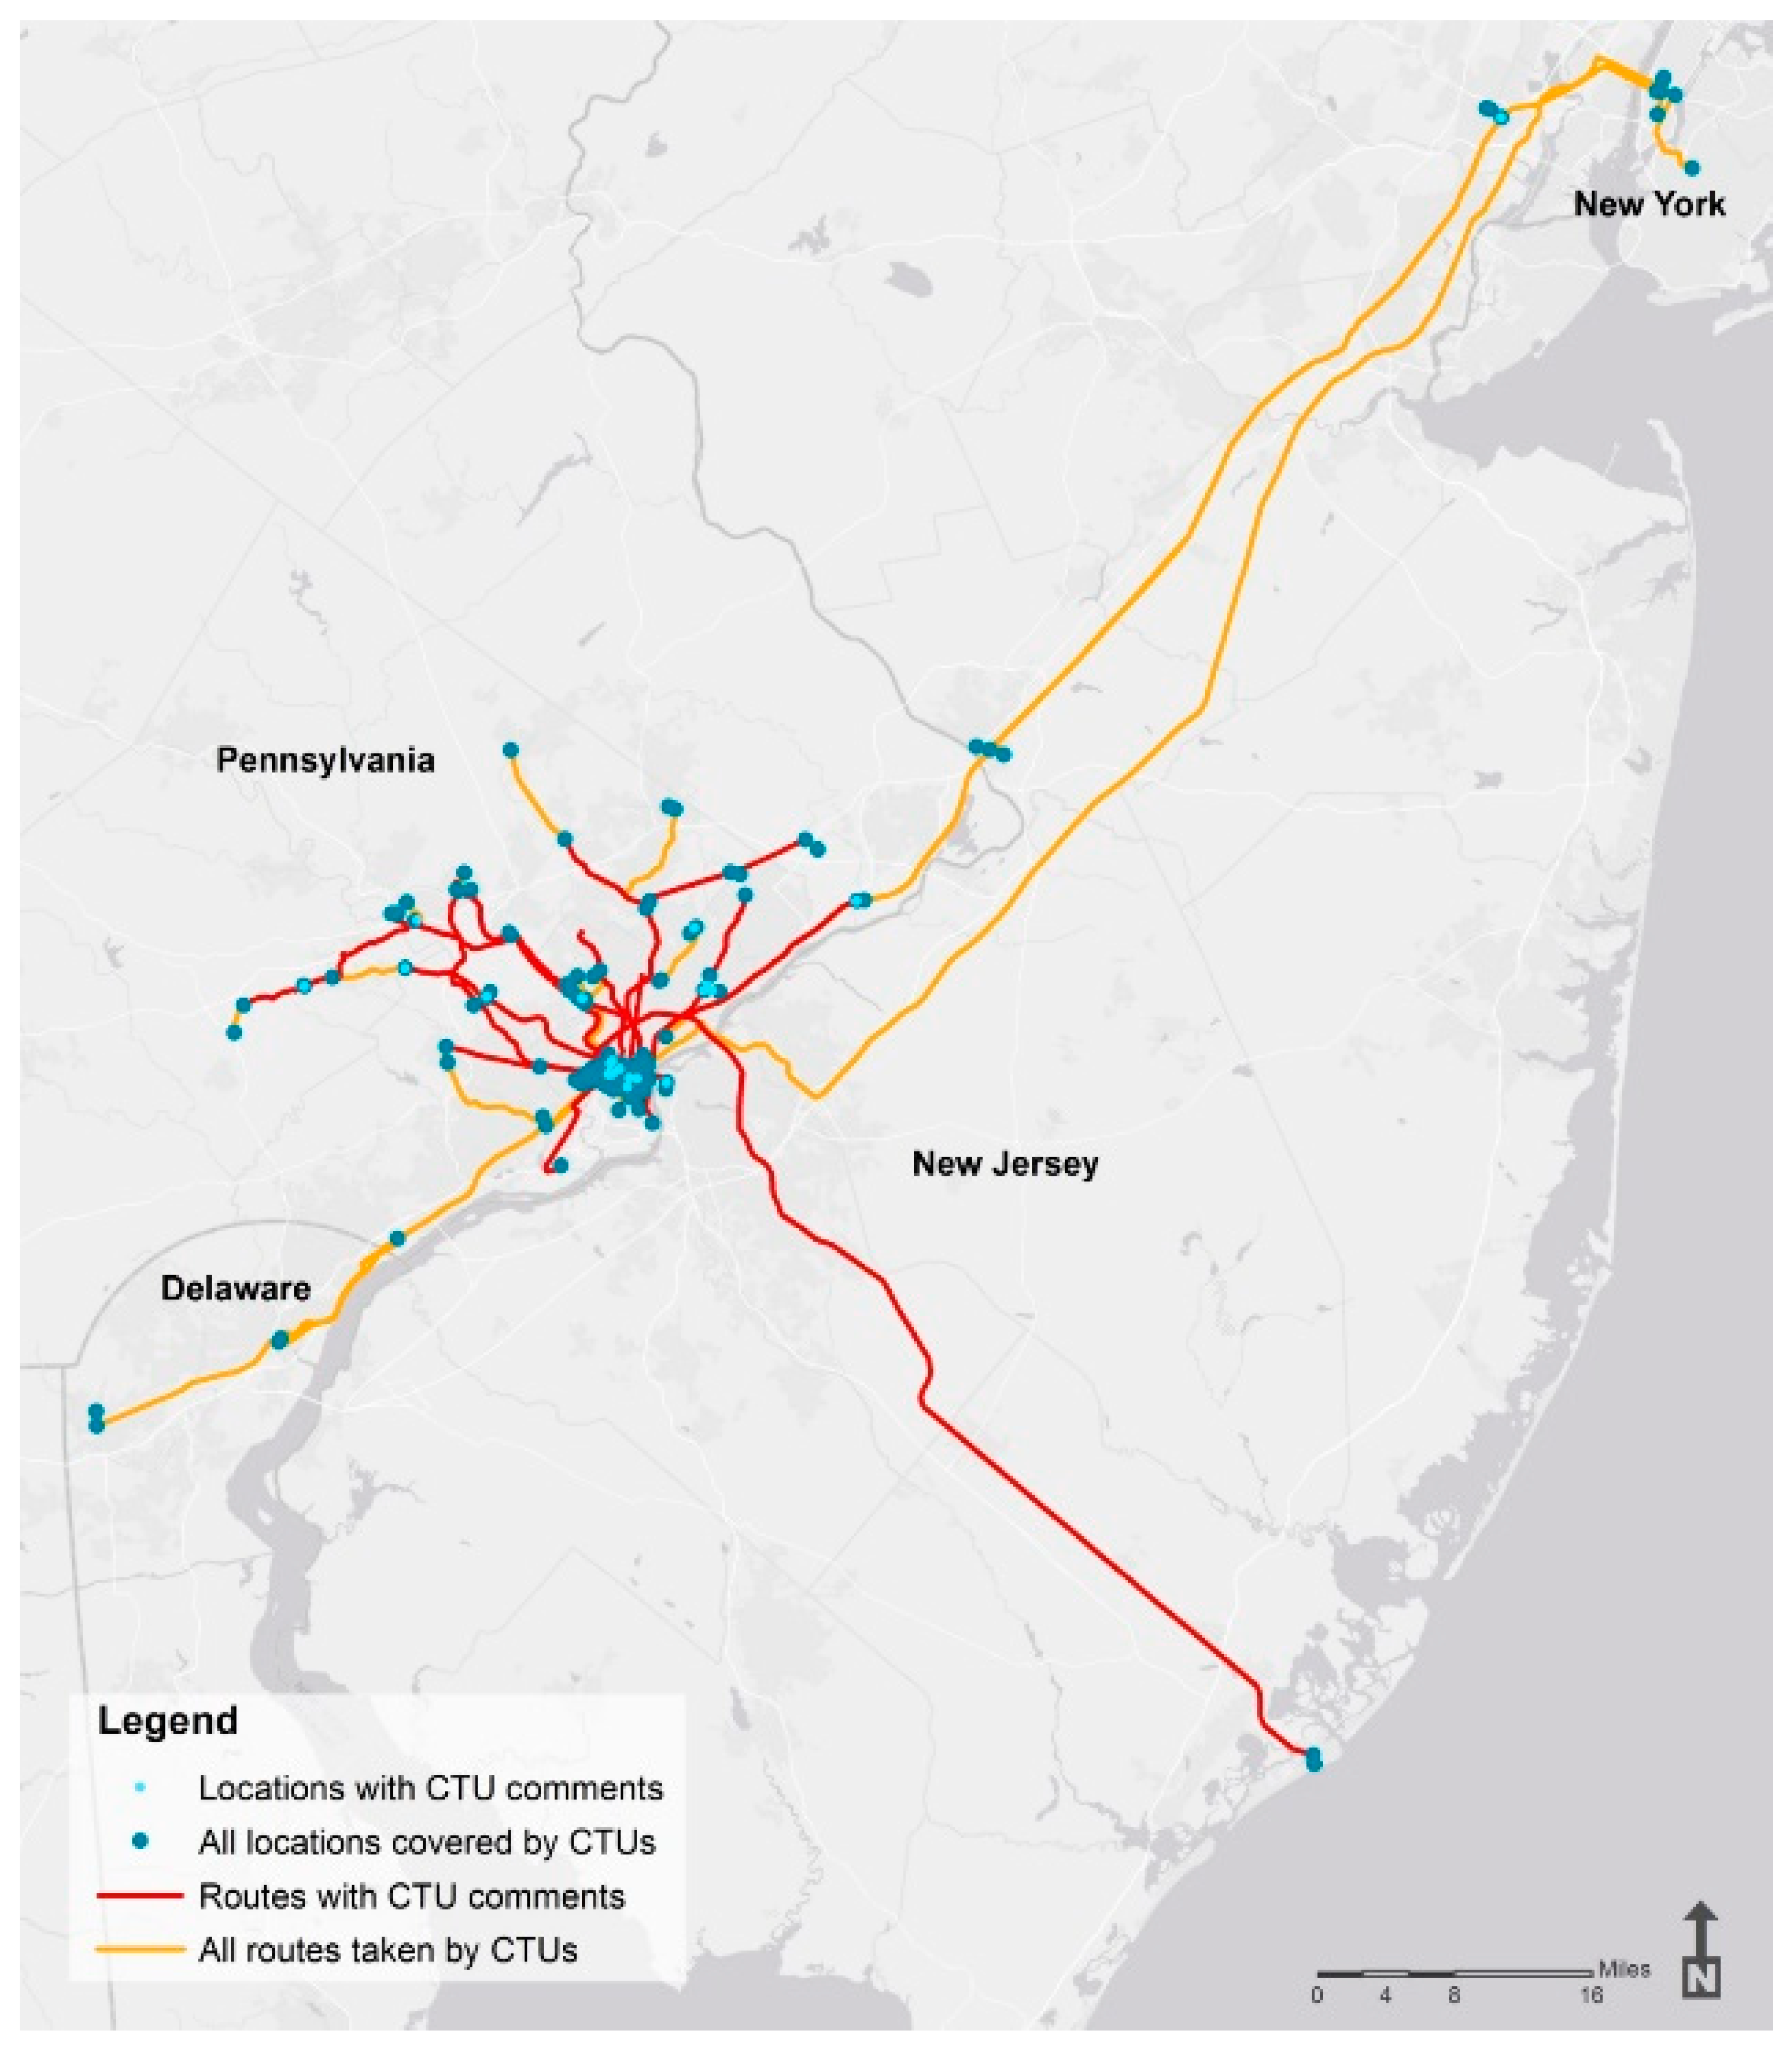
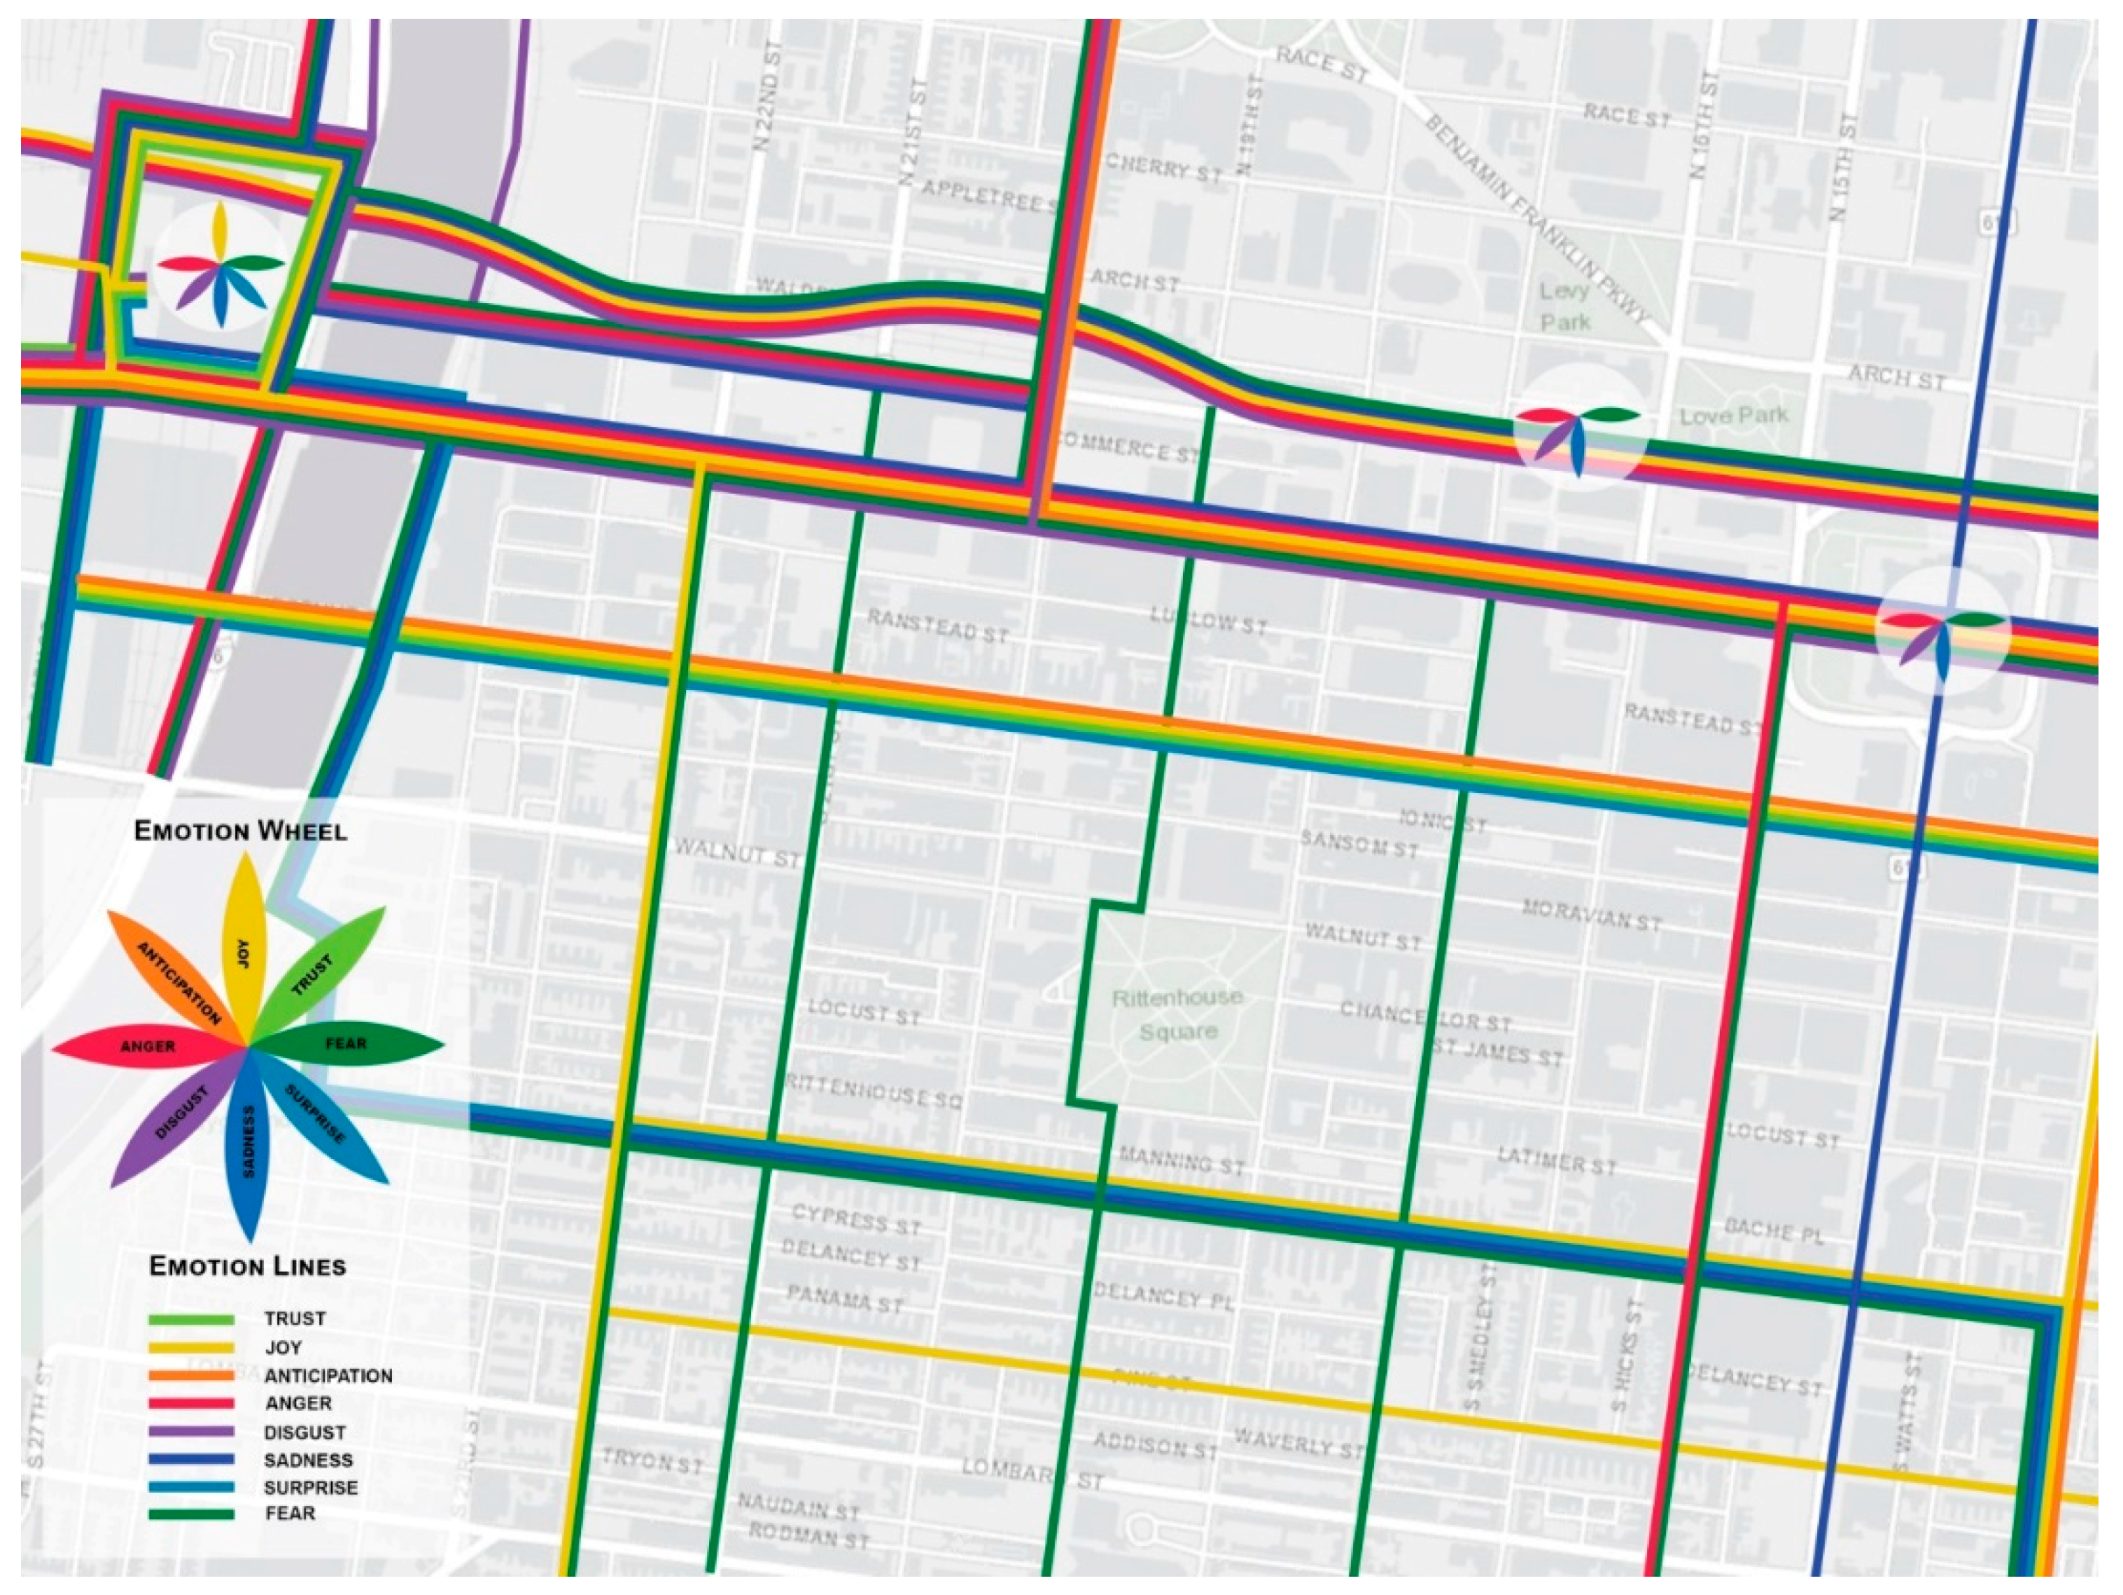
4.1.2. Four Ways to Map CTU Emotions

Based on the results from content and emotion analysis, we created four types of maps to visualize human emotions that CTUs experienced in Philadelphia: (1) CTU trips, (2) CTU comments, (3) CTU emotions, and (4) CTU emotional spaces. Map type 1 (Figure 5) graphically presents an example of a CTU’s daily trip and how the CTU felt positive and negative emotions about regional rail, trolley tracks, bike use, bus routes, and even a street intersection. Map type 2 (Figure 6) shows a compilation of CTU comments around various routes and locations, such as origin and destination of a trip and other points of interest. Factors triggering positive emotions included environmental and economic benefits of biking; negative emotions were elicited by poor on-board facilities and cars stopped in bike lanes. This map displays user comments that provide input for reviewing and studying features that might not otherwise attract attention from planners. Map type 3 (Figure 7) graphically presents the city and its built environment as emotional spaces. The lines (e.g., roads, bike lanes, rail lines) and points (e.g., street intersections, bus stops, and stations) are color-coded to represent various types of CTU emotions. Similar to type 2, this type of map can offer compelling insights into CTUs’ experiences in an urban environment that were previously unknown. Finally, map type 4 (Figure 8) presents urban locations as emotional places with detailed information about each point of interest. It can be created using an interactive online GIS platform so that users could interact with the map using pop-up windows showing detailed comments. Inspired by Jung’s work on code cloud visualization [46], this type of map can include a code cloud of emotions or sentiments expressed about a given location.

4.2. Phase 2 Results: Implications of CTU Emotional Maps in Transportation Planning and Practice

The majority of transportation planners who participated in our expert opinion survey found all four types of maps generally useful. Table 4 provides a numeric count of their responses. The majority of participants either agreed or somewhat agreed that all maps could effectively convey an emotional account of a journey, a set of opinions on routes and locations, CTU emotions related to routes and locations, or a set of opinions on specific locations. In addition, experts commented on the general theme and graphical presentation of each type of map.
Twenty-four experts out of 25 either agreed or somewhat agreed that the type 1 (CTU trips) map can be useful. The geo-located comments can provide insight on the best and worst practices in infrastructure design, traffic management, and other features of the urban environment. Experts also found this map most useful in the identification of locations for interventions; for instance, one planner noted that if numerous CTU comments appeared on the map in the same location, they would want to evaluate the infrastructure present at that location. The planners overwhelmingly found the maps to provide important information about routes and dimensions with which they themselves might not be familiar. The following statement captures this theme:
By looking at such maps, we can be aware of [the] conditions of certain roads or intersections, especially if we are not too familiar with all possible routes one could take from point a to point b. These are real comments about the routes or places shown on the map.
A few planners found issues with the readability of the map due to the scale, while one felt that the comments were not clearly linked to features of the route, creating problems of interpretation and subsequent interventions.
The type 2 (CTU comments) map is an aggregation of reactions, opinions, or emotions concerning specific features of the physical environment. Rather than presenting a statistical interpretation of this information, it compiles and displays user comments that may provide useful input for reviewing and studying features that might not otherwise attract attention from planners, engineers, designers, and policy makers. This map was completely or somewhat useful to 22 experts. Some discussed the usefulness of this map in identifying routes and their associated emotions; the patterning of emotions surrounding specific routes proved particularly compelling for several experts. The planners stated that this map allowed them to see patterns and, thus, areas for improvement, perhaps due to the more granular focus of the map. One planner stated that “This type of data should be beneficial to a wider audience due to its precision and description,” and this theme was carried throughout the comments. The negative comments mostly focused, again, on the map presentation that was found to be hard to read. One planner, however, noted that the information was not comprehensive enough to be useful while another asked for data on the number of comments received. This feedback provides opportunity to think of additional map types and the granularity of map presentation that may be most useful.
Twenty experts either agreed or somewhat agreed that the type 3 (CTU emotions) map can effectively represent emotions experienced by cycle–transit users. Many considered this map unique and discussed the usefulness of providing emotional accounts of CTU experiences. Among the four types of maps, however, type 3 received the most “no” votes (20%). The map was challenging for planners to interpret because of the Plutchik’s wheel of emotions (see Figure 1) inspired color scheme. The critiques centered on the ability to interpret the map given the confluence of colors and lines, while one planner indicated emotions are not constant over the entire route which the color-coded line intimates. In addition, one planner indicated it would be helpful to have the CTU comments on this map as well.
Finally, the type 4 map (CTU emotional spaces) received 12 “yes” votes (48%) and a combined 21 experts found this map useful or somewhat useful. Experts commonly highlighted the usefulness of the type of detailed qualitative data included in this map, noting that particularly in cases where there is agreement amongst respondents, comments may identify areas for interventions. The scale of this map was identified as particularly useful in achieving a depth of analysis at a given location as it limits external factors that may affect CTU opinions across a larger area. The planners who did not find this map particularly useful indicated that perhaps the user comment was not that effective on the map but could be more useful in an accompanying written narrative, while one planner asked to see comments for more places. The negative comments focused on seeking alternative presentation formats, such as “bar charts and line graph with the number of times certain words were used”.
Understanding CTU emotions and emotional maps can be useful in transportation planning and practice. First, experts were asked to weigh in on the usefulness of emotional experiences tied to transportation and the influence this type of information may have in transportation planning. Nearly all experts commented on the user experience as something that must be understood in order to engage in effective transportation planning. It was repeatedly noted that feedback on the emotions associated with various transportation choices is highly valuable but rarely captured. Several experts pointed out that in many cases, very small details can greatly influence the emotional experience of a journey, and maps like the ones presented in this study can provide highly specific feedback related to the emotional experience associated with a journey, including what aspects contributed to that experience. A few of the respondent experts noted that this sort of planning seeks to capture the “choice-rider”, or individual who opts to take transit or bicycle because it is more appealing, not simply because it is their only option.
Our final question on the expert opinion survey was about the usefulness of proposed maps and visualization over existing sources of information in understanding CTUs and their travel choices. Interestingly, though most experts believe that the emotional experiences associated with transportation choices are valuable, few reported having any real data on this subject. Many experts commented on the fact that much of the current data used to understand CTUs come from surveys, which may or may not effectively elicit information. For example, if CTUs are asked to identify locations for improvements, they may not be able to do so effectively if they are not well versed in what those improvements may be; by asking this same group of CTUs to map the emotional experiences of their journeys, it may present a better means of identifying locations to target for improvements.
Experts generally reported that the maps presented a unique approach to the depiction of CTU experiences; the reported significance of this ranged from nearly irrelevance, with one expert reporting “Some data is better than nothing!” to transformative, with one expert reporting “deeper understanding may be unlocked by a spatial evaluation”. Three experts suggested that it would be valuable if the sort of data represented in these maps could be collected and regularly evaluated using a mobile app.

5. Discussion

5.1. CTU Emotions—Types, Reasons, and Locations

In order to answer the first research question—what types of emotions do CTUs experience, why, and where?—we explored CTU emotions in specific locations associated with their trips. Our findings revealed that CTUs go through multiple mental processes leading to a wide range of emotions, from joy and trust to anger and disgust. CTUs who participated in our survey, however, expressed more negative than positive sentiments. The top four emotions that they experienced were anger, disgust, fear, and sadness—all negative. These emotions were either directly connected to locations (e.g., roads, intersections, stations) or operational/management issues (e.g., on-board amenities, bike parking, security, road conditions, unprofessional staff). These results are consistent with prior research findings that cyclists not only appreciate the aesthetic quality of bike routes or the surrounding environment but also are aware of diverse emotional experiences those routes may offer [44,47]. Scholars have associated better cycling infrastructure, cycling facilities, and safety with positive experiences, attitudes, and behaviors among bicycle users [48,49,50,51,52,53]. Negative feelings are engendered by cycling close to motorized transport or sharing space with it [44,48,54]. A majority of CTU emotions in our study, as explained above, are associated with these same factors. One unique contribution of our work, however, is that we have identified emotions and places/factors associated with those emotions for a specific type of bike users—the CTUs—but not all types of cyclists.

5.2. Usefulness of CTU Emotional Maps in Transportation Planning

Addressing our second research question—How can mapping and understanding these emotions help urban planners comprehend CTU travel behavior and build a more sustainable transportation system?—we followed a two-step process. First, we created four types of emotional maps representing CTU emotions and their associated locations. These maps demonstrate that travel behavior (which is usually studied with quantitative data sets that emphasize demographic, socio-economic, and attitudinal indicators) can be successfully supplemented with geo-referenced data identifying emotional reactions to specific locations and routes. Where such assessment of emotions has been addressed in previous studies [44], it has been attributed to entire origin-to-destination trips or entire bike routes. In this study we have been able to attribute CTU-experienced emotions to specific geographic features along the routes of such trips. Thus, our work demonstrates a level of detail that can enhance our understanding of mode and route choice-making in important ways.
Second, we surveyed 25 experts (transportation planners) to provide feedback on our maps and to assess the potential usefulness of emotional mapping in planning. The results from this survey signal ways that public policy can support positive emotions by fostering a variety of high-quality transportation options. This is an important contribution to planning because it expands the policy toolkit by which government officials might increase positive experiences in transportation environments and encourage multimodal uses. When it comes to understanding emotions and policy, the toolkit is currently understood to be quite limited [12]. Several experts believed that emotions, particularly fear, anger, or other negative emotions, may provide an opportunity for the identification of improvements to enhance safety. Such improvements could have an immediate, dramatic effect if they reduce injuries and fatalities at specific geographic locations. In the long run, they may affect travel behavior by encouraging commuters to choose more sustainable, non-motorized, and shared modes of transportation more frequently [7]. Many experts commented that asking CTUs to map the emotional experiences of their journeys may present a better means of identifying locations to target for improvements. Our work illuminates one set of transportation infrastructure features that affect emotions. Understanding such structures is crucial for facilitating policy interventions [1]. This study also confirms findings documented in existing literature that understanding the emotional dimensions of bicycling and conducting emotional mapping analysis can contribute to successful cycling policy and infrastructure planning [44,55].
Based on this study and the expert survey, we argue that the development of a methodology that permits detailed, geo-referenced data to reveal emotional reactions to specific locations along a traveler’s route holds the potential to provide invaluable information for transportation planning and practice. We provide a methodology for understanding geographies and structures that limit positive emotions and that are amenable to policy intervention, both of which are key recommendations in the literature [1,7,12]. Focusing on data summarizing self-reported emotional responses to the physical world in general and the transportation infrastructure in particular opens up rich opportunities to think more qualitatively.

5.3. Limitations and Future Studies

Methodological challenges that arose during the course of this study should be addressed in future studies. It is important to first note that the four types of maps presented in the study are not the only types of maps that could be created from our CTU-generated qualitative data; rather, they were used in this study as four notable examples. Future studies can experiment with additional forms of visualization methods. The type 3 (CTU emotions) map in particular can benefit from future modifications to display the data in a simpler form. The map was critiqued by some of the expert respondents for using eight different colors. Our study was based on a survey with a limited amount of responses (n = 74), and several experts felt that collecting such data through crowdsourcing and mobile apps would be beneficial. Future studies should attempt to create qualitative maps using crowd sourcing, apps, and modeling. At the time of this publication, there exist crowdsourced data sets collected by metropolitan planning organizations (MPOs) that could be used in this type of study; the Delaware Valley Regional Planning Commission (DVRPC), for example, has created RideScore, a web map application that focuses on issues facing access between transit-to-bike infrastructure [56]. This app focuses on regional rail stations and omits bus routes, providing opportunities to extend the research and work to more explicitly consider bike–bus coordination.
Future studies may explain the underlying reasons behind CTU emotions attached to places and routes in greater detail. They may also explore the extent to which we can separate the emotions or sentiment analysis explored in this study by mode of transportation. It would be valuable to understand how many “positive” or “negative” sentiments were associated with bike segments of respondents’ trips, and how many were associated with transit segments. Further studies should be done to determine the most effective mode of collecting geo-visualized emotions. Possible alternatives may include sensors developed to identify changes in pulse and blood pressure, such as the galvanic skin response devices used in the Nold studies cited above [31,32], which are then associated with specific types of emotions, or using post-travel recall. Overall, information related to CTUs is small and would benefit from further experimental studies.

6. Conclusions

Understanding the link between emotions and non-motorized and shared mode transportation environments is critical to sustainable planning efforts. This study has explored and visualized human emotions in specific locations associated with trips that combine the use of bicycles and transit. We derived these data using content analysis of words and images not expressly meant to reveal emotions. We have demonstrated that the depiction and analysis of data reflecting emotions is not only possible, but intriguing and provocative. This study links planners and CTUs, and fosters new conversations and plans. It provides insight to the CTUs’ perceived reality of interacting with urban spaces. Mapping the mobility of emotions ensures a more comprehensive understanding of the community’s travel experience that aids in better transportation planning and happier neighborhoods.
In addition to practical applications, the paper advances several theoretical points. First, we have used GIS to combine qualitative and quantitative data to privilege a heretofore understudied and underappreciated form of knowledge in planning: The emotional experience of urban space by cycle–transit users. Our results demonstrate that such knowledge may help planners create environments that entice more people to cycle and connect with transit, which in turn will increase the sustainability of our societies. Additional work is needed, however, to perfect the procedures and link planners and cycle–transit users themselves to the needed information. Second, this paper links the study of emotions with the transportation environment, and thus it extends psychological research in the area of happiness geographies and the role that planners might play in increasing mental and emotional health. The project can be extended to other forms of mobility and transportation environments. Finally, the project also continues to develop the nexus of geographical and planning theory, with regard to the core concept of place.
This paper further illuminates the idea that people come to know the world through place. As one respondent stated “the way that people perceive an area is the reality”. Urban planners should continue to study the variety of ways that a place affects how the individual interprets and understands his or her reality, as well as what actions that person takes upon achieving such understanding. In this case, we have shown how place affects travel of a particular kind and how planners might intervene. We hope that in this moment of desperate urgency around mitigation of human-induced climate change, our findings embolden public policy to utilize place as an essential component in implementing more sustainable societies worldwide.

Author Contributions

Conceptualization, M.M. and B.F.; data curation, M.M. and B.F.; formal analysis, M.M., B.F. and K.K.; methodology, M.M. and B.F.; visualization, M.M.; writing—original draft, M.M., B.F., and K.K.; writing—review and editing, M.M., K.K., and B.F.

Funding

This research received no external funding.

Acknowledgments

We sincerely acknowledge transportation planner Leonard Bonarek for his contribution in the early stages of data analysis/coding and Rowan University student Samain Sabrin for assisting us with GIS mapping and visualization. We also acknowledge transportation planner Kyle Hearing and Rowan University planning students Giavanni Rizzo and Cassie Shugart for providing additional research assistance. We presented early results of this study in the national conference of the Association of Collegiate Schools of Planning in 2016 and we thank a number of participants who offered us productive feedback. Last but not the least, we thank Philadelphia area transportation planners who kindly participated in our online survey.

Conflicts of Interest

The authors declare no conflict of interest.

References

  1. Thompson, S. Introduction to Happiness and Society. In Oxford Handbook of Happiness; David, S., Boniwell, I., Ayers, A.C., Eds.; Oxford University Press: Oxford, UK, 2012; pp. 427–430. [Google Scholar]
  2. Hanson, S. The Context of Urban Travel: Concepts and Recent Trends. In The Geography of Urban Transportation; Hanson, S., Giuliano, G., Eds.; The Guilford Press: New York, NY, USA, 2004; pp. 3–29. [Google Scholar]
  3. U.S. Census Bureau. Modes Less Traveled: Walking and Bicycling to Work in the U.S. 2008–2012. Available online: https://www2.census.gov/library/publications/2014/acs/acs-25.pdf (accessed on 16 May 2019).
  4. U.S. Bureau of Transportation Statistics. Available online: https://www.bts.gov/content/us-vehicle-miles (accessed on 16 May 2019).
  5. Meerow, S.; Mitchell, C.L. Weathering the storm: The politics of urban climate change adaptation planning. Environ. Plan. A Econ. Space 2017, 49, 2619–2627. [Google Scholar] [CrossRef]
  6. Adey, P. Mobility; Routledge: New York, NY, USA, 2010. [Google Scholar]
  7. Ballas, D.; Dorling, D. The Geography of Happiness. In Oxford Handbook of Happiness; David, S., Boniwell, I., Ayers, A.C., Eds.; Oxford University Press: Oxford, UK, 2012; pp. 465–481. [Google Scholar]
  8. De Vos, J.; Schwanen, T.; Van Acker, V.; Witlox, F. Travel and Subjective Well-Being: A Focus on Findings, Methods and Future Research Needs. Transp. Rev. 2013, 33, 421–442. [Google Scholar] [CrossRef] [Green Version]
  9. Morris, E.A.; Zhou, Y. Are long commutes short on benefits? Commute duration and various manifestations of well-being. Travel Behav. Soc. 2018, 11, 101–110. [Google Scholar] [CrossRef]
  10. Cummins, R.A. Measuring Happiness and Subjective Well-Being. In Oxford Handbook of Happiness; David, S., Boniwell, I., Ayers, A.C., Eds.; Oxford University Press: Oxford, UK, 2012; pp. 185–200. [Google Scholar]
  11. Flamm, B.J.; Rivasplata, C.R. Public transit catchment areas: The curious case of cycle-transit users. Transport. Res. Rec. 2014, 2419, 101–108. [Google Scholar] [CrossRef]
  12. Mulgan, G. Well-Being and Public Policy. In Oxford Handbook of Happiness; David, S., Boniwell, I., Ayers, A.C., Eds.; Oxford University Press: Oxford, UK, 2012; pp. 517–534. [Google Scholar]
  13. Pfeiffer, D.; Cloutier, S. Planning for happy neighborhoods. J. Am. Plan. Assoc. 2016, 82, 267–279. [Google Scholar] [CrossRef]
  14. Vitterso, J. Introduction to Psychological Definitions of Happiness. In Oxford Handbook of Happiness; David, S., Boniwell, I., Ayers, A.C., Eds.; Oxford University Press: Oxford, UK, 2012; pp. 155–160. [Google Scholar]
  15. Plutchik, R. The nature of emotions: Human emotions have deep evolutionary roots, a fact that may explain their complexity and provide tools for clinical practice. Am. Sci. 2001, 89, 344–350. [Google Scholar] [CrossRef]
  16. Keiser, B.E. Still feeling our way toward sentiment analysis. Online Search. 2015, 39, 24–28. [Google Scholar]
  17. Mohammad, S.M.; Turney, P.D. Crowdsourcing a Word-Emotion Association Lexicon. Comput. Intell. 2013, 29, 436–465. [Google Scholar] [CrossRef]
  18. Kwan, M.P. Affecting Geospatial Technologies: Toward a Feminist Politics of Emotion. Prof. Geogr. 2007, 59, 22–34. [Google Scholar] [CrossRef]
  19. Anderson, K.; Smith, S.J. Emotional geographies. Trans. Inst. Brit. Geogr. 2001, 26, 7–10. [Google Scholar] [CrossRef]
  20. Diener, E. Subjective well-being: The science of happiness and a proposal for a national index. Am. Psychol. 2000, 55, 34–43. [Google Scholar] [CrossRef] [PubMed]
  21. Ettema, D.; Gärling, T.; Olsson, L.E.; Friman, M. Out-of-home activities, daily travel, and subjective well-being. Transp. Res. Part A Policy Pract. 2010, 44, 723–732. [Google Scholar] [CrossRef]
  22. Schiefelbusch, M. Rational planning for emotional mobility? The case of public transport development. Plan. Theory 2010, 9, 200–222. [Google Scholar] [CrossRef]
  23. Sheller, M. Automotive emotions: Feeling the car. Theor. Cult. Soc. 2004, 21, 221–242. [Google Scholar] [CrossRef]
  24. Sheller, M.; Urry, J. The new mobilities paradigm. Environ. Plan. A 2006, 38, 207–226. [Google Scholar] [CrossRef]
  25. Urry, J. Connections. Environ. Plan. D 2004, 22, 27–37. [Google Scholar] [CrossRef]
  26. Morris, E.A.; Guerra, E. Mood and mode: Does how we travel affect how we feel? Transportation 2015, 42, 25–43. [Google Scholar] [CrossRef]
  27. Morris, E.A.; Guerra, E. Are we there yet? Trip duration and mood during travel. Transp. Res. Part F Traffic Psychol. Behav. 2015, 33, 38–47. [Google Scholar] [CrossRef]
  28. Olsson, L.E.; Gärling, T.; Ettema, D.; Friman, M.; Fujii, S. Happiness and satisfaction with work commute. Soc. Indic. Res. 2013, 111, 255–263. [Google Scholar] [CrossRef]
  29. Ettema, D.; Gärling, T.; Eriksson, L.; Friman, M.; Olsson, L.E.; Fujii, S. Satisfaction with travel and subjective well-being: Development and test of a measurement tool. Transp. Res. Part F Traffic Psychol. Behav. 2011, 14, 167–175. [Google Scholar] [CrossRef]
  30. Ettema, D.; Gärling, T.; Olsson, L.E.; Friman, M.; Moerdijk, S. The road to happiness: Measuring Dutch car drivers’ satisfaction with travel. Transp. Policy 2013, 27, 171–178. [Google Scholar] [CrossRef]
  31. Nold, C. San Francisco Emotion Map. 2007. Available online: http://www.emotionmap.net (accessed on 22 July 2018).
  32. Nold, C. Emotional Cartography: Technologies of the Self. 2009. Available online: http://www.emotionalcartography.net (accessed on 22 July 2018).
  33. Keenan, K. Place ontologies and a new mobilities paradigm for understanding awareness of vulnerability to terrorism in American cities. Urban Geogr. 2014, 35, 357–377. [Google Scholar] [CrossRef]
  34. Tuan, Y. Space and Place: The Perspective of Experience; University of Minnesota Press: Minneapolis, MN, USA, 1977. [Google Scholar]
  35. Philadelphia Pedestrian and Bicycle Plan. Available online: http://www.phila.gov/CityPlanning/plans/Pedestrian%20and%20Bicycle%20Plan/Ped_B ke_Plan_ProgressReport2015.pdf (accessed on 3 March 2019).
  36. U.S. Census Bureau ACS 2015 Estimates. Available online: https://www.census.gov/ (accessed on 11 November 2017).
  37. Krippendorff, K. Content Analysis: An Introduction to its Methodology, 2nd ed.; Sage Publications: Thousand Oaks, CA, USA, 2004. [Google Scholar]
  38. Krippendorff, K. Reliability in Content Analysis: Some Common Misconceptions and Recommendations. Hum. Commun. Res. 2004, 30, 411–433. [Google Scholar] [CrossRef]
  39. Cope, M.S.; Elwood, sS. Qualitative GIS: A Mixed Methods Approach; Sage Publications: Thousand Oaks, CA, USA, 2009. [Google Scholar]
  40. Dennis, S.F.J. Prospects for qualitative GIS at the intersection of youth development and participatory urban planning. Environ. Plan. A 2006, 38, 2039–2054. [Google Scholar] [CrossRef]
  41. Eizenberg, E.; Shilon, M. Pedagogy for the new planner: Refining the qualitative toolbox. Environ. Plan. B Plan. Des. 2016, 43, 1118–1135. [Google Scholar] [CrossRef]
  42. Meenar, M.R. Using participatory and mixed-methods approaches in GIS to develop a Place-Based Food Insecurity and Vulnerability Index. Environ. Plan. A Econ. Space 2017, 49, 1181–1205. [Google Scholar] [CrossRef]
  43. Perkins, C. Performative and Embodied Mapping. In International Encyclopedia of Human Geography; Kitchin, R., Thrift, N., Eds.; Elsevier: Oxford, UK, 2009; pp. 126–132. [Google Scholar]
  44. Pánek, J.; Benediktsson, K. Emotional mapping and its participatory potential: Opinions about cycling conditions in Reykjavík, Iceland. Cities 2017, 61, 65–73. [Google Scholar] [CrossRef]
  45. Griffin, A.L.; Mcquoid, J. At the intersection of maps and emotion: The challenge of spatially representing experience. Kartogr. Nachr. 2012, 6, 291–299. [Google Scholar]
  46. Jung, J. Code clouds: Qualitative geovisualization of geotweets. Can. Geogr. 2015, 59, 52–68. [Google Scholar] [CrossRef]
  47. Forsyth, A.; Krizek, K. Urban Design: Is there a Distinctive View from the Bicycle? J. Urban Des. 2011, 16, 531–549. [Google Scholar] [CrossRef]
  48. Heinen, E.; Van Wee, B.; Maat, K. Commuting by Bicycle: An Overview of the Literature. Transp. Rev. 2010, 30, 59–96. [Google Scholar] [CrossRef]
  49. Møller, M.; Hels, T. Cyclists’ perception of risk in roundabouts. Accid. Anal. Prev. 2008, 40, 1055–1062. [Google Scholar] [CrossRef]
  50. Carver, A.; Campbell, K.; Baur, L.; Salmon, J.; Garnett, S.; Crawford, D. How Do Perceptions of Local Neighborhood Relate to Adolescents’ Walking and Cycling? Am. J. Health Promot. 2005, 20, 139–147. [Google Scholar] [CrossRef]
  51. Hunt, J.D.; Abraham, J.E. Influences on bicycle use. Transportation 2007, 34, 453–470. [Google Scholar] [CrossRef]
  52. Fraser, S.D.; Lock, K. Cycling for transport and public health: A systematic review of the effect of the environment on cycling. Eur. J. Public Health 2010, 21, 738–743. [Google Scholar] [CrossRef]
  53. Monsere, C.; Dill, J.; McNeil, N.; Clifton, K.; Foster, N.; Goddard, T.; Berkow, M.; Gilpin, J.; Voros, K.; Van Hengel, D.; et al. Lessons from the Green Lanes: Evaluating Protected Bike Lanes in the U.S. Natl. Inst. Transp. Communities. 2014. Available online: https://pdxscholar.library.pdx.edu/cgi/viewcontent.cgi?referer=https://scholar.google.com/&httpsredir=1&article=1143&context=cengin_fac (accessed on 25 August 2019).[Green Version]
  54. Furness, Z. One Less Car: Bicycling and the Politics of Automobility; Temple University Press: Philadelphia, PA, USA, 2010. [Google Scholar]
  55. Gatersleben, B.; Uzzell, D. Affective appraisals of the daily commute: Comparing perceptions of drivers, cyclists, walkers, and users of public transport. Environ. Behav. 2007, 39, 416–431. [Google Scholar] [CrossRef]
  56. Delaware Valley Regional Planning Commission. “RideScore: A Screening Tool for Identifying Candidate Stations for Bicycle Facility Investment”. Available online: https://dvrpc.org/webmaps/RideScore/ (accessed on 15 August 2019).
Figure 1. Robert Plutchik’s wheel of emotions, showing only primary emotions located in the middle ring (adapted from [15]).
Sustainability 11 04743 g001
Figure 2. Examples of sketch maps with many trip details (a) and minimal trip details (b).
Sustainability 11 04743 g002
Figure 3. Word cloud of textual data.
Sustainability 11 04743 g003
Figure 4. All routes taken by cycle–transit users (CTUs) who participated in this study.
Sustainability 11 04743 g004
Figure 5. Map type 1 (CTU trips) shows the emotions experienced by a single Philadelphia CTU during her daily commute. The commuter noted where she felt positive emotions, and what caused her to feel this way, such as the regional rail and the increased “frequency of bike use”. She felt negatively towards a “scary” unused trolley rack, a “crowded” and a “slow” bus route, and the “scariest” intersection that she came across over the course of a day.
Sustainability 11 04743 g005
Figure 6. Map type 2 (CTU comments) showcases a compilation of CTUs’ comments associated with various types of routes and stops. The comments represent both positive emotions, such as “[cycling] goes smooth and saves me SEPTA fare. Also get to feel green & smug!”, and negative emotions, such as “LOUSY bike racks”, “danger—car doors! bike lane next to parked cars & trolley”, and “help me please before I am doored!”.
Sustainability 11 04743 g006
Figure 7. Map type 3 (CTU emotions) presents the city as an emotional space. Points of interests are mapped as petals of a graphical flower—each petal represented one emotion—and routes are mapped as one or more colored lines representing different emotions.
Sustainability 11 04743 g007
Figure 8. Map type 4 (CTU emotional spaces) zooms in to a regional rail station (30th Street station), as an example, with textual data and emotion cloud. This station was undergoing a renovation project that reduced access to bike parking at the time of the survey and most respondent CTUs, reacting to the disruption, expressed negative emotions about this station.
Sustainability 11 04743 g008
Table 1. Demographic and Socioeconomic Characteristics of Survey Respondents.
Demographic and Socioeconomic Characteristics of Survey Respondents (N = 74)
CharacteristicNumber (%)Characteristic Number (%)Characteristic Number (%)
GenderMarital StatusHighest Educ. Attainment
Male58 (78%)Married/Domestic partner28 (38%)Less than high sch.3 (4%)
Female14 (19%)Single36 (49%)High School or GED6 (8%)
No Answer2 (3%)Divorced or separated3 (4%)Associate degree7 (9%)
AgeWidowed1 (1%)Bachelor’s degree28 (38%)
19–2512 (16%)No Answer6 (8%)Graduate27(36%)
26–3524 (33%) No answer3 (4%)
36–4517 (23%)Race and Ethnicity
46–5512 (16%)White55 (74%)Access to car
56–658 (11%)African American/Black7 (9%)Yes45 (61%)
No Answer1 (1%)Asian3 (4%)No27 (36%)
Income ($)Two or more races3 (4%)No Answer2 (3%)
<20,00010 (14%)Hispanic or Latino/a2 (3%)
20,000–40,00014 (19%)No Answer4 (5%)License to drive
40,001–60,00010 (14%) Yes57 (77%)
60,001–80,00014 (19%)Household Size (persons)No13 (18%)
80,001–100,0003 (4%)Maximum9No Answer4 (5%)
>100,00015 (20%)Minimum1
No answer8 (11%)Average2.6
Note: No answer indicates some respondents left questions blank or checked response choice labeled “Prefer not to say”.
Table 2. Emotions and sentiments expressed through sketch maps and open-ended comments.
Responses to Open-Ended Questions
Comments62 (84%)
No Comments12 (16%)
Map59 (80%)
No Map15 (20%)
Of those respondents who wrote comments, either in the text box or on the map
SentimentsEmotions
Positive31Anger34
Negative50Disgust32
Of those respondents who made commentsFear32
No sentiments4Sadness29
No emotions6Joy24
Neither sentiments nor emotions3Anticipation18
Trust17
Surprise6
Table 3. Themes connected to CTU negative emotions.
ThemeDefinitionSample Keywords or PhrasesCount
On-board facilitiesDiscusses issues related to facilities on transit vehicles (e.g., bus, train).Problems on-board, lack of on-board facilities, bike-on-rail restrictions, on-board bike rack, “tolerated not welcomed” by transit staff, transit staff misinformed about on-board bike policy, unprofessional transit staff, lack of “defer to cyclists” signage on-board (like for elderly), rude bus drivers, annoying passengers, difficulty securing bike on-board.37
Bike Parking and SecurityDiscusses issues related to bike parking and theft.Bike rack, bike parking, makeshift parking, missing train due to parking issues, parking disrupted by construction, theft, attempted theft, bike lock, anti-theft cameras.35
Road ConditionsDiscusses built environment issues such as bike lane quality, intersection design, as well as dangers posed by other road users.Dangerous bike lanes, getting “doored”, trolley tracks, careless pedestrians, jaywalking, cell phone distraction, cars in bike lane, dangerous intersection, lack of crosswalks, buffered bike lanes.25
Commuter AdaptationsDiscusses when CTUs had to adapt in order to continue cycling, including purchasing folding bikes or arranging for in-office parking.Folding bike, bike-on-car segment, in-office bike parking.10
Station FacilitiesDiscusses non-parking amenities at transit stations and difficulties navigating built environment at stations with bikes. Navigating stairs, bad shelters, bad rack placement, narrow doorways, platform/train levels.8
Transit LogisticsDiscusses issues of bus schedules, timeliness, and schedule integration of transit modes. Bad bus connectivity, bad bus schedule integration, late train, infrequent bus schedules.6
Conditional Use of TransitDiscusses when some users decide to take transit conditionally due to issues such as darkness, weather, and variability of transit schedules. Resorting to transit in rain, transit: Rarely resorted to, varying routes depending on darkness, long bike ride to work/longer train ride home.6
Table 4. Expert opinion on four map types.
“Type 1” (CTU Trips) Maps Can Effectively Convey an Emotional Account of a Journey“Type 2” (CTU Comments) Maps Can Effectively Convey a Set of Opinions on Routes and Locations“Type 3” (CTU Emotions) Maps Can Effectively Convey CTU Emotions Related to Routes and Locations“Type 4” (CTU Emotional Spaces) Maps Can Effectively Convey a Set of Opinions on Specific Locations
n%n%n%n%
Yes1040135210401248
Somewhat14569361040936
No14312520416
Total25100251002510025100

