1. Introduction
As leaders of cities aim to effectively respond to several issues such as air pollution, climate change, energy scarcity, and physical inactivity, transport is viewed as an important element in these discussions. Many new mobility initiatives prioritize sustainable means of getting around town and in this landscape, the value of spurring more bicycling is rising quickly. Bicycles are advantageous because, relative to cars, they take up less space, pollute the air less, and are less noisy. A core challenge currently faced by policy-makers, however, is that most of the existing infrastructure favors automobiles. Most travelers in most cities are accustomed to navigating in the urban environment within the confines of a car. Providing safer environments to encourage cycling more is a core challenge for city leaders [
1,
2,
3,
4], and in this landscape it is necessary to understand how elements of a city’s infrastructure provide for or impede cycling comfort. More specifically, are there any specific factors that moderate how safe cycling is perceived by users?
The bulk of what is known about bicycling derives from studies examining use (e.g., speed, rates of use, types of cyclists) as influenced by the nature of bicycling facilities, land use features, or types of intersection treatments [
5,
6,
7,
8,
9]. Other lines of research focus on elements that impact safety, drawing attention to general contexts (e.g., types of corridors) or salient design treatments [
10,
11,
12,
13]. Lacking in this body of knowledge are insights about how bicyclists through their eye gaze movements process conditions of the built environment, thereby affecting levels of stress while cycling.
While all urban travelers are deluged by visual information along their paths, at least two conditions make such a deluge important for cyclists. First is the speed at which urban cyclists travel, being faster than walking but typically slower than motorized modes. Cyclists frequently find themselves having to react to car users, who frequently travel at speeds greater than 20 kilometers per hour, thereby requiring quick reactions. A second is that urban cyclists usually find themselves traveling on crowded city streets, often lacking safe or dedicated space [
14]. Failing to react quickly in pressing situations could result in life or death implications, as cyclists are often squeezed against other larger transport modes.
For bicycle travel, intersections are nodes in the network that are widely recognized as being problematic [
15]. On European roads 31% of the cyclists’ fatalities happen at junctions [
16]. Several studies point to heightened risk of bicycle crashes at intersections relative to other road sections [
17,
18,
19,
20,
21]. Yet, few inquiries are conducted in real environments to understand the relationships between conditions in intersections that trigger this heightened risk and physiological dimensions. Using eye gaze behavior as a measure of how cyclists traverse in these situations, this study assesses differences by the characteristics of the intersection and the cyclists’ experience level. The research therefore advances necessary knowledge to increase the safety for these nodes in the network.
The paper is organized as follows.
Section 2 describes the experimental approaches to study cyclists’ behavior at intersections and in particular, our analysis approach and indicators proposed.
Section 3 describes the main features of the case study to which the methodology has been applied. In
Section 4, the results of analysis are described, and in
Section 5 is discussion. In
Section 6 we present conclusions and lessons learned from this study together with possible future research developments.
2. Methods to Analyze Cyclists’ Behavior at Intersections
Past experimental work to understand cycling behavior in different types of environments is generally divided into two groups: naturalistic and non-naturalistic studies. The former allows participants to be observed and analyzed in their natural environment (on the street); in the latter, the cyclist is subjected to a survey or an environment akin to a laboratory setting. Both approaches have drawbacks. For example, in naturalistic settings, the need to carry cumbersome equipment and monitoring devices condition the behavior of the participant. Studies in non-naturalistic environments are limited by their ability to replicate real-world conditions. Advancing technologies and data collection strategies, however, are blurring lines between the two. An assortment of new equipment and methods are being creatively employed. It is helpful to briefly canvas the available approaches and findings.
In gauging levels of stress of cyclists at intersections, more specifically, varied methods have been employed. Stated preference surveys, a longstanding approach, have been applied to study the cycling conditions along a link and at signalized intersections [
22,
23]. Leveraging secondary data, videos are frequently used to develop and refine safety risk models for cyclists [
24]. New in-roads and methods are providing more accurate measures of cyclists’ stress using, for example, galvanic skin response. The recent work of Caviedes and Figliozzi [
15] provides a thorough account of these developments in efforts to measure stress levels of cyclists traveling in real-world conditions with different street designs. Notable is that this study also highlighted how signalized intersections yield hotspots for stress.
More germane to this work, Prati et al. adopted an eye-observational methodology to investigate differences in cyclists’ crossing behavior at intersections, paying particular attention to demographic characteristics [
25]. Results here, for example, showed that visual search strategies across different types of cyclists moderated the probability of running a red-light. More specific methods measure eye gaze. For example, Van Loon et al. [
26] employed an eye-tracking equipment to observe study participants as they watch animated video clips and make judgements about approaching vehicles at a T-junction. Kovàcsovà et al. [
27] analyzed cyclists’ eye movements and behaviors while crossing an intersection at different speeds. Findings here suggest that observers fixate more often and for a longer duration on a threatening object than on a neutral object [
28,
29]. At intersections, it can be expected that road users shift their attention toward potentially hazardous objects while allocating most visual attention to high-value information sources [
30,
31]. However, this research, while using eye tracking experiment, is limited because it is carried out in non-naturalistic environment (laboratory). Other eye-tracking studies, conducted among automobile drivers in real world environments, have shown that hazardous events reduce saccadic activity (i.e., reduced spread of search) and increase fixation durations on the hazardous object [
32,
33,
34,
35]. The overall knowledge base on the gaze behavior of cyclists is scarce relative to that of automobile users.
Analysis Approach and Indicators
Our investigation uses a variety of eye gaze measures to capture the behavior of cyclists around signalized intersections. Specifically, eye gaze measures can be approached as proxy for the visual workload of the cyclist [
36] and the amount of cortisol activity; we aim to understand differences by cyclists’ experience level and type of intersection. Furthermore, we quantify characteristics of eye gaze to inform aspects of street design. The primary aims are to: (1) demonstrate and understand how eye-tracking technology can be used to measure physiological responses of cyclists (e.g., duration of eye fixation), and (2) how design characteristics of intersections moderate how cyclists of various experience level negotiate the intersections, as measured by the number and duration of fixations.
As is common in this work, eye movements are measured by smooth pursuits, saccades (glances), and fixations [
37,
38,
39,
40]. When gauging how eyes visually processes information, fixation, and its characteristics (i.e., position, duration, etc.) are important [
37]. Fixations are when the eye extracts the most information about the surroundings [
41]. In this respect, “dwell-time fixation” is defined by a minimum fixation duration of 100 ms and a maximum visual angle variation of one degree. Consistent with protocol from similar studies [
36,
42,
43,
44], if the visual angle varies up to one degree, it means that the gaze is fixed; the end of a fixation is defined when the eye deviates from the fixation start position by more than one degree. The list of variables measured in this study are presented in
Table 1 with their description;
Table 2 presents how the analysis is segmented by type of intersection and experience level.
3. Case Study
3.1. Study Area
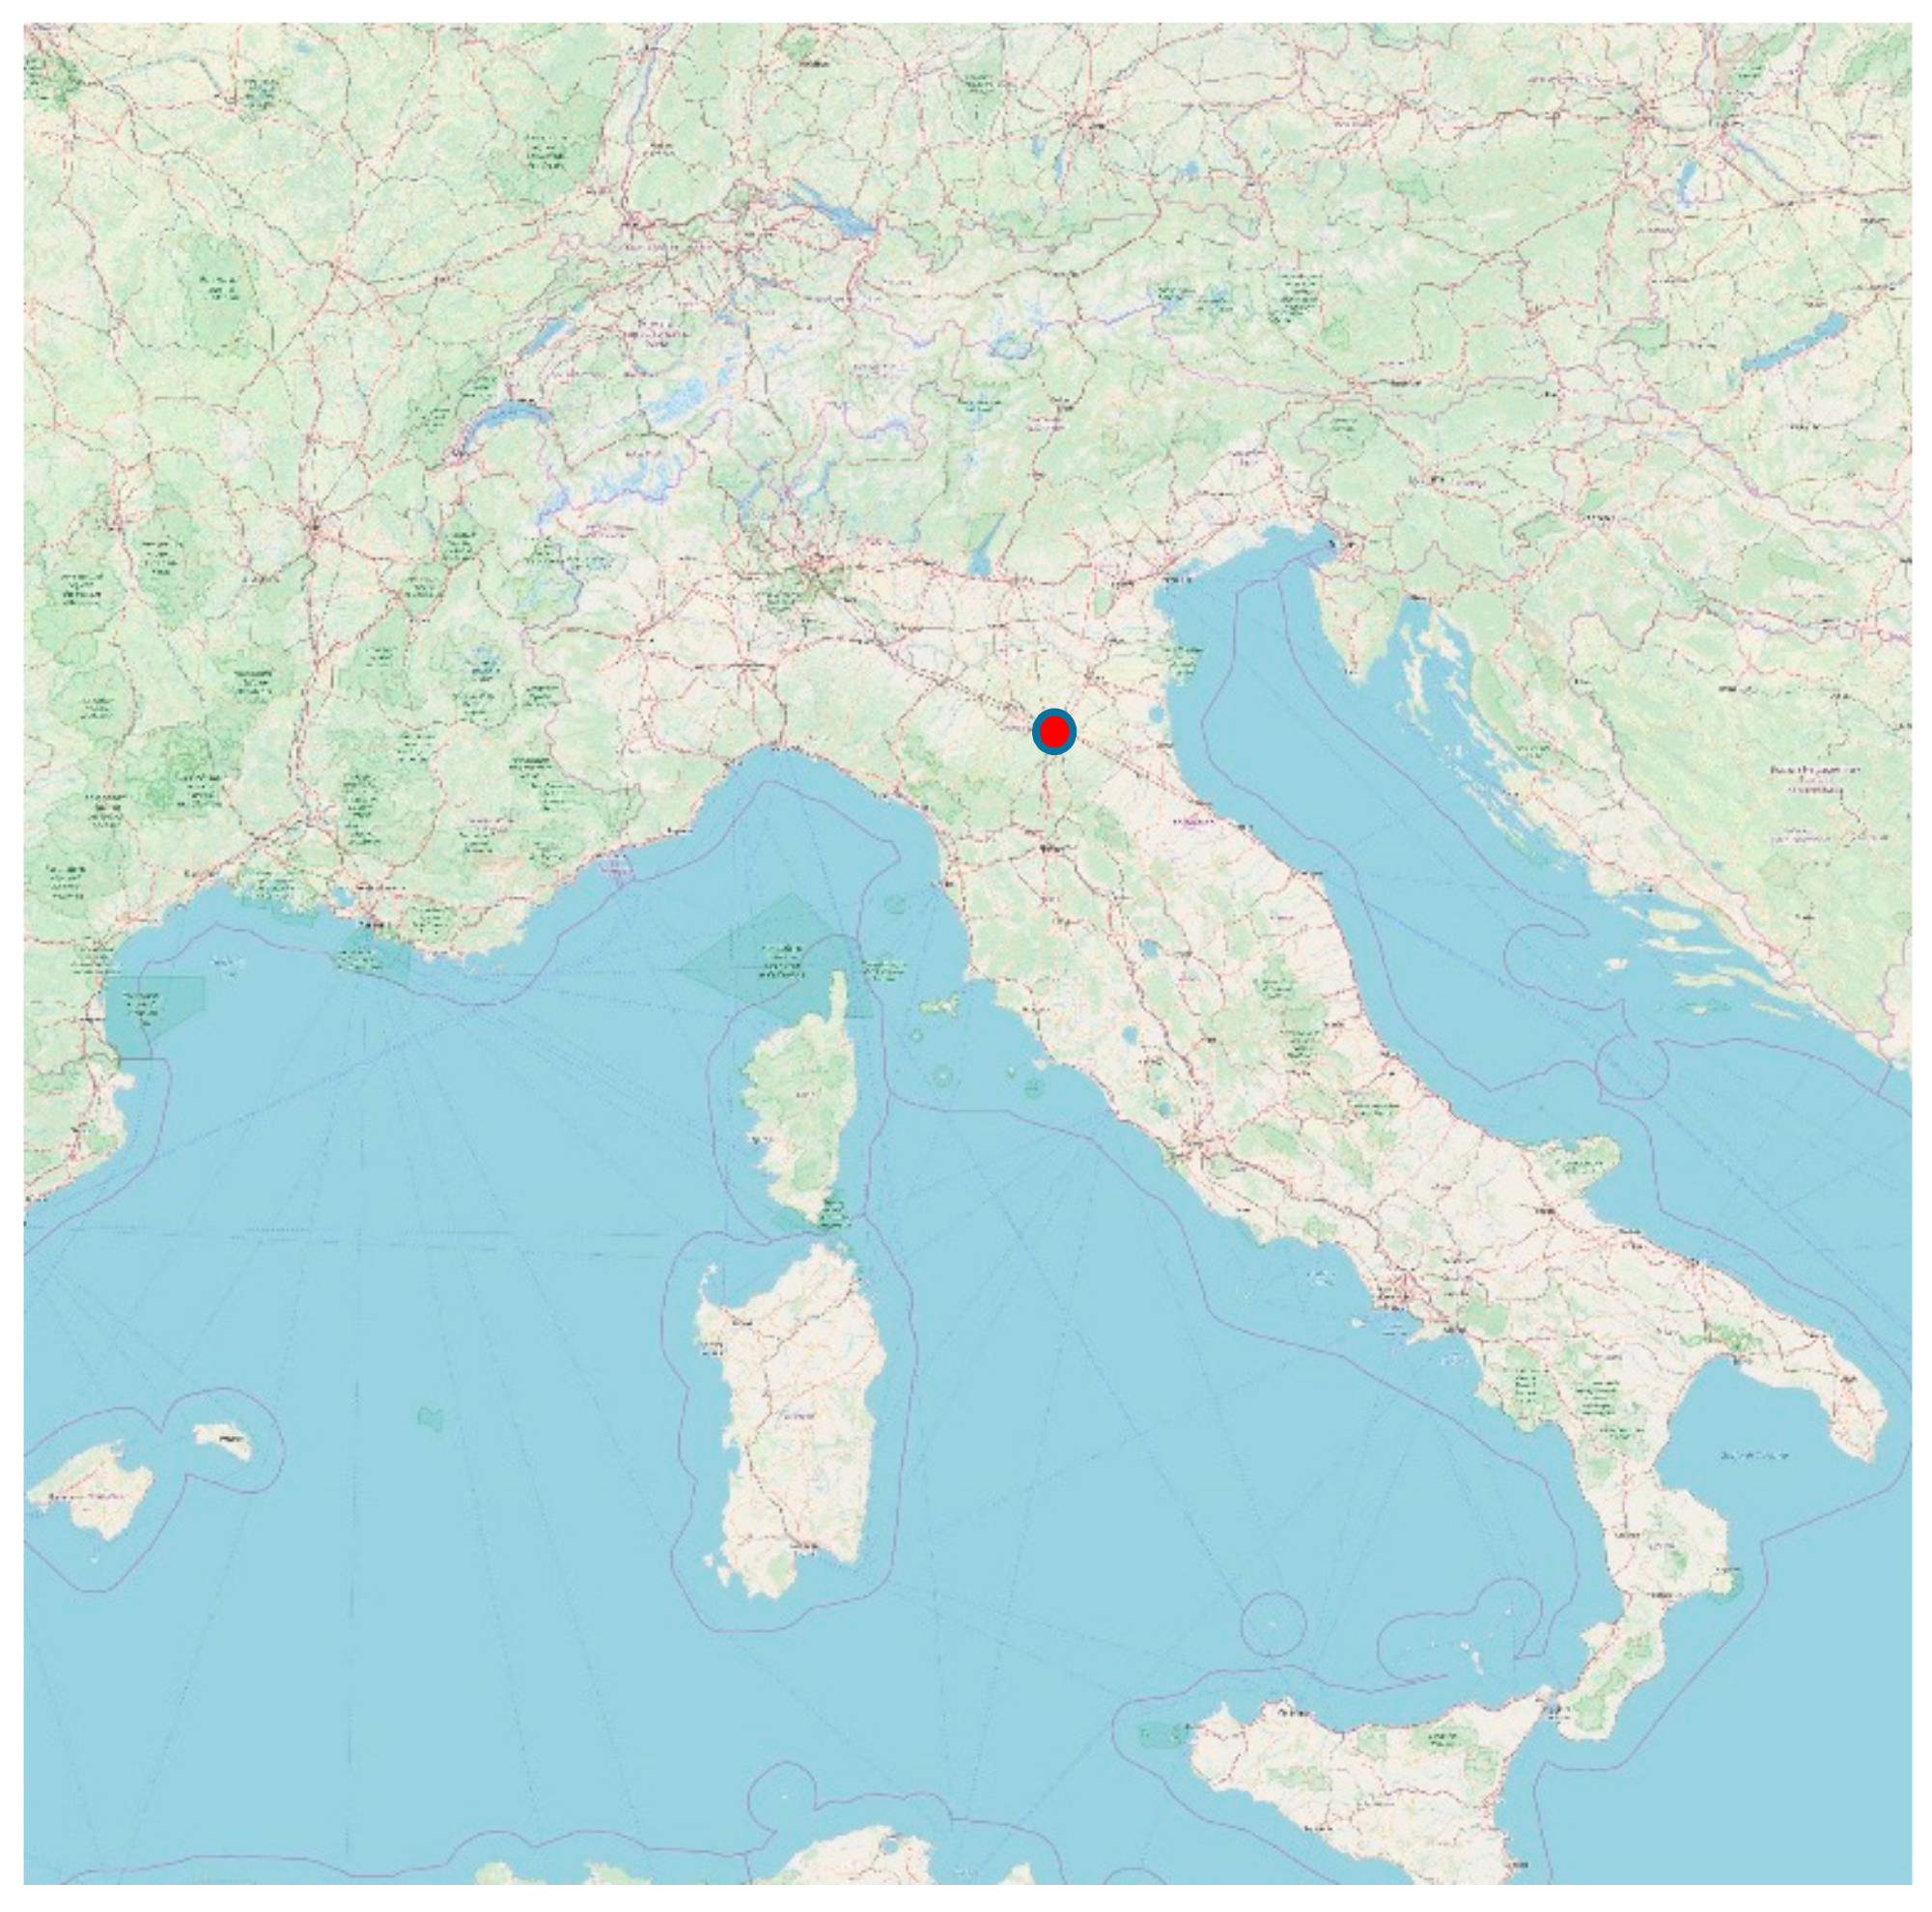
We performed this study in Bologna, a mid-sized northern Italian city with approximately 390,000 inhabitants [
45];
Figure 1 shows the location relative to Italy. As the findings from a study of this nature are impacted by conditions of the built environment, which are localized, we briefly describe general features of this transport context and its cycling environment. The car ownership in Bologna equals 0.515 cars per inhabitant [
45], which corresponds to 0.97 cars per household, typical other mid-sized Italian cities [
46]. The meters of cycling facilities per resident is 0.330 m/citizen in 2018 [
45], which is relatively high compared with other medium to large Italian cities. The actual street scene, while deemed chaotic by many thresholds relative to larger cities or cities further south, is manageable for most cyclists. Moderate temperatures (barring August) allow convenient cycling year round and the bicycle commute mode share is equal to 8.0%, therefore higher than the average for Italy. Based on a survey carried out by TNS opinion and social network in the 28 Member States of the European Union between the 11th and 20th of October 2014, the average bicycle mode share was 8.0% [
47], whereas in Italy the percentage of people who frequently commute by bike was approximately 4.7% in 2017 [
48].
3.2. Data Collection and Apparatus
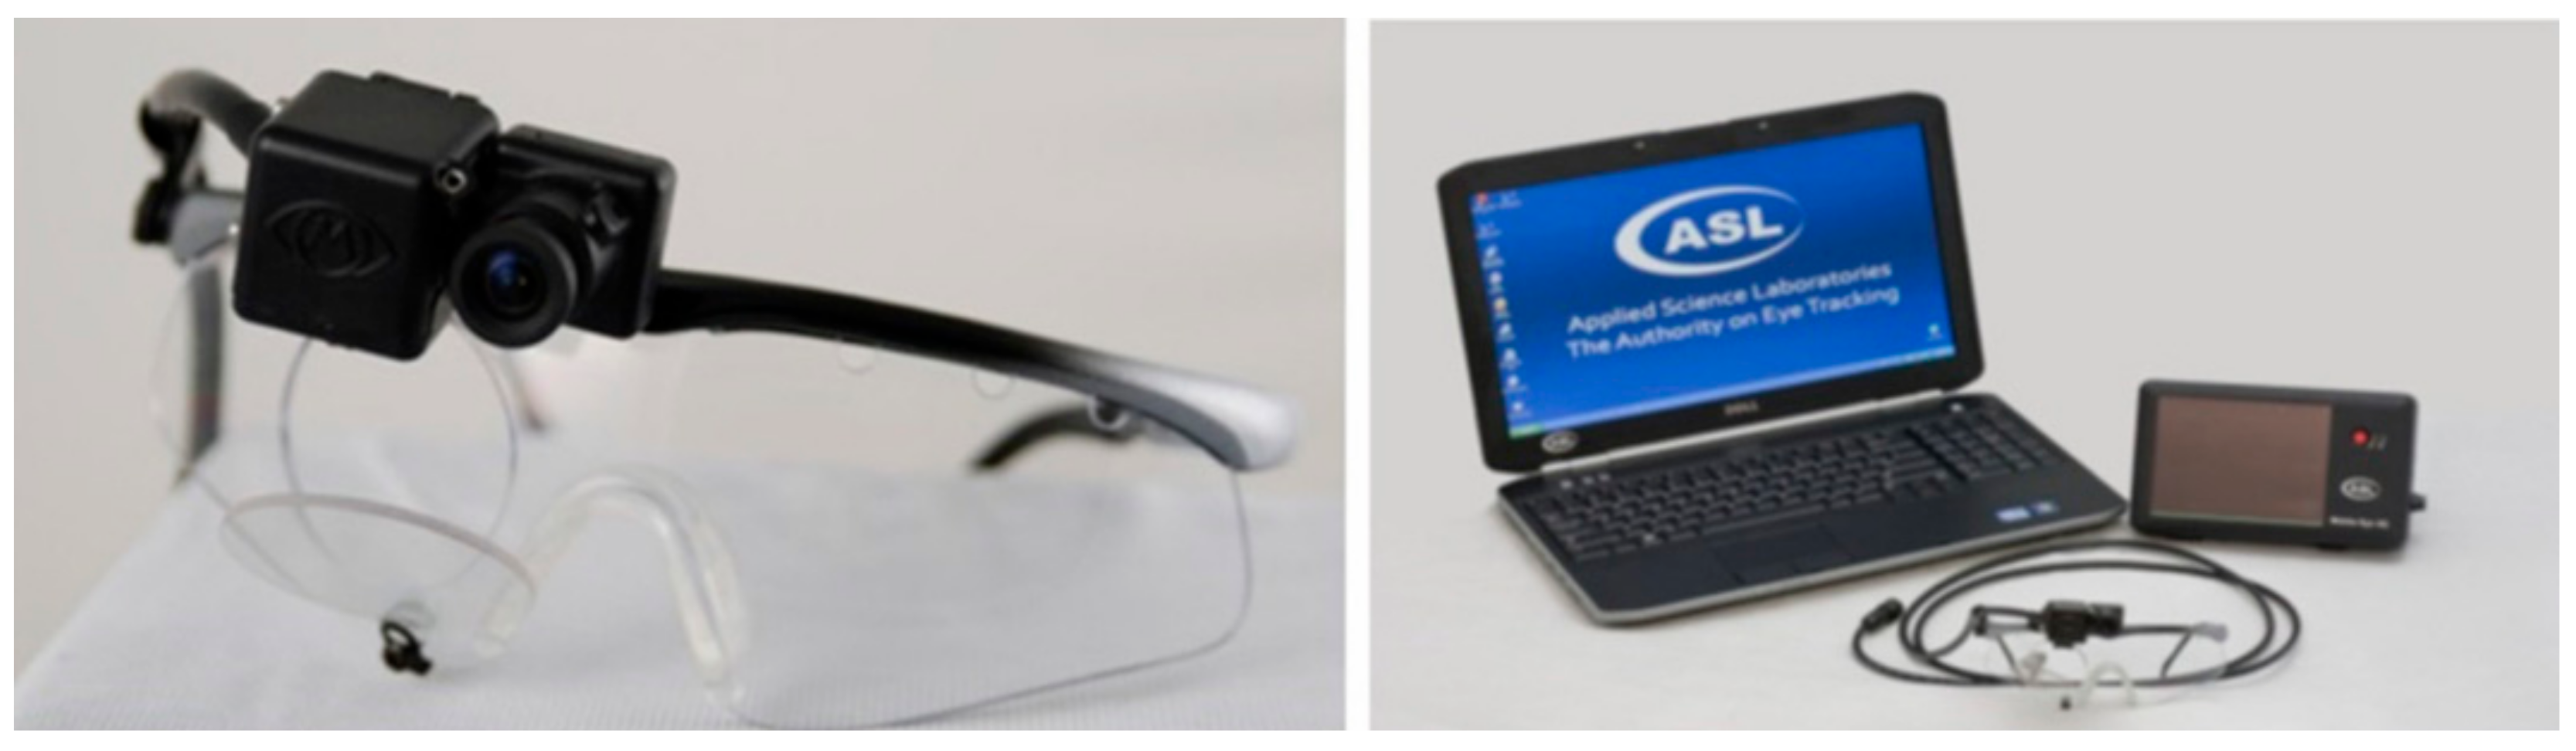
We recorded data using an ASL Mobile Eye-XG system. Sample rate was 30 Hz with an angular precision of 1°. This system consists of two digital high resolution cameras, both mounted on lightweight glasses, a portable wireless data transmit unit (DTU), a laptop and two software: EyeVision and ASL Results Plus GM (
Figure 2).
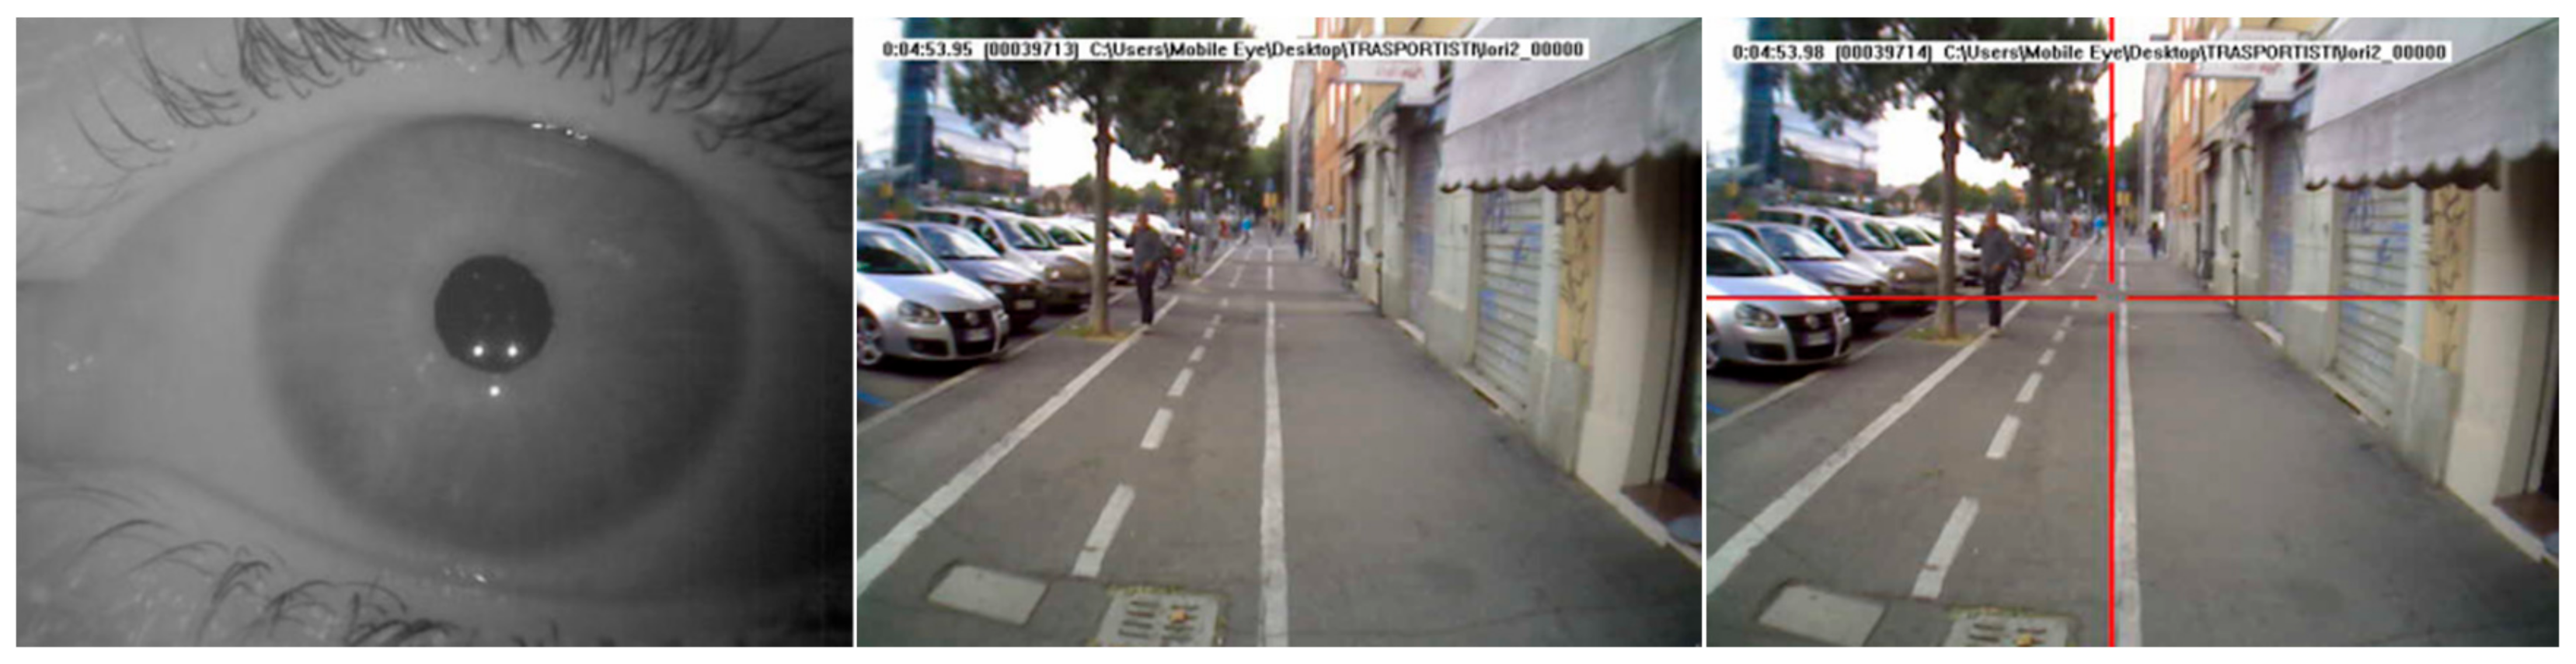
Of the two cameras, one is infrared and records the position of the participants’ right eye pupil and the corneal reflex, and the other records the visual scene in front of them. The ASL software superimposed fixations spots to the cyclist’s visual scene in the form of a red cross with a time resolution of 33 ms (
Figure 3).
A primary advantage of this system is that owing to the portability of the equipment, cyclists are minimally impeded by the measurement device. The apparatus detects the direction of the eye using a calibration method to measure the vector formed by the pupil relative to the light reflection (corneal reflections); it uses three infrared lights projected on the right eye to do so [
40] (
Figure 3).
One of the outputs is an “image scene” video (the view in front of the cyclist) superimposed with a cursor to identify the gaze position. Gaze position is measured using pixels on the screen and it is recorded via a sequence of frames at a speed of 30Hz with an accuracy of 0.5 degrees. A frame is considered valid when it records the gaze position in the image scene. However, in some cases the gaze position is not recorded in the image scene, thereby yielding invalid frames. To gauge the precision level of the eye movement data, we use an eye tracking ratio (ETR) defined as the percentage of valid frames relative to the total recorded frames. The higher the value of ETR, the better the quality of the video. Consistent with prior protocol [
36,
42,
43,
44,
49,
50,
51], we considered a video to be acceptable when the ETR exceeds 0.8. The value of eye tracking ratio (ETR) has been determined for each data sequences video. Owing to an ETR value lower than the threshold, 21 sequences were not analyzed, resulting in 83 usable sequences.
The gaze position is measured with coordinates on an x-y plane, where the image that is being viewed is superimposed. We analyzed the data using software from Applied Science Laboratories by developing and applying an algorithm which provides row of fixation data with other indicators (e.g., duration, average point of gaze horizontal and vertical coordinates during fixation, inter fixation duration and degree). For each sequence (i.e., frames which comprise a fixation), we recorded the first fixation distance (from the traffic light) at which the participant initially fixated the traffic signal.
3.3. Test Segment
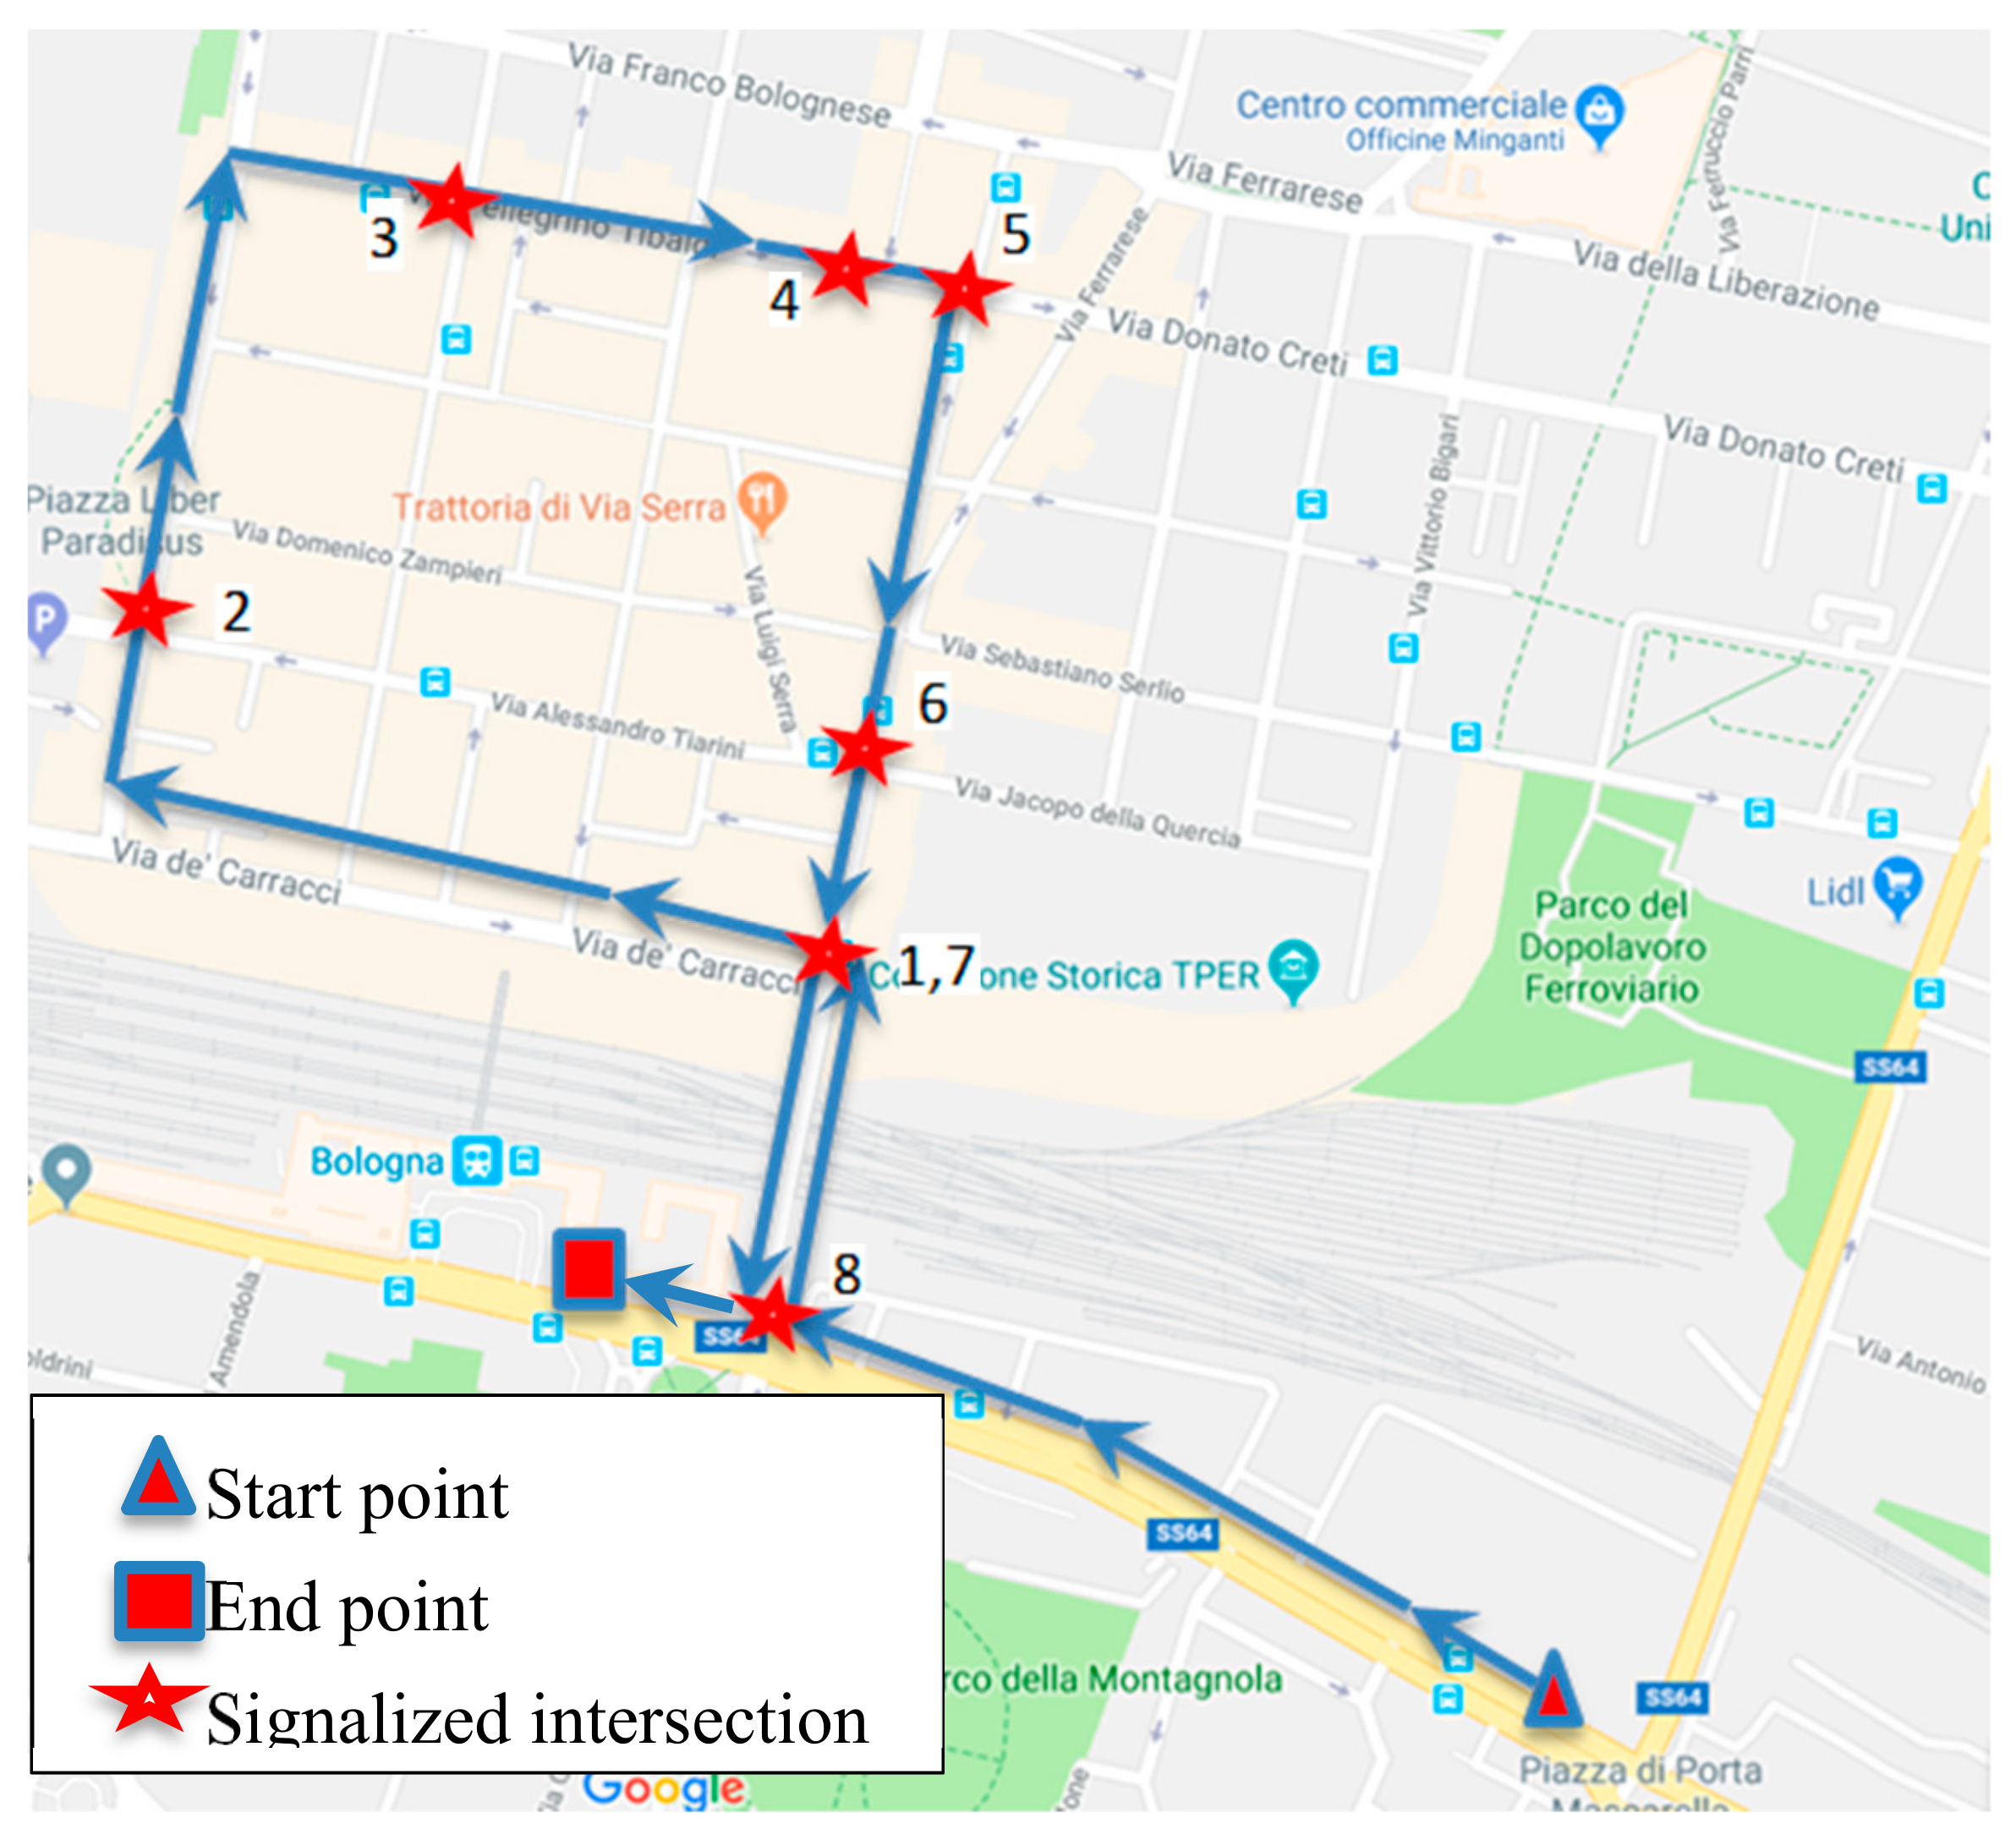
Study participants wore the eye tracking apparatus while cycling and were each prescribed to travel the same three-kilometer course close to the urban center of Bologna. The route was chosen because it traversed different types of cycling environments, including intersections with and without devoted cycling facilities (hereafter referred to as cycle tracks). The travel route defined for the experiment includes different types of cycling environments of the urban area of Bologna for a total length of about 3 kilometers. The route was divided into several segments, one for each type of cycling facility, for a total of seven segments. Four of them are off-road cycling paths, the first two are shared with pedestrians, the third is separated and reserved for cycling and again, the fourth, is shared with pedestrians. The further three segments are on the roadway, because of the absence of any separated cycling facility. The segments offer different pavement quality conditions, different widths, and variable number of signalized and un-signalized intersections. In particular, there were 21 total intersections along the route and our investigation has focused on only eight of them because they are intersections with traffic signals (
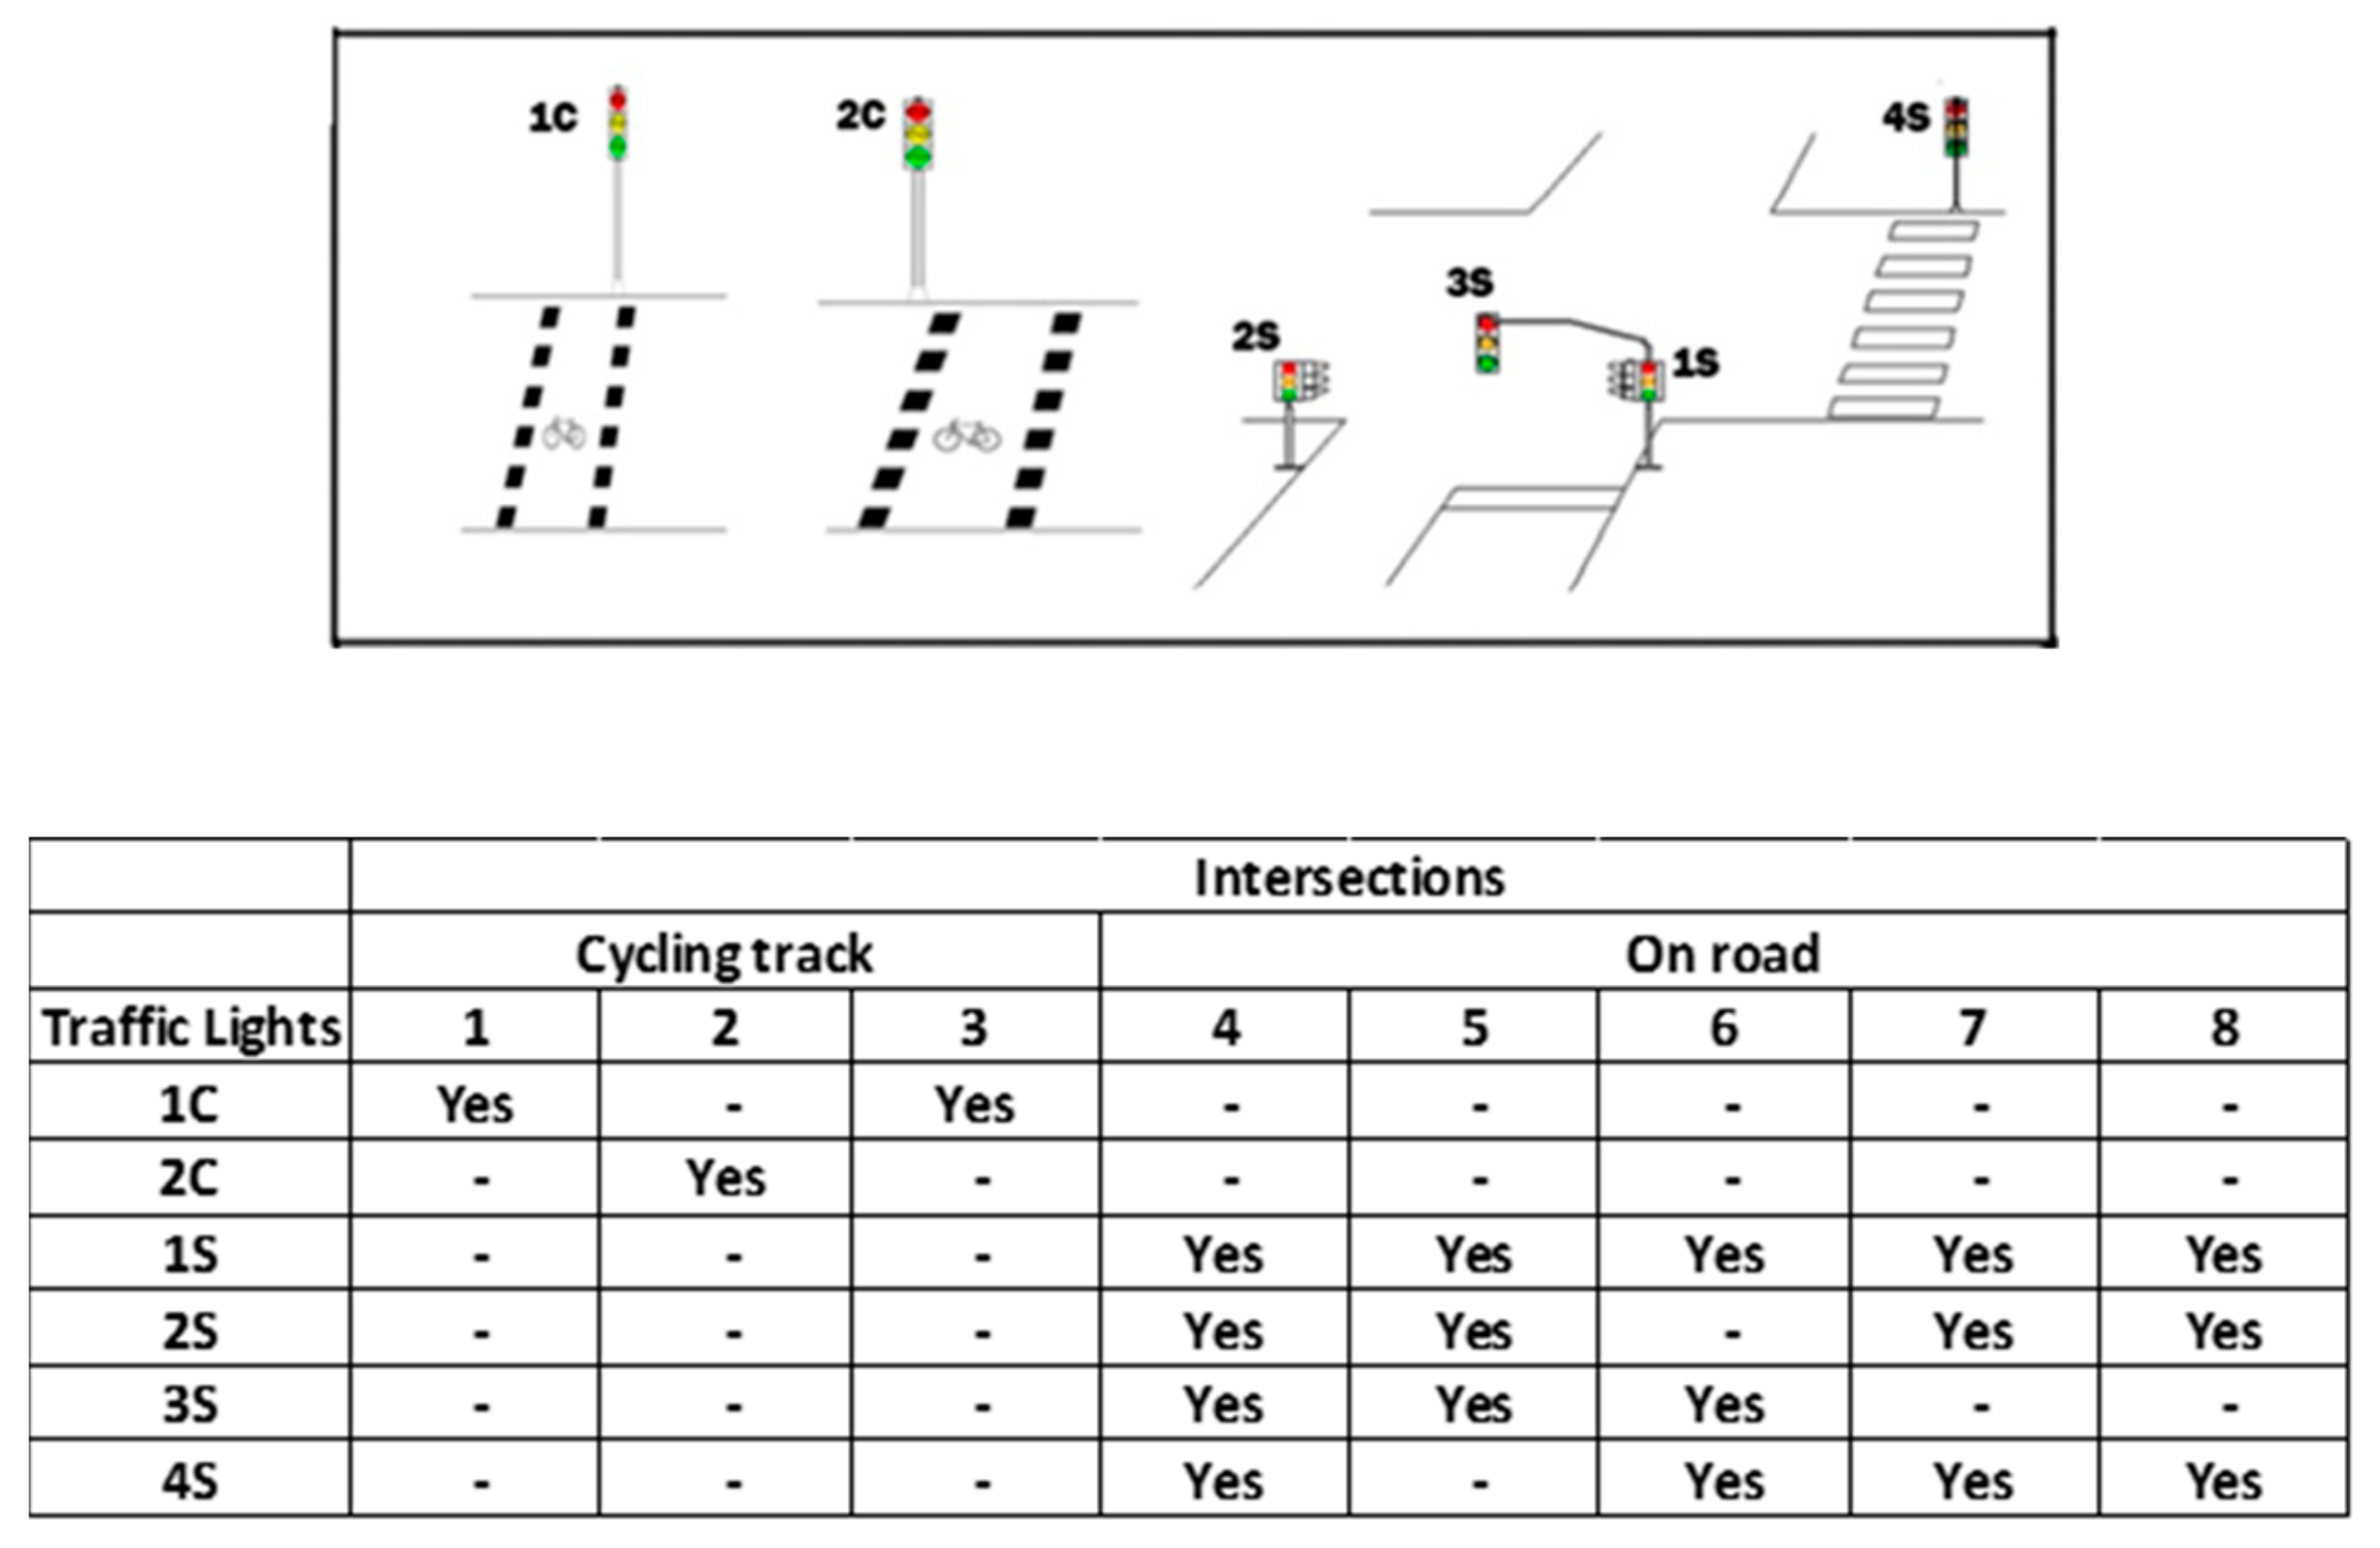
Figure 4).
Figure 5 shows the specific type of traffic lights that are present at each intersection type. For ex-ample, only one traffic light is present in 1C and 2C, differing only by its position, on the left versus on the right. In the 1S, 2S, 3S, and 4S cases, a system of lights is present (e.g., intersection 4 includes four traffic lights: 1S, 2S, 3S and 4S). Three of the signalized intersections have cycling tracks on both sides of the crossing; five of the intersections are mixed with motorized traffic. We used this feature to largely differentiate intersection type.
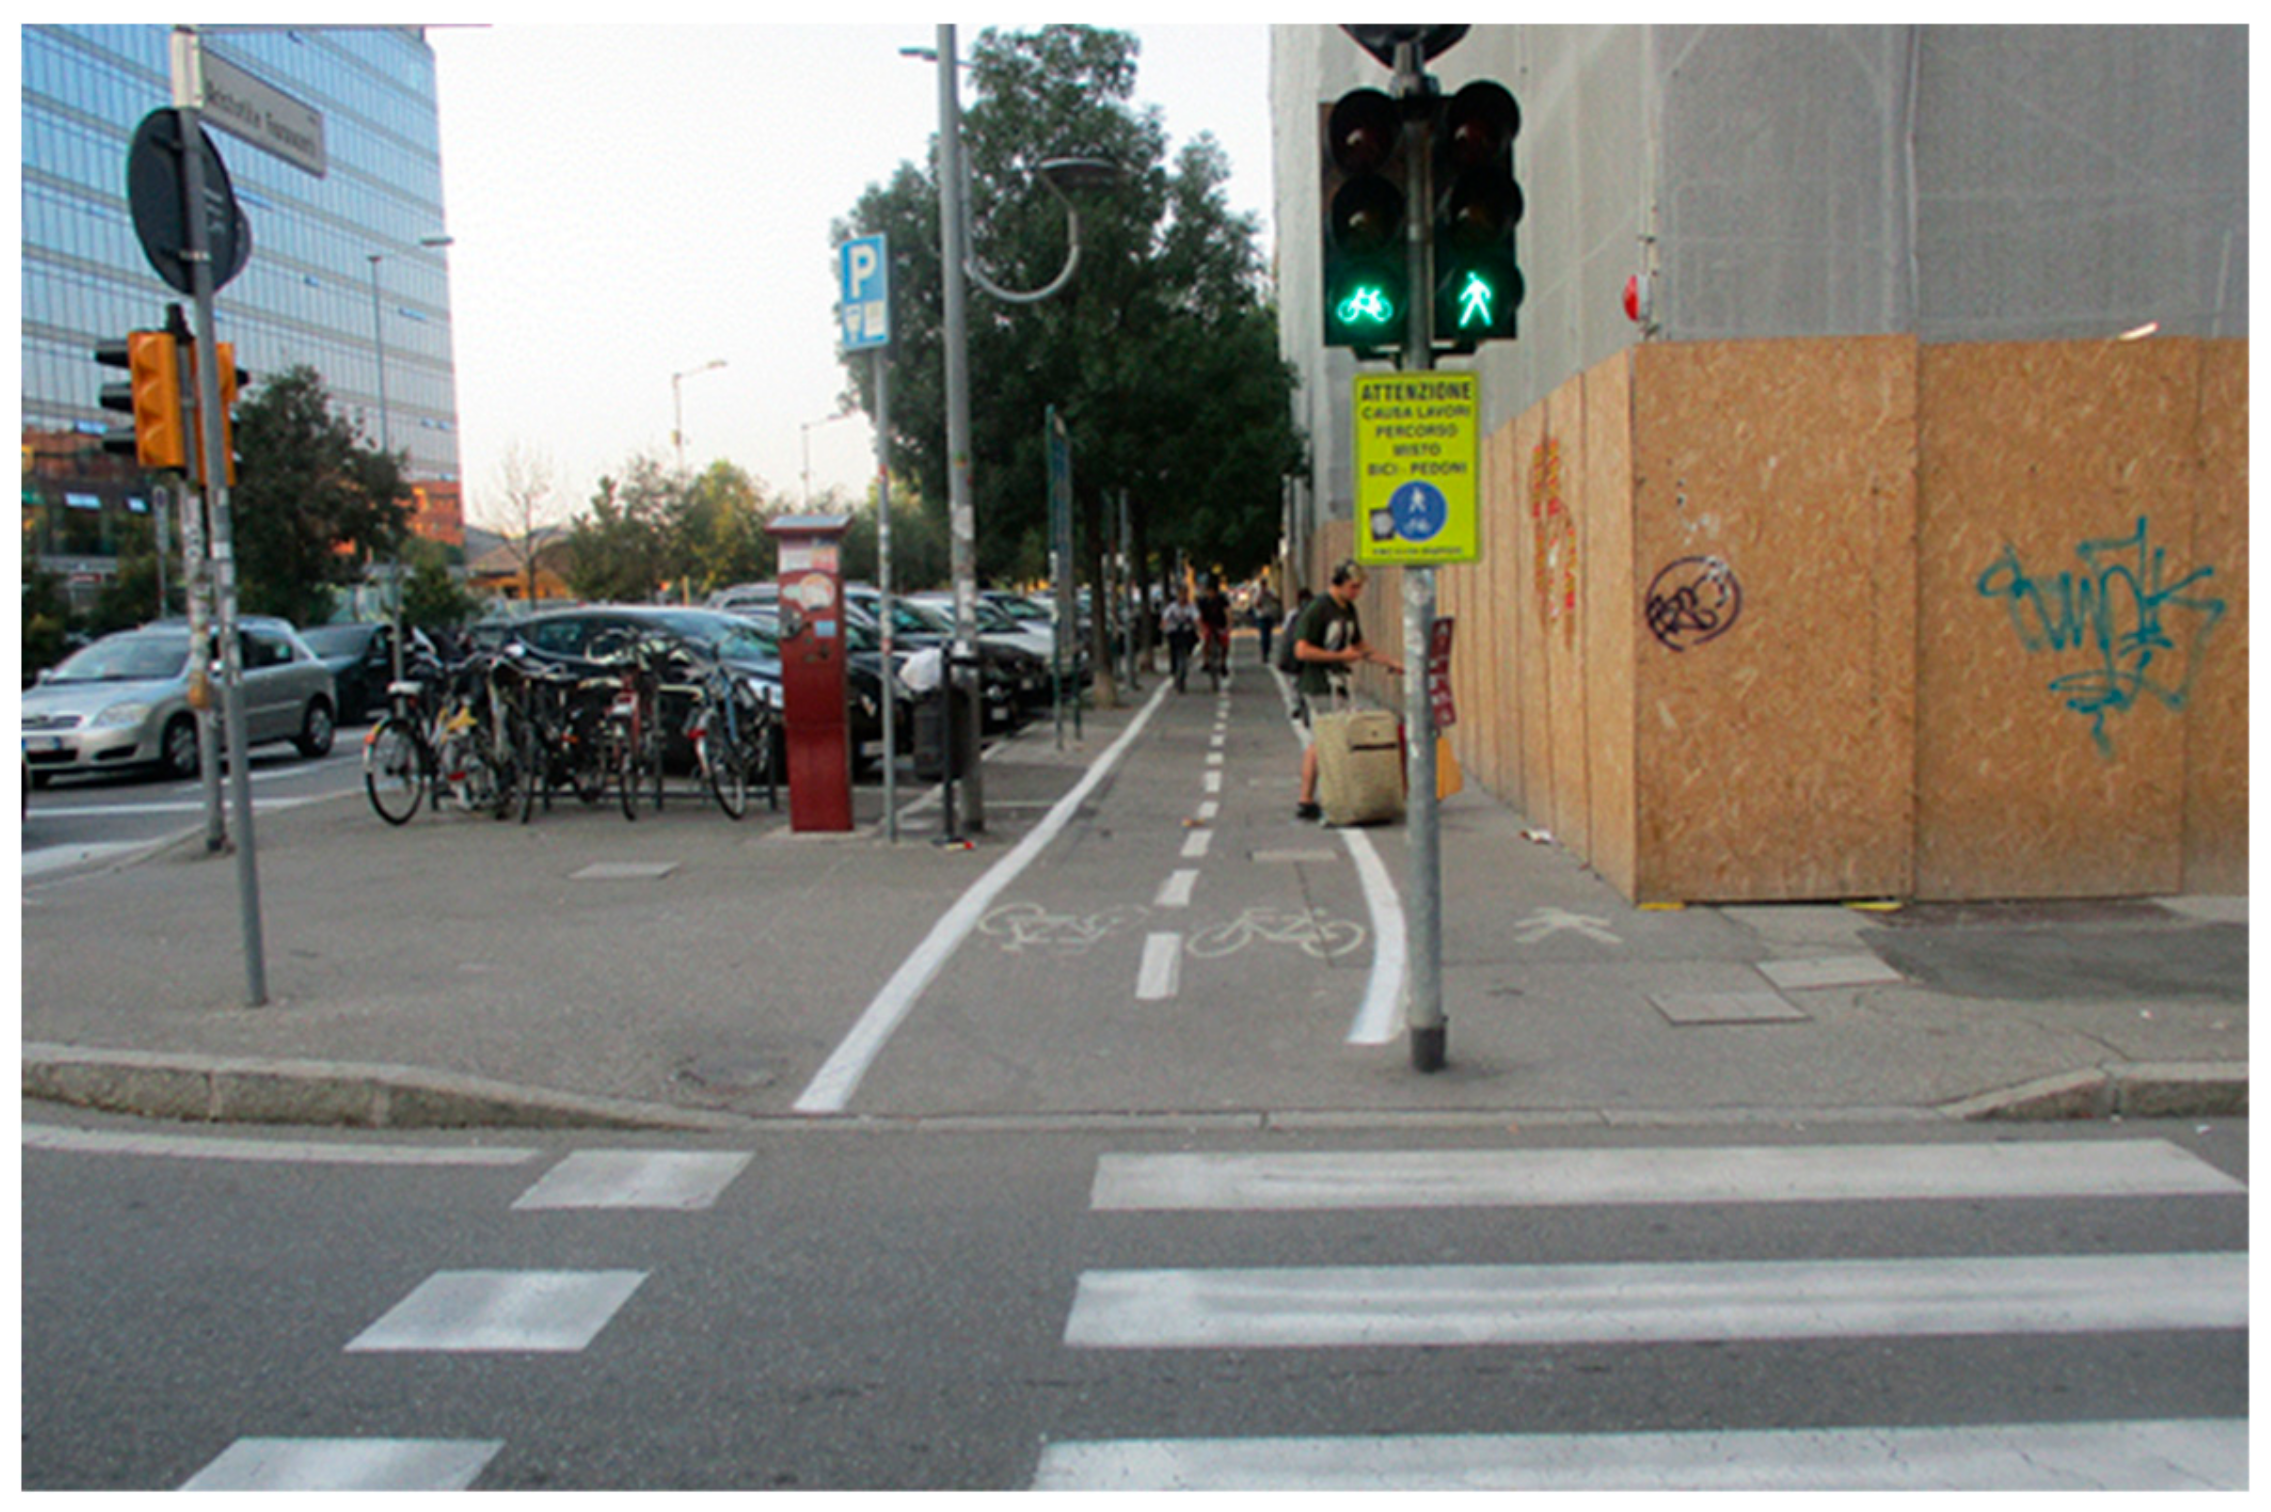
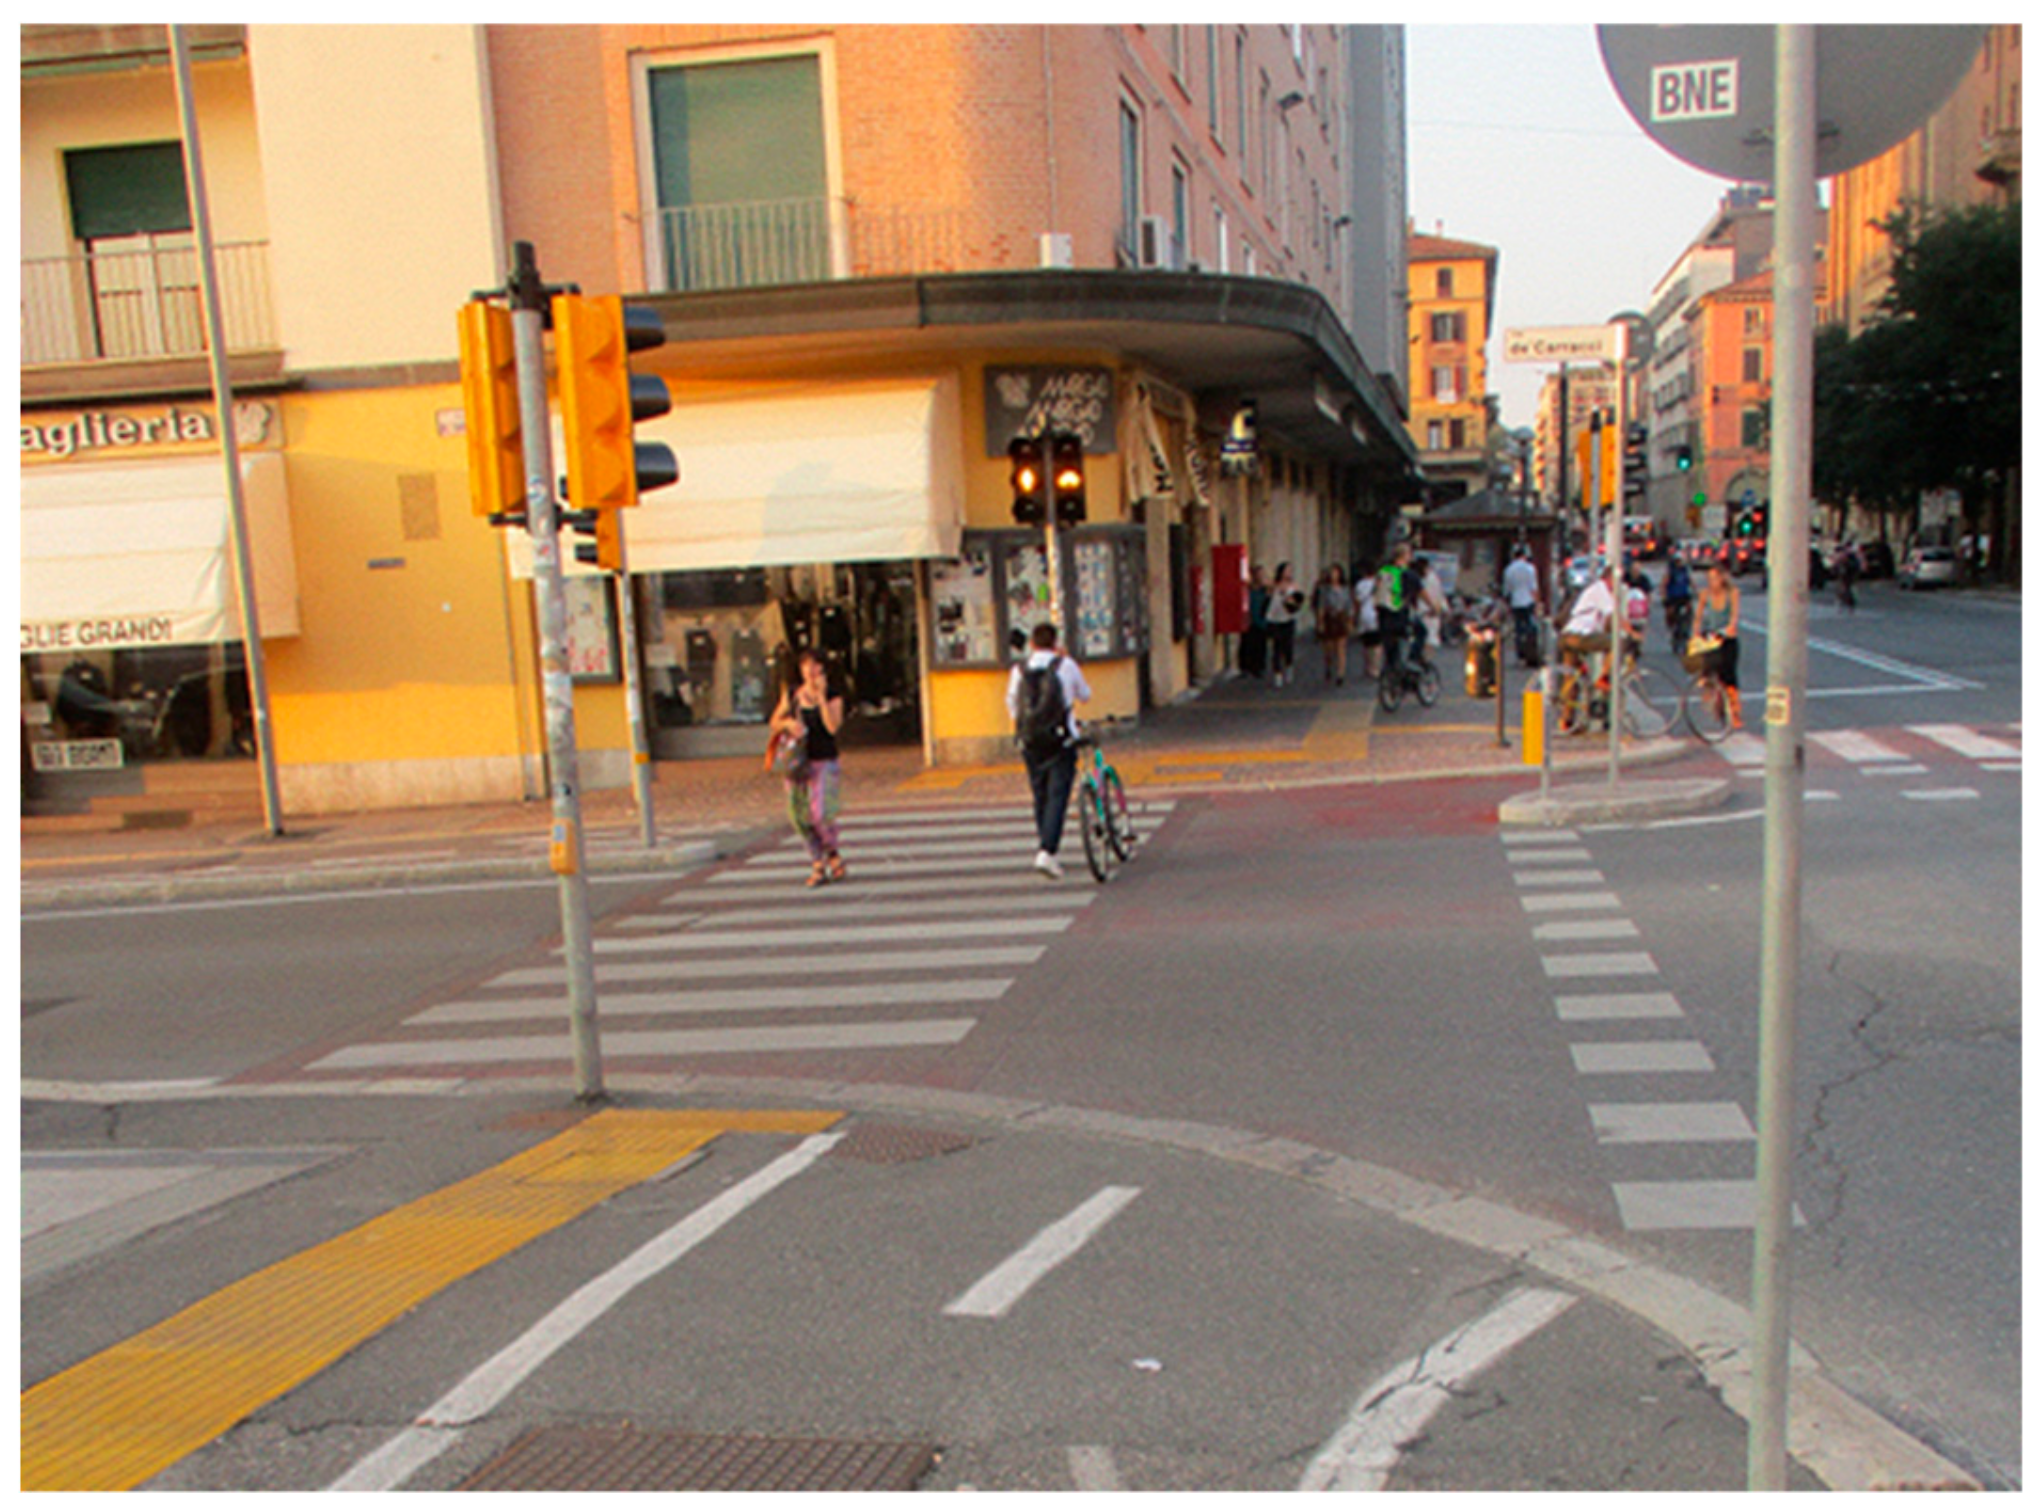
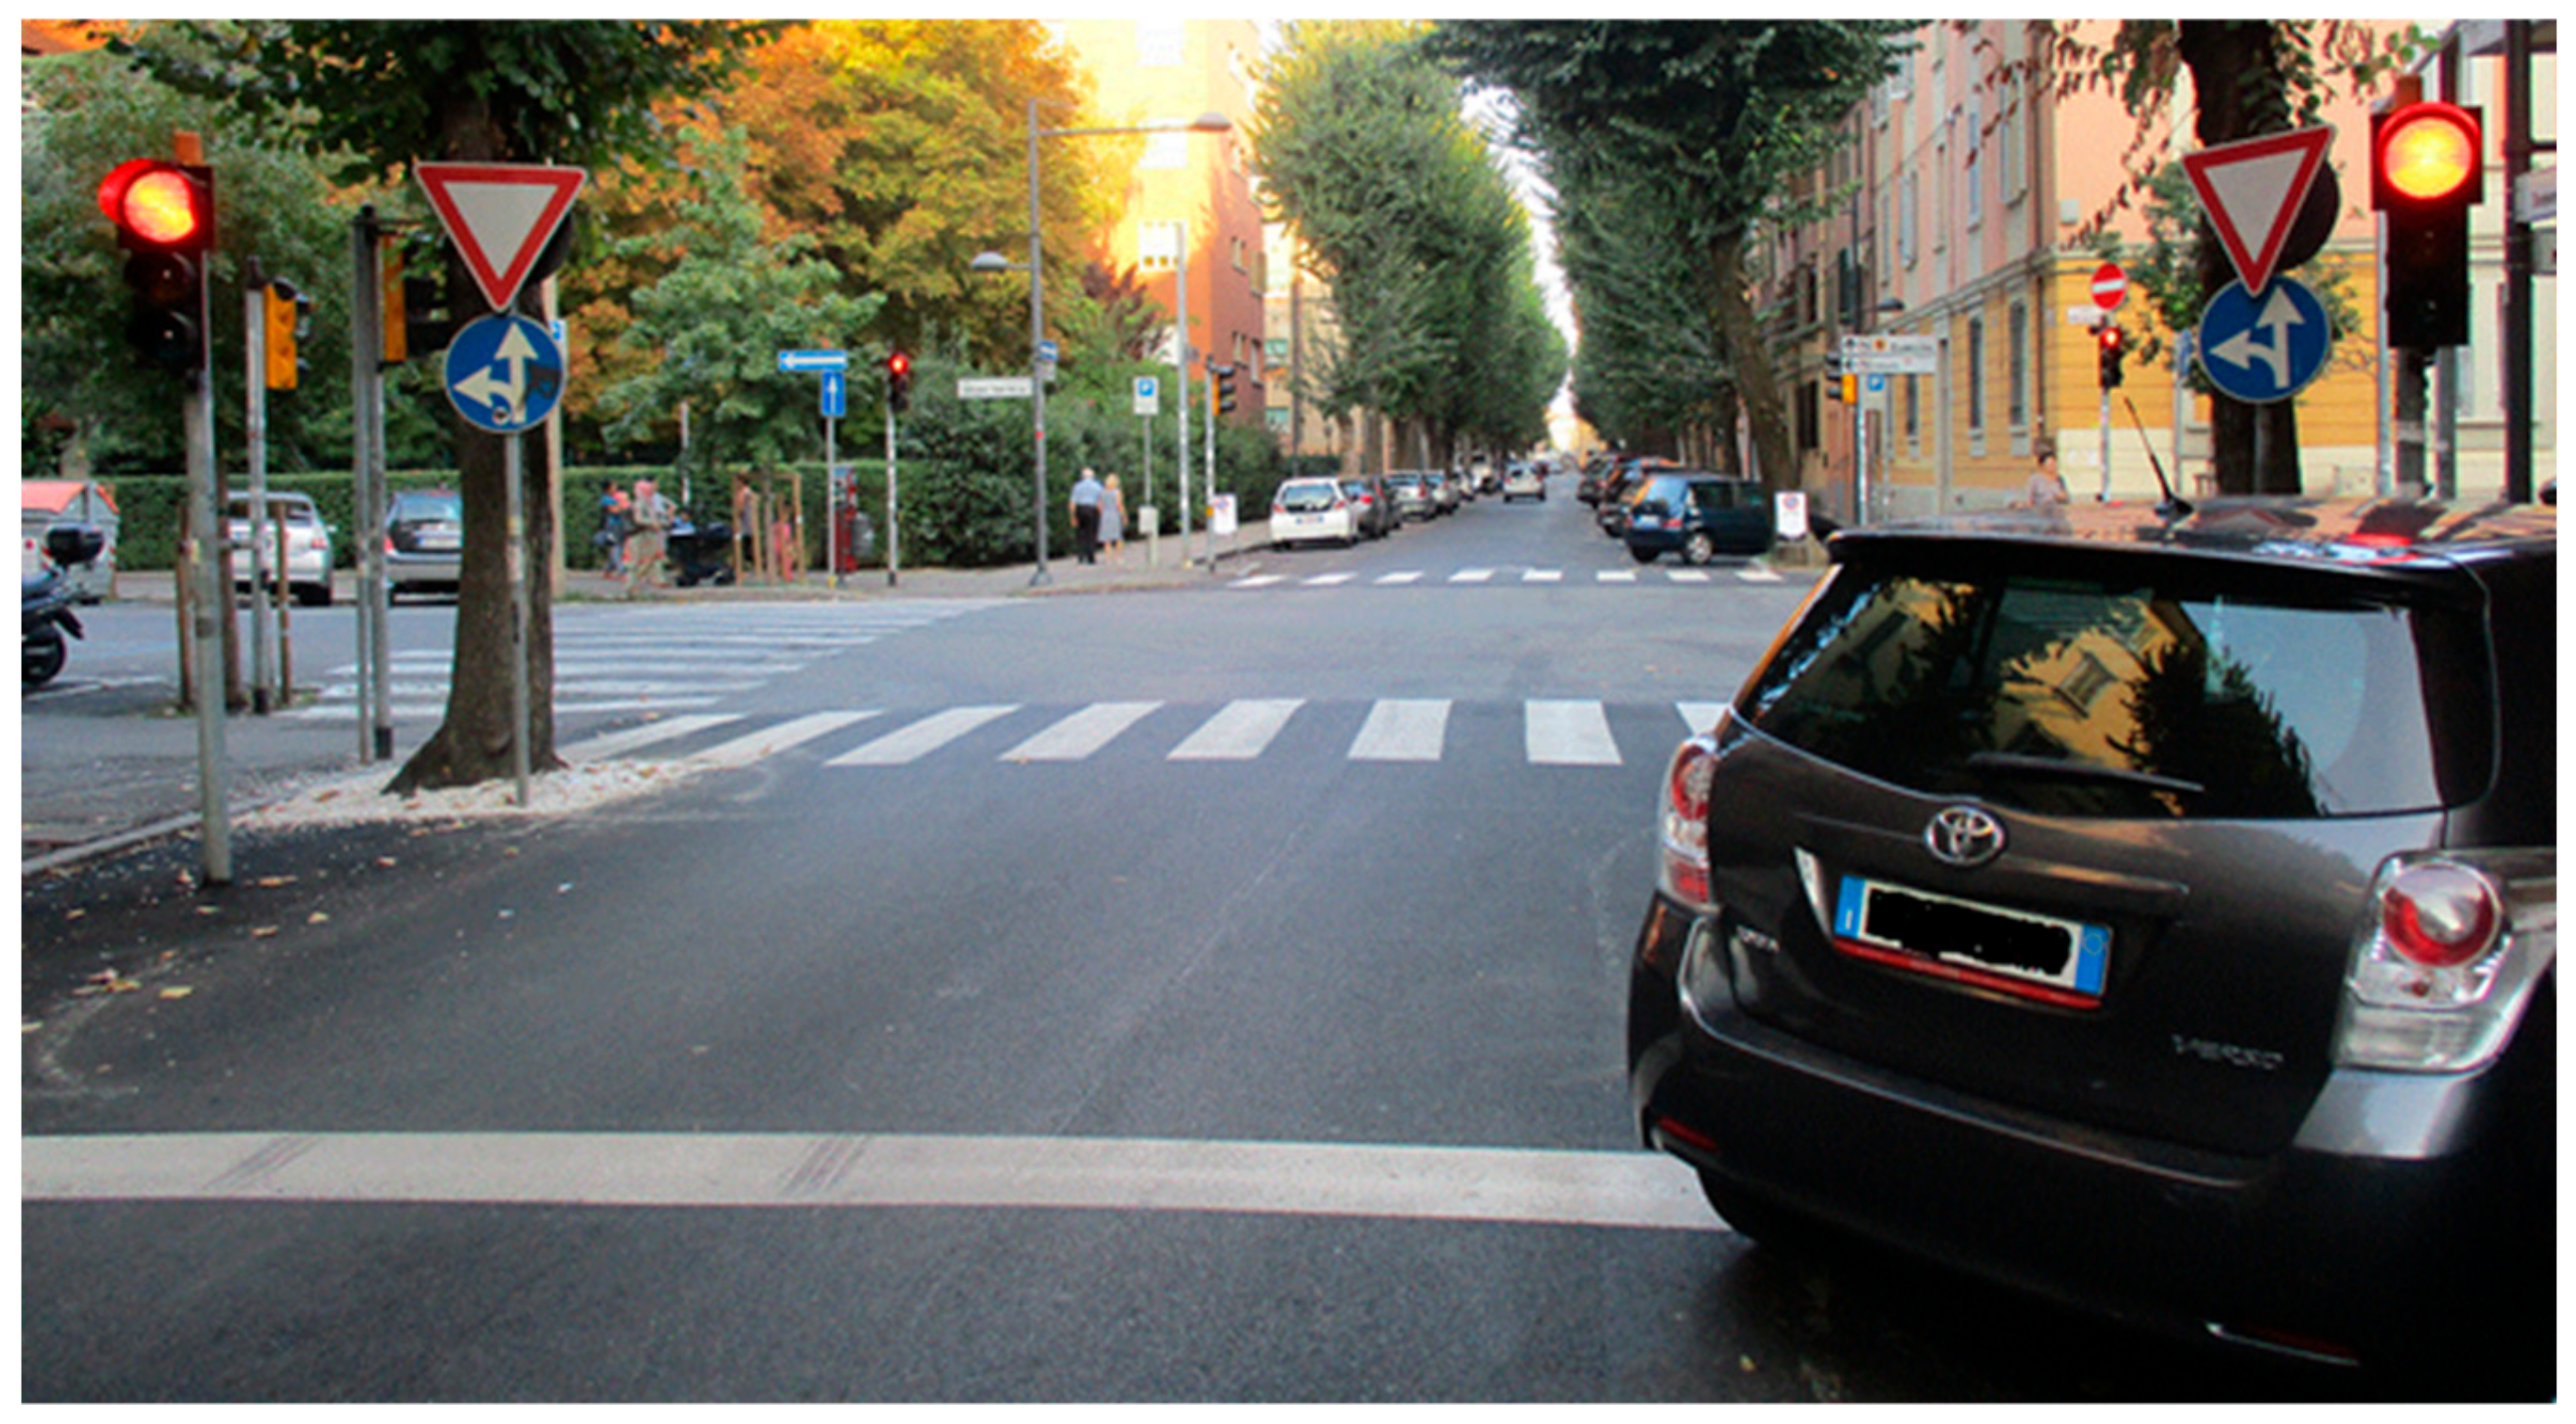
Figure 6,
Figure 7, and
Figure 8 show a street view for three of the intersections examined.
3.4. Participants
A total of 16 participants were recruited, (five females and eleven males); they each had normal vision capacity and none of them wore eyeglasses or lenses, since this would have excluded eye-movement recording. Participants, blinded to the aims of the study, were informed that the experimental purpose was to test the mobile eye recording equipment in a real context. All participants were Italians. An informed consent was signed by each participant prior to participating. Each participant was outfitted with the measuring equipment and independently cycled the same test segment with the same bicycle and in the same conditions (off-peak traffic); they were encouraged to adopt their normal cycling behavior. To ensure optimum working conditions for the eye tracking equipment, the tests were performed on overcast weather days. A calibration procedure was carried in a parking lot to map the eye movements to the cyclist’s visual scene. In this process, participants were requested to fixate on 15 specific points, vertexes and centers of small objects in the visual scene.
Data from three participants were not included, owing to either improper use of the equipment or failures of the instrument during the test. This left 13 field tests, a sample size comparable to other studies similar in nature [
36,
44,
49,
50,
51,
52,
53,
54]. Most of the 13 participants (three females and ten males) were university students with a mean age of 25 (ranging between 12 and 47 years old). Immediately following the test, participants completed a brief survey to query their cycling habits and other experiences while participating in the experiment. Six of the participants reported every day bicycle use; adding another who reported use more than once per week provided seven experienced cyclists. The six remaining were classified inexperienced (and reported not using the bicycle more than once a month). Classifying respondents in this manner (using self-report data to delineate experienced or regular and inexperienced or occasional cyclists) is an approach borrowed from other studies [
55,
56].
4. Results
Our first look at the data examined mean values (and standard deviations) by intersection as shown in
Table 3. Values varied widely based on intersection; for example, in relation to D (distance),
Table 3 shows that participants first fixated the traffic lights between 31 and 55 meters before the light. The number of fixations also varied between 1.5 and 12. Intersection 4, with moderate traffic flows and lacking a cycling track, consistently had the highest number of fixations from the respondents. Other patterns among the measures and intersections were largely indiscernible.
We moved to understanding how measures of eye gaze differ in two respects. The first concerns the type of cycling environment at the intersection. It distinguishes between intersections with a cycle track on both sides of the crossing street versus intersections lacking such (i.e., the cyclists are mixing with motorized traffic while they cross), yielding two sub-samples: eye gaze measures collected at intersections with a cycle track and at intersections without a cycle track (on road). The second respect concerns the experience level of the cyclists, distinguishing between experienced and inexperienced cyclists—again yielding two distinct sub-samples.
Given the partition between the sub-samples, we performed a paired t-test to compare the means—an approach employed in similar investigations (see for example [
15,
57,
58]). A paired t-test is more appropriate than an independent t-test owing to the relationship between the observations collected in the two samples (same subjects). Hence, to compare responses by the type of intersection, we used paired t-tests to compare the averages.
Table 4 and
Table 5 report mean values of key variables (and standard deviations), separated by category. Grey shadings represent values between each respective sub-sample that are different and statistically significant (
p < 0.05).
The first two rows of
Table 4 show mean values differentiated by type of intersection. For the entire sample of cyclists, on road intersections were fixated earlier (
p < 0.05): the first fixation distance for on-road intersections was 44.7 m while on a cycle track it was 38.9 m. The first fixation distance was also significantly different between experienced and inexperienced cyclists. In addition, fixation duration presents a significant difference, being higher for crossings without a cycle track (
p < 0.05).
Table 4 shows that, overall, experienced cyclists were found to have longer fixation duration than inexperienced cyclists (
p < 0.05), spending considerably more time fixating at traffic lights.
We repeated analysis with only those cyclists who stopped (thereby not including those who arrived during the green phase). The percentage of cyclists who stopped is equal to 35%. For this sample, only distance was significantly different between the two types of intersection (first fixation distance for on road intersections is equal to 51.5 m, while that on cycle track was equal to 38.5 m). However, the ratio between fixation duration and waiting time (WT) has been significantly different between the two types of intersection.
Table 5 reports the mean values of key variables (and standard deviations) for cyclists who stopped.
While
Table 4 examines the differences across the entire sample,
Table 6 separates the sample into two groups based on cyclist experience to discern differences within each group in how they perceive different types of intersections.
Table 6 shows that for experienced cyclists, only D revealed a statistically significant difference (
p < 0.05), yielding similar insights as above: intersections without a cycle track were perceived and fixated earlier.
Pooling just the inexperienced cyclists (the last two rows of
Table 6) reveals a slightly different story. Statistically significant differences were found for all five of the measures: D (
p < 0.05), SQ (
p < 0.05), GT (
p < 0.05), nFix (
p < 0.05), and FixD (
p < 0.05). Eye gaze of inexperienced cyclists was more attentive for on-road intersections and was notably increased in all respects.
5. Discussion
Intersections that force the cyclists to mix with car traffic are consistently fixated on first—roughly 45 meters before the light and six meters sooner than counterpart intersections with a cycle track. This finding is realized across the entire sample and also for experienced and inexperienced cyclists, highlighting a more concentrated behavior than cyclists at intersections on a cycle track. Only a few intersections (1, 3, and 6) are first perceived in average distances less than 35 meters and the maximum average distance an intersection is fixated is 55 meters. These values do not depend significantly on the color of the traffic light when approaching the cyclist at the intersection. The value of distances alone can provide important information when considering the physical design of intersections to avert safety concerns when considering average bicycle speeds and reaction times.
Second, for inexperienced cyclists, intersections without cycle track treatments prompt increased eye gaze behavior all around. Glance times are higher, there are more fixations and durations of the fixations are greater. Cumulatively, this could indicate more active search strategies. These findings are not surprising given the increased activity and safety risks involved at such locations. Being alert in such conditions should be expected. High cyclist’s level of attention and concentration is triggered by a hostile environment and this is experienced more by inexperienced cyclists. If one aim is to foster traveling conditions with less anxiety for all, these findings suggest that cycle tracks are a useful place to start. They help quell eye gaze behavior, even if a more relaxed behavior could provoke a lowering of concentration. Furthermore, these findings document key relationships and provide initial threshold values for subsequent research to build on.
For experienced cyclists, we learn that, regardless of the type of intersection, they have longer fixations compared to inexperienced cyclists, measured to be 100 percent higher. Possible explanations vary. By virtue of heightened experience level of frequent cyclists, we should make them able to anticipate and detect hazards relative to inexperienced cyclists [
59,
60]. Repeated exposure to a risk may lead to desensitization and consequently lower overall level of caution. Alternatively, it may be because they are anxious to minimize the lost time when the light turns from red to green and are therefore more focused on the traffic light. Across the board, inexperienced cyclists appear to spend less time specifically fixating their gaze at traffic lights and possibly are more vulnerable to being distracted.
6. Conclusions
As cities across the globe move to transition their transport portfolio away from auto-based forms of mobility and increasingly favor more sustainable modes, spurring more bicycling is often relied on as an effective strategy. However, most of the existing infrastructure in cities favors automobiles and the safety of cyclists is often threatened. Street intersections, in particular, are considered by many to be locations that are unsafe for cycling; these are locations where much of that conflict plays out. Perceived cycling safety, a factor conditioning uptake levels for this form of sustainable mobility, is affected by how cyclists perceive detailed elements of the environment in these instances. Increased levels of cortisol activity provide one measure that can be traced back to the gaze behavior of cyclists [
61]. Our research fits into this context and is one of the first to assess the physiological responses of cyclists and the corresponding elements of intersections that affect those responses.
As opposed to a virtual reality laboratory, this work allowed cyclists to experience real conditions without being impeded by a measurement device. As such, it pushes forth methodological and logistical advancements for this emerging area of investigation. The analysis, while straightforward, yields statistically significant results of note to help learn how—and the extent to which—physical infrastructure treatments around intersections are perceived by different user populations; in this case, experienced and inexperienced cyclists. Our study shows how, by several yardsticks, intersections that force cyclists to merge with traffic yield notable differences in eye gaze behavior. The specifics of the differences are moderated by intersection type, the measure employed, and experience level of the cyclists. The consistent thread is that longer gazes are found when users approach intersections that have heightened probability of interacting with automobiles. The findings establish baseline values for other researchers to build upon and strengthen; they provide valuable information to suggest to designers of transport systems how users have varying needs. This context helps increase awareness of how cyclists in the streets might react to rapidly changing street scenes with new forms of emerging technologies (e.g., autonomous vehicles).
Supported by this proof-of-concept study, the sophistication level of this type of inquiry could be strengthened by, for example, a more diverse sample, including elderly riders, a longer course, greater diversity in measures of built environment, and from an analysis perspective, a fuller and multivariate approach.
With the explosion of new types of mobility (e.g., semi-autonomous cars) that are traversing streets in urban areas, it is essential for researchers and decision-makers to fully understand key factors that affect the safety of these streets. For professionals involved with the design of transport facilities—namely how key features of streets are perceived by bicyclists—key takeaways are mentioned above. However, this work’s value extends beyond safety issues alone. It could easily be expanded to develop a stronger understanding for how humans perceive and appreciate qualities of the built environment while traveling (e.g., the manner in which they experience elements of street facades, other road users or general elements of cities). Reliable experiments such as this can advance an understanding of how humans react to changing street scenes, which could help strategically in designing streets and landscapes as informed by broader experiential and biological factors.
Author Contributions
Conceptualization, F.R. and K.J.K.; data curation, F.R.; formal analysis, F.R.; methodology, F.R. and K.J.K.; writing—original draft, F.R. and K.J.K.; writing—review and editing, K.J.K.
Funding
Open access funding provided by Department of Civil, Chemical, Environmental, and Materials Engineering (DICAM)—University of Bologna.
Acknowledgments
We are thankful to M. Eng. Alessandra Mantuano (Dinazzano Po SpA) for her scientific contribution.
Conflicts of Interest
The authors declare no conflict of interest.
References
- Pucher, J.; Buehler, B.; Seinen, M. Bicycling renaissance in North America? An update and re-appraisal of cycling trends and policies. Transp. Res. Part A Policy Pract. 2011, 45, 451–475. [Google Scholar] [CrossRef]
- Eurobarometer. Special Eurobarometer 422a “Quality of Transport”; Wave EB82.2—TNS Opinion & Social; European Commission: Brussels, Belgium, 2014. [Google Scholar]
- Statista. Statista The Statistics Portal. Cycling—Statistics & Facts 2019. Available online: www.statista.com/topics/1686/cycling/ (accessed on 19 September 2019).
- Rupi, F.; Poliziani, C.; Schweizer, J. Data-driven Bicycle Network Analysis Based on Traditional Counting Methods and GPS Traces from Smartphone. Int. J. Geo-Inf. 2019, 8, 322. [Google Scholar] [CrossRef]
- Heinen, E.; Van Wee, B.; Maat, K. Commuting by bicycle: An overview of the literature. Transp. Rev. 2010, 30, 59–96. [Google Scholar] [CrossRef]
- Bernardi, S.; Krizek, K.J.; Rupi, F. Quantifying the role of disturbances and speeds on separated bicycle facilities. J. Transp. Land Use 2016, 9, 105–119. [Google Scholar] [CrossRef]
- Frings, D.; Parkin, J.; Ridley, A.M. The effects of cycle lanes, vehicle to kerb distance and vehicle type on cyclists’ attention allocation during junction negotiation. Accid. Anal. Prev. 2014, 72, 411–421. [Google Scholar] [CrossRef]
- Rupi, F.; Schweizer, J. Evaluating cyclist patterns using GPS data from smartphones. IET Intell. Transp. Syst. 2018, 12, 279–285. [Google Scholar] [CrossRef]
- Boufous, S.; Hatfield, J.; Grzebieta, R. The impact of environmental factors on cycling speed on shared paths. Accid. Anal. Prev. 2018, 110, 171–176. [Google Scholar] [CrossRef]
- Schepers, P.; Hagenzieker, M.; Methorst, R.; van Wee, B.; Wegmanb, F. A conceptual framework for road safety and mobility applied to cycling safety. Accid. Anal. Prev. 2014, 62, 331–340. [Google Scholar] [CrossRef]
- Reynolds, C.C.; Harris, M.A.; Teschke, K.; Cripton, P.A.; Winters, M. The impact of transportation infrastructure on bicycling injuries and crashes: A review of the literature. Environ. Health 2009, 8, 47. [Google Scholar] [CrossRef]
- Nordback, K.; Marshall, W.E.; Janson, B.N. Bicyclist safety performance functions for a U.S. city. Accid. Anal. Prev. 2014, 65, 114–122. [Google Scholar] [CrossRef]
- Elvik, R. The non-linearity of risk and the promotion of environmentally sustainable transport. Accid. Anal. Prev. 2009, 41, 849–855. [Google Scholar] [CrossRef] [PubMed]
- Bernardi, S.; Rupi, F. An analysis of bicycle travel speed and disturbances on off-street and on-street facilities. Transp. Res. Procedia 2015, 5, 82–94. [Google Scholar] [CrossRef]
- Caviedes, A.; Figliozzi, M. Modeling the impact of traffic conditions and bicycle facilities on cyclists’ on-road stress levels. Transp. Res. Part F Traffic Psychol. Behav. 2018, 58, 488–499. [Google Scholar] [CrossRef]
- European Road Safety Observatory. Traffic Safety Basic Facts 2015—Cyclists. Available online: https://ec.europa.eu/transport/road_safety/sites/roadsafety/files/pdf/statistics/dacota/bfs2015_cyclists.pdf (accessed on 19 September 2019).
- Kaplan, S.; Giacomo Prato, C. A spatial analysis of land use and network effects on frequency and severity of cyclist–motorist crashes in the Copenhagen region. Traffic Inj. Prev. 2015, 16, 724–731. [Google Scholar] [CrossRef]
- Chen, L.; Chen, C.; Srinivasan, R.; McKnight, C.E.; Ewing, R.; Roe, M. Evaluating the safety effects of bicycle lanes in New York City. Am J Public Health. 2012, 102, 1120–1127. [Google Scholar] [CrossRef]
- Stone, M.; Broughton, J. Getting off your bike: Cycling accidents in Great Britain in 1990–1999. Accid. Anal. Prev. 2003, 35, 549–556. [Google Scholar] [CrossRef]
- Wei, F.; Lovegrove, G. An empirical tool to evaluate the safety of cyclists: Community based, macro-level collision prediction models using negative binomial regression. Accid. Anal. Prev. 2013, 61, 129–137. [Google Scholar] [CrossRef]
- Prati, G.; De Angelis, M.; Marín Puchades, V.; Fraboni, F.; Pietrantoni, L. Characteristics of cyclist crashes in Italy using latent class analysis and association rule mining. PLoS ONE 2017, 12, e0171484. [Google Scholar] [CrossRef]
- Garder, P.; Leden, L.; Thedeen, T. Safety implications of bicycle paths at signalized intersections. Accid. Anal. Prev. 1994, 26, 429–439. [Google Scholar] [CrossRef]
- Tilahun, N.Y.; Levinson, D.M.; Krizek, K.J. Trails, lanes, or traffic: Valuing bicycle facilities with an adaptive stated preference survey. Transp. Res. Part A 2007, 41, 287–301. [Google Scholar] [CrossRef]
- Lehtonen, E.; Havia, V.; Kovanen, A.; Leminen, L.; Saure, E. Evaluating bicyclists’ risk perception using video clips: Comparison of frequent and infrequent city cyclists. Transp. Res. Part F Traffic Psychol. Behav. 2016, 41, 195–203. [Google Scholar] [CrossRef]
- Fraboni, F.; Marín Puchades, V.; De Angelis, M.; Pietrantoni, L.; Prati, G. Red-light running behavior of cyclists in Italy: An observational study. Accid. Anal. Prev. 2018, 120, 219–232. [Google Scholar] [CrossRef] [PubMed]
- Van Loon, E.M.; Khashawi, F.; Underwood, G. Visual strategies used for time-to arrival judgments in driving. Perception 2010, 39, 1216–1229. [Google Scholar] [CrossRef] [PubMed]
- Kovácsová, N.; Cabrall, C.D.D.; Antonisse, S.J.; de Haan, T.; Jde Winter, C.F. Cyclists’ eye movements and crossing judgments at uncontrolled intersections: An eye-tracking study using animated video clips. Accid. Anal. Prev. 2018, 120, 270–280. [Google Scholar] [CrossRef] [PubMed]
- Loftus, E.F.; Loftus, G.R.; Messo, J. Some facts about “weapon focus”. Law Hum. Behav. 1987, 11, 55–62. [Google Scholar] [CrossRef]
- Underwood, G.; Chapman, P.; Berger, Z.; Crundall, D. Driving experience, attentional focusing, and the recall of recently inspected events. Transp. Res. Part F Traffic Psychol. Behav. 2003, 6, 289–304. [Google Scholar] [CrossRef]
- Werneke, J.; Vollrath, M. What does the driver look at? The influence of intersection characteristics on attention allocation and driving behavior. Accid. Anal. Prev. 2012, 45, 610–619. [Google Scholar] [CrossRef]
- Wickens, C.D.; Helleberg, J.; Goh, J.; Xu, X.; Horrey, W.J. Pilot Task Management: Testing an Attentional Expected Value Model of Visual Scanning. In Institute of Aviation Technical Report; Technical Report No. ARL-01-14/NASA-01-7; UIUC: Savoy, IL, USA, 2001. [Google Scholar]
- Crundall, D.; Underwood, G.; Chapman, P. Driving experience and the functional field of view. Perception 1999, 28, 1075–1087. [Google Scholar] [CrossRef]
- Crundall, D.; Underwood, G.; Chapman, P. Attending to the peripheral world while driving. Appl. Cogn. Psychol. 2002, 16, 459–475. [Google Scholar] [CrossRef]
- Chapman, P.R.; Underwood, G. Visual search of driving situations: Danger and experience. Perception 1998, 27, 951–964. [Google Scholar] [CrossRef]
- Velichkovsky, B.M.; Rothert, A.; Kopf, M.; Dornhöfer, S.M.; Joos, M. Towards an express-diagnostics for level of processing and hazard perception. Transp. Res. Part F Traffic Psychol. Behav. 2002, 5, 145–156. [Google Scholar] [CrossRef]
- Mantuano, A.; Bernardi, S.; Rupi, F. Cyclist gaze behavior in urban space: An eye-tracking experiment on the bicycle network of Bologna. Case Stud. Transp. Policy 2017, 5, 408–416. [Google Scholar] [CrossRef]
- Salvucci, D.D.; Goldberg, J.H. Identifying fixations and saccades in eye-tracking protocols. In Proceedings of the 2000 Symposium on Eye Tracking Research & Applications, Palm Beach Gardens, FL, USA, 6–8 November 2000; pp. 71–78. [Google Scholar]
- Krauzlis, R.J.; Miles, F.A. Initiation of saccades during fixation or pursuit: Evidence in humans for a single mechanism. J. Neurophysiol. 1996, 76, 4175–4179. [Google Scholar] [CrossRef] [PubMed]
- Rayner, K. Eye movements and attention in reading, scene perception, and visual search. The Quarterly J. Exp. Psychol. 2009, 62, 1457–1506. [Google Scholar] [CrossRef]
- Holmqvist, K.; Nyström, M.; Andersson, R.; Dewhurst, R.; Jarodzka, H.; van de Weijer, J. Eye Tracking: A Comprehensive Guide to Methods and Measures; Oxford University Press: Oxford, UK, 2011. [Google Scholar]
- Zelinsky, G.J.; Rao, R.P.N.; Hayhoe, M.M.; Ballard, D.H. Eye movements reveal the spatiotemporal dynamics of visual search. Psychol. Sci. 1997, 8, 448–453. [Google Scholar] [CrossRef]
- Vansteenkiste, P.; Cardon, G.; Lenoir, M. Dealing with head-mounted eye-tracking data: Comparison of a frame-by-frame and a fixation-based analysis. In Proceedings of the 2013 Conference on Eye Tracking South Africa, Cape Town, South Africa, 29–31 August 2013; pp. 55–57. [Google Scholar]
- Vansteenkiste, P.; Van Hamme, D.; Veelaert, P.; Philippaerts, R.; Cardon, G.; Lenoir, M. Cycling around a Curve: The Effect of Cycling Speed on Steering and Gaze Behavior. PLoS ONE 2014, 9, 7. [Google Scholar] [CrossRef]
- Trefzger, M.; Blascheck, T.; Raschke, M.; Hausmann, S.; Schlegel, T. A Visual Comparison of Gaze Behavior from Pedestrians and Cyclists. In Proceedings of the 2018 ACM Symposium on Eye Tracking Research & Applications, Warsaw, Poland, 14–17 June 2018. [Google Scholar]
- Statistics. Available online: https://www.comune.bologna.it/iperbole/piancont/dati. html (accessed on 16 October 2019).
- Conto Nazionale dei Trasporti. 2018. Available online: http://www.mit.gov.it/comunicazione/news/contonazionale/online-il-conto-nazionale-delle-infrastrutture-e-dei-trasporti (accessed on 16 October 2019).
- Eurobarometer. Special Eurobarometer 422a, Quality of Transport. 2014. Available online: Ec.europa.eu/public_opinion/archives/ebs/ebs_422a_en.pdf (accessed on 16 October 2019).
- Istat Spostamenti Quotidiani e Nuove Forme di Mobilità. 2018. Available online: Istat.it/it/files//2018/11/Report-mobilità-sostenibile.pdf (accessed on 16 October 2019).
- Vansteenkiste, P.; Cardon, G.; D’Hondt, E.; Philippaerts, R.; Lenoir, M. The visual control of bicycle steering: The effects of speed and path width. Accid. Anal. Prev. 2013, 51, 222–227. [Google Scholar] [CrossRef]
- Vansteenkiste, P.; Zeuwts, L.; Cardon, G.; Philippaerts, R.; Lenoir, M. The implications of low quality bicycle paths on gaze behavior of cyclists: A field test. Transp. Res. Part F Traffic Psychol. Behav. 2014, 23, 81–87. [Google Scholar] [CrossRef]
- Vansteenkiste, P.; Cardon, G.; Lenoir, M. Visual guidance during bicycle steering through narrow lanes: A study in children. Accid. Anal. Prev. 2015, 78, 8–13. [Google Scholar] [CrossRef]
- Marti, S.; Bayet, L.; Dehaene, S. Subjective report of eye fixations during serial search. Conscious. Cogn. 2015, 33, 1–15. [Google Scholar] [CrossRef]
- Reyes, M.L.; Lee, J.D. Effects of cognitive load presence and duration on driver eye movements and event detection performance. Transp. Res. Part F Traffic Psychol. Behav. 2008, 11, 391–402. [Google Scholar] [CrossRef]
- Zeuwts, L.; Vansteenkiste, P.; Deconinck, F.; van Maarseveen, M.; Savelsbergh, G.; Cardon, G.; Lenoir, M. Is gaze behaviour in a laboratory context similar to that in real-life? A study in bicyclists. Transp. Res. Part F Traffic Psychol. Behav. 2016, 43, 131–140. [Google Scholar] [CrossRef]
- Howard, C.; Burns, E.K. Cycling to Work in Phoenix: Route Choice, Travel Behavior, and Commuter Characteristics. Transp. Res. Rec. 2001, 1773, 39–46. [Google Scholar] [CrossRef]
- Winters, M.; Teschke, K. Route Preferences Among Adults in the Near Market for Bicycling: Findings of the Cycling in Cities Study. Am. J. Health Promot. 2010, 25, 40–47. [Google Scholar] [CrossRef] [PubMed]
- Fyhri, A.; Sundfør, H.B.; Bjørnskau, T.; Laureshyn, A. Safety in numbers for cyclists—Conclusions from a multidisciplinary study of seasonal change in interplay and conflicts. Accid. Anal. Prev. 2017, 105, 124–133. [Google Scholar] [CrossRef] [PubMed]
- McCrum-Gardner, E. Which is the correct statistical test to use? Br. J. Oral Maxillofac. Surg. 2007, 46, 38–41. [Google Scholar] [CrossRef] [PubMed]
- Wallis, T.S.A.; Horswill, M.S. Using fuzzy signal detection theory to determine why experienced and trained drivers respond faster than novices in a hazard perception test. Accid. Anal. Prev. 2007, 39, 1177–1185. [Google Scholar] [CrossRef]
- Crundall, D.; Chapman, P.; Trawley, S.; Collins, L.; van Loon, E.; Andrews, B.; Underwood, G. Some hazards are more attractive than others: Drivers of varying experience respond differently to different types of hazard. Accid. Anal. Prev. 2012, 45, 600–609. [Google Scholar] [CrossRef]
- Hollander, J.B.; Purdy, A.; Wiley, A.; Foster, V.; Jacob, R.J.K.; Taylor, H.A.; Brunyé, T.T. Seeing the city: Using eye-tracking technology to explore cognitive responses to the built environment. J. Urban. Int. Res. Placemaking Urban Sustain. 2018, 12, 156–171. [Google Scholar] [CrossRef]
© 2019 by the authors. Licensee MDPI, Basel, Switzerland. This article is an open access article distributed under the terms and conditions of the Creative Commons Attribution (CC BY) license (http://creativecommons.org/licenses/by/4.0/).


