Sustainable Urban Mobility Plans: How Do They Work?


Abstract
:1. Introduction
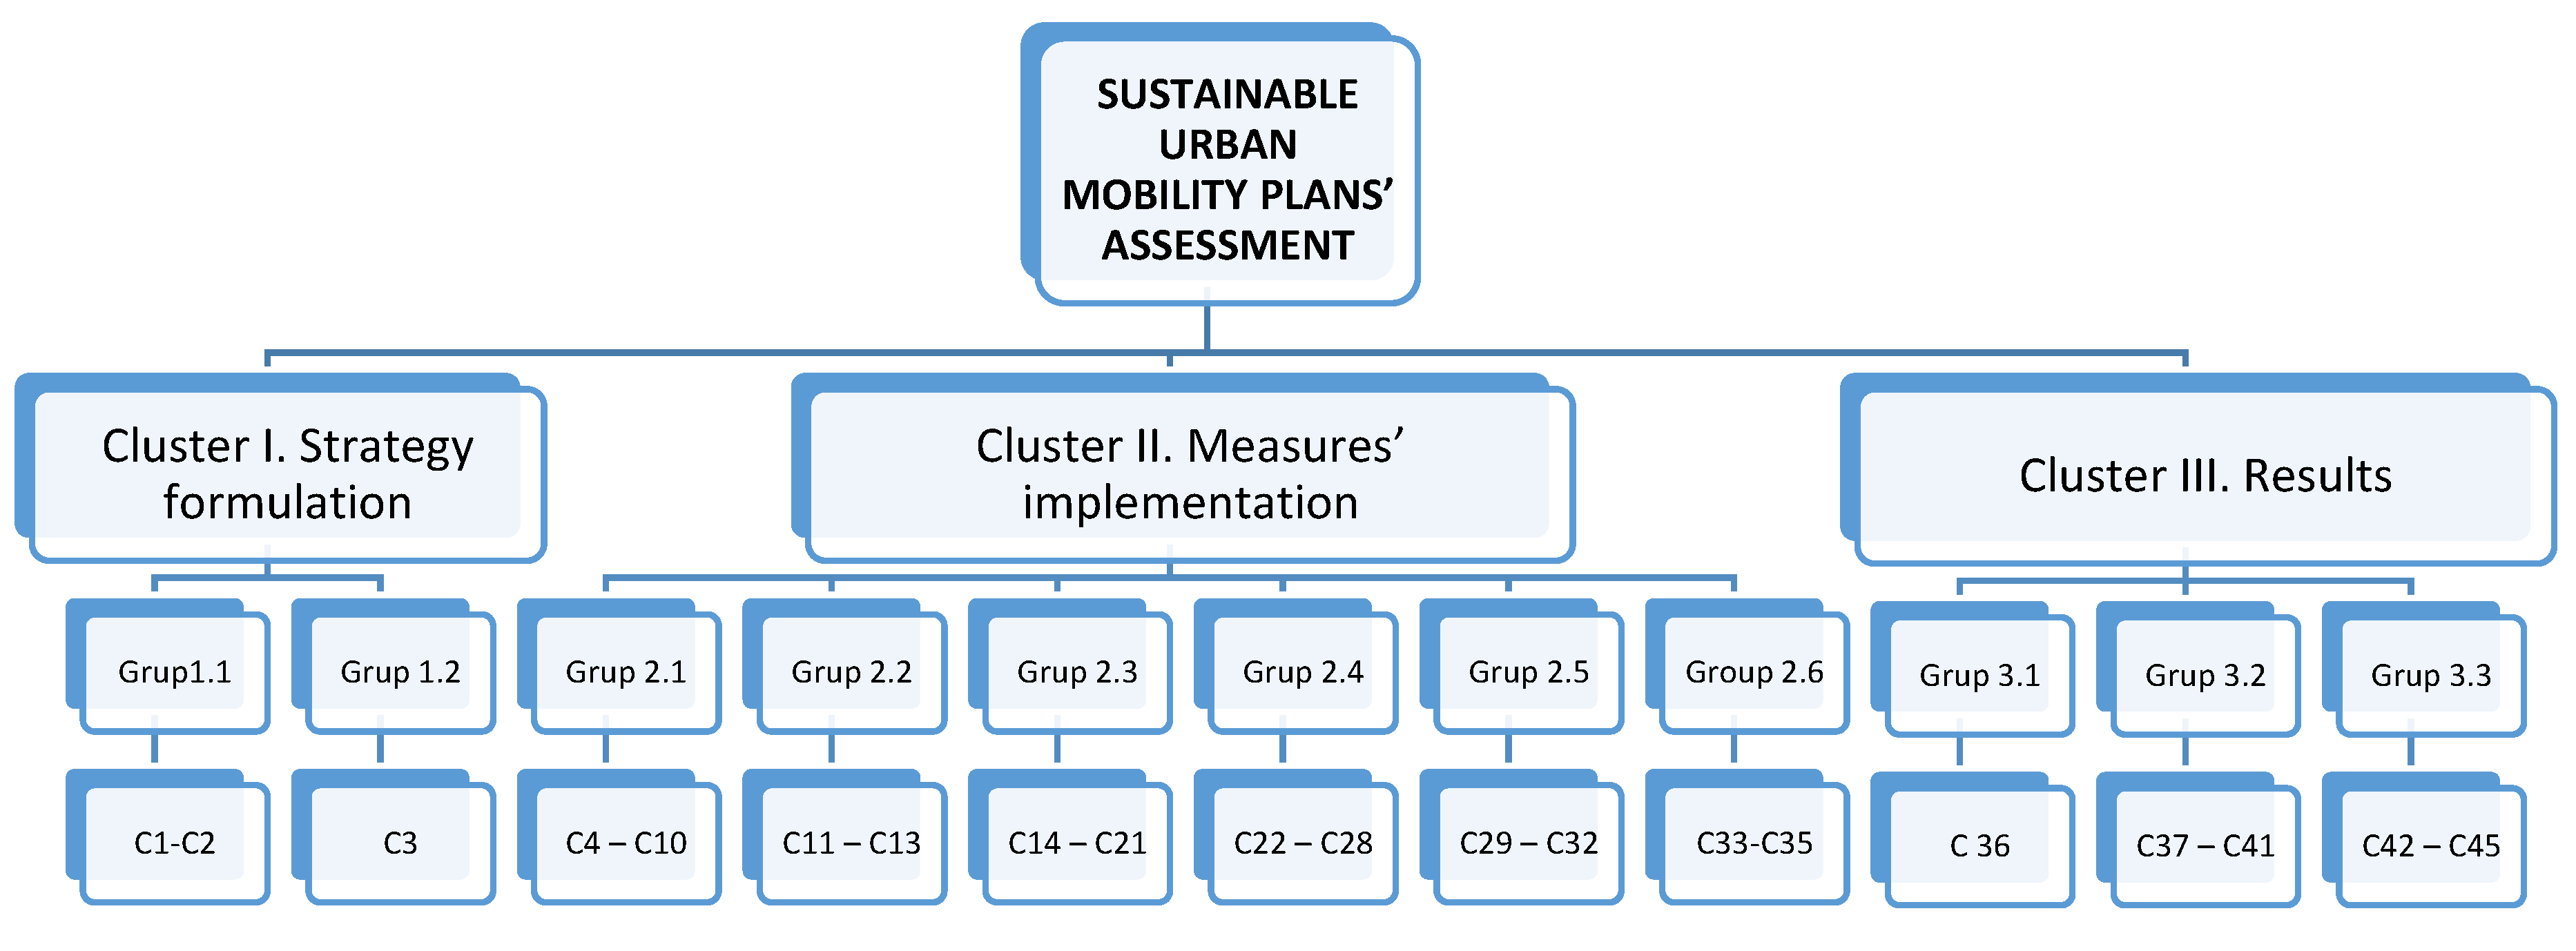
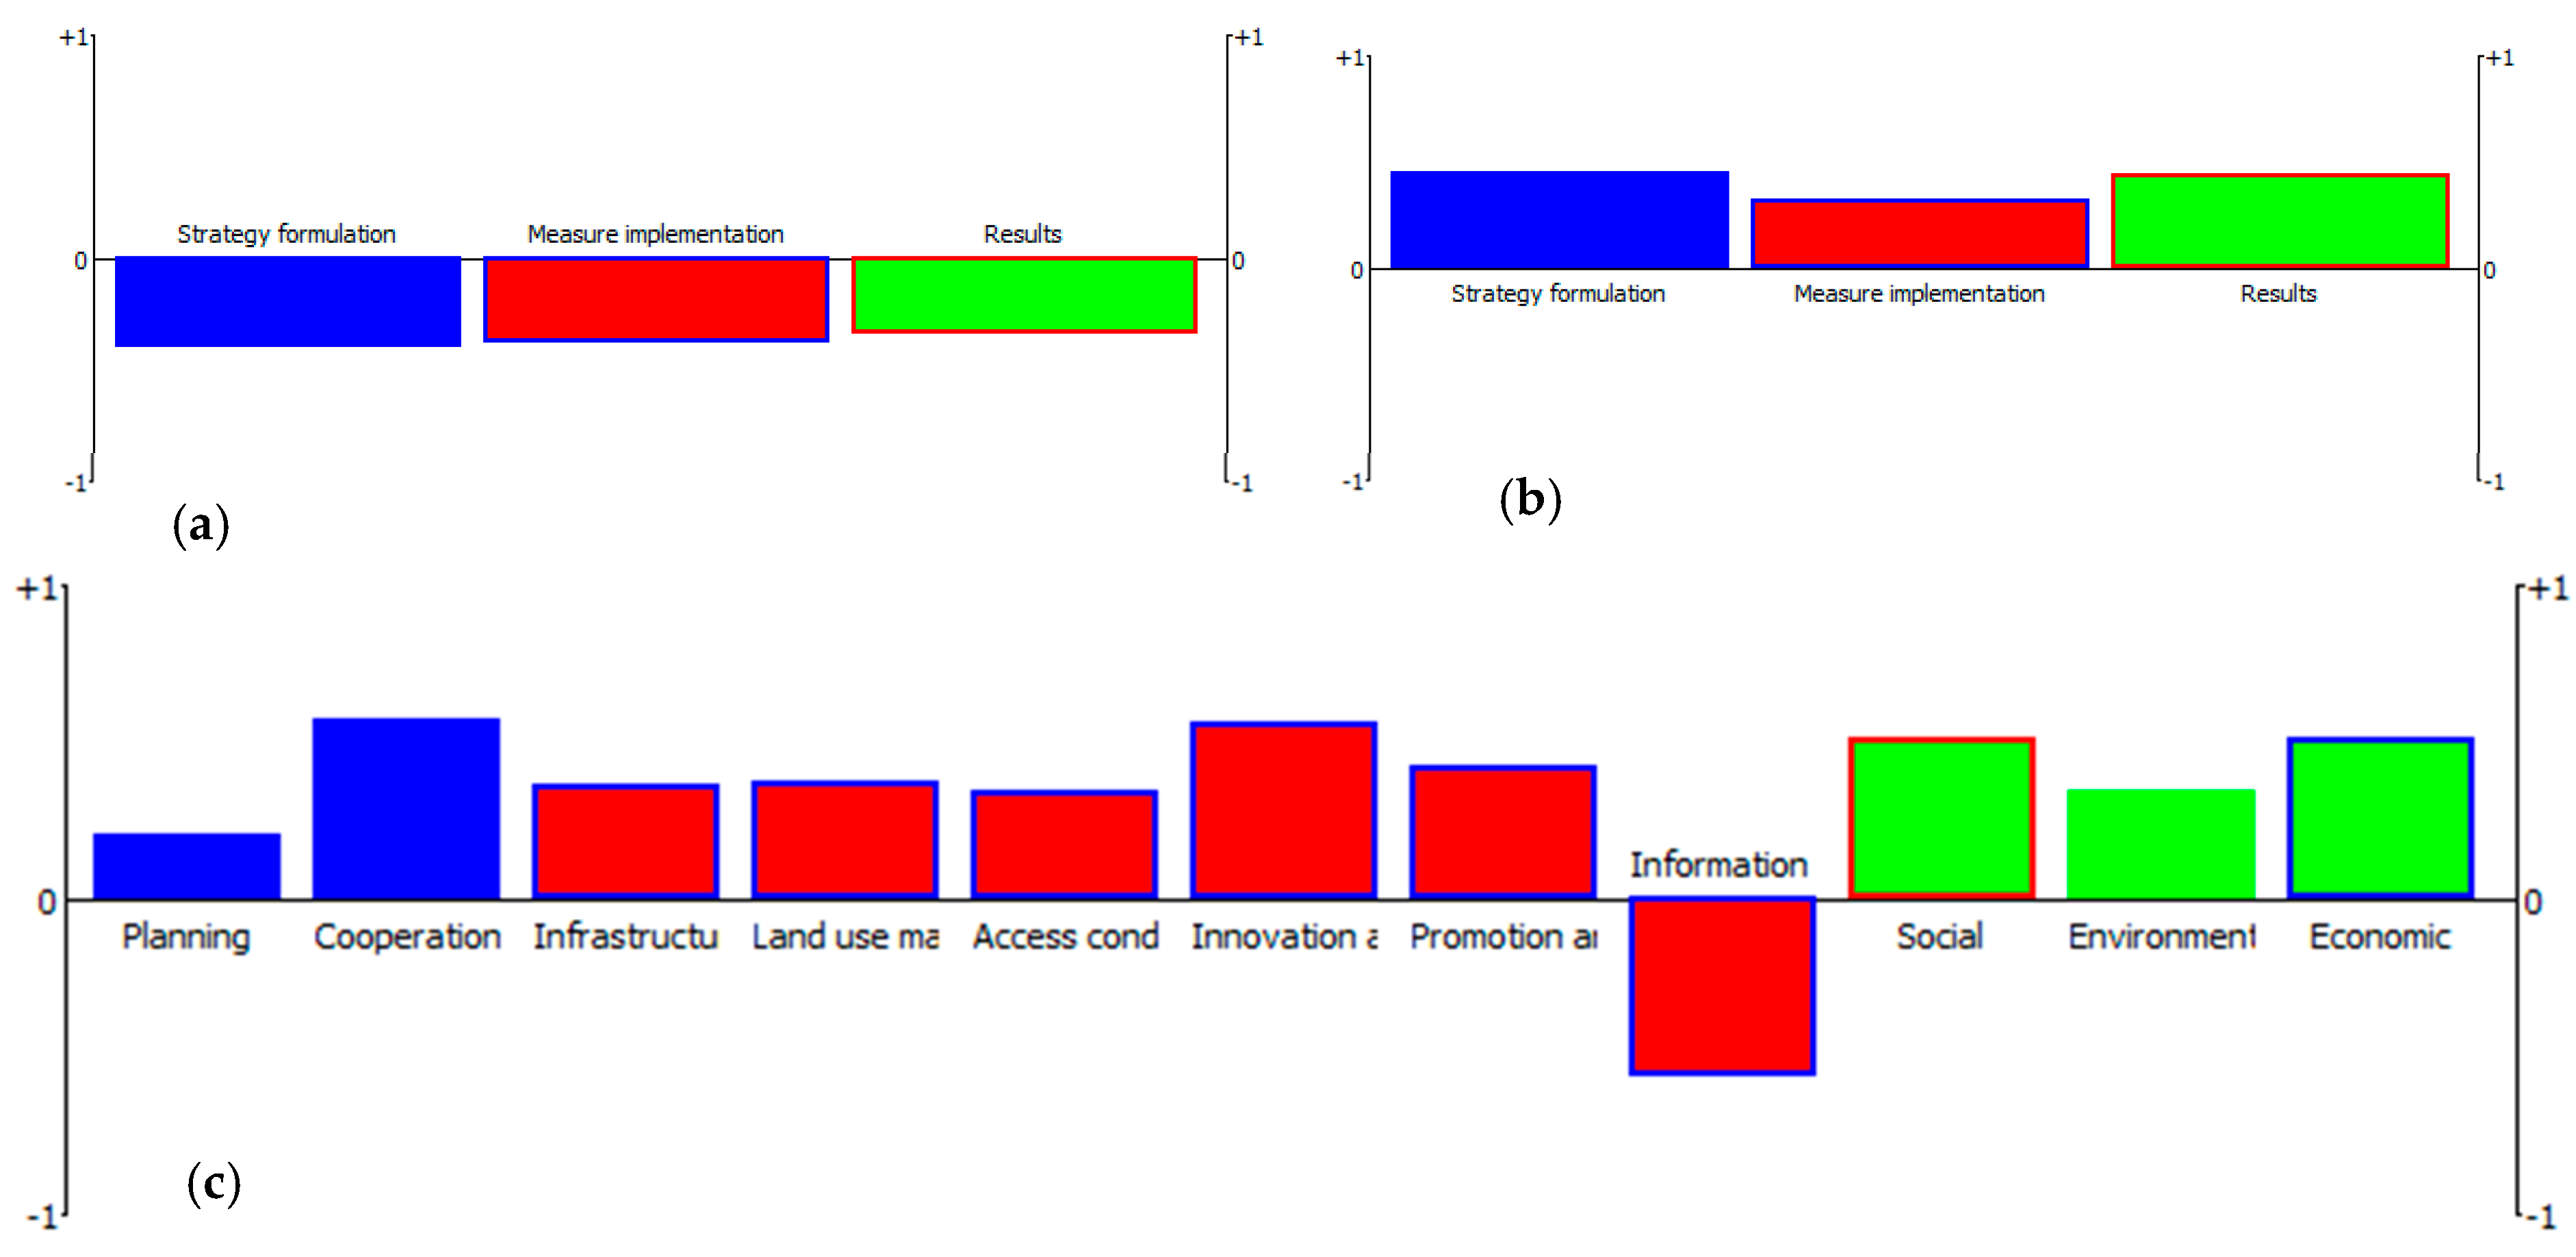
- Cluster: Strategy formulation (indicators that assess whether the local authority developed a plan for passenger and freight transport, the scope of cooperation with stakeholders, and participation in freight quality partnerships (FQPs));
- Cluster: The implementation of measures towards sustainable urban mobility (this area includes indicators related to five groups of the implementation of measures in the field of passenger and freight transport in terms of sustainable urban mobility development, namely, infrastructure, land use management, access condition, innovation and ideas, and promotion and dissemination);
- Results regarding the implementation of measures in terms of sustainable urban mobility (economic, such as costs caused by congestion, social, such as safety and security, and environmental, such as the number of inhabitants travelling with the use of ecological means, NO2, PM emission, etc.).
- What purposes have been indicated by the analyzed cities regarding transportation (mobility) plans in terms of sustainable urban mobility?
- What kind of measures have been implemented in the cities regarding sustainable urban mobility?
- What are the results of the undertaken activities in the field of sustainable urban mobility in the analyzed cities (regarding pollutant emissions, safety, etc.)?
- Which analyzed city is an outstanding city in terms of formulating and implementing the sustainable urban mobility plan?
2. Materials and Methods
2.1. Research Procedure
- —number of examined objects,
- —coefficient of variation set for the j-th criterion,
- —standard deviation for the j-th criterion,
- —arithmetic mean of the j-th criterion,
- —value of the j-th criterion for the i-th city.
- Step 1.
- Defining clusters, groups of criteria and criteria (C) for EU capitals (A).
- Step 2.
- Defining functions and preference thresholds. In this analysis, linear functions were adopted for all criteria. For each criterion, the thresholds of incomparability (indistinguishability) Q and preferences P were also defined.
- Step 3.
- The comparison of individual variants in pairs. The first step is to calculate the multi-criteria preference index π according to the following equation:
- Step 4.
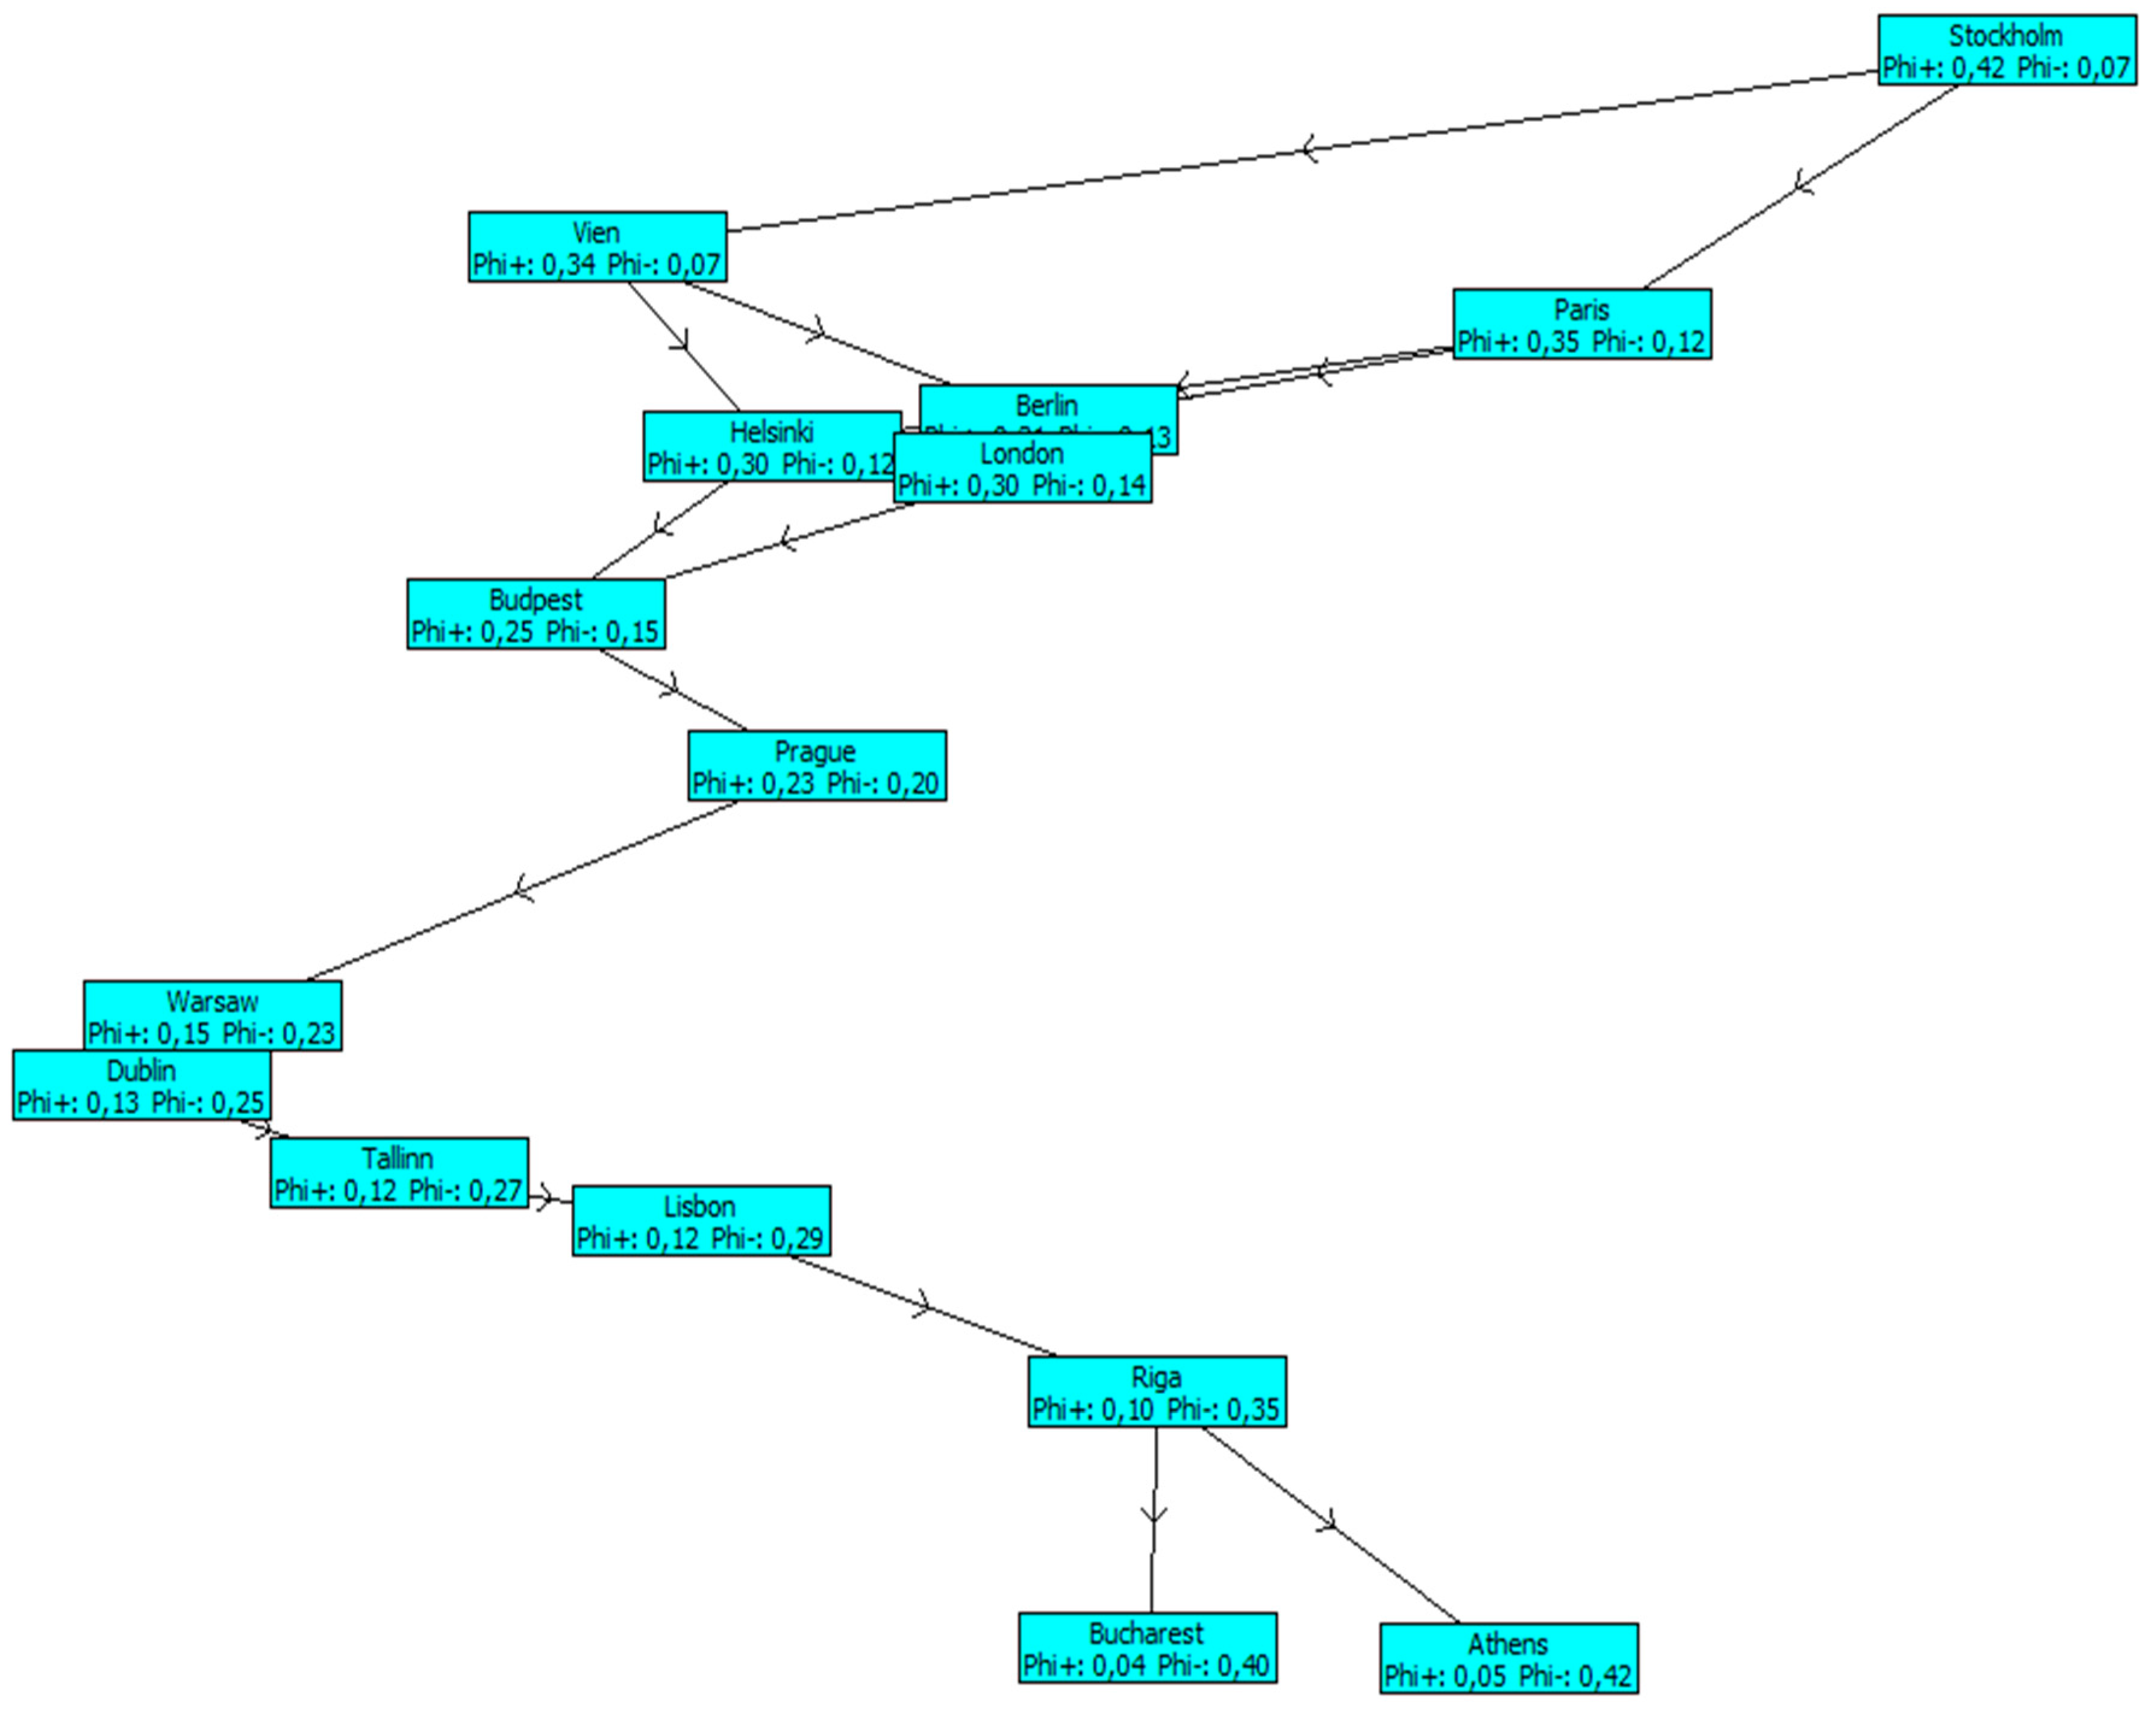
- Obtaining a ranking using negative and positive preference flows using Visual PROMETHE computer software. Preference flows are calculated in order to consolidate the comparison results of variants in pairs and order all variants in the ranking from the best to the worst. Three different preference flows are calculated: Phi + (+): positive flow (or leaving flow), which measures how much variant a is preferred over another n − 1; Phi-(−): negative flow (or entering flow), which measures how many variants n − 1 are more preferred in relation to the variant a; Phi (): net flow, which is the balance between positive and negative flows. It is obtained by aggregating positive and negative flows of a given variant into one final result. φ (a) can be positive or negative. The higher the score, the better the position of the given variant in the ranking. As a result of computer simulation, one can obtain two types of rankings: a partial ranking (Promethee 1) and a complete ranking (Promethee 2). The partial ranking shows the negative and positive flows and the complete ranking of the net flows.
2.2. Indicator Descriptions
- Cluster: Strategy formulation, includes two groups of criteria:
- 1.1.
- Group of criteria: Planning (which includes two criteria: C1 and C2. This group of criteria includes those which are related to the planning phase while developing the SUMP).
- 1.2.
- Group of criteria: Cooperation (which includes one criterion C3, which is related to the freight partnership in a city).
- Cluster: The implementation of measures towards sustainable urban mobility covers the types of solutions in the areas of passenger transport (15 criteria) and freight transport (17 criteria) that affect sustainable urban mobility development. This cluster includes 32 indicators (C4–C35) divided into five groups of indicators:
- 2.1.
- Group of criteria: Infrastructure. This group includes 7 solutions (C4–C10) related to the construction or the development of logistics infrastructure. Among them are: C4. Building a city distribution center; C6. Utilization of public infrastructure (e.g., metro or cargo-trams) for the delivery of goods; C9. Introduction of a bicycle rental system.
- 2.2.
- Group of criteria: Land use management. This group includes three indicators (C11–C13), including C11. Allocating land (roads) in the city for logistic operations (zones for loading up and unloading delivery vehicles); C13. Kiss and Ride parking area.
- 2.3.
- Group of criteria: Access condition. This group consists of 8 indicators (C14–C21) related to the introduction of traffic-restrictive or completely prohibiting regulations in the selected zones. Among the adopted indicators one can mention: C14. Spatial restrictions for freight vehicles depending on weight and size (e.g., entry ban to the center for the vehicles above 3.5 t); C17. Low Emission Zones (LEZ) for delivery vehicles over 3.5 t; C18. The introduction of time limits (so-called time windows) for urban freight transport.
- 2.4.
- Group of criteria: Innovation and ideas. This group includes innovative solutions that improve the organization of passenger and freight transport in a sustainable manner. A total of 7 solutions have qualified for this group, among which can be mentioned: C23. Introduction of night-time deliveries in urban transport of goods; C24. Introduction of the bicycle transport of goods in the city; C25. Introduction of collective deliveries to the city centre; C26. The access to the integrated passenger information system
- 2.5.
- Group of criteria: Promotion and dissemination. This group includes measures (C29–C32) promoting sustainable mobility in a place such as a forum, organizing events, actions motivating companies/residents to use alternative, ecological fuels, means of transport, etc.
- 2.6.
- Group of criteria: Information standards. This group includes measures (C33–C35) in the field of data collection standards on the flow of people and cargo.
- III.
- Cluster: Results regarding implementation of measures in terms of sustainable urban mobility. In this area, three groups of criteria were distinguished:
- 3.1.
- Group of criteria: Economic. This group includes only one indicator due to the lack of access to data. It is an indicator showing the level of congestion in the city (C36). The indicator shows the increase in the total travel time resulting from congestion compared to the situation where the trip would take place beyond the traffic peaks. Assuming that the higher the level of congestion, the higher the costs associated with moving people and loads in the city.
- 3.2.
- Group of criteria: Social. This group includes 5 indicators (C37–C41), which present information on, inter alia, the following: the healthy and pro-ecological communication behavior of residents (for example, the percentage of people travelling by bicycle/walking to work) and safety—the number of people killed in accidents per million inhabitants.
- 3.3.
- Group of criteria: Ecological. This group includes 4 criteria (C42–C45) related to environmental protection. Among them, two criteria relate to the communication behavior of residents affecting the environment in the city (C43. The percentage of the population travelling by public transport; C42. The percentage of residents travelling by private cars daily). The next two indicators present the annual average concentration of NO2 (C44) and PM (C45) in the city.
3. Results and Discussion
4. Conclusions
Author Contributions
Funding
Acknowledgments
Conflicts of Interest
References
- Russo, F.; Comi, A. City characteristics and urban goods movements: A way to environmental transportation system in a sustainable city. Procedia Soc. Behav. Sci. 2012, 39, 61–73. [Google Scholar] [CrossRef]
- Cherrett, T.; Allen, J.; McLeod, F.; Maynard, S.; Hickford, A.; Browne, M. Understanding urban freight activity-key issues for freight planning. J. Trans. Geogr. 2012, 24, 22–32. [Google Scholar] [CrossRef]
- Taniguchi, E. Concepts of city logistics for sustainable and liveable cities. Proc. Soc. Behav. Sci. 2014, 151, 310–317. [Google Scholar] [CrossRef]
- Kijewska, K.; Iwan, S. Analysis of the functioning of urban deliveries in the city centre and its environmental impact based on Szczecin example. Trans. Res. Procedia 2016, 12, 739–749. [Google Scholar] [CrossRef]
- European Commission. Available online: http://ec.europa.eu (accessed on 20 December 2018).
- Gota, S.; Huizenga, C.; Peet, K.; Kaar, G. Intended Nationally-Determined Contributions (INDCs) Offer Opportunities for Ambitious Action on Transport and Climate Change, Partnership on Sustainable Low Carbon Transport. 2015. Available online: http://www.slocat.net/sites/default/files/indc_report_-_preliminary_assessment_october_18.pdf (accessed on 23 August 2019).
- European Commission. Sustainable Urban Transport Plans. Preparatory Document in Relation to the Follow-Up of the Thematic Strategy on the Urban Environment, European Commission, 2007. Available online: https://ec.europa.eu/transport/sites/transport/files/themes/urban/studies/doc/2007_sutainable_urban_transport_plan.pdf (accessed on 06 January 2018).
- Lindholm, M. How local authority decision makers address freight transport in the urban area. Procedia Soc. Behav. Sci. 2012, 39, 134–145. [Google Scholar] [CrossRef]
- Iwan, S. Adaptative approach to implementing good practices to support environmentally friendly urban freight transport management. Procedia Soc. Behav. Sci. 2014, 151, 70–86. [Google Scholar] [CrossRef]
- Lindholm, M.; Behrends, S. Challenges in urban freight transport planning—A review in the Baltic Sea Region. J. Transp. Geogr. 2012, 22, 129–136. [Google Scholar] [CrossRef]
- Dablanc, L. Goods transport in large European cities: Difficult to organize, difficult to modernize. Transp. Res. Part A Policy Pract. 2007, 41, 280–285. [Google Scholar] [CrossRef]
- Kiba-Janiak, M. Urban freight transport in city strategic planning. Res. Trans. Busin. Manag. 2017, 24, 4–16. [Google Scholar]
- Lindenau, M.; Böhler-Baedeker, S. Citizen and stakeholder involvement: A precondition for sustainable urban mobility. Trans. Res. Procedia 2014, 4, 347–360. [Google Scholar] [CrossRef]
- European Commission. Annex to communication from the Commission to the European Parliament, the Council, the European Economic and Social Committee and the Committee of the Regions, Together towards competitive and resource-efficient urban mobility. In A Concept for Sustainable Urban Mobility Plans; 17.12.2013, COM(2013) 913 final; European Commission: Brussels, Belgium, 2013. [Google Scholar]
- Louro, A.; da Costa, N.M.; da Costa, E.M. Sustainable urban mobility policies as a path to healthy cities—The case study of LMA, Portugal. Sustainability 2019, 11, 2929. [Google Scholar] [CrossRef]
- Okraszewska, R.; Romanowska, A.; Wołek, M.; Oskarbski, J.; Birr, K.; Jamroz, K. Integration of a multilevel transport system model into sustainable urban mobility planning. Sustainability 2018, 10, 479. [Google Scholar] [CrossRef]
- ELTIS. Available online: http://www.eltis.org/mobility-plans/project-partners/civitas-sumps (accessed on 10 January 2019).
- de Oliveira Cavalcanti, C.; Limont, M.; Dziedzic, M.; Fernandes, V. Sustainability of urban mobility projects in the Curitiba metropolitan region. Land Use Policy 2017, 60, 395–402. [Google Scholar] [CrossRef]
- Diez, J.M.; Lopez-Lambas, M.E.; Gonzalo, H.; Rojo, M.; Garcia-Martinez, A. Methodology for assessing the cost of sustainable urban mobility plans (SUMPs). The case of the city of Burgos. J. Trans. Geogr. 2018, 68, 22–30. [Google Scholar] [CrossRef]
- Zope, R.; Vasudevan, N.; Arkatkar, S.S.; Joshi, G. Benchmarking: A tool for evaluation and monitoring sustainability of urban transport system in metropolitan cities of India. Sustain. Cit. Soc. 2019, 45, 48–58. [Google Scholar] [CrossRef]
- Awasthi, A.; Omrani, H.; Gerber, P. Investigating ideal-solution based multicriteria decision making techniques for sustainability evaluation of urban mobility projects. Trans. Res. Part A 2018, 116, 247–259. [Google Scholar] [CrossRef]
- Lopez-Carreiro, I.; Monzon, A. Evaluating sustainability and innovation of mobility patterns in Spanish cities. Analysis by size and urban typology. Sustain. Cit. Soc. 2018, 38, 684–696. [Google Scholar] [CrossRef]
- Curiel-Esparza, J.; Mazario-Diez, J.L.; Canto-Perello, J.; Martin-Utrillas, M. Prioritization by consensus of enhancements for sustainable mobility in urban areas. Environ. Sci. Policy 2016, 55, 248–257. [Google Scholar] [CrossRef]
- Perra, V.-M.; Sdoukopoulos, A.; Pitsiava-Latinopoulou, M. Evaluation of sustainable urban mobility in the city of Thessaloniki. Transp. Res. Procedia 2017, 24, 329–336. [Google Scholar] [CrossRef]
- Hickman, R.; Hall, P.; Banister, D. Planning more for sustainable mobility. J. Trans. Geogr. 2013, 33, 210–219. [Google Scholar] [CrossRef]
- Kiba-Janiak, M. Logistics in the Cities’ Development Strategies; Publishing House of Wrocław University of Economics: Wroclaw, Poland, 2019; pp. 143–163. [Google Scholar]
- European Commission. A Sustainable Europe for a Better World: A European Union Strategy for Sustainable Development; Commission Proposal to the Gothenburg European Council, [COM(2001) 264 final]; European Commission: Brussels, Belgium, 2001. [Google Scholar]
- European Commission. Review of the EU Sustainable Development Strategy—Renewed Strategy; DOC 10917/06; European Commission: Brussel, Belgium, 2006. [Google Scholar]
- European Commission. Green Paper: Towards a New Culture for Urban Mobility; 25.9.2007 COM(2007) 551 final; Commission of The European Communities: Brussels, Belgium, 2007. [Google Scholar]
- European Commission. Freight Transport Action Plan; Communication of 18 October 2007 from the Commission: Freight Transport Logistics COM (2007) 607; European Commission: Brussel, Belgium, 2007. [Google Scholar]
- European Commission. Action Plan on Urban Mobility; Communication from the Commission to the European Parliament; The Council, the European Economic and Social Committee and the Committee of the Regions: Brussel, Belgium, 2015. [Google Scholar]
- European Commission. A Sustainable Future for Transport: Towards an Integrated, Technology-Led and User-Friendly System; Directorate General for Energy and Transport: Brussels, Belgium, 2009. [Google Scholar]
- European Commission. White Paper: Roadmap to a Single European Transport Area—Towards a Competitive and Resource Efficient Transport System; 28.3.2011 COM (2011) 144 final; European Commission: Brussels, Belgium, 2011. [Google Scholar]
- European Commission. Communication from the commission to the European Parliament, the Council, the European economic and social committee and the committee of the regions. In A European Strategy for Low-Emission Mobility; {SWD(2016) 244 final}, COM(2016) 501 final, Brussels; European Commission: Brussel, Belgium, 2016. [Google Scholar]
- Witkowski, J.; Kiba-Janiak, M. The role of local governments in the development of city logistics. Procedia Soc. Behav. Sci. 2014, 125, 373–385. [Google Scholar] [CrossRef]
- Zeliaś, A. Taxonomic Analysis of Spatial Differentiation of Living Standards in Poland in Dynamic Terms; Publishing House of Cracow University of Economics: Kraków, Poland, 2000; p. 43. [Google Scholar]
- Hellwig, Z. Application of the taxonomic method to the typological division of countries due to the level of their development and the resources and structure of qualified personnel (trans. From Polish). Stat. Rev. 1968, 4, 307–327. [Google Scholar]
- Brans, J.; Mareschal, B.; Vincke, P.H. How to select and how to rank projects: The PROMETHEE method. Eur. J. Oper. Res. 1986, 24, 228–238. [Google Scholar] [CrossRef]
- Abu-Taleb, M.F.; Mareschal, B. Water resources planning in the Middle East: Application of the PROMETHEE V multicriteria method. Eur. J. Oper. Res. 1995, 81, 500–551. [Google Scholar] [CrossRef]
- Pisoni, E.; Christidis, P.; Thunis, P.; Trombetti, M. Evaluating the impact of sustainable urban mobility plans on urban background air quality. J. Environ. Manag. 2019, 23, 1249–1255. [Google Scholar] [CrossRef]
- Mozos-Blanco, M.Á.; Pozo-Menéndeza, E.; Arce-Ruizb, R.; Baucells-Aletà, N. The way to sustainable mobility. A comparative analysis of sustainable mobility plans in Spain. Trans. Policy 2018, 72, 45–54. [Google Scholar] [CrossRef]

| I. Cluster: Strategy Formulation |
|---|
| 1.1. Group of Criteria: Planning |
| C1. The local government has a prepared comprehensive plan in the area of city logistics which includes both passenger and freight transport (the city has a comprehensive plan—3 p., it does not have a plan but wants to prepare it within a year—2 p., it does not have a plan and has no intention to do so—1 p., 2015–2016, [max 1]) |
| C2. The scope of a city’s partnership with experts/institutions/entities specializing in city logistics in order to improve the transport of passengers and/or goods (number of types of the experts/institutions, etc., max = 6, 2015/2016, [max]) |
| 1.2. Group of criteria: Cooperation |
| C3. Local government has a freight quality partnership (FQP) in the city (1—yes, 0—no, 2015–2016, [max]) |
| II. Cluster: Implementation of Measures towards Sustainable Urban Mobility |
| 2.1. Group of Criteria: Infrastructure |
| C4. Building a city distribution center (the place where deliveries are consolidated and delivered jointly to the city center) (1—yes, 0—no, 2015–2016, [max]) |
| C5. Access to infrastructure for transport and/or production companies located outside the city center (the land offered by the local authorities for investment on the city’s outskirts on attractive conditions, which can eliminate traffic from the center) (1—yes, 0—no, 2015–2016, [max]) |
| C6. Utilization of public infrastructure (e.g., metro or cargo trams) to deliver goods (1—yes, 0—no, 2015–2016, [max]) |
| C7. “Park and Ride” system (access to free car parks located near public transport hubs) (1—yes, 0.5—being built or on the outskirts, 0—no, 2015–2016, [max]) |
| C8. Building a network of cycle paths (the length of the paths built per the area of the city in km2, 2015–2016, [max]) |
| C9. Introduction of a bicycle rental system (total number of bicycles available in the urban bike rental system in relation to number of residents per 1000 persons, 2015–2016, [max]) |
| C10. Introduction of electric buses into the city’s system of public transport (1—one complete bus line operates in the city’s public transport or a few dozen electric buses, 0.5—a small number (a few) buses, 0—no electric buses, 2015–2016, [max]) |
| 2.2. Group of Criteria: Land Use Management |
| C11. Allocating land (roads) in the city for logistic operations (zones for loading up and unloading delivery vehicles) (1—yes, 0—no, 2015–2016, [max]) |
| C12. Removal of freight transport generators due to the revitalization or revival of the city (moving companies generating transport of goods out of the city center to other areas less frequented by residents) (1—yes, 0—no, 2015–2016, [max]) |
| C13. Kiss and Ride car parks enable a quick stop—from a few minutes up to a quarter of an hour to drop off a passenger to school or station (coach, railway, etc.) (1—yes, 0—no, [max]). |
| 2.3. Group of criteria: Access condition |
| C14. Spatial restrictions for freight transport vehicles depending on their weight and size (e.g., entry ban to the center for the vehicles over 3.5 t) (1—yes, 0-—no, 2015–2016, [max]) |
| C15. Introduction of loading and unloading zones for delivery vehicles (assignment of special loading bays for loading/unloading vehicles) (1—yes, 0—no, 2015–2016, [max]) |
| C16. Introduction of toll zones for entry to the city center of HGVs (1—yes, 0—no, 2015–2016, [max]) |
| C17. Low Emission Zones (LEZs) for delivery vehicles over 3.5 t (e.g., entry to the city center only for delivery vehicles marked Euro 6) (1—yes, 0—no, 2015–2016, [max]) |
| C18. Introduction of time limits (the so-called time windows for making deliveries) for urban freight transport (1—yes, 0—no, 2015–2016, [max]) |
| C19. Low Emissions Zones (LEZ) for passenger cars (1—yes, 0—no, 2015–2016, [max]) |
| C20. Introduction of toll zones for entry to the city center for passenger cars (1—yes, 0—no, 2015–2016, [max]) |
| C21. Introduction of a ban on access by passenger cars to the city center (1—yes, 0—no, 2015–2016, [max]) |
| 2.4. Group of Criteria: Innovation and Ideas |
| C22. Introduction of electric delivery vehicles for urban transport of goods (1—yes, 0—no, 2015–2016, [max]) |
| C23. Introduction of night-time deliveries in urban transport of goods (1—yes, 0—no, 2015–2016, [max]) |
| C24. Introduction of the bicycle transport of goods in the city (1—yes, 0—no, 2015–2016, [max]) |
| C25. Introduction of collective deliveries to the city center (consolidation of deliveries through, e.g., micro-hubs located near the city center) (1—yes, 0—no, 2015–2016, [max]) |
| C26. Access to an integrated passenger information system (the system provides the passengers with information about the real arrival times of buses/trams/metro) (1—yes, 0—no, 2015–2016, [max]) |
| C27. Coordination of tariffs and timetables for public transport (1—yes, 0—no, 2015–2016, [max]) |
| C28. Smartphone apps which enable buying public transport tickets, and optimize the routes (dedicated—offered by local government (its transport department) —1, universal—offered by international companies, e.g., Google—0.5, 2015–2016, [max]) |
| 2.5. Group of Criteria: Promotion and Dissemination |
| C29. Creating a forum (or other ideas) dedicated to ecological urban freight transport (via the Internet, meetings with various stakeholders, etc.) (1—yes, 0—no, 2015–2016, [max]) |
| C30. Encouraging transport operators to use alternative fuels (information meetings, advertising) (1—yes, 0—no, 2015–2016, [max]) |
| C31. Realization of events and actions encouraging residents to use ecological transport (1—yes, 0—no, 2015–2016, [max]) |
| C32. Access to the free public passenger transport (1—yes, 0.5—in part (e.g., for people with disabilities, children, etc. 0—no, 2015–2016, [max]) |
| 2.6. Group of Criteria: Information Standards |
| C33. The city implemented formal regulations regarding the collection of data on the subject of freight transport (4—yes, collects data in real time/daily, 3—yes, cyclically, 2—yes, sometimes, 1-no, 2015–2016, [max]) |
| C34. The city implemented formal regulations regarding the collection of data on public passenger transport (4—yes, collects data in real time/daily, 3—yes, cyclically, 2—yes, sometimes, 1—no, 2015–2016, [max]) |
| C35. The city implemented formal regulations regarding the collection of data on individual transport (4—yes, collects data in real time/daily, 3—yes, cyclically, 2—yes, sometimes, 1—no, 2015–2016, [max]) |
| III. Cluster: Results Regarding the Implementation of Measures in Terms of Sustainable Urban Mobility |
| 3.1. Group of Criteria: Economic |
| C36. Level of traffic congestion according to the TomTom index 2 in respect of the main hubs of the TEN-T (Trans-European Transport Network) -the index shows an increase in the total time of travel resulting from congestion compared to the same journey during the off-peak times (%, 2015, [min 3]); |
| 3.2. Group of Criteria: Social |
| C37. Percentage of residents satisfied with the functioning of a city’s public transport (% answers: very satisfied and fairly satisfied, 2015, [max] |
| C38. Percentage of residents using bicycles when going to work/gym (% of respondents using this type of transport, 2015, [max]); |
| C39. Percentage of residents going to work/gym on foot (% of respondents who walk to work/gym, 2015, [max]) |
| C40. Number of people killed in accidents per million inhabitants (2015, [min]) |
| C41. Safety satisfaction of citizens (sum of the answers: very satisfy and somehow satisfy, 2015, [max]) |
| 3.3. Group of Criteria: Environmental |
| C42. Percentage of residents using a private car when going to work/gym (% of respondents using this type of transport, 2015, [min]) |
| C43. Percentage of residents using public transport when going to work/gym (% of respondents using this type of transport, 2015, [max]) |
| C44. Average annual concentration of NO2 (nitrogen oxides) (μg/m3, 2013, [min]); |
| C45. Average annual concentration of PM (particulate matter) (μg/m3, 2013, [min]); |
| Rank | Action | Phi | Phi+ | Phi- | Involvement in SUMP Projects and Initiatives 1 |
|---|---|---|---|---|---|
| 1 | Stockholm | 0.3511 | 0.4221 | 0.0710 | CIVITAS (2002–2016); CIVITAS forum Do the Right Mix, SUMP award (2012–2015) |
| 2 | Vienna | 0.2634 | 0.3360 | 0.0727 | CH4LLENGE (2013–2016); CIVINET; ENDURANCE (2013–2016); PUMAS EU (2013–2015) |
| 3 | Paris | 0.2283 | 0.3480 | 0.1197 | - |
| 4 | Berlin | 0.1857 | 0.3107 | 0.1250 | CIVITAS (2002–2016); CIVITAS forum Do the Right Mix; SUMP award (2012–2015) |
| 5 | Helsinki | 0.1737 | 0.2964 | 0.1227 | Do the Right Mix, SUMP award (2012–2015) |
| 6 | London | 0.1640 | 0.2990 | 0.1351 | CIVITAS forum |
| 7 | Budapest | 0.0992 | 0.2521 | 0.1529 | BUMP (2013–2016); CH4LLENGE (2013–2016); CIVITAS forum; ENDURANCE (2013–2016); Solutions (2013–2016); TIDE (2012–2015) |
| 8 | Prague | 0.0309 | 0.2264 | 0.1955 | CIVITAS (2002–2016); CIVITAS forum; ENDURANCE (2013–2016) |
| 9 | Warsaw | −0.0815 | 0.1520 | 0.2335 | CH4LLENGE (2013–2016); CIVITAS forum; TIDE (2012–2015) |
| 10 | Dublin | −0.1121 | 0.1346 | 0.2467 | CIVITAS forum; ENDURANCE (2013–2016) |
| 11 | Tallinn | −0.1510 | 0.1229 | 0.2739 | CIVITAS (2002–2016); CIVITAS forum; PILOT (2005–2007); TIDE (2012–2015) |
| 12 | Lisbon | −0.1723 | 0.1213 | 0.2936 | - |
| 13 | Riga | −0.2484 | 0.0969 | 0.3453 | CH4LLENGE (2013–2016); CIVITAS forum |
| 14 | Bucharest | −0.3631 | 0.0393 | 0.4023 | - |
| 15 | Athens | −0.3678 | 0.0477 | 0.4155 | Involved in EU project on SUMP; CIVITAS forum; Do the Right Mix, SUMP award (2012–2015); ENDURANCE (2013–2016) |
© 2019 by the authors. Licensee MDPI, Basel, Switzerland. This article is an open access article distributed under the terms and conditions of the Creative Commons Attribution (CC BY) license (http://creativecommons.org/licenses/by/4.0/).
Share and Cite
Kiba-Janiak, M.; Witkowski, J. Sustainable Urban Mobility Plans: How Do They Work? Sustainability 2019, 11, 4605. https://doi.org/10.3390/su11174605
Kiba-Janiak M, Witkowski J. Sustainable Urban Mobility Plans: How Do They Work? Sustainability. 2019; 11(17):4605. https://doi.org/10.3390/su11174605
Chicago/Turabian StyleKiba-Janiak, Maja, and Jarosław Witkowski. 2019. "Sustainable Urban Mobility Plans: How Do They Work?" Sustainability 11, no. 17: 4605. https://doi.org/10.3390/su11174605
APA StyleKiba-Janiak, M., & Witkowski, J. (2019). Sustainable Urban Mobility Plans: How Do They Work? Sustainability, 11(17), 4605. https://doi.org/10.3390/su11174605