Article

Thermodynamic Fundamentals for Fuel Production Management

1
Department of Organization and Production Engineering, Warsaw University of Life Sciences, Nowoursynowska Street 164, 02-787 Warsaw, Poland
2
Deptartment of Production Management, Bialystok University of Technology, Wiejska Street 45A, 15-351 Bialystok, Poland
3
Faculty of Mechanical Engineering, Institute of Technological Information Systems, Lublin University of Technology, Nadbystrzycka 38 D, 20-618 Lublin, Poland
*
Authors to whom correspondence should be addressed.
Sustainability 2019, 11(16), 4449; https://doi.org/10.3390/su11164449
Submission received: 10 July 2019 / Revised: 15 August 2019 / Accepted: 16 August 2019 / Published: 17 August 2019
(This article belongs to the Special Issue Economic Evaluation of Renewable Energy Sources)

Abstract

:
An increase of needs for replacement of fossil fuels, and for mitigation of Carbon Dioxide emissions generated from fossil fuels inspires the search for new fuels based on renewable biological resources. It would be convenient if the biological component of the fuel required as little as possible conversion operations in the production. The obvious response is an attempt to use unconverted, neat plant oils as a fuel for Diesel engines. The present paper is devoted to the experimental studies of the combustion process of neat rapeseed oil, and its mixtures with gasoline and ethanol as additional components of the mixtures. The investigation of combustion was carried out in a fixed volume combustion chamber equipped with a Common Rail injection system. It is shown that the instant of ignition, as well as time-dependence of heat emanation, are strongly dependent upon mixture composition. The results enable the design of mixture compositions that could serve as commercial fuel for Diesel engines. Such fuels are expected to fulfill the requirements for the sustainability of road transport.

1. Introduction

In the era of the oil crisis and the progressing pollution of the natural environment, the main trend is to replace fossil fuels with alternative carriers [1,2,3].
The needs for replacement of fossil fuels, and for mitigation of carbon dioxide emissions already became the challenge [4,5] that affects the World’s economy [6]. New technologies in power engineering [7,8,9], promotion of electro-mobility, a departure from fossil fuels, and concern for sustainable development and energy security together with assuring the environmental protection are the factors that the fuel and energy industry must react to these changes and prepare for them [10,11,12]. These issues, however, seem to bring expected results in the rather distant future, which means they belong to strategic considerations. The not so distant future requires solutions that are available in a much shorter period of time.
Road transport has been considered for many years as one of the main emitters of substances that impair the quality of atmospheric air [13,14]. About 30% of total CO2 emissions in the EU come from the transport sector, of which 72% from road transport [15,16,17]. There are two ways to reduce CO2 emissions from cars: Increasing vehicle efficiency or changing the fuel used [18,19,20]. Refineries will be forced to produce more and more environmentally friendly fuels [21,22]. The applicable European directives obligate member states to implement biofuels and biocomponents in the fuel market [23,24], however, this process is gradual and relatively slow [25,26]. Introduction of more and more restrictive driving tests intensifies the race towards the reduction of pollutant emissions [27,28,29]. There is a noticeable lack of an alternative to LPG (Liquefied Petroleum Gas), which for economic reasons is more and more often used as fuel in passenger cars [30,31]. Thus far, alternative fuels for diesel oil and gasoline have been used on a large scale [32,33]. To this end, derivatives of plant materials such as vegetable oils or their esters or ethanol are used for this purpose [34,35].
It seems worth it to comment that the European Commission has stated in the framework of the European strategy for low-carbon mobility that biofuels produced from food will have a limited role in the decarbonization of transport and should not receive public support after 2020. As a consequence, the first-generation biofuels are to be phased out and to be replaced by advanced biofuels of the second and third generation. The technologies of the next generation of biofuels are still not adequately developed and some transitional period should be allowed.
As shown in the works [36,37], the energetic efficiency of fuel production is rapidly decreasing with the increase in the number of processing operations. This justifies the tendency to use, in the transitional period, the unprocessed vegetable oils as components of engine fuels.
Apparently, in order to use vegetable oil as fuel for engines, it should be enough to perform only the basic filtration aimed at removing the suspension and possible small remains of oil cake. In practice, the use of plant fuels requires some adaptation of the engine resulting from the properties of these fuels that differ from the properties of diesel fuels. All this requires a detailed analysis of chemical reactions taking place in the combustion chamber.
The fuels, in general, are highly standardized commodities that must fulfill sharp requirements with respect to their behavior. Their combustion inside the engine must assure optimal work as well as longevity of the engines. Creation of standards and assuring that all requirements of those standards are fulfilled by the fuels introduced to the market, force the conduction of research to study the processes that occur during the combustion of fuel inside of the engine.
For the basic research of complex processes, such as combustion of fuels in diesel engines, special test chambers are used, enabling independent change of parameters and the use of special experimental techniques and parameter registration [38,39].
The chemical processes begin after the creation of a fuel-air mixture in the combustion chamber, which assures appropriate physical parameters. The main factor deciding the course of these processes are the properties and chemical structure of the fuel used and the conditions under which they take place [40,41]. The physical properties of the fuel, in turn, depend on the chemical structure of compounds that constitute the fuel [42,43]. For the quality of spraying, the surface tension and viscosity of the fuel—dependent on the mutual proportions of components—are important. Auto-ignition temperature, specific heat and evaporation heat, resistance to the breakdown of bonds in molecules, as well as other fuel properties are also related to its chemical structure. Physical and chemical properties of the fuel also determine the operational characteristics, including both the efficiency of the engine operation and the toxicity of exhaust gases emitted by the engine [44,45]. The physicochemical properties of the fuel have a decisive influence on the toxicity of the substances formed during its combustion. The most popular fuel for self-ignition internal combustion engines are diesel oils—petroleum fractions, being a mixture of liquid hydrocarbons with a boiling point of 180 °C to 350 °C. These fractions are obtained from crude oil by distillation or by processes such as catalytic cracking or hydrocracking of heavy oils and other residues, that are carried out on an industrial scale in refineries [46,47]. To this day, a number of studies have been carried out on the course of physical and chemical processes taking place at each stage of diesel fuel combustion but there is no such research on the delay of auto-ignition and burning of vegetable oils.
The views on the delay of self-ignition and the further development of combustion are varied [48]. Most often, however, it is believed that the combustion process starts when the fuel comes out of the injector. There are also many uncertainties about the processes of oxidation during the period of self-ignition delay. The course of physical and chemical processes occurring during the combustion of vegetable oil is expected to be different than in the combustion of diesel oil. Due to the higher density and viscosity, in the case of vegetable oil, the injected fuel stream will be more compact and the drops in it will have larger diameters. Therefore, the process of heating, evaporation, and diffusion of fuel will be difficult. As a result, the produced fuel and air mixture will have less homogeneity. The course of chemical processes taking place during the combustion of vegetable oils is also unknown, including the process of decomposition of fatty acids and details of pre-flame reactions.
Because vegetable oil has several times higher the kinematic viscosity than diesel fuel, the stream of vegetable fuel injected into the combustion chamber is sprayed to a much lesser extent than the stream of mineral fuel. Drops of sprayed vegetable oil are larger than those of diesel fuel, and the fuel stream itself is more compact, which increases its range. As a result of inferior fuel atomization, the process of creating a fuel-air mixture proceeds significantly slower and is worse.
In addition, the air temperature in the chamber is important, it may be a critical parameter in the case of burning vegetable oils. As the air temperature in the chamber increases, the rates of evaporation of the injected fuel dose, and the formation of the fuel-air mixture also increase.
Summing up the above: The knowledge concerning the combustion process of fuels derived from vegetable oils in various thermodynamic conditions is necessary to appropriate use of these fuels in real engines.
The management of a variety of legal and business processes leading to the introduction to the market of a new composition of fuel also requires a deep knowledge about the behavior, and possible consequences of its use that might occur in the engine, as well as in the natural environment.
The aim of the present work is to investigate in well-defined conditions of the experiment a time dependence of heat emanation during combustion of several compositions of the fuels containing rapeseed oil mixed with several other substances. The measured dependence contains important information about fuel performance, that can be extracted by appropriate computations.

2. Materials and Methods

The main purpose of the work was to analyze the effect of temperature and fuel composition on injection, auto-ignition, and fuel combustion. The experiments were carried out on a fixed volume chamber equipped with a Common Rail injection system. The effects of injection and combustion of rape oil mixtures with unleaded petrol and ethyl alcohol were investigated. Among others, the influence of initial temperature in the test chamber, the fuel composition, injection pressure, and initial pressure in the test chamber on the auto-ignition and on the course of combustion process was studied. The course of the pressure changes was measured, and the time dependence of the heat release rate was computed using the especially developed computer program.
The layout of the test bench is shown in Figure 1.
The analyses were carried out for various values of air excess coefficients λ. Since an increase in the λ coefficient caused combustion deterioration, the paper presents only the results obtained at λ = 1.25, at which the combustion process proceeded correctly.
The basic parameters of the process were: t0—Self-ignition delay, ∆p—pressure increase and ts—combustion time.
Proportions of individual components in the fuel mixtures were selected based on preliminary experiments as well as literature sources, and operating guidelines for the tested engine [49,50,51]. The following fuels were investigated:
  • Pure rapeseed oil,
  • A mixture of 85% rapeseed oil and 15% unleaded petrol,
  • A mixture of 70% rapeseed oil and 30% unleaded petrol,
  • A mixture of 85% rapeseed oil and 15% ethanol,
  • A mixture of 70% rapeseed oil and 30% ethanol.

2.1. Nomenclature

The following list contains a collection of the most important symbols used in calculations (Table 1).

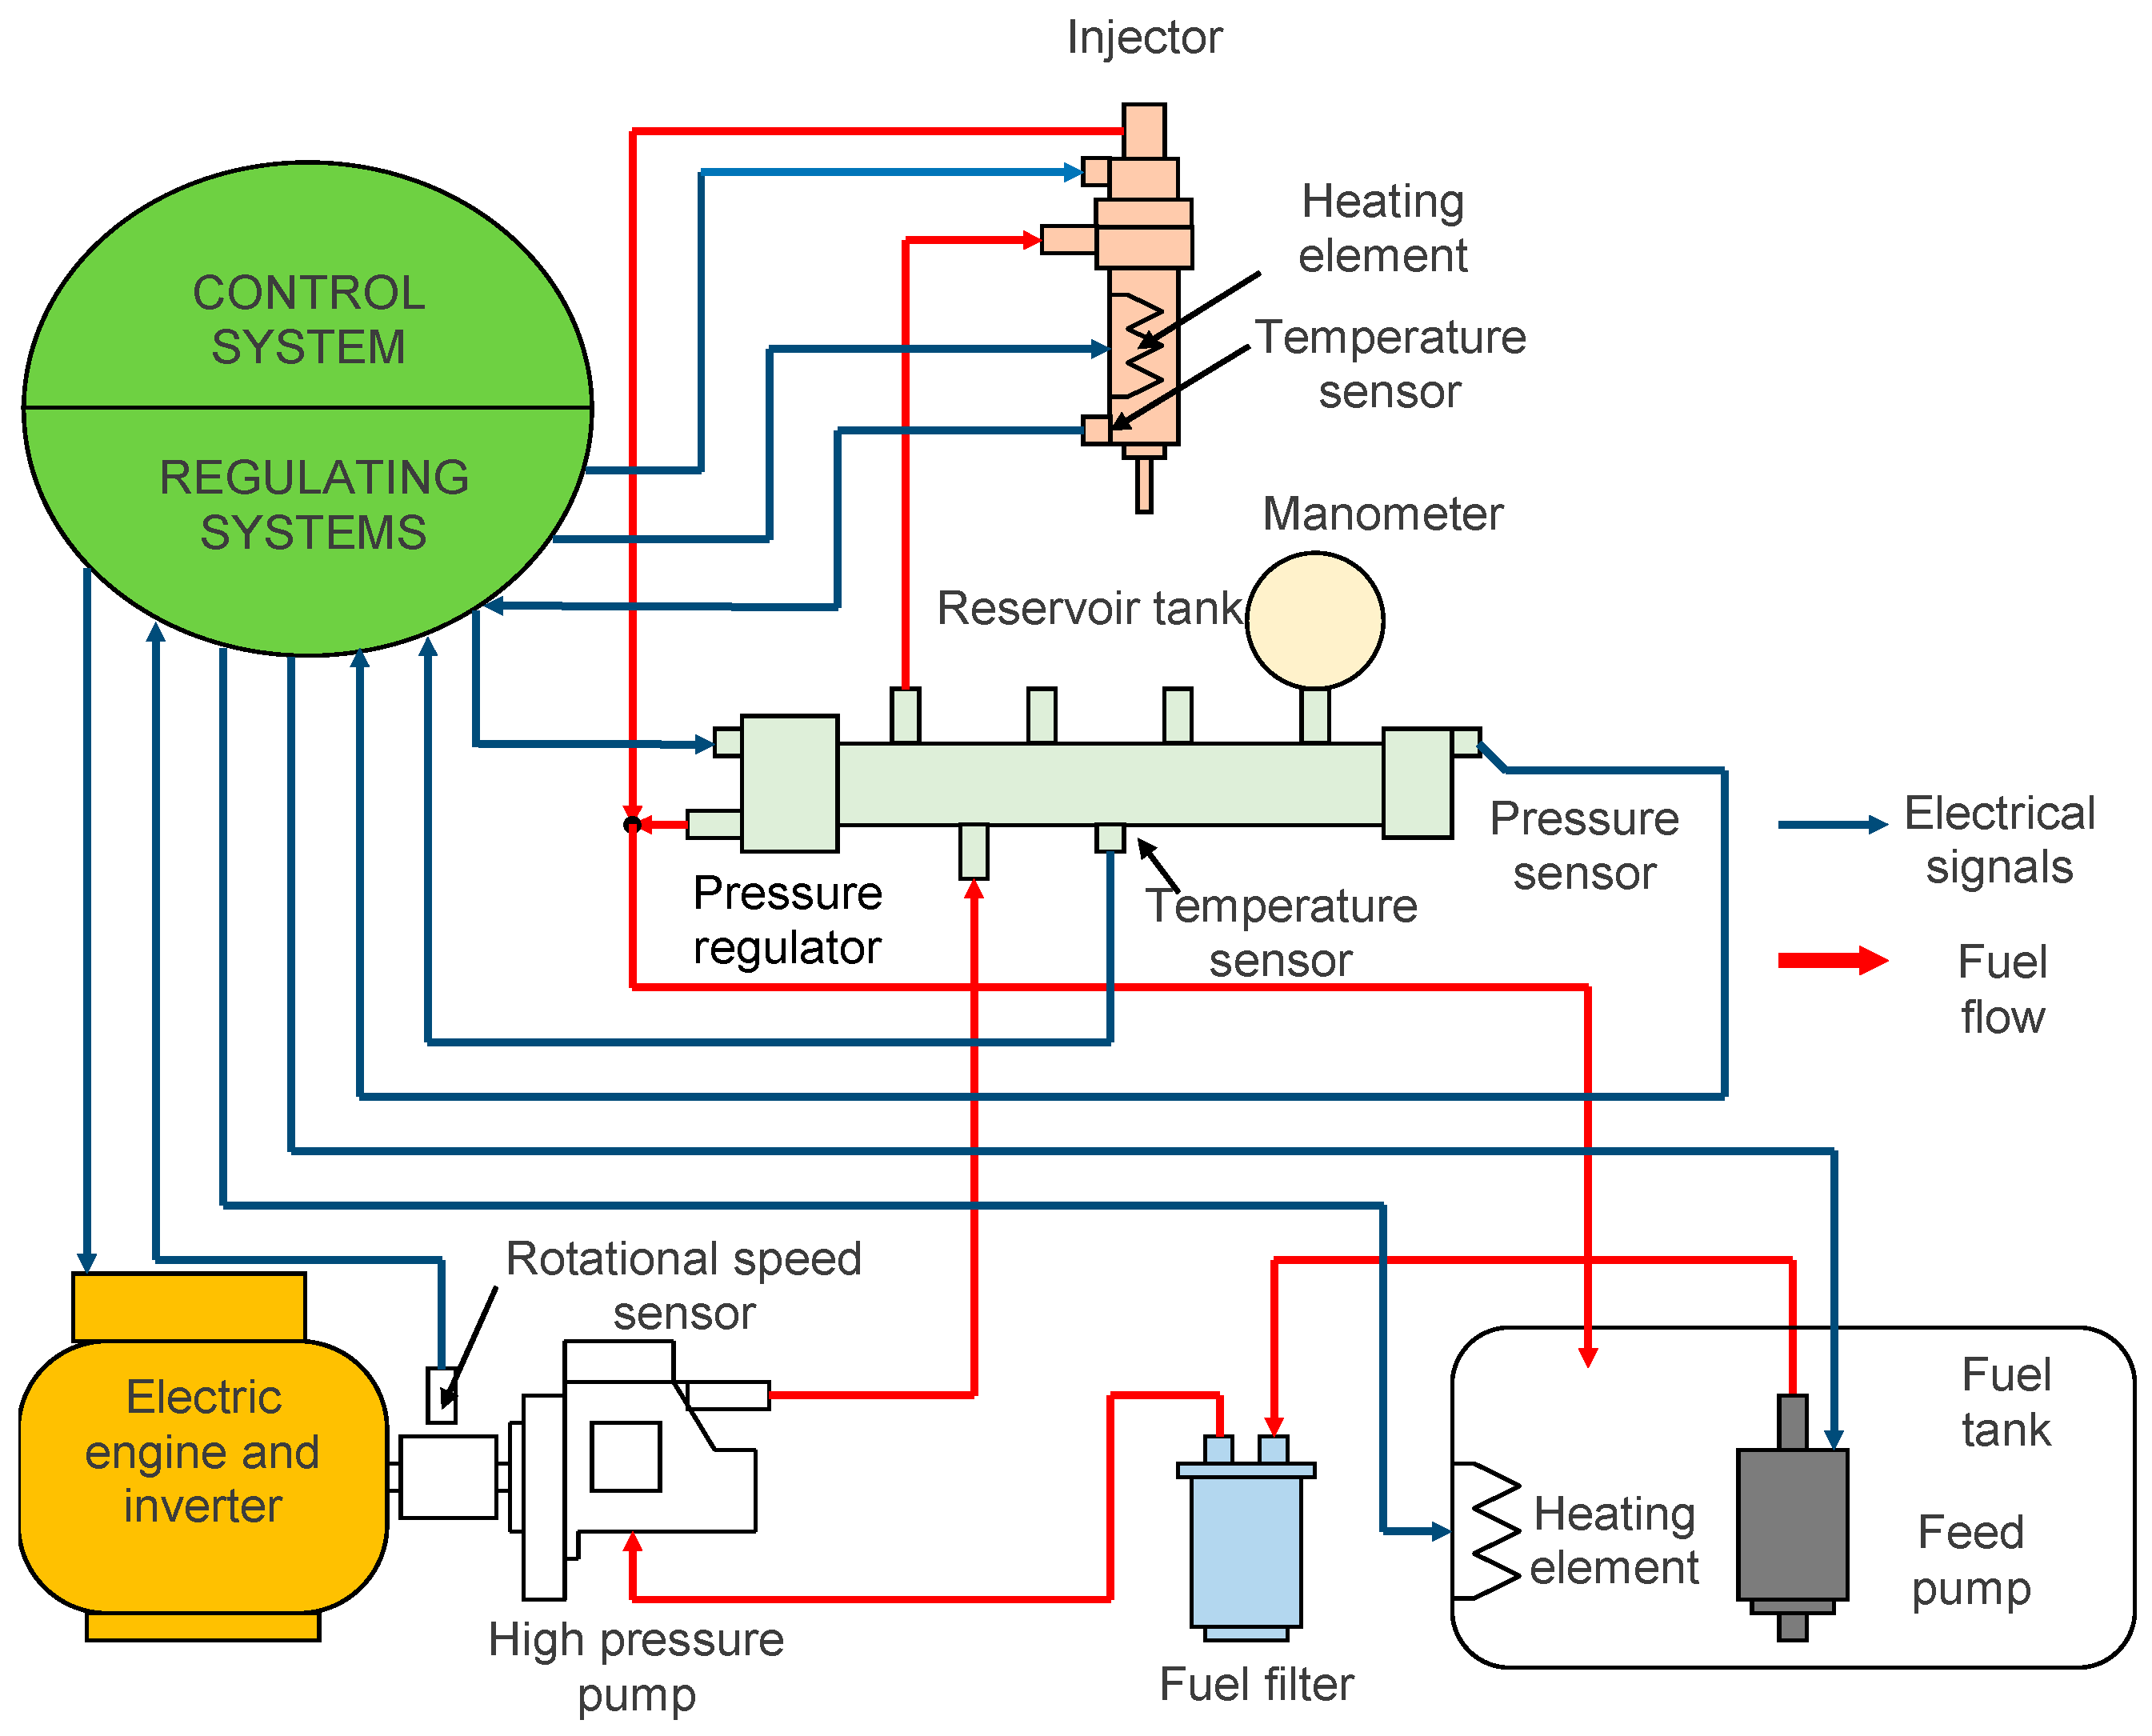
2.2. Description of the Program

Experiments were carried out using a multi-phase, electronically controlled fuel combustion system that was used after some adaptation. The fuel combustion system was developed to allow one-shot fuel injection into the test chamber. The control system also enabled multi-phase injection and changing the parameters of the fuel supplied using the Common Rail injection system. During the experiment, the parameters in the fuel combustion system were also changed (injection pressure, fuel dose).
The main element of the apparatus was a replaceable chamber with a constant volume, enabling the examination of the injection and combustion process. The test chamber enabled the visualization of the injection and combustion process and the heating of the medium in the temperature range of 400 to 700 °C and variable pressure.
The registered characteristic enabled us to examine the parameters of the process of burning rapeseed oil and its mixtures with unleaded petrol and ethanol at various temperatures and air pressures in the chamber.
In order to analyze the thermal parameters of the combustion process of various fuels in the test chamber, a computer program was created enabling calculation of the heat generated in the process. The developed algorithm allowed a quick analysis of the pressure course in the test chamber. The input data for the developed computer tool were obtained from the project implemented at the Faculty of Production Engineering of the Warsaw University of Life Sciences [52].
The basic input was the pressure course during the injection process and during fuel combustion in the test chamber with a volume of 0.8 dm3. In addition, initial parameters such as temperature and initial pressure were needed. Based on these parameters, the mass of air in the test chamber was calculated using the ideal gas equation.
p · V = m · R · T
Due to the fact that the pressure course contained oscillations resulting probably from disturbances, the first stage of the calculation was based on smoothing the pressure course. Smoothing was carried out according to the following relationship:
p n ( t z ) = 0.5 · ( p ( t z ) + p ( t z + 1 ) + p ( t z 1 ) 2 )
In the program, it was assumed that initially, the gas mixture contained nitrogen and oxygen. As a result of fuel combustion, the oxygen contained in the mixture was consumed, and carbon dioxide and water vapor appeared. Due to the relatively low concentrations of other exhaust components, their impact on the thermal parameters of the mixture, and thus on the result of the calculations, was small.
The calculation program took into account changes in the specific heat and gas constant caused by the change in the composition of the mixture resulting from the combustion of fuel. In the case of specific heat, the influence of the gas temperature was also taken into account. Due to the short process time (0.2 s), the heat exchange with the walls of the test chamber was omitted in the calculation model.
The specific heat of the gas mixture in the chamber was determined according to the formula:
C p = [ O 2 ] · C p O 2 + [ N 2 ] · C p N 2 + [ C O 2 ] · C p C O 2 + [ H 2 O ] · C p H 2 O C v = C p R
The value of the specific gas constant R was determined from the following equation:
R = 8.3143 · 10 3 · ( [ O 2 ] 32 + [ N 2 ] 28 + [ C O 2 ] 44 + [ H 2 O ] 18 )   [ J k g · K ]
The specific heat at constant pressure for each component of the gas mixture was calculated from the dependence:
C p R 1 = y 1 + y 2 · T + y 3 · T 2 + y 4 · T 3 + y 5 · T 4
The heat separated was calculated from the formula:
d Q ( t z ) = m · C v · ( T z T z 1 ) Q z = Q z 1 + d Q z T z = p z · V m · R z 1 T z 1 = p z 1 · V m · R z 1
If dQ is positive, then the fuel mass is calculated, which is burned to produce heat equal to dQ.
m p = d Q C s
Based on the fuel composition, the program calculated the amount of carbon dioxide and water vapor that would be emitted from the burning mass of the fuel. On this basis, the new composition of the gas mixture was calculated, as well as parameters such as specific heat and the gas constant. The new composition of the gas mixture was calculated as follows:
C + O 2 C O 2 12 g + 32 g 44 g H 2 + 1 2 O 2 H 2 O 2 g + 16 g 18 g [ O 2 ] z = ( m z 1 · [ O 2 ] z 1 ( x C · ( 32 / 12 ) + x H · 8 ) · m p + x O · m p ) / ( m z 1 + m p ) [ C O 2 ] z = ( m z 1 · [ C O 2 ] z 1 ( x C · ( 44 / 12 ) ) · m p ) / ( m z 1 + m p ) [ H 2 O ] z = ( m z 1 · [ H 2 O ] z 1 ( x H · 9 · m p ) / ( m z 1 + m p ) [ N 2 ] z = ( m z 1 · [ N 2 ] ) / ( m z 1 + m p )

3. Results and Discussion

Using the developed program, the amount of heat released in the combustion process for the fuels mentioned above was calculated. The characteristics of the three components of the investigated fuels used for the calculation are presented in Table 2.
As a result of the calculations, the following parameters were obtained as a function of time: Smoothed pressure course in the test chamber p = f ( t ,   T C R ,   p C R ,   m r ,   m d ) [MPa]; pressure change rates d p / d t = f ( t ,   T C R ,   p C R ,   m r ,   m d ) [MPa/s]; average temperature in the test chamber T = f ( t ,   T C R ,   p C R ,   m r ,   m d ) [K]; heat release rates d Q / d t = f ( t ,   T C R ,   p C R ,   m r ,   m d ) [J/s]; and amounts of heat released Q = f ( t ,   T C R ,   p C R ,   m r ,   m d ) .
Based on these calculations, the effect of various parameters on the combustion process in the test chamber can be determined. The following values were varied during the tests: The initial pressure in the chamber p k = { 0.5 } [MPa]; initial temperature in the chamber T = { 350 ,   425 ,   500 ,   575 } [°C]; excess air factor λ = { 1.25 } ; injection pressure p C R = { 65 ,   100 } [MPa]; fuel composition m r = { 15 ,   30 ,   50 ,   70 ,   100 } [%m/m]; m d = { 15 ,   30 ,   50 ,   70 ,   100 } [%m/m].

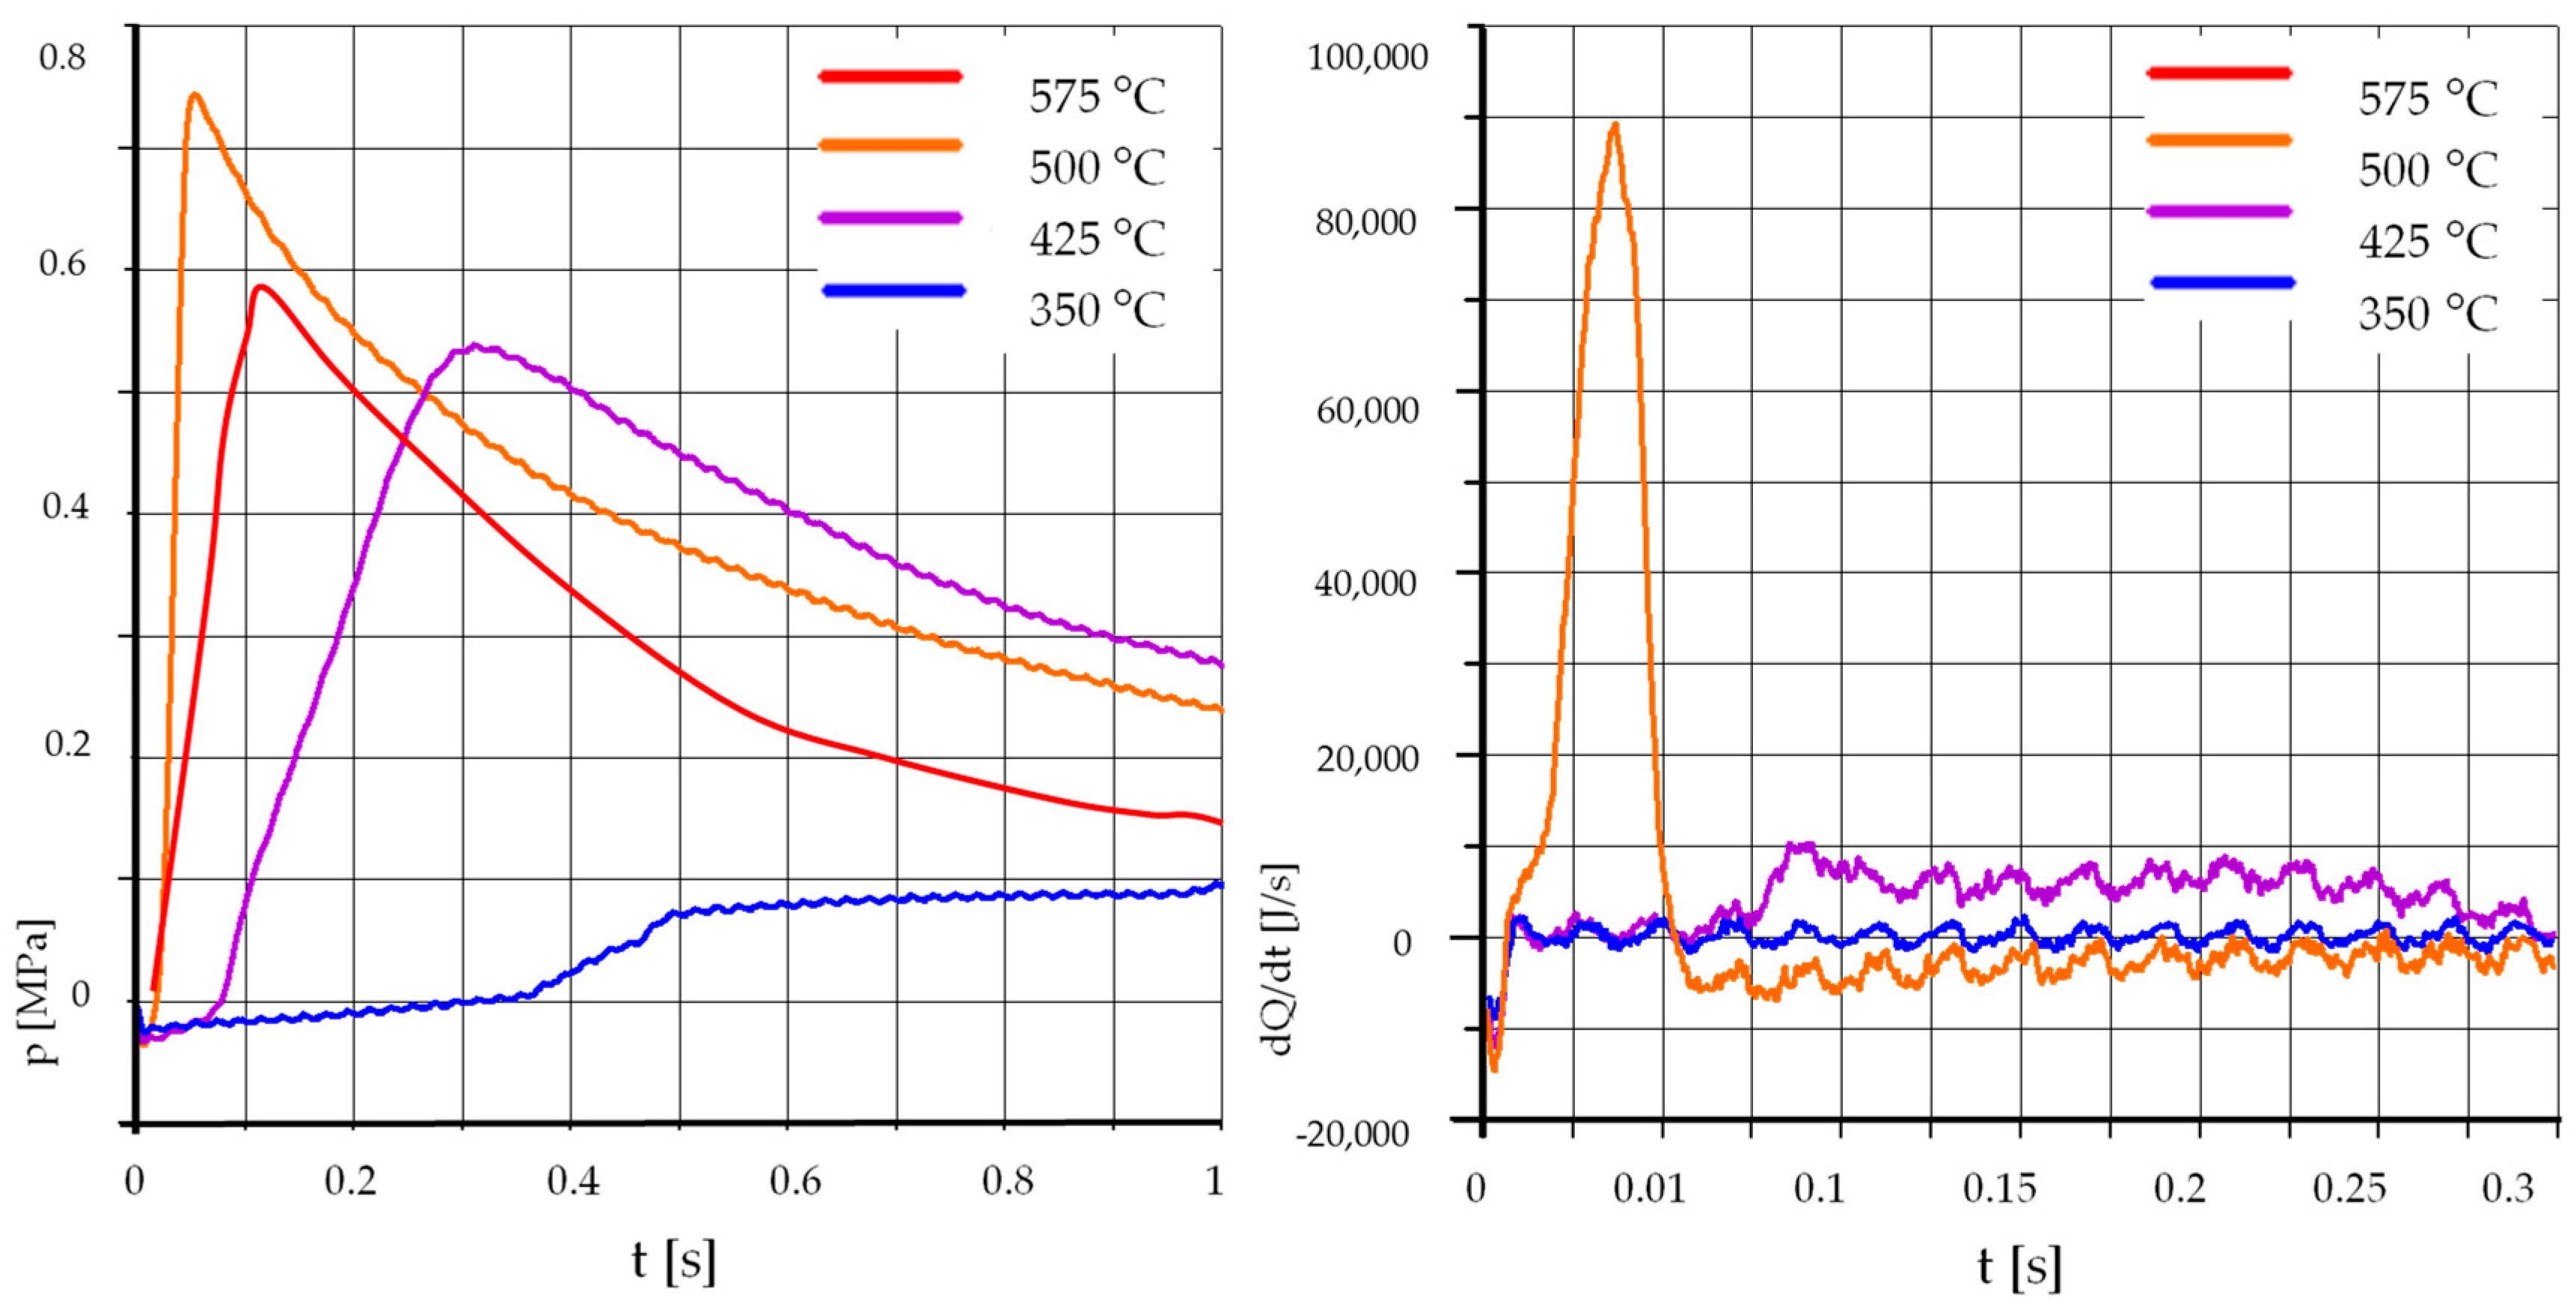
3.1. The Effect of Temperature
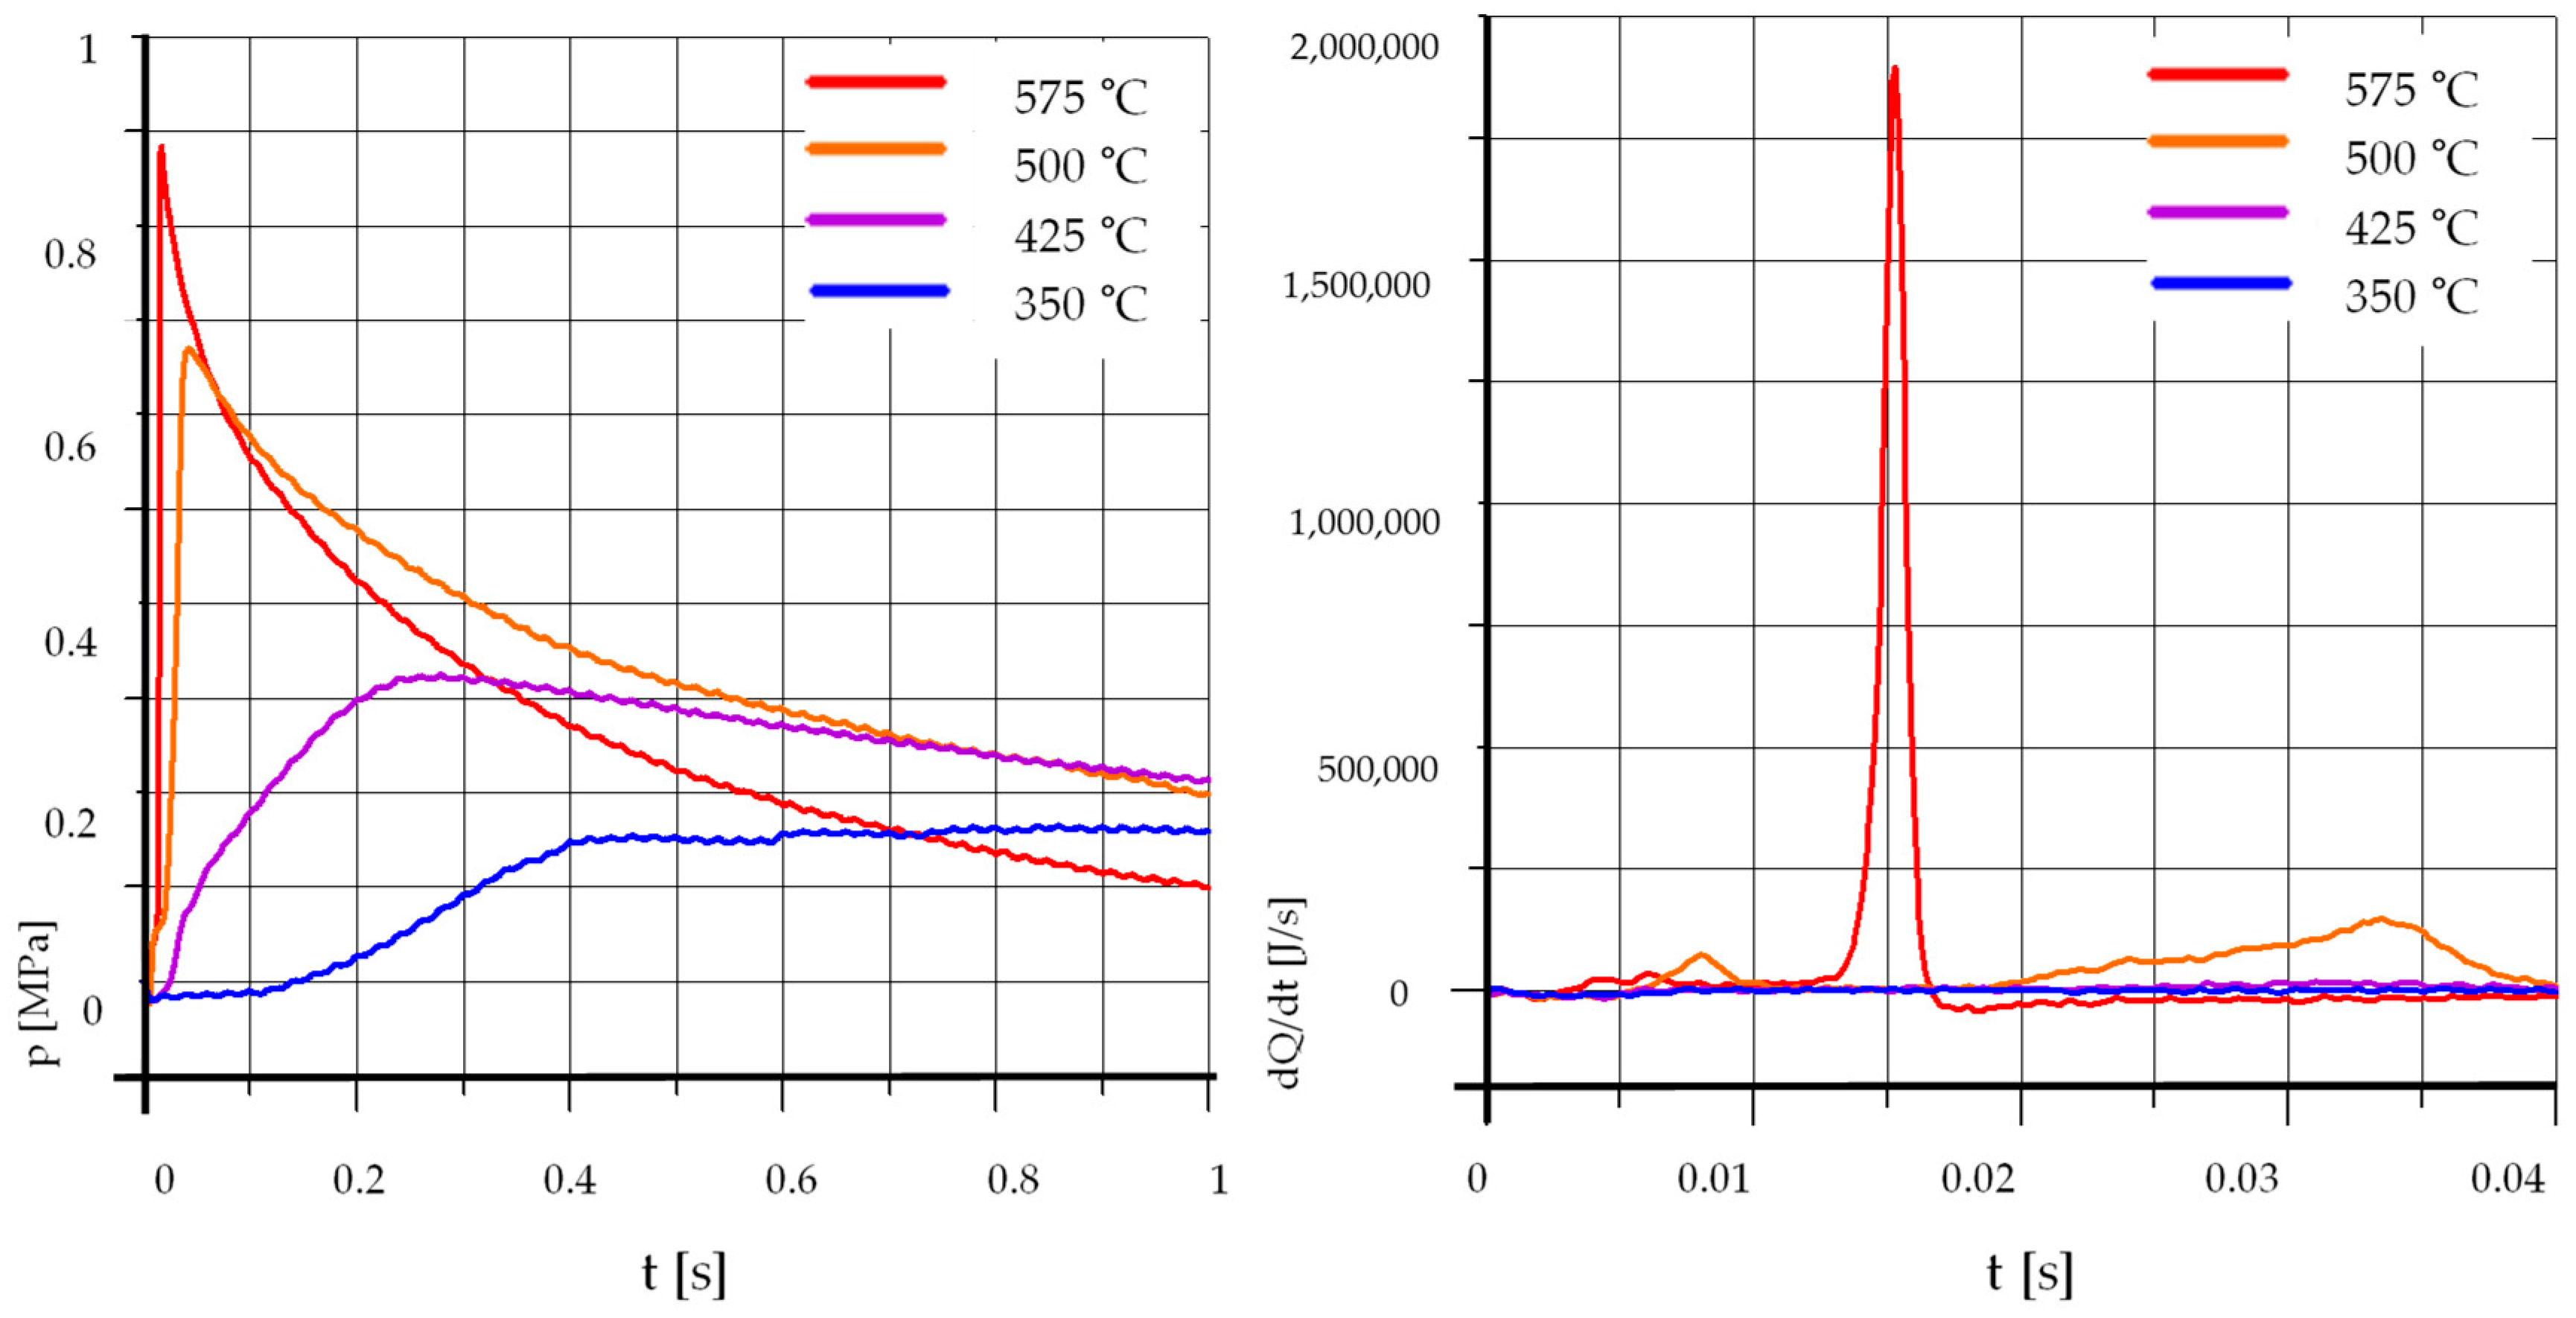
3.1.1. Rapeseed Oil

Figure 2 shows the courses of pressure increase and heat release rates dQ/dt for pure rapeseed oil.
It is seen that an increase in temperature rise not only reduces the time of self-ignition delay but also causes a clear rise in the maximum pressure. At temperatures below 500 °C, the combustion process is very slow, and the maximum pressure is much lower than at higher initial temperatures. The influence of temperature on the process of spraying, auto-ignition, and combustion of pure rapeseed oil is greater than for diesel oil [53]. It can be associated with a higher density of rapeseed oil, and thus a lower content of light fractions that evaporate quickly and become self-igniting, increasing the temperature and accelerating the combustion of heavier fractions.
The waveforms presented are reference levels for the results of tests of mixtures of rapeseed oil with gasoline and the addition of ethyl alcohol.

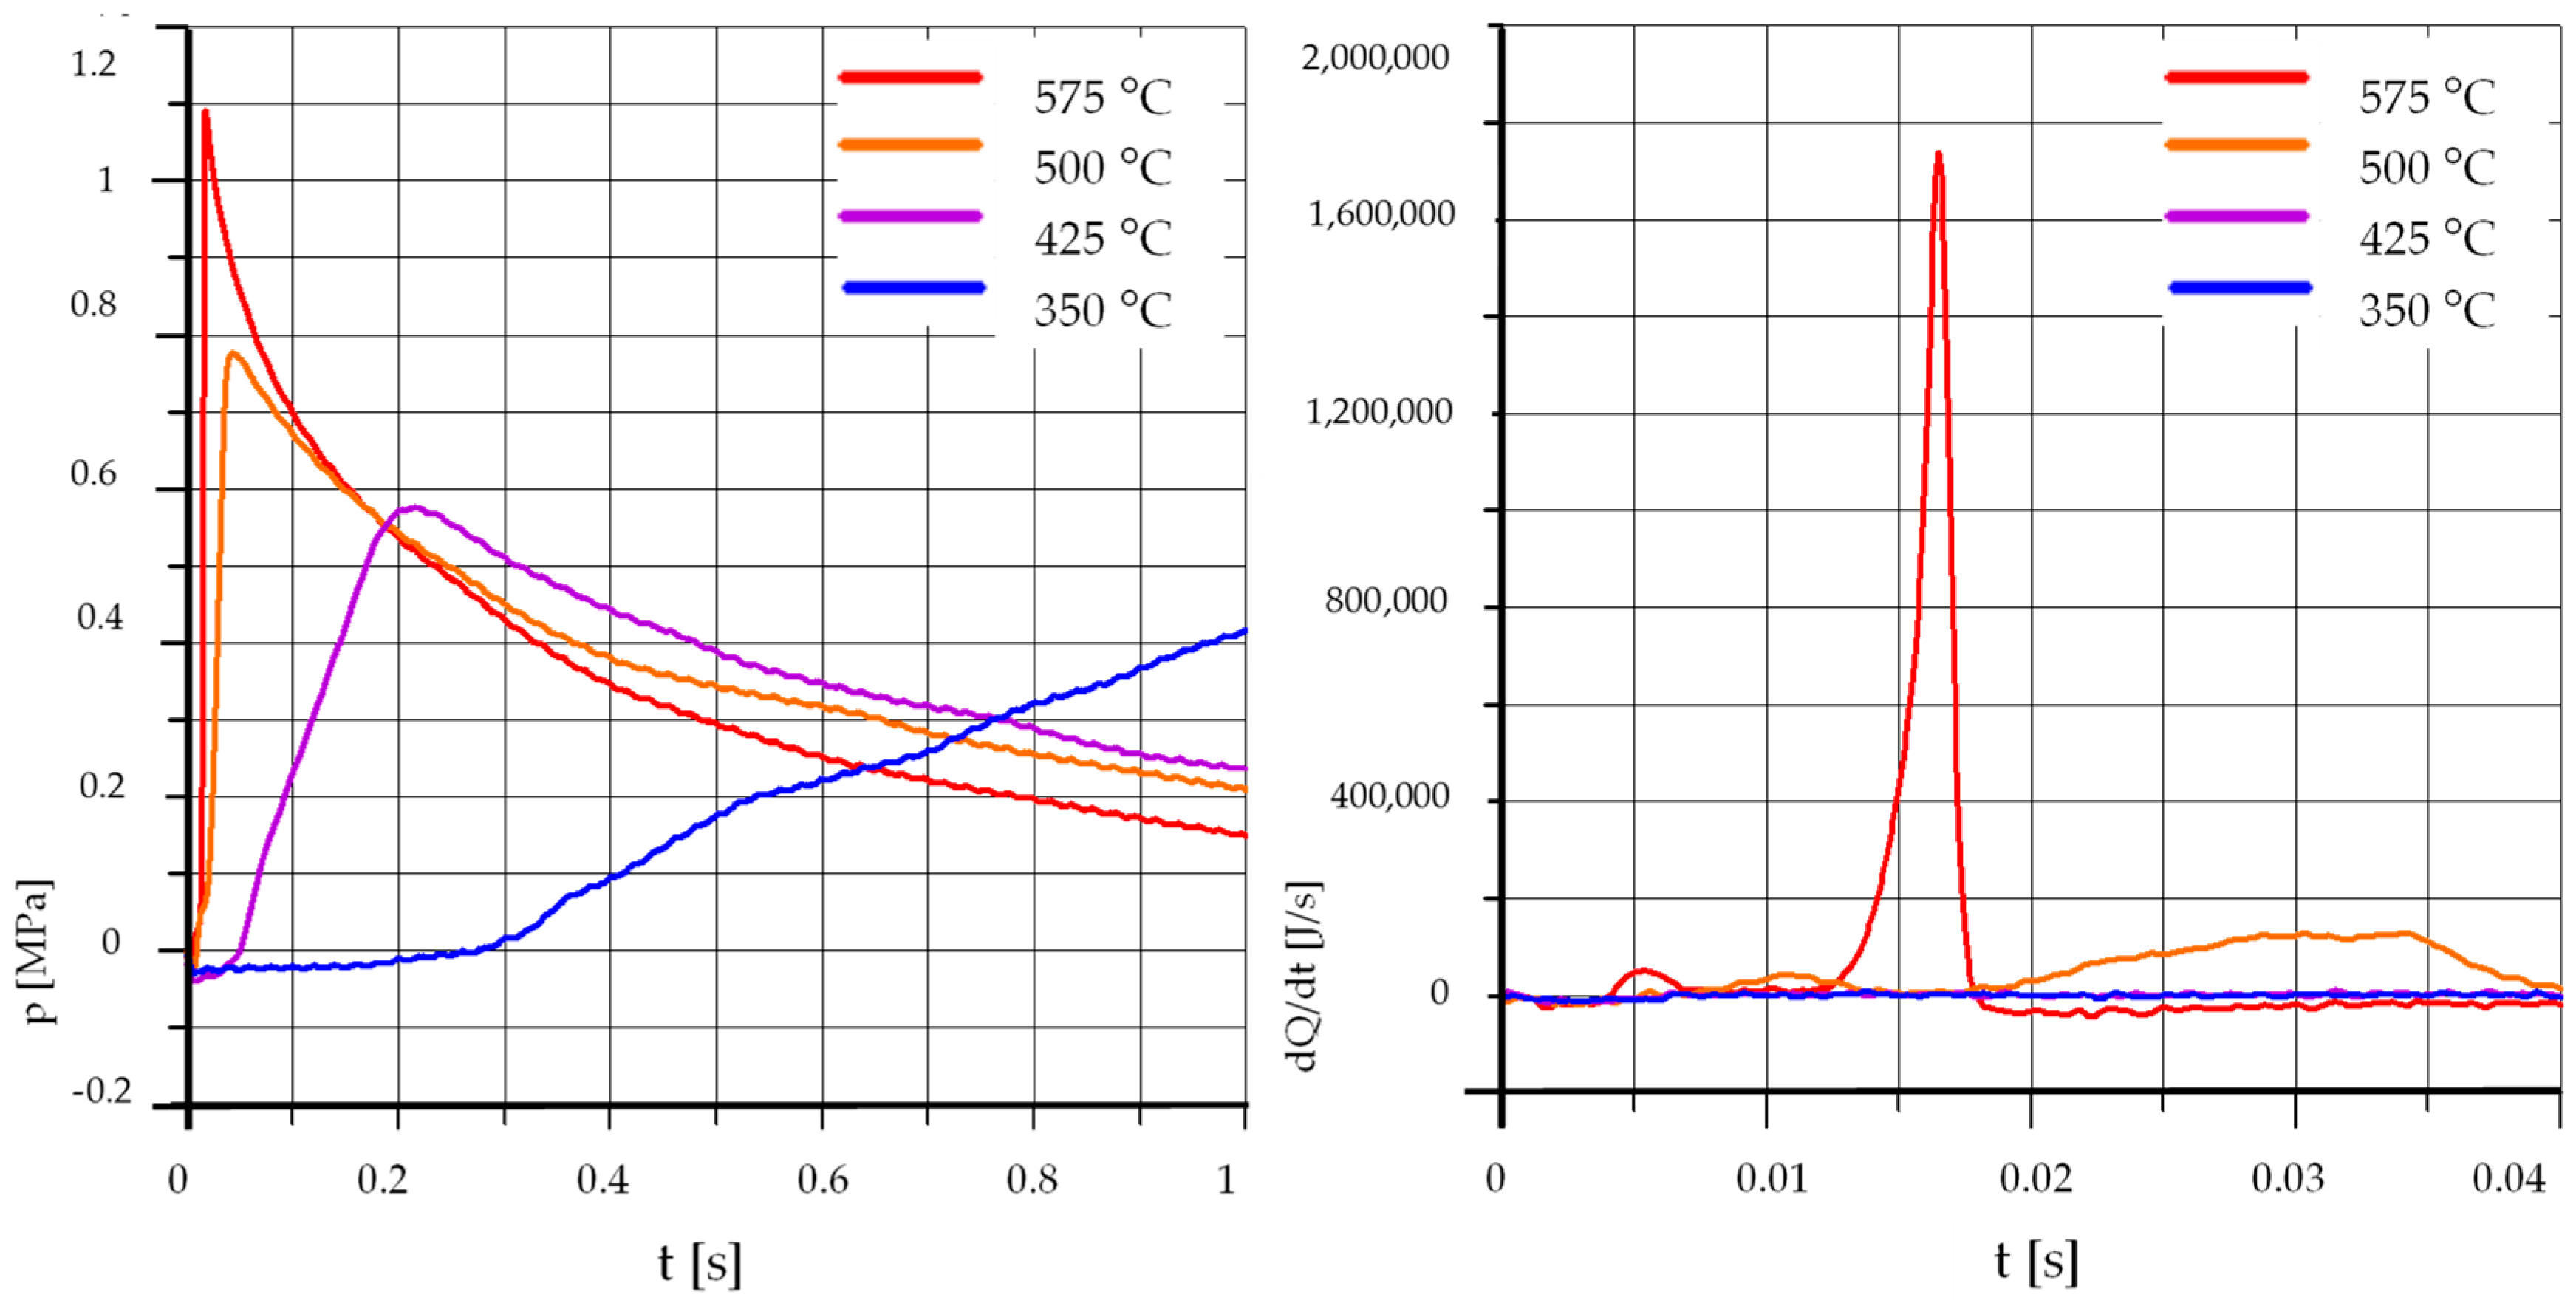
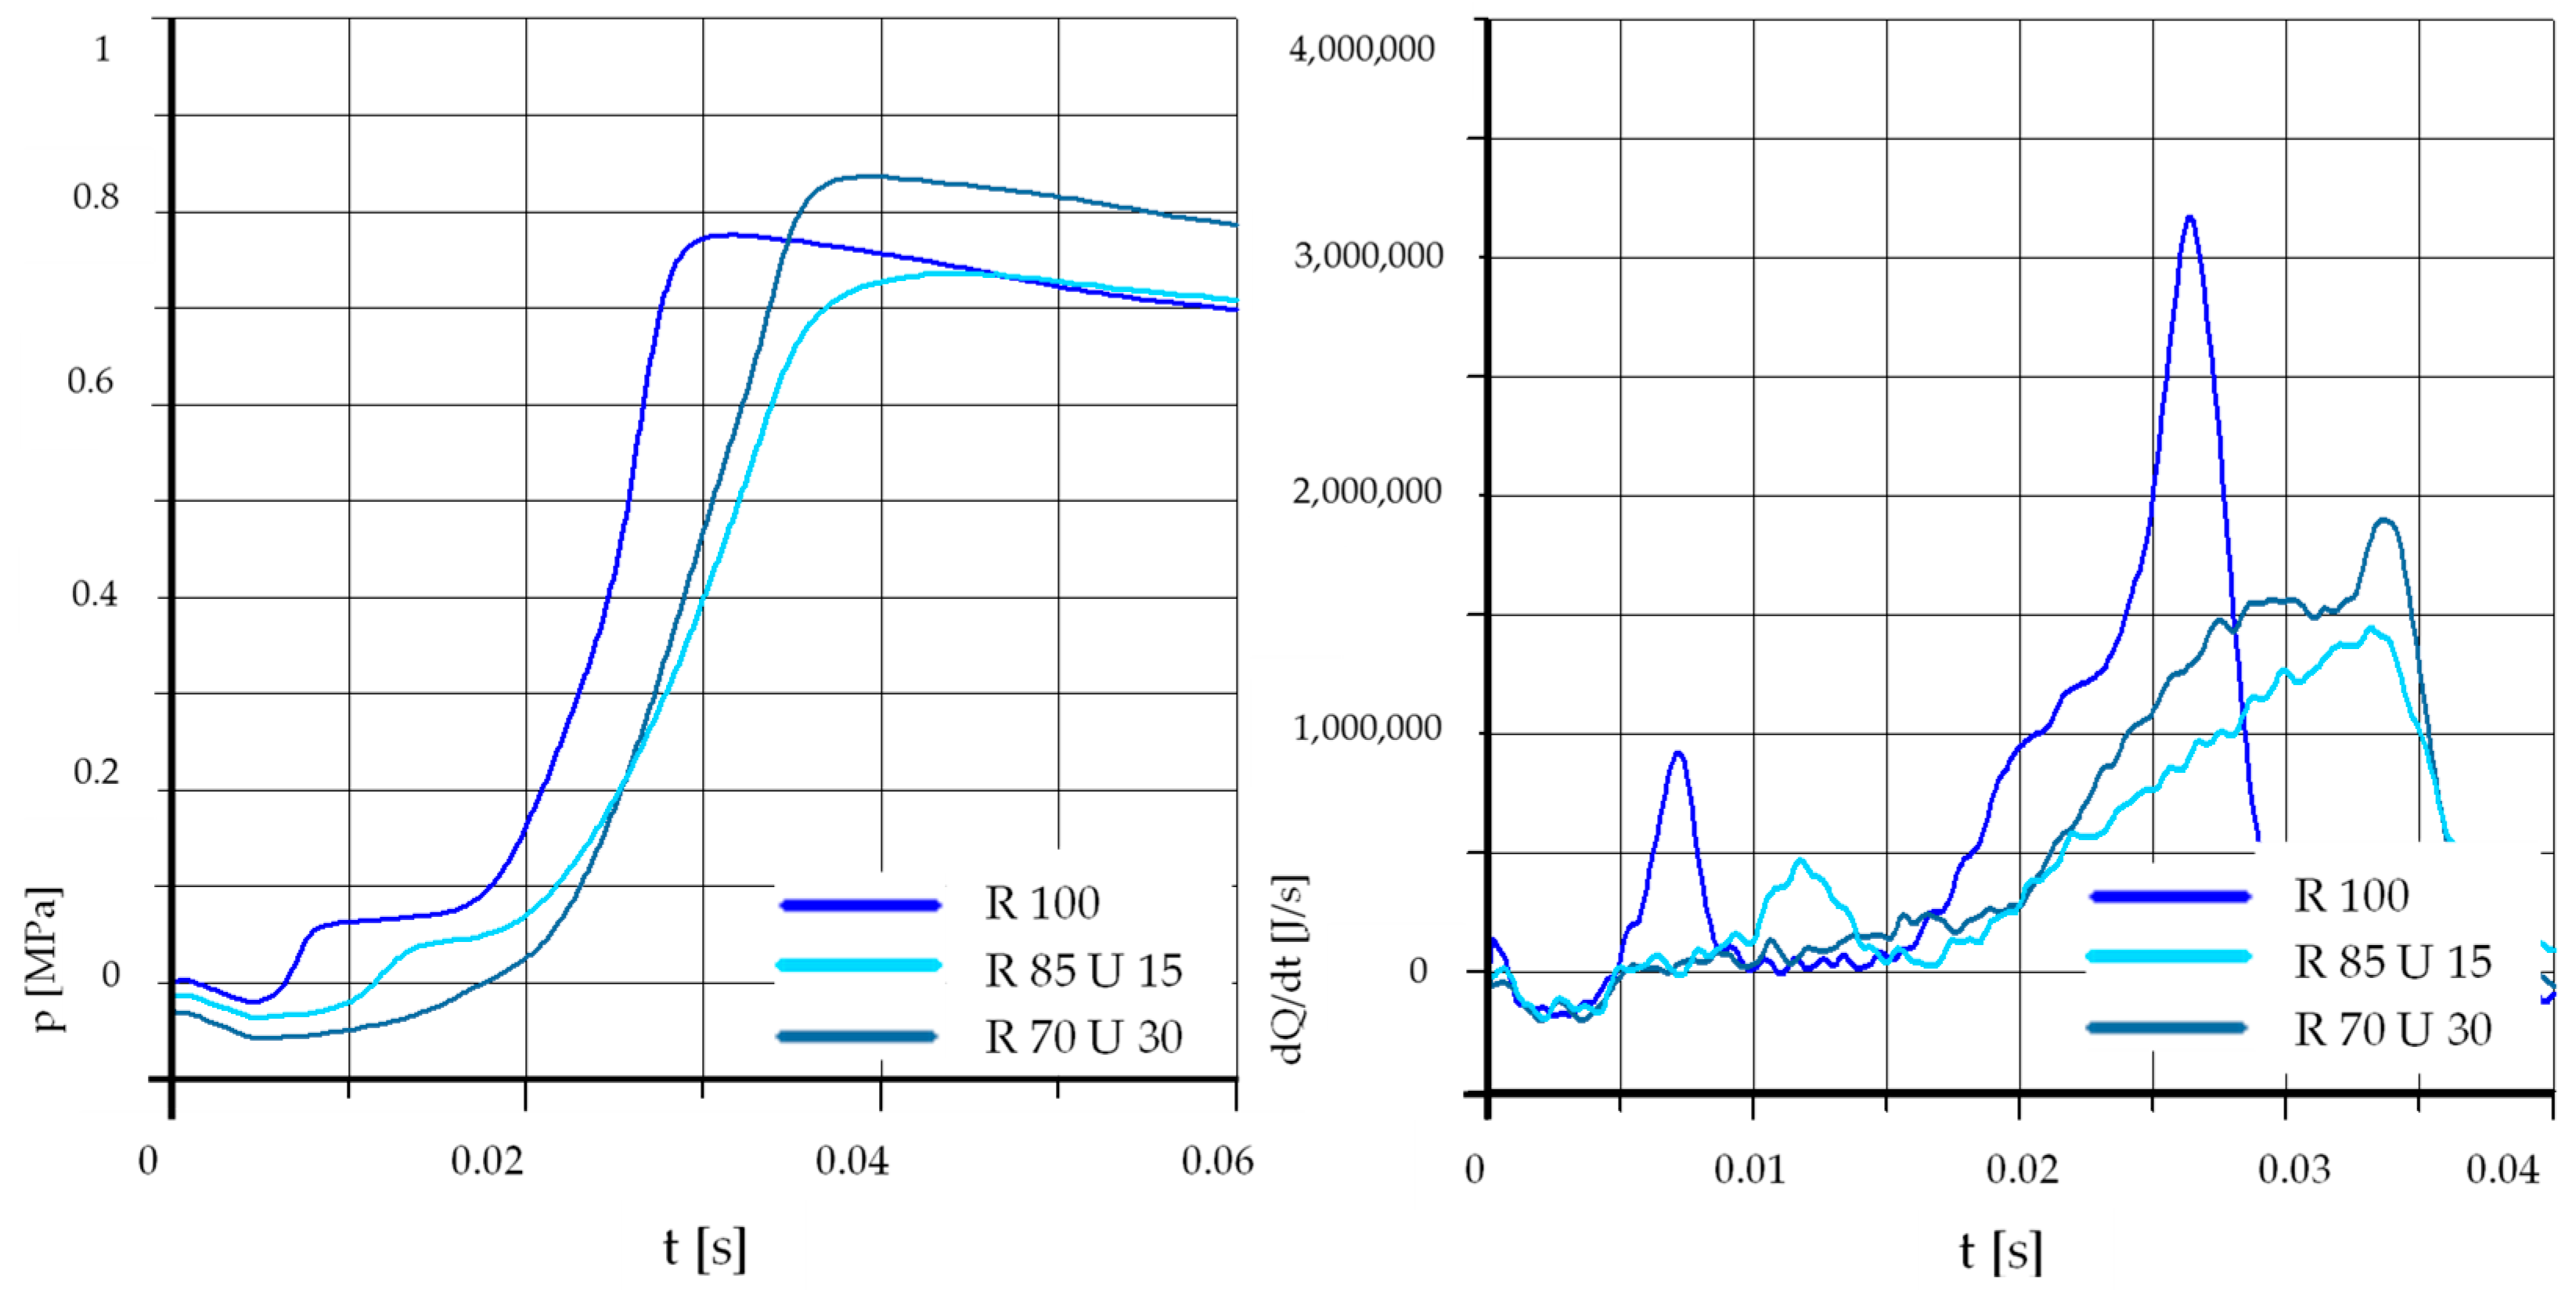
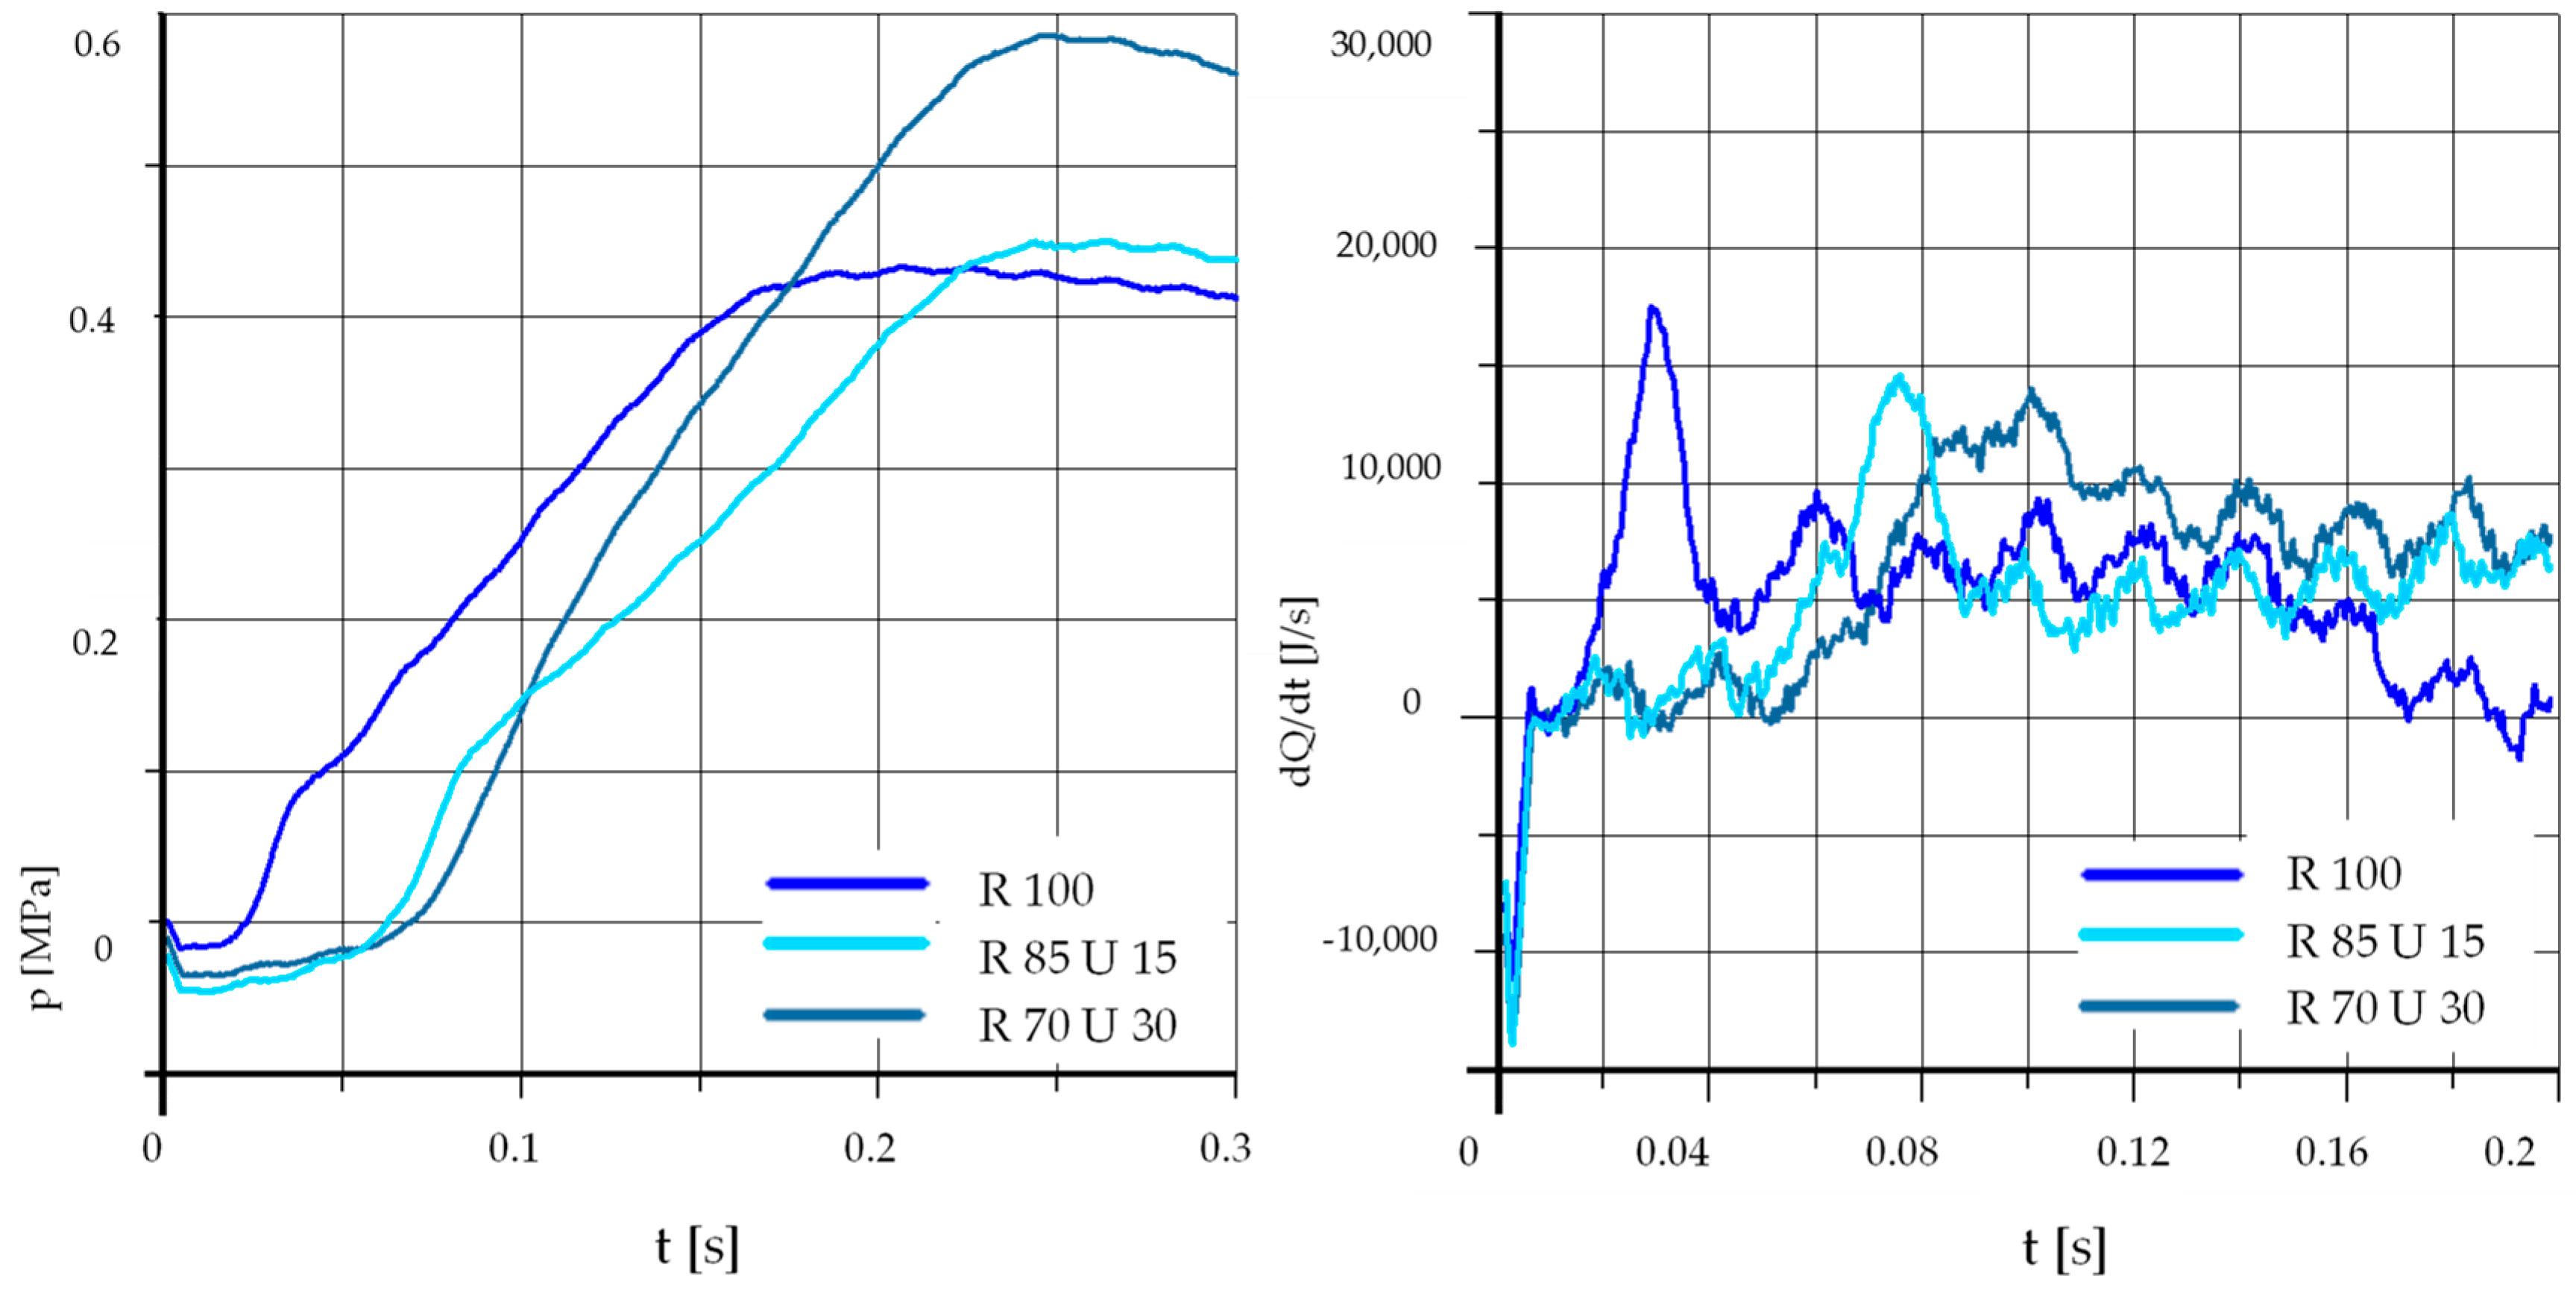
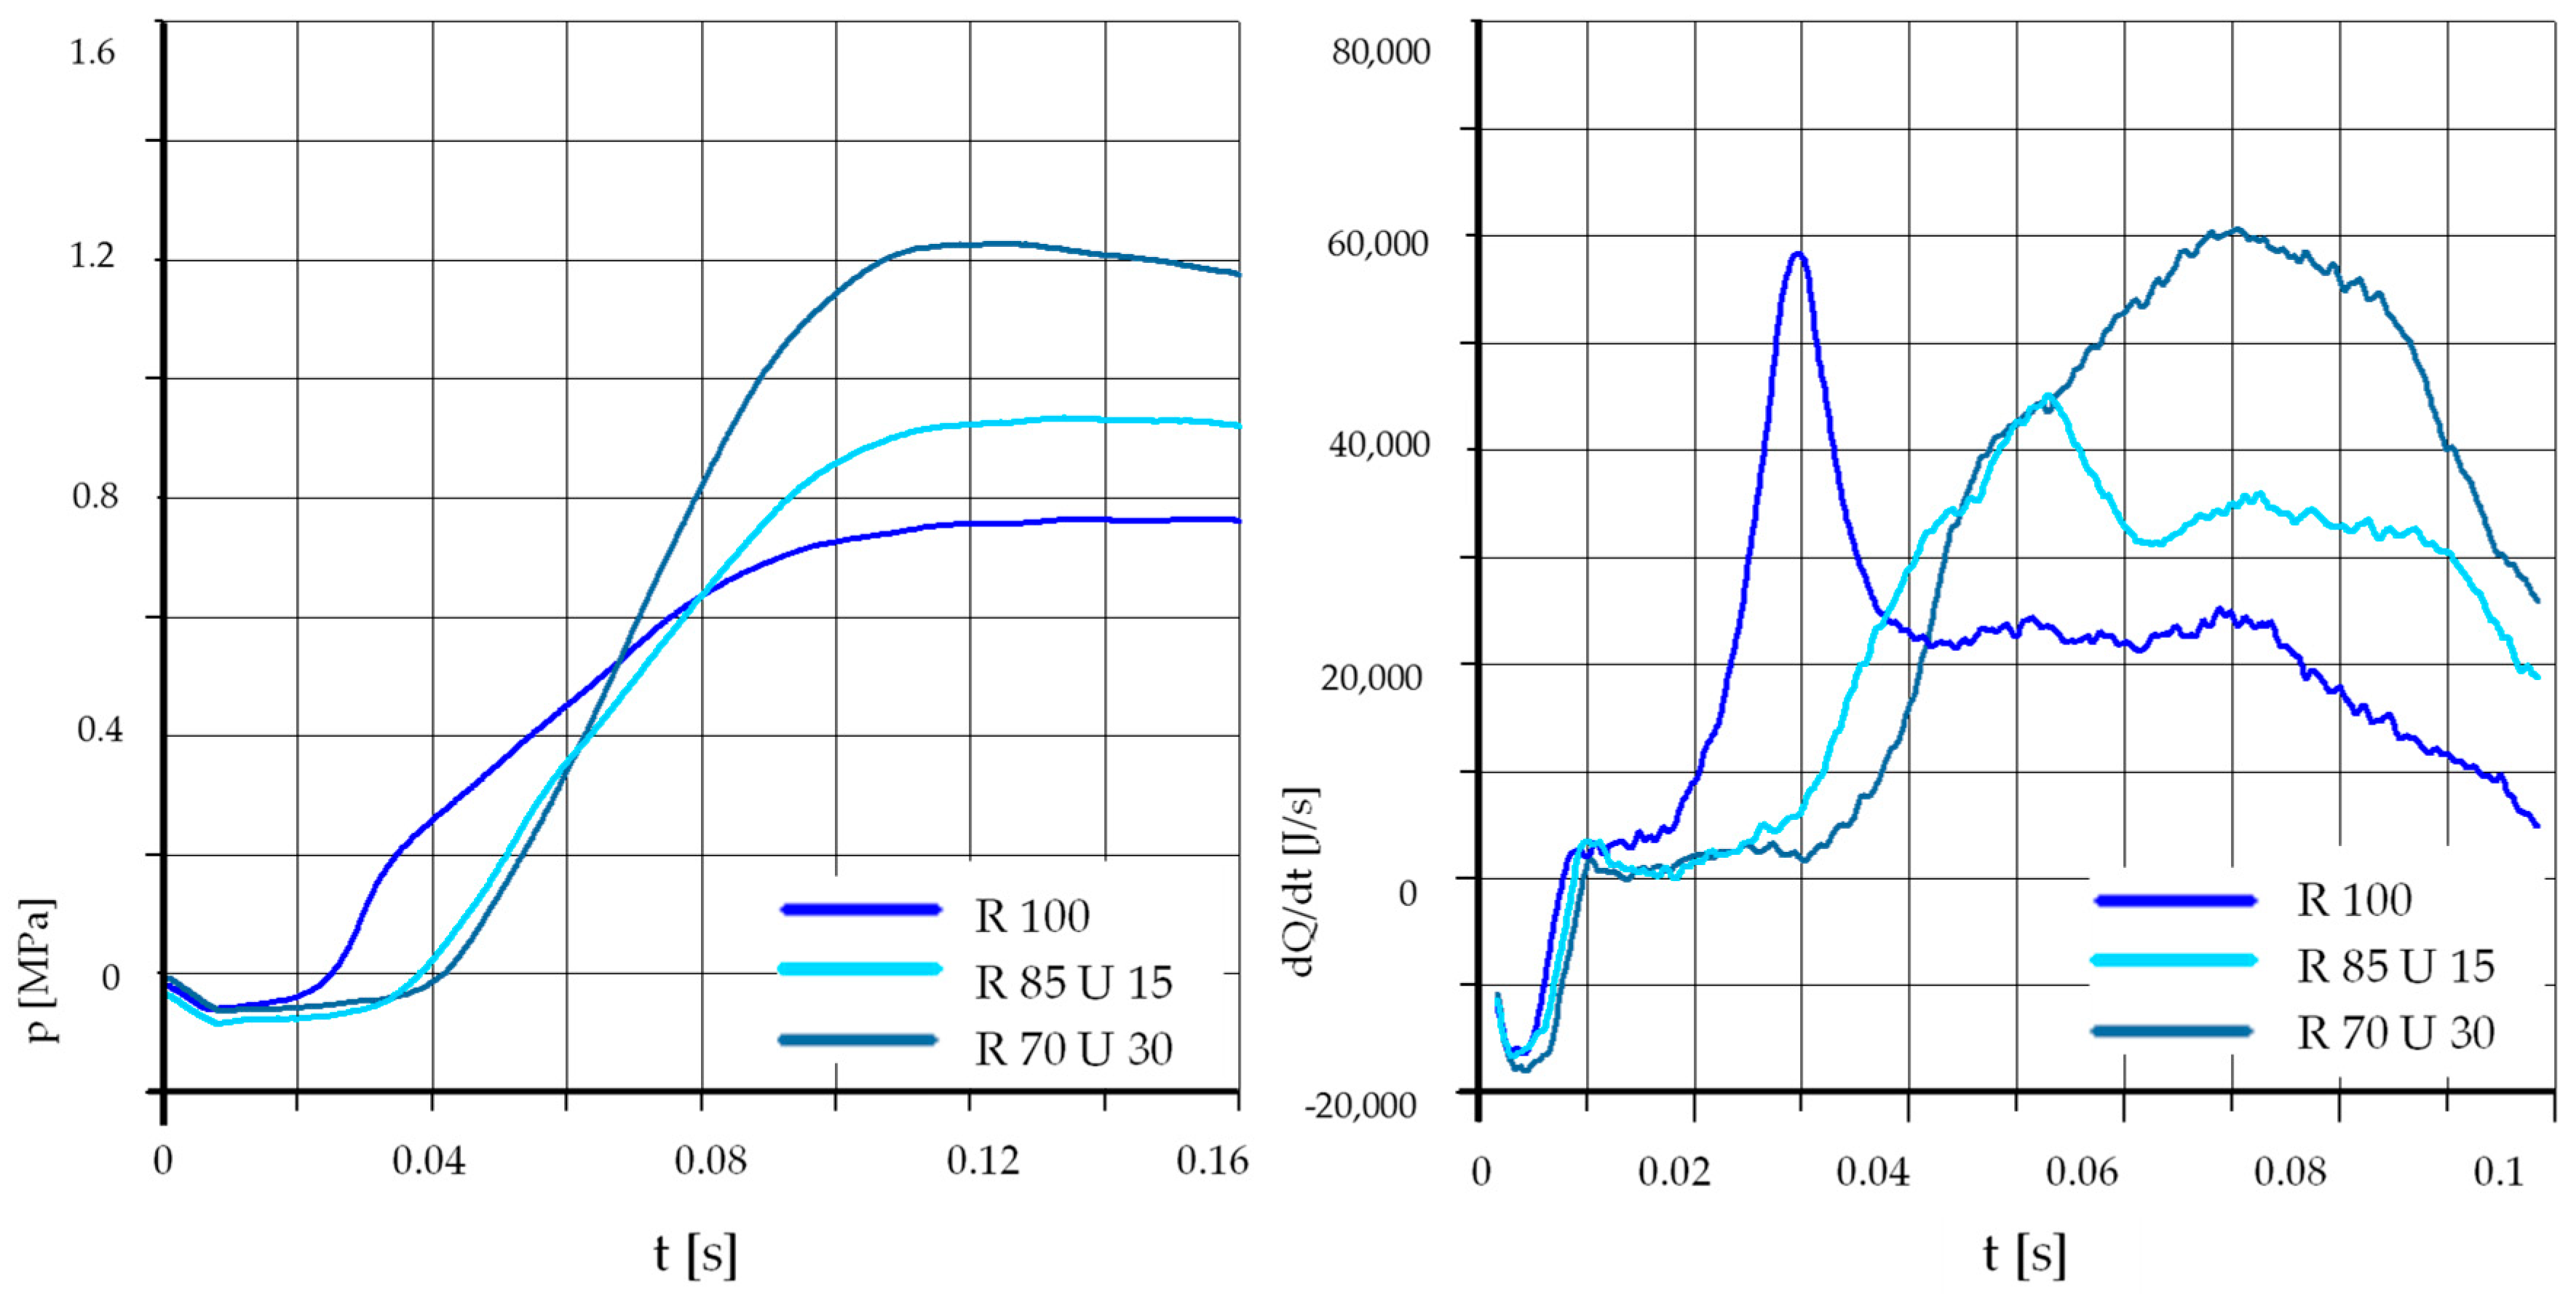
3.1.2. Mixtures of Rapeseed Oil and Unleaded Petrol

Since unleaded petrol has a lower density, higher content of light fractions and higher calorific value than rapeseed oil, it could be expected that the addition of gasoline should result in faster ignition and accelerate fuel combustion. On the other hand, unleaded petrol has a significantly lower cetane number, and thus the addition of unleaded gasoline can cause a longer time of self-ignition delay.
Figure 3 and Figure 4 show the courses of pressure changes and heat release rates when burning rapeseed oil with the addition of 15% and 30% unleaded petrol. For both tested mixtures, the influence of temperature on the process is very strong. Lowering the initial temperature from 575 °C to 500 °C caused a slight delay of self-ignition and a clear reduction in the maximum value of pressure and heat release rate. Further lowering of the initial temperature caused a strong delay in the self-ignition of the mixture and a reduction in the maximum pressure increase. It can be concluded, therefore, that the mixture of rapeseed oil with unleaded petrol was more sensitive to the change of the initial temperature in the combustion chamber than the neat rapeseed oil.

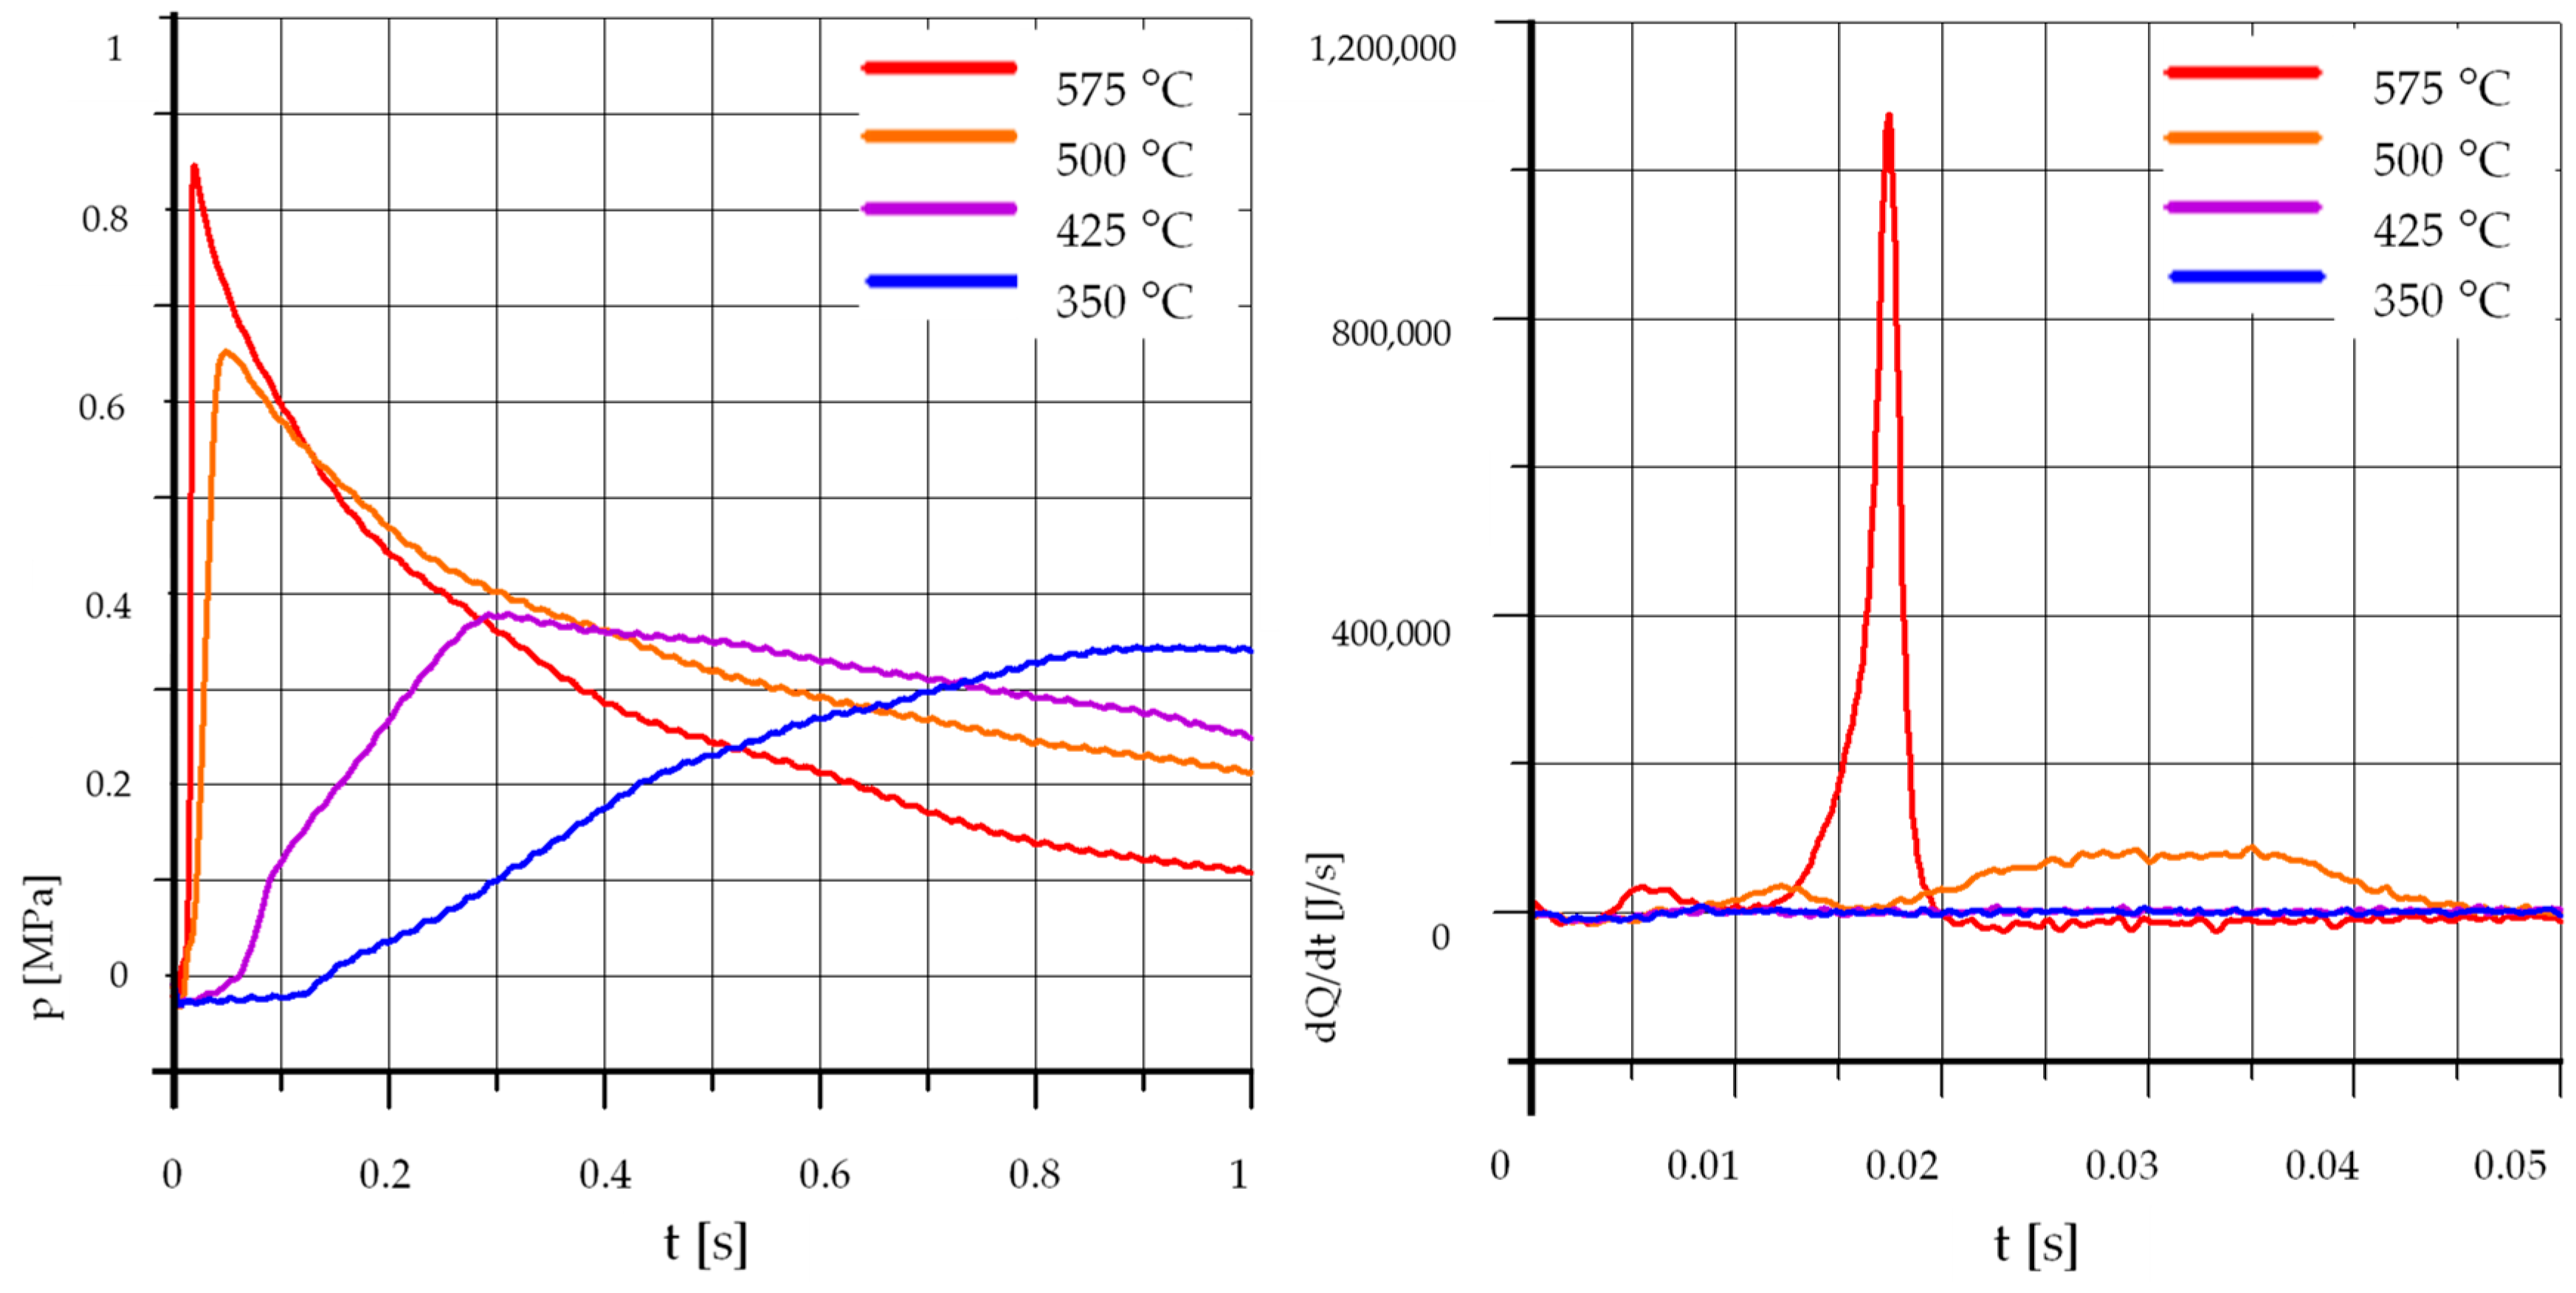
3.1.3. Mixtures of Rapeseed Oil and Ethyl Alcohol

The effect of the addition of ethyl alcohol on the ignition and combustion of rapeseed oil was also examined. Ethyl alcohol, compared to rapeseed oil, has a lower density and lower calorific value. Thus, the addition of alcohol may result in faster ignition and accelerate fuel combustion but may lower the maximum pressure in the combustion chamber. Ethyl alcohol also has a much lower cetane number, thus it may cause an increase in the self-ignition delay time.
Figure 5 and Figure 6 show the course of pressure changes and heat release rates when burning rapeseed oil with the addition of 15% and 30% ethyl alcohol. As in the case of mixtures with unleaded petrol, for both tested mixtures the influence of temperature on the process was very strong. The tests were carried out at temperatures of 500 °C, 425 °C, and 350 °C. The reduction of the initial temperature from 500 °C to 425 °C caused a very strong extension of the self-ignition delay time and a clear reduction in the maximum value of pressure increase and heat release rate. A further lowering of the initial temperature caused further strong delays in the self-ignition of the mixture and a reduction in the maximum pressure. Consequently, it can be concluded that the mixture of rapeseed oil and ethyl alcohol was sensitive to the initial temperature in the combustion chamber.

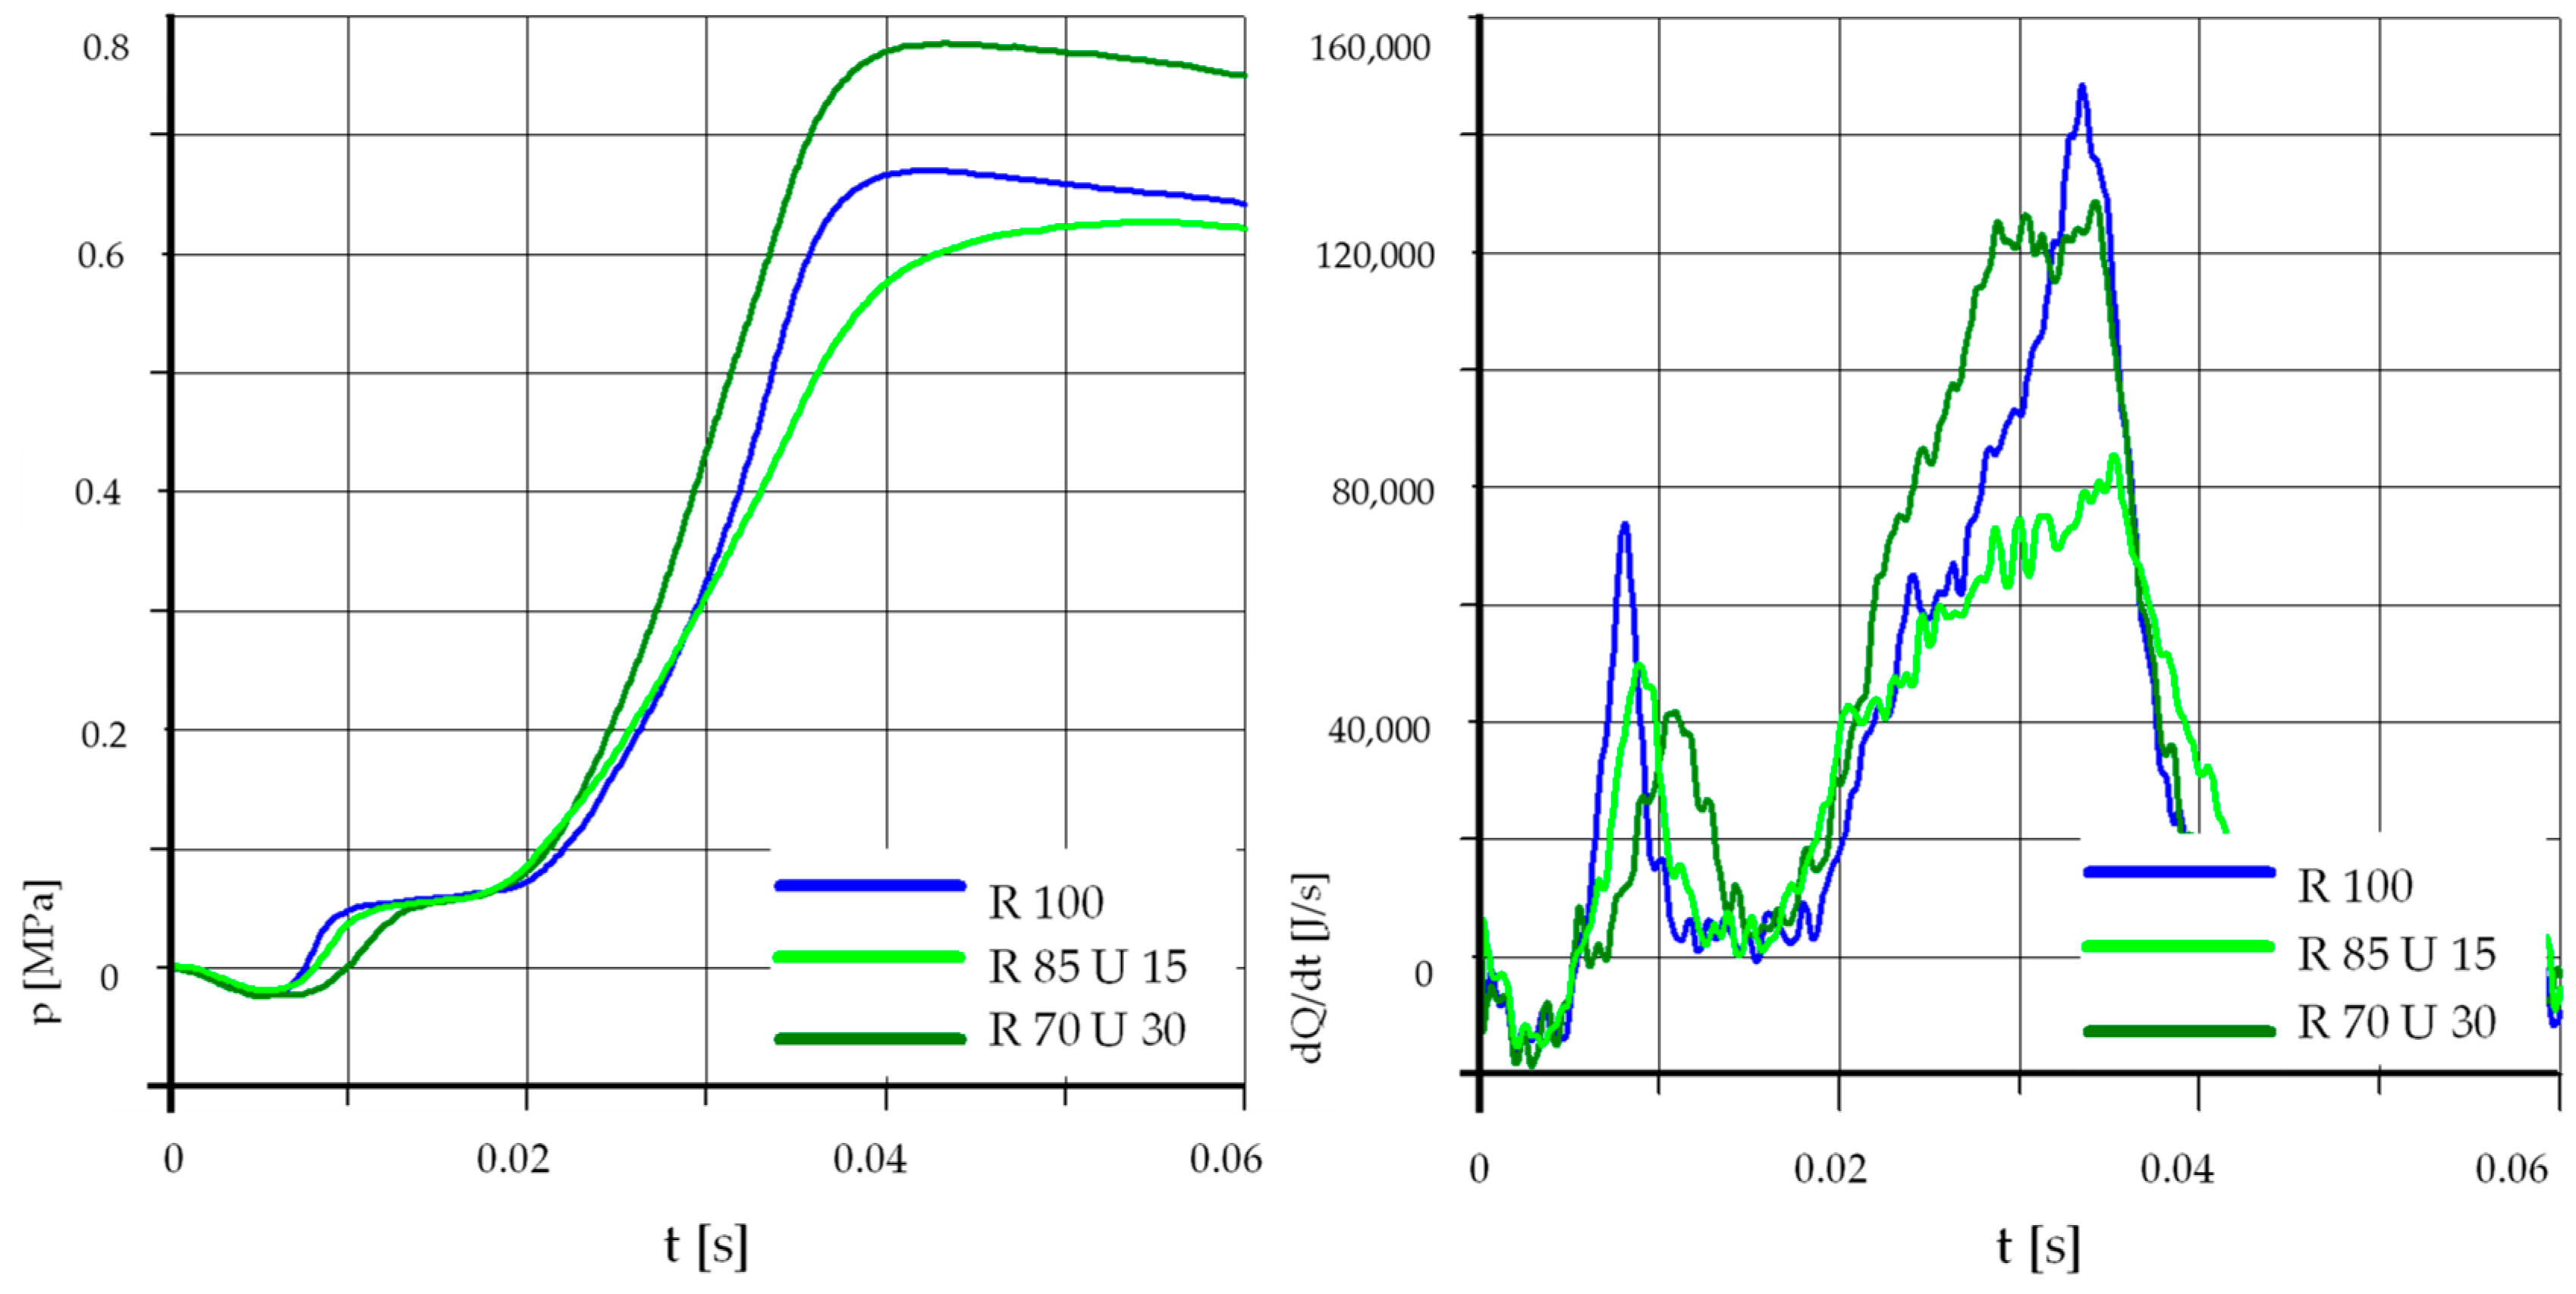
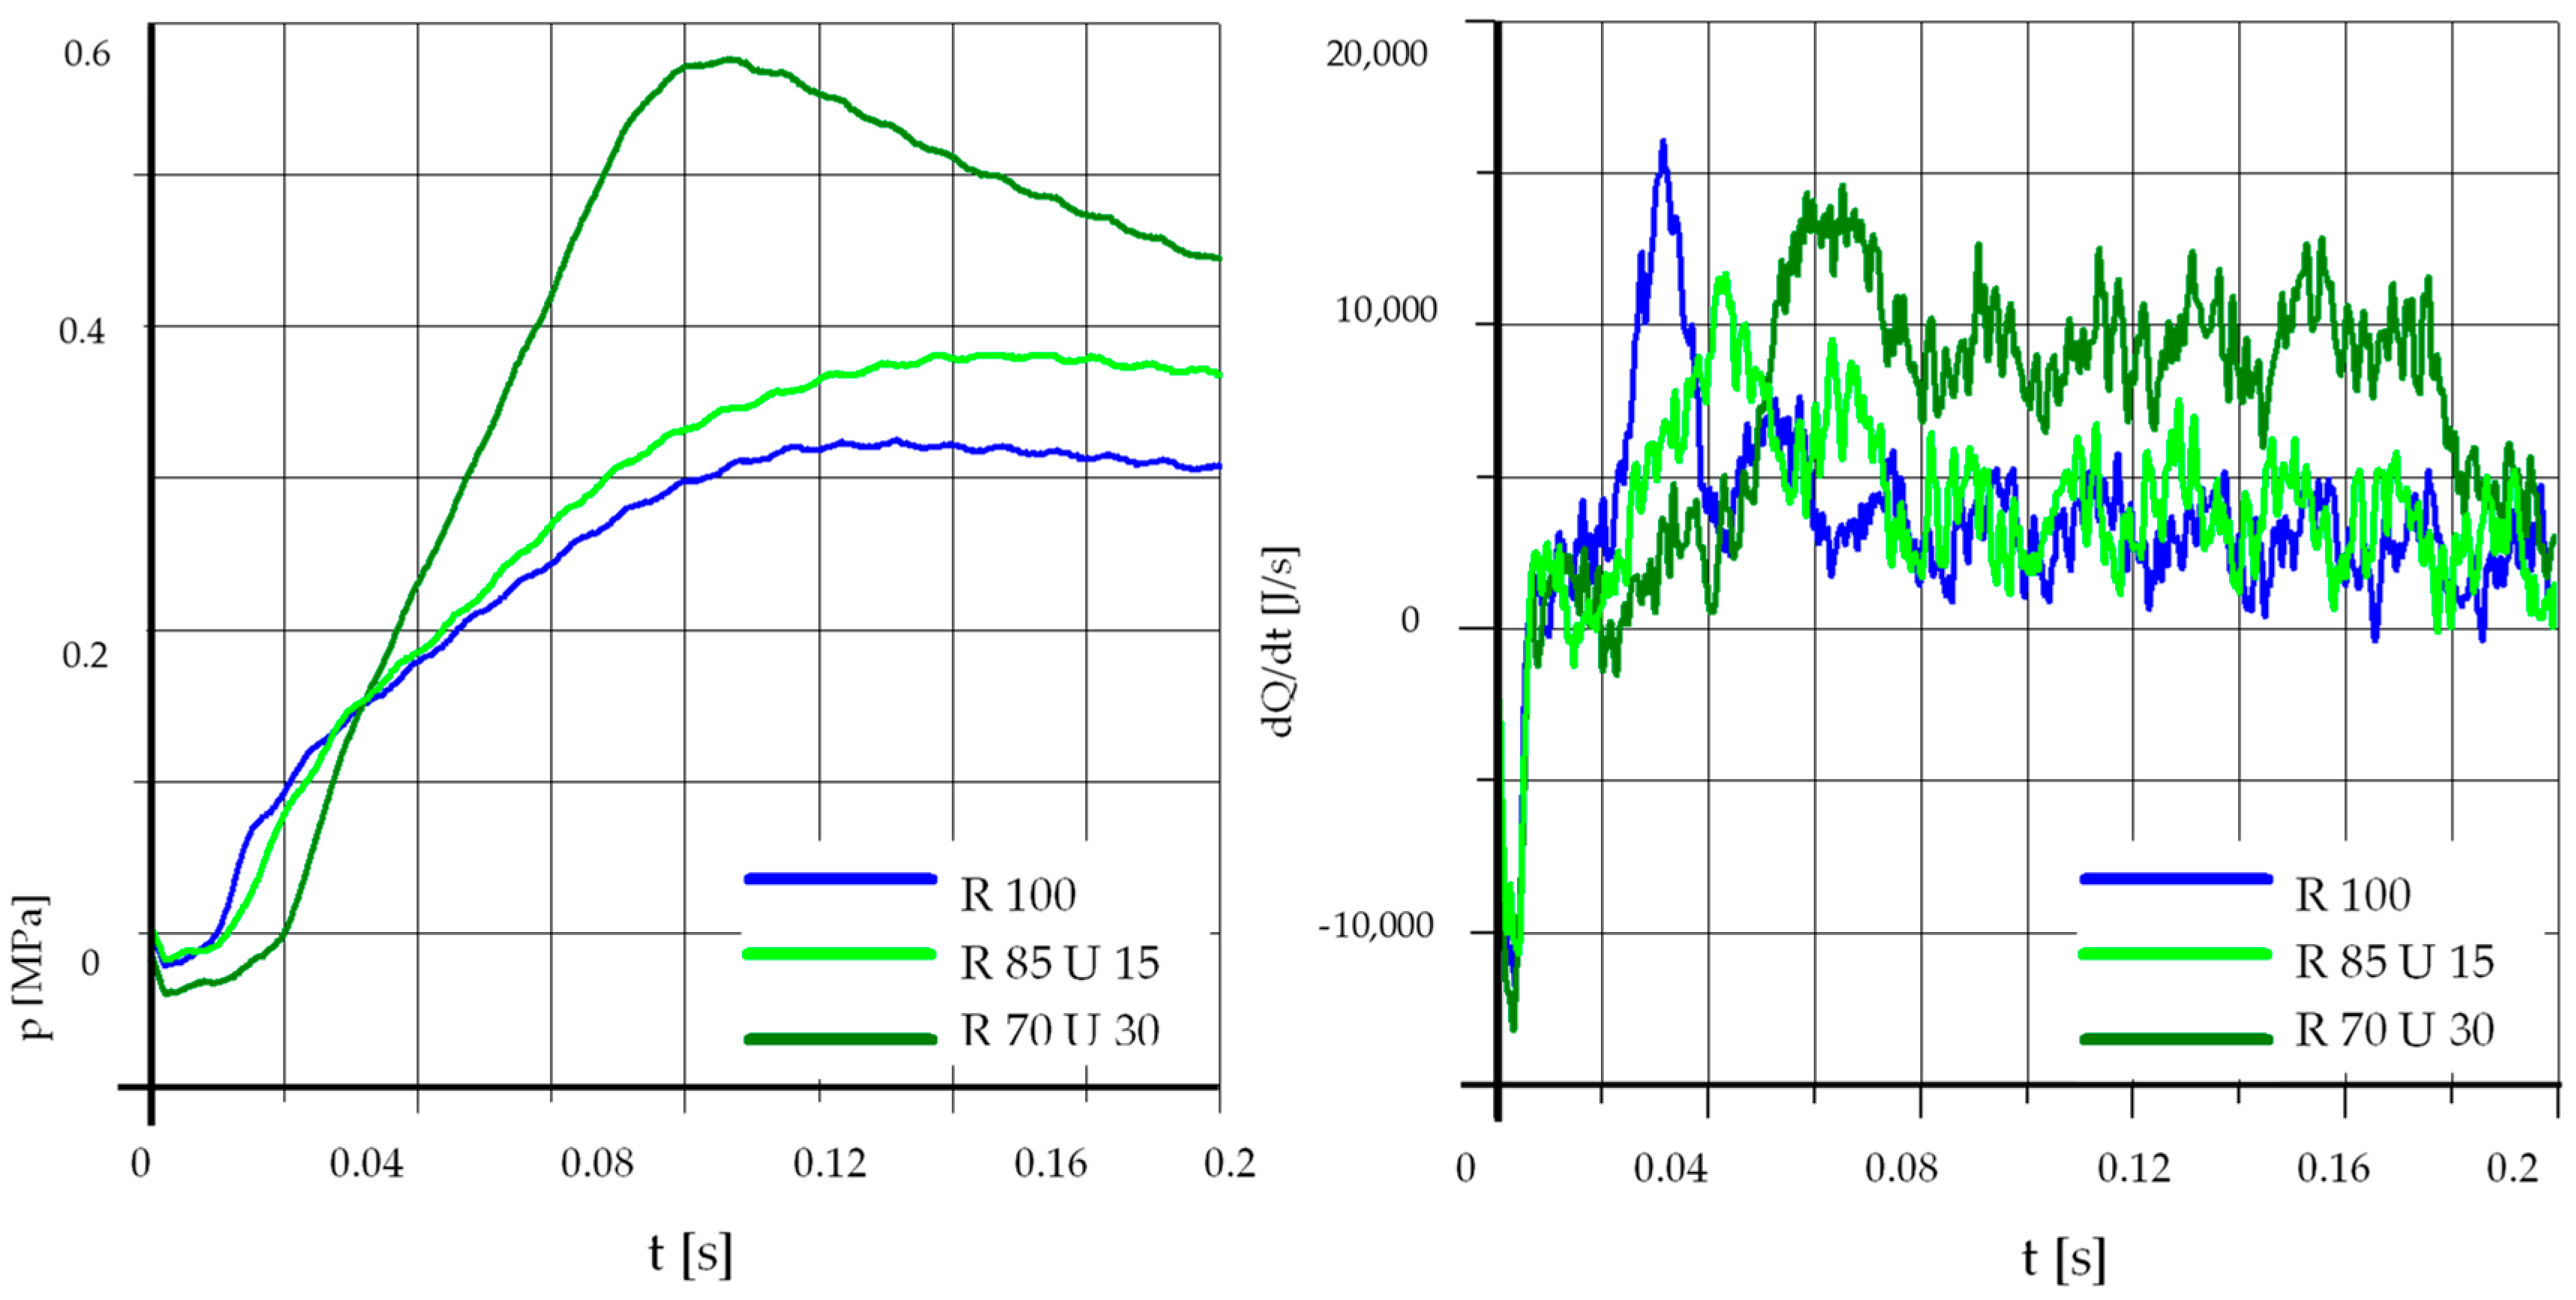
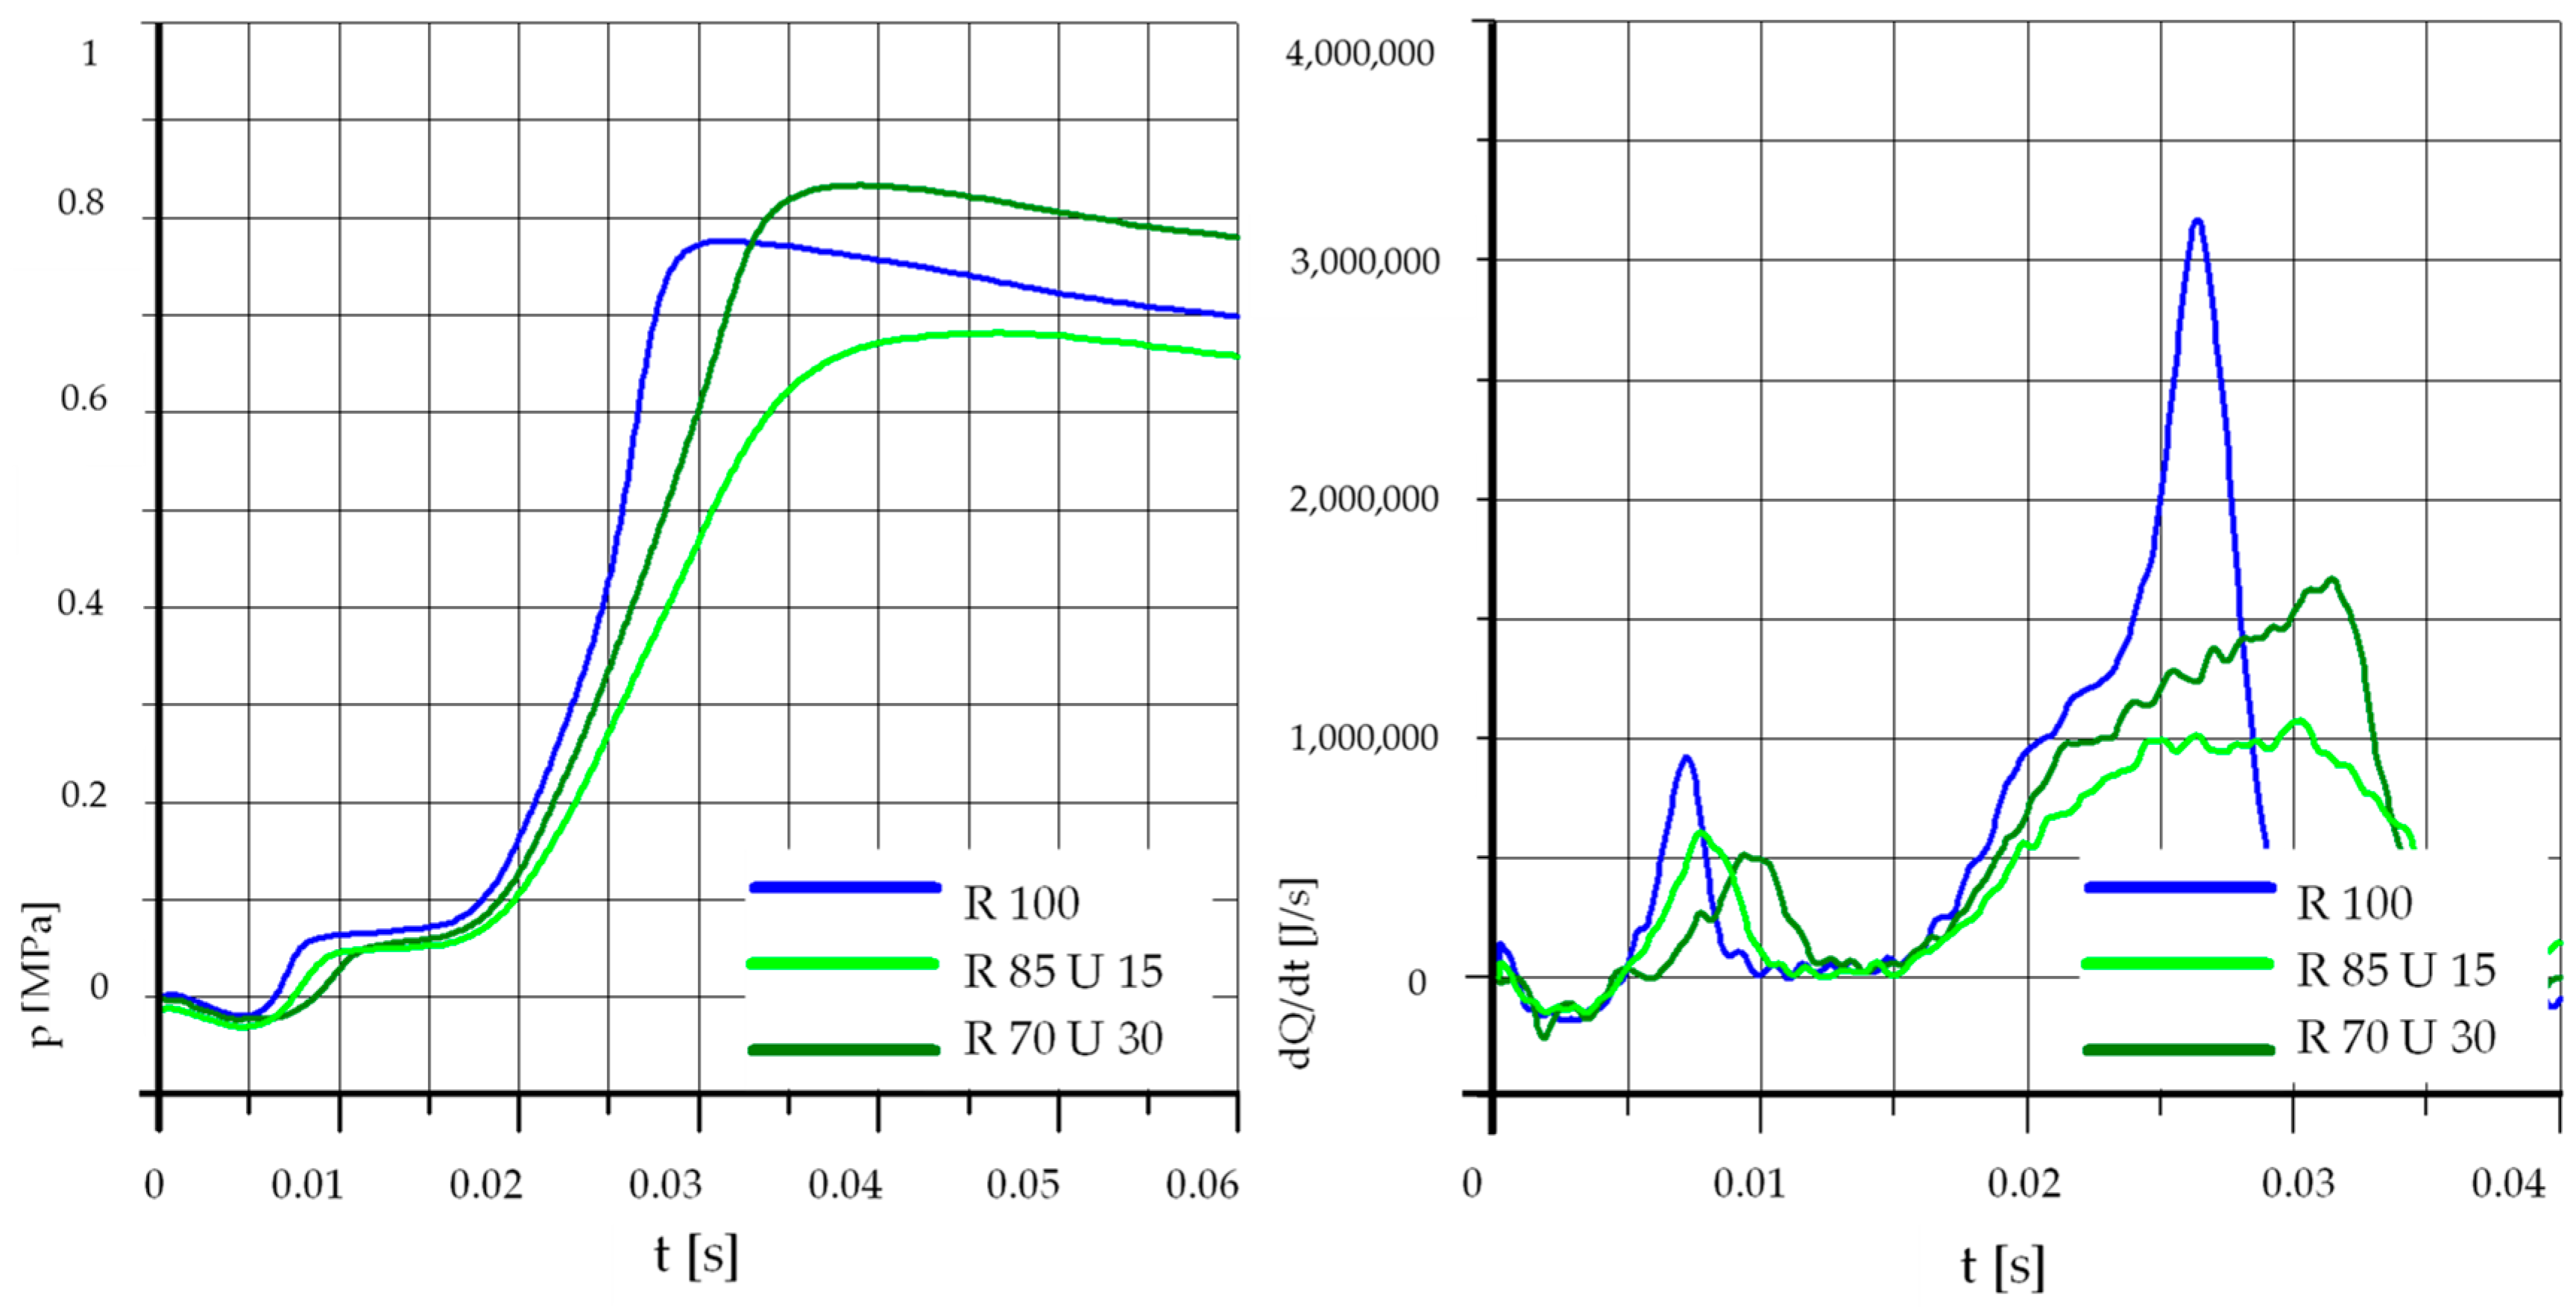
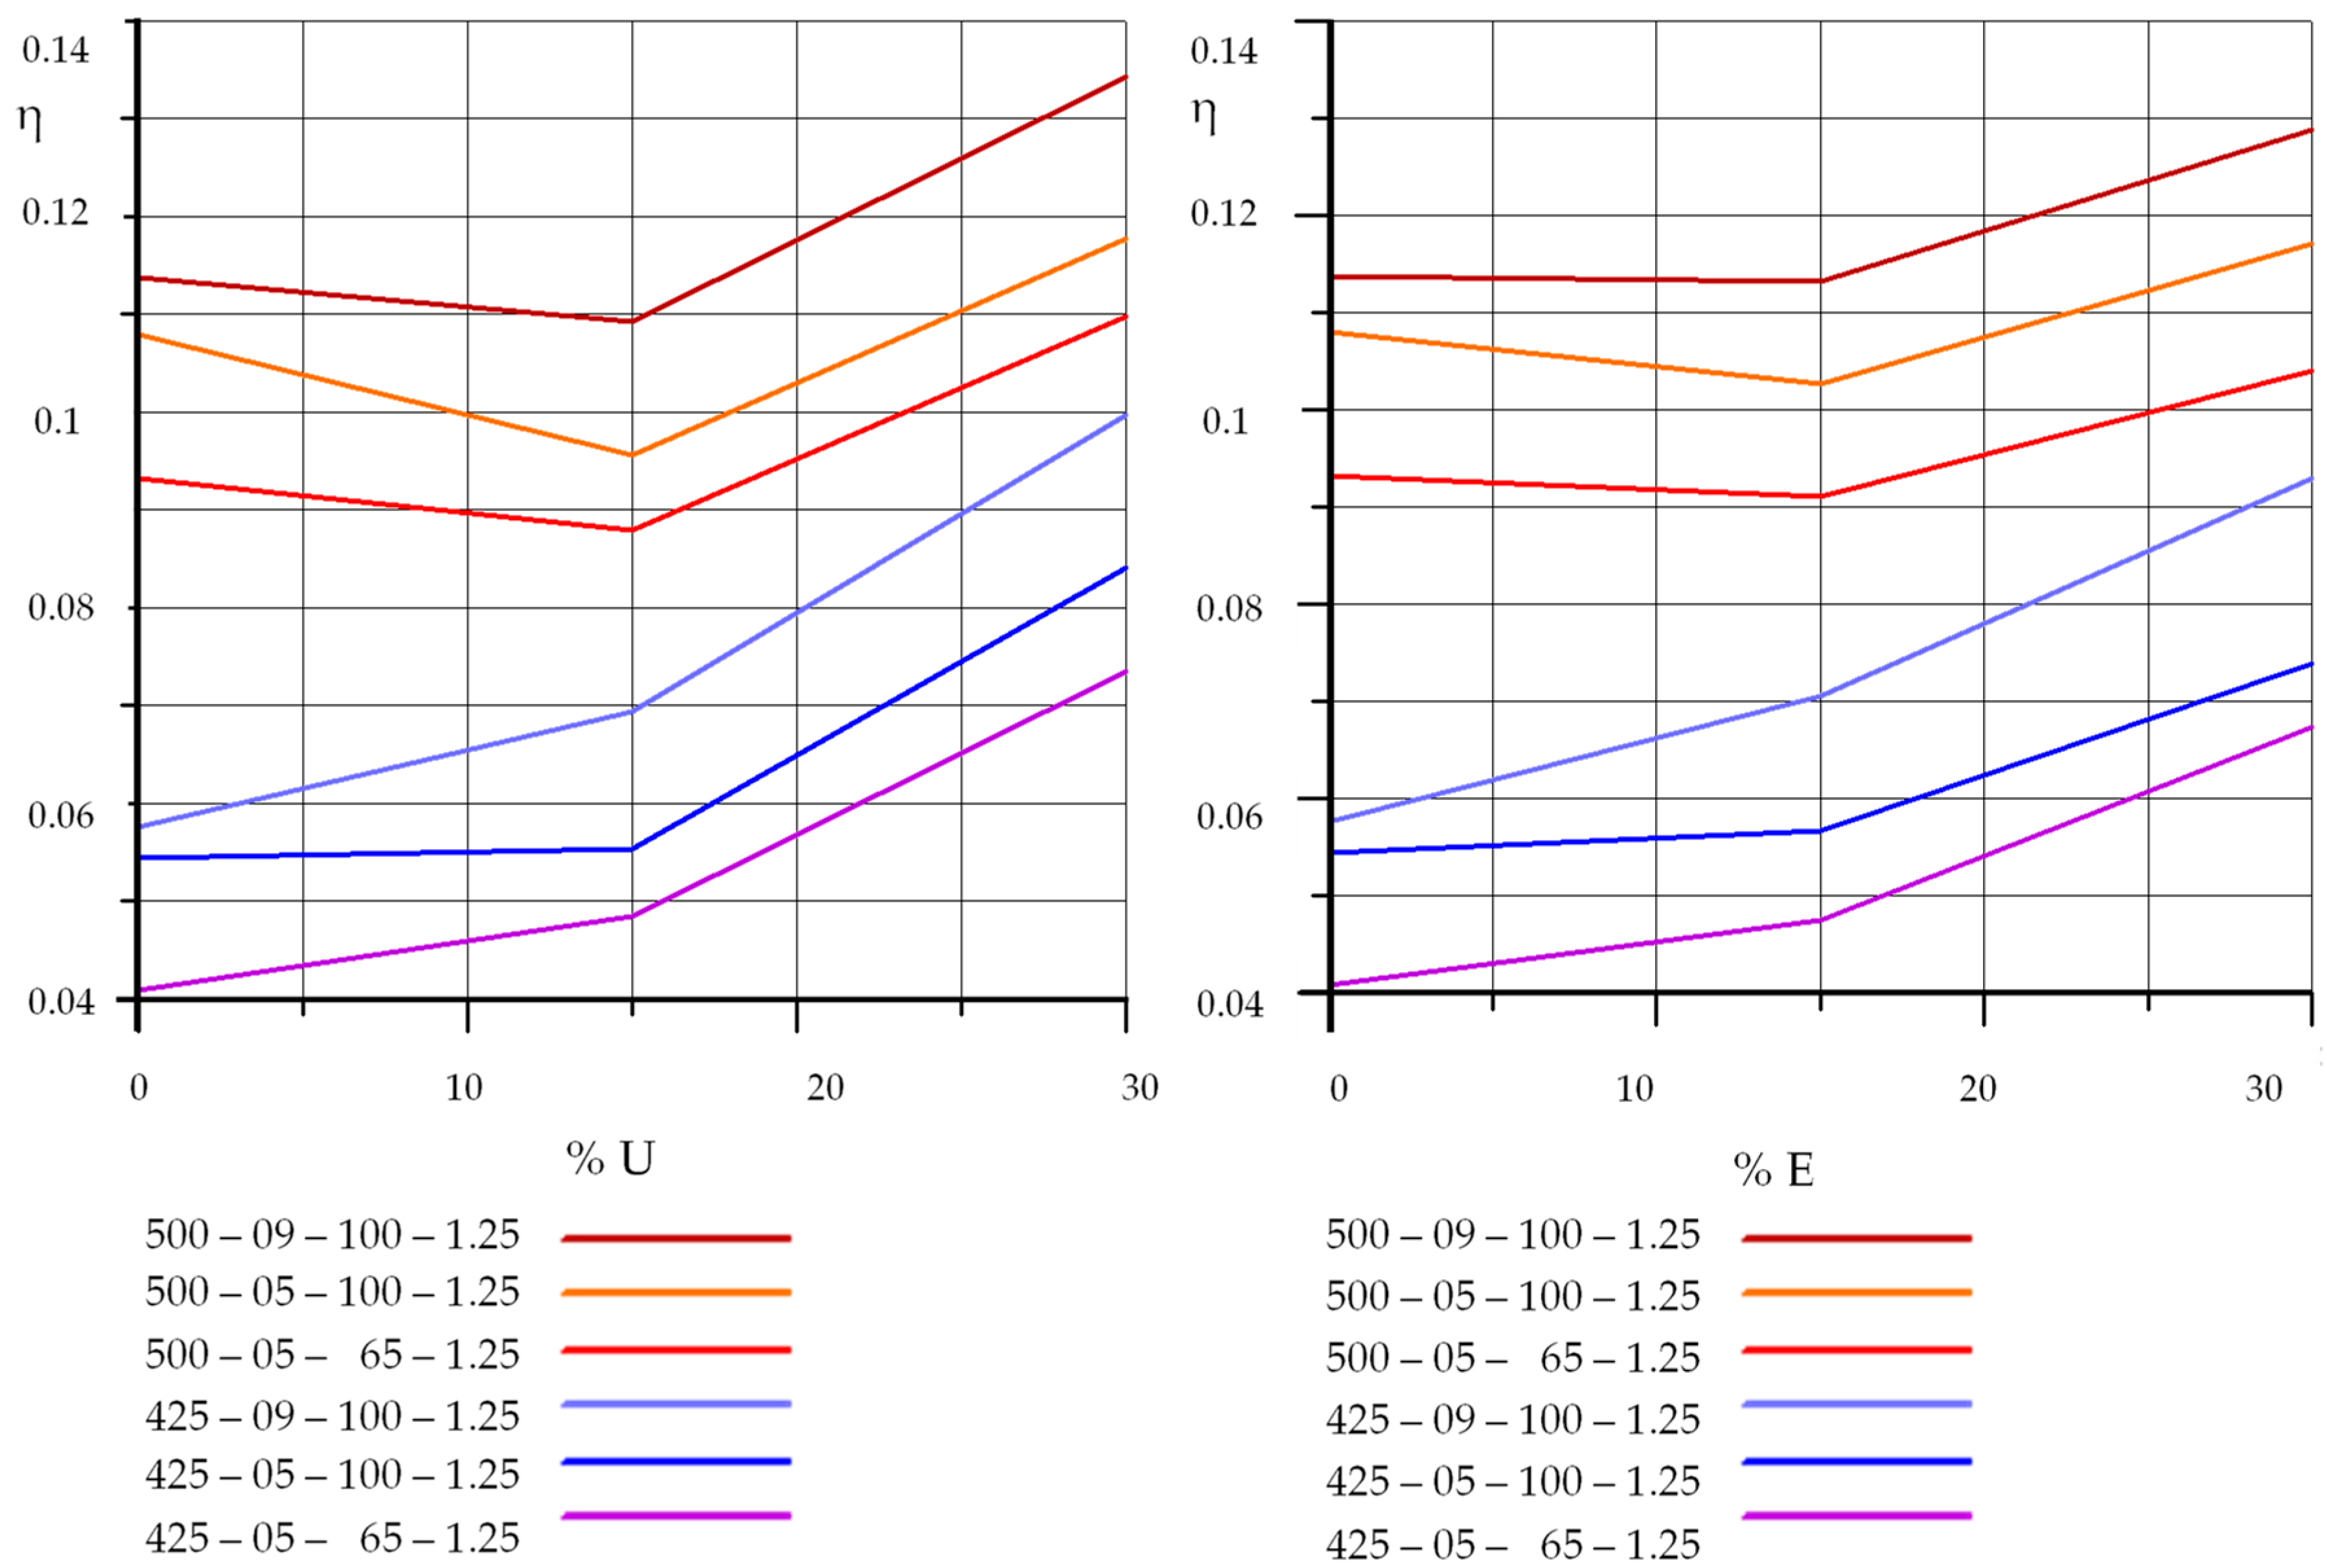
3.2. The Effect of Fuel Composition

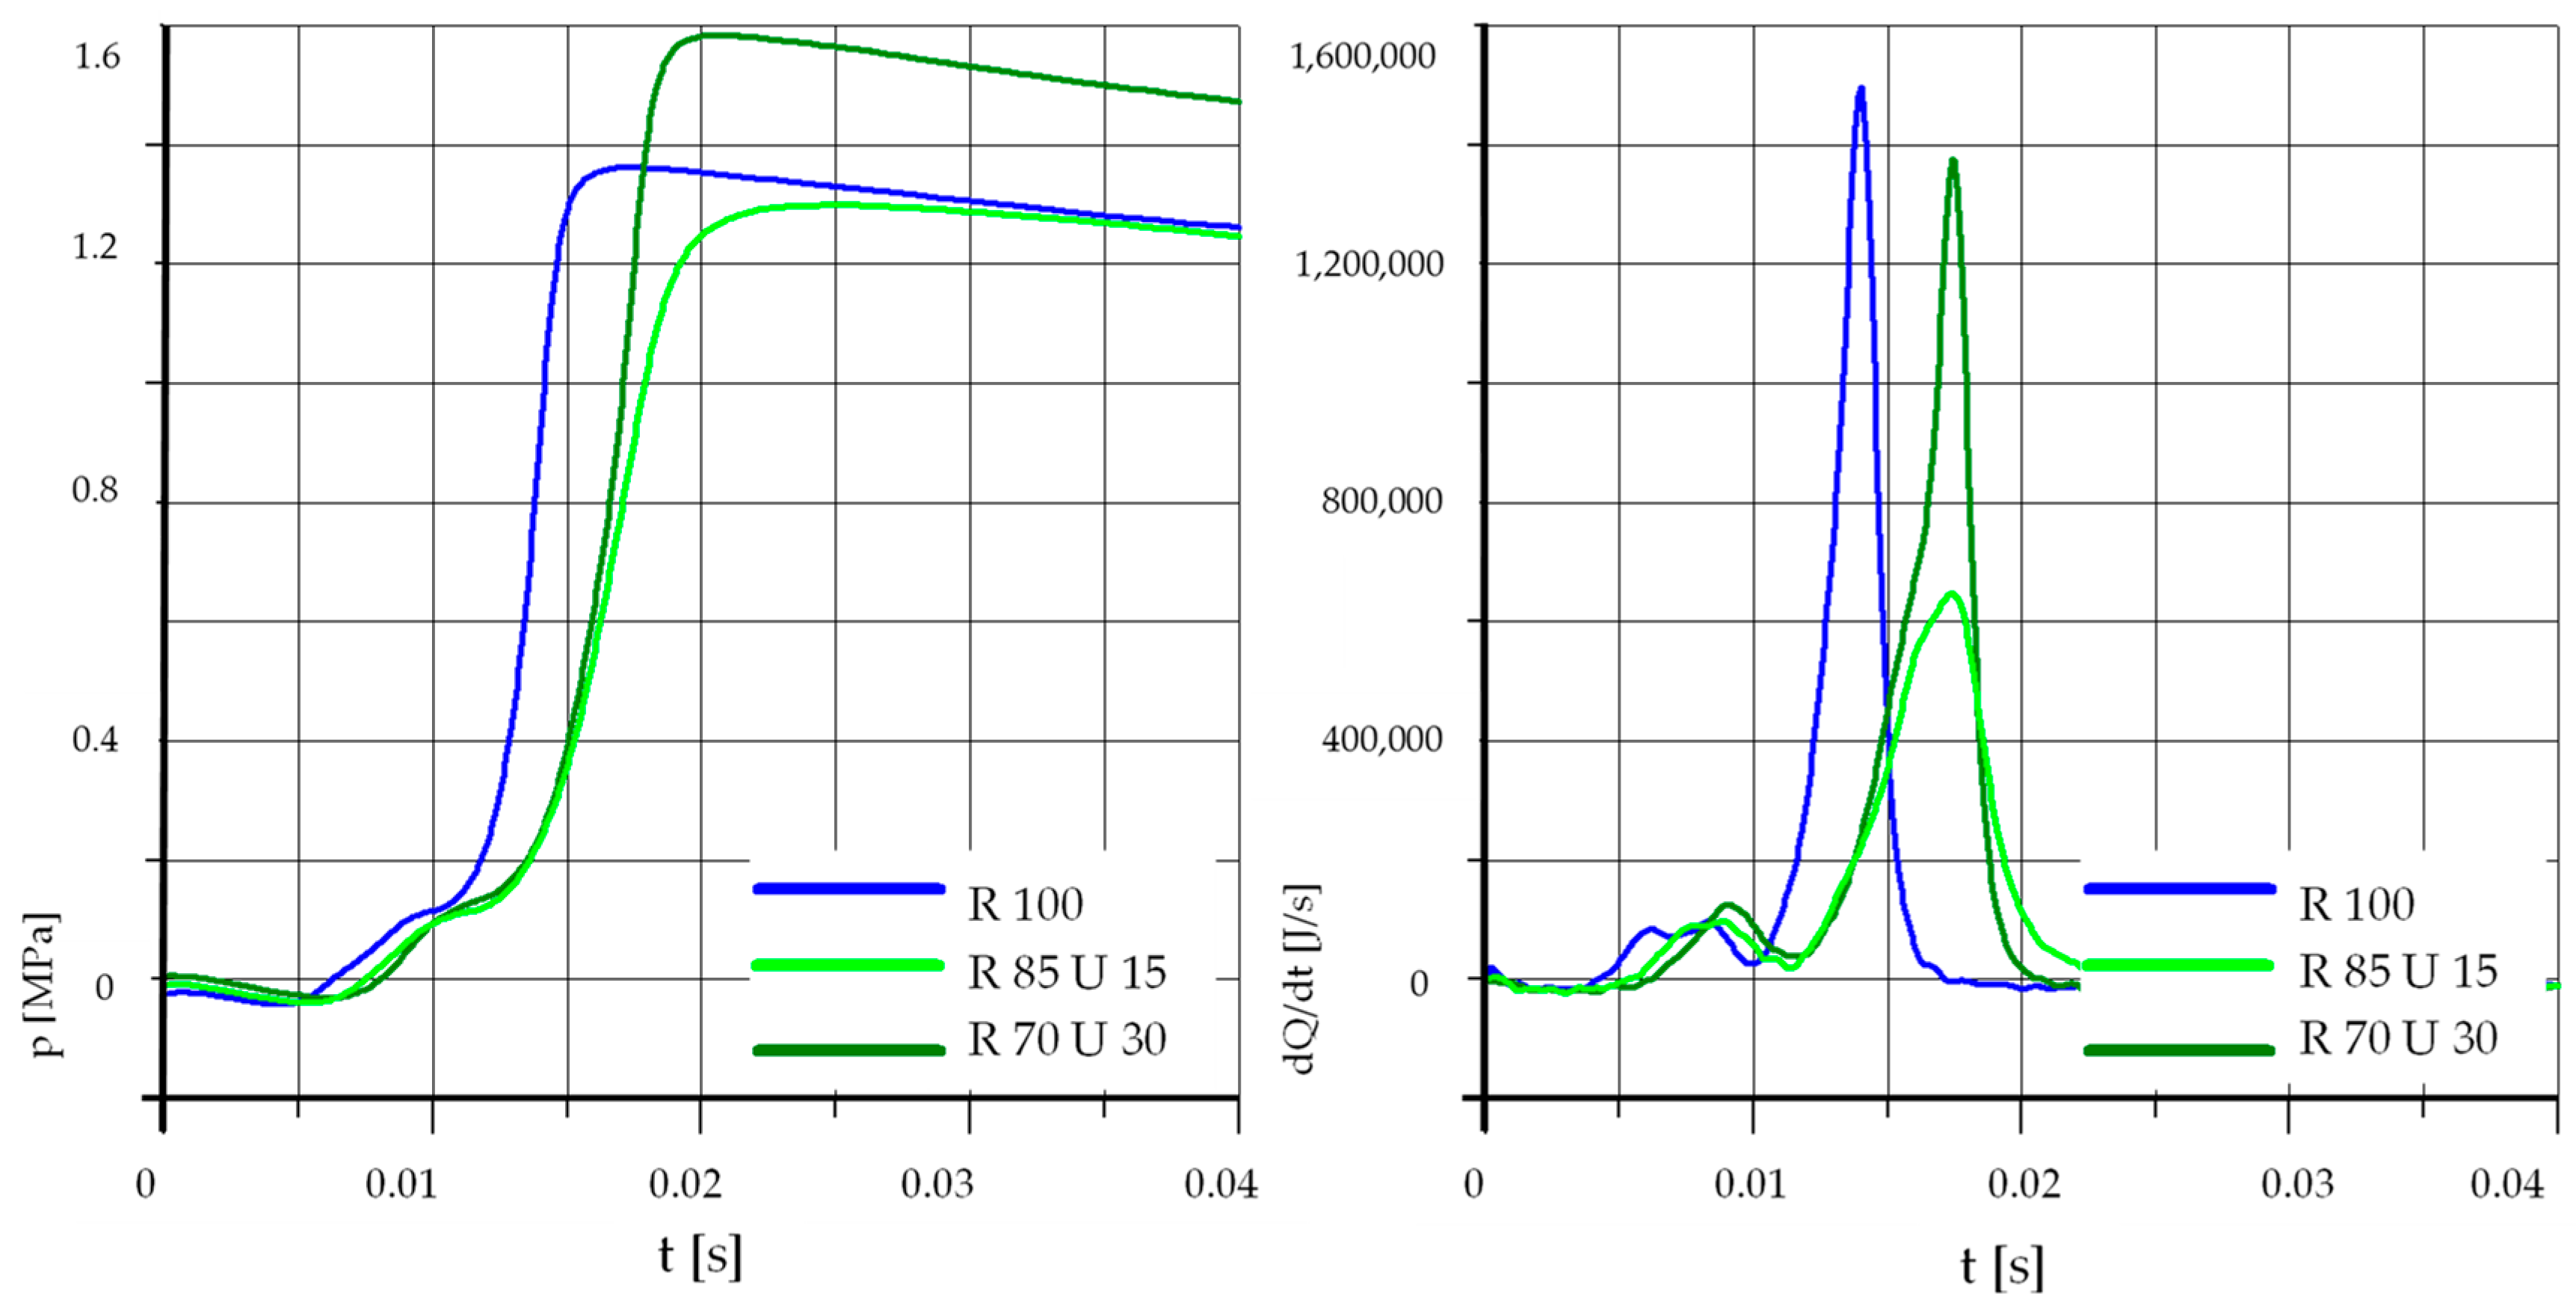
3.2.1. The Effect of Addition of Unleaded Petrol

Figure 7, Figure 8, Figure 9, Figure 10, Figure 11 and Figure 12 show the effect of the addition of unleaded petrol on the auto-ignition process and combustion of rapeseed oil. Process parameters are described under each of the drawings.
In Figure 7 it can be observed that the 15% addition of unleaded petrol did not improve the process parameters. The values of maximum pressure and heat release rates were even lower than for pure rapeseed oil. With the content of unleaded petrol equal to 30%, the maximum pressure increased, with a slight ignition delay and a slightly lower maximum value of the heat release rate.
At a lower initial temperature (Figure 8), both the 30% and 15% additions improved the process parameters.
Figure 9 shows the results obtained at the increased value of injection pressure and a higher initial temperature. The pressure rise and heat release rates lead to similar conclusions as in the case of Figure 7.
In the case of a lower initial temperature and increased pressure (waveforms in Figure 10), the result is similar to Figure 8. Similar conclusions can also be drawn from Figure 11 and Figure 12 showing the results of tests performed at an increased pressure in the test chamber.
Analyzing the above graphs, one can draw a general conclusion that the effect of the addition of unleaded petrol was dependent on the initial temperature in the combustion chamber. In the case of higher initial temperatures, the addition of unleaded petrol may even cause deterioration of the process parameters. This was probably related to the low value of the cetane number of unleaded petrol, the influence of which may be greater than the effect of the higher content of light fractions and higher calorific value.

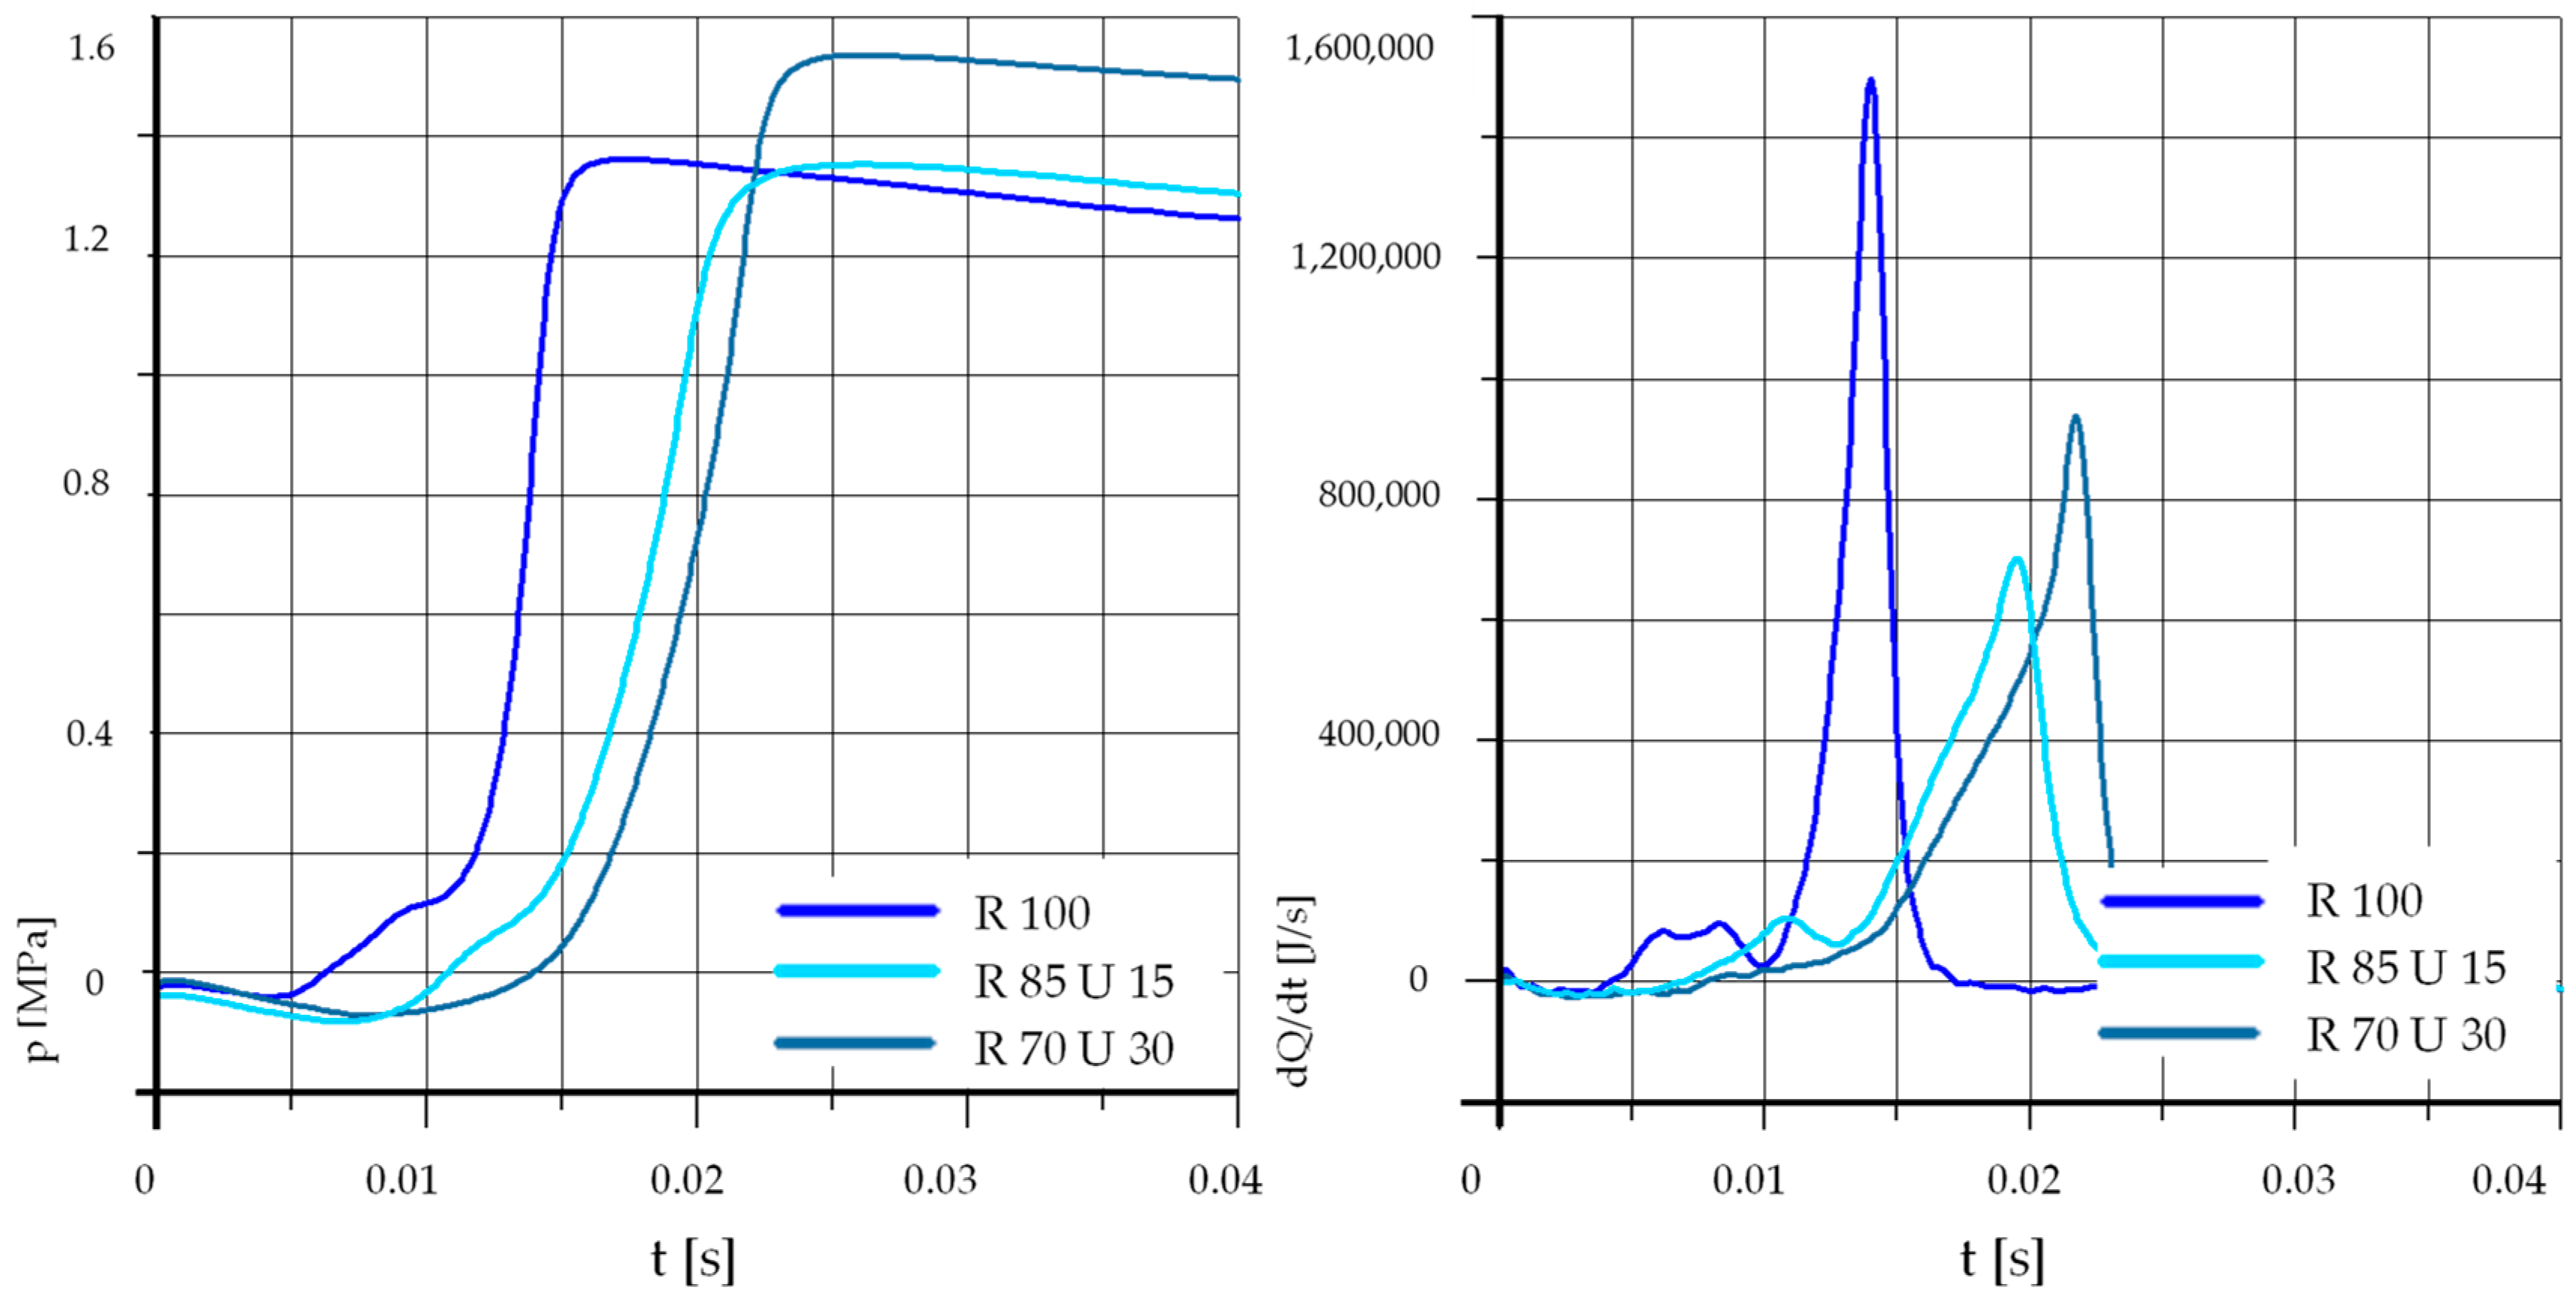
3.2.2. The Effect of Ethanol Addition

The following graphs, shown in Figure 13, Figure 14, Figure 15, Figure 16 and Figure 17, show the effect of ethanol addition on the auto-ignition process and combustion of rapeseed oil.
The results of the tests with the addition of ethyl alcohol are in principle analogous to those visible in the tests with the addition of unleaded petrol. In the case of a higher initial temperature, the addition of 15% alcohol did not improve the process parameters. The self-ignition delay time was extended, and the maximum pressure in the test chamber was lower, as was the maximum value of the heat release rate. The addition of 30% ethyl alcohol caused a further extension of the self-ignition delay time, however, the maximum pressure in the test chamber was clearly higher, at a lower maximum rate of pressure changes as compared to pure rapeseed oil.
Comparing the diagrams in Figure 13, Figure 14 and Figure 15, shows that the trends are very similar, regardless of the initial pressure and injection pressure. As in the case of the addition of unleaded petrol, these results may be the result of a reduction in the cetane number of the mixture associated with a lower value of this number for ethyl alcohol. In addition, ethyl alcohol has a lower calorific value, which also has a significant impact on the combustion process of the fuel mixture.
In the case of a lower initial temperature, the addition of 15% ethanol causes a delay in self-ignition, but in this case, an increase in the maximum pressure in the test chamber was also observed. The effect of the addition of ethyl alcohol on the heat release rate was dependent on the initial pressure and injection pressure. At low values of these parameters, the maximum value of the heat release rate was the highest for pure rapeseed oil. This is clearly visible in Figure 14 and Figure 16. At increased initial pressure and injection pressure, the addition of ethyl alcohol initially caused a reduction in the maximum heat release rate, but the difference was not too high, and at 30% ethyl alcohol in the mixture, the maximum values were even higher than for pure rapeseed oil. When comparing the heat release rates in Figure 18, it can be noticed that when using ethyl alcohol, the combustion process was gentler, spread over time, and much longer than for pure rapeseed oil. This result was very similar to that obtained with the use of unleaded petrol additive for the same test parameters (Figure 12).
The fuel mixtures tested differed in characteristics such as calorific value, the stoichiometric ratio of fuel to air, oxygen content, etc. In order to compare the combustion process of different mixtures, a dimensionless normalization involving the maximum increase of pressure in the combustion chamber to the energy contained in the injected fuel dose was used (Figure 19). This normalization was done according to the following relationship:
η = p c m a x · V c m p · W u
The results of this analysis confirmed conclusions drawn from the course of pressure and heat release rates. In the case of a lower initial temperature, we had an increase in the normalized pressure with an increase in the unleaded petrol content. However, for a higher initial temperature, we initially had a decrease in normalized pressure with an increase in the unleaded petrol content in the mixture.

4. Results

The analysis of the heat emanation during the combustion of mixtures of rapeseed oil with gasoline and ethanol in a constant volume chamber gave an insight into physico-chemical processes in the engine when using plant-derived fuels, and enabled drawing of the following conclusions:
  • An increase in rapeseed oil content in the mixture caused an increase in the self-ignition delay and a drop in the maximum pressure, especially at lower initial temperature values in the test chamber,
  • In the case of rape oil and gasoline mixtures, the effect of the additive depended on its concentration in the mixture,
  • In the case of mixtures containing 15% by weight of U95, a self-ignition delay was observed, and the maximum pressure dropped,
  • In the case of a higher mass fraction of U95, up to 30%, a further increase in the self-ignition delay was observed as well as a slight increase in the maximum pressure in the test chamber,
  • The practical implication of the performed research was that the additive apparently extending the range of fuel characteristics does not always bring a positive result on the fuel behavior. Both the chemical composition as well as concentrations of components have to be carefully studied before the mixture is used as a fuel,
  • Since both additives investigated have a low cetane number, it can be expected that the choice of the additive with a higher cetane number might lead to a wider spectrum of conditions at which the mixture would show better performance than the neat rapeseed oil. This assumption has to be studied separately,
  • Injection pressure and fuel viscosity have a fundamental effect on the air/fuel mixture creation, which affects combustion processes and also might affect exhaust composition and toxicity as well as fuel consumption.

5. Conclusions

As shown in the paper, the injection pressure and fuel viscosity have a fundamental effect on the creation processes of the air/fuel mixture. It is demonstrated that mixing biofuel with other fuels and those having seemingly better characteristics, does not necessarily bring satisfactory results for the mixed fuel behavior in a real engine. Consequently, not only density, viscosity, and thermal characteristics of components but also their cetane and octane numbers have to be considered for designing the composition of the mixture. Each of the mixtures should also be tested against the requirements of a particular engine in which the mixture will be used. Generally, the problem requires further investigations. The trend to use biofuels and their mixtures also might require new approaches to engine construction as well. Since the course of combustion and composition of the air/fuel mixture affects the composition of exhaust gases, the effects of all parameters mentioned above require extended separate investigations.

Author Contributions

Conceptualization, K.T., O.O., and A.W.; methodology, R.M.; validation, A.W. and A.Ś.; investigation, A.Ś. and R.M.; writing—original draft preparation, K.T and O.O.; funding acquisition, A.Ś.

Funding

The authors wish to express gratitude to Lublin University of Technology for the financial support given to the present publication (Antoni Świć). The research was carried out under financial support obtained from the research subsidy of the Faculty of Engineering Management (WIZ) of Bialystok University of Technology (Olga Orynycz, Andrzej Wasiak).

Acknowledgments

The Authors wish to express their deep gratitude to Lublin University of Technology for the financial support given to the present publication (A.Ś.). The research was carried out under financial support obtained from the research subsidy of the Faculty of Engineering Management (WIZ) of Bialystok University of Technology (O.O., A.W.).

Conflicts of Interest

The authors declare no conflict of interest.

References

  1. Küüt, A.; Ilves, R.; Küüt, K.; Raide, V.; Ritslaid, K.; Olt, J. Influence of European Union Directives on the Use of Liquid Biofuel in the Transport Sector. Procedia Eng. 2017, 187, 30–39. [Google Scholar] [CrossRef]
  2. Krzywonos, M.; Skudlarski, J.; Kupczyk, A.; Wojdalski, J.; Tucki, K. Forecast for transport biofuels in Poland in 2020–2030. Przemysł Chem. 2015, 94, 2218–2222. [Google Scholar]
  3. Pisoni, E.; Christidis, P.; Thunis, P.; Trombetti, M. Evaluating the impact of “Sustainable Urban Mobility Plans” on urban background air quality. J. Environ. Manag. 2019, 231, 249–255. [Google Scholar] [CrossRef] [PubMed]
  4. Herran, D.S.; Tachiiri, K.; Matsumoto, K. Global energy system transformations in mitigation scenarios considering climate uncertainties. Appl. Energy 2019, 243, 119–131. [Google Scholar] [CrossRef]
  5. Nagy, D.; Balogh, P.; Gabnai, Z.; Popp, J.; Oláh, J.; Bai, A. Economic Analysis of Pellet Production in Co-Digestion Biogas Plants. Energies 2018, 11, 1135. [Google Scholar] [CrossRef]
  6. Energy and Economy. Electric Power Research Institute and Galvin Electricity Initiative. Available online: http://www.iiasa.ac.at/ (accessed on 28 April 2019).
  7. Kosowski, K.; Tucki, K.; Piwowarski, M.; Stępień, R.; Orynycz, O.; Włodarski, W.; Bączyk, A. Thermodynamic Cycle Concepts for High-Efficiency Power Plans. Part A: Public Power Plants 60+. Sustainability 2019, 11, 554. [Google Scholar] [CrossRef]
  8. Tucki, K.; Orynycz, O.; Wasiak, A.; Świć, A.; Wichłacz, J. The Impact of Fuel Type on the Output Parameters of a New Biofuel Burner. Energies 2019, 12, 1383. [Google Scholar] [CrossRef]
  9. Kosowski, K.; Tucki, K.; Piwowarski, M.; Stępień, R.; Orynycz, O.; Włodarski, W. Thermodynamic Cycle Concepts for High-Efficiency Power Plants. Part B: Prosumer and Distributed Power Industry. Sustainability 2019, 11, 2647. [Google Scholar] [CrossRef]
  10. Electromobility Will Boost the Economy. Available online: https://financialobserver.eu/poland/ (accessed on 16 August 2019).
  11. Samson, I.; Sikora, M.; Bączyk, A.; Mączyńska, J.; Tucki, K. Technologies used to enhance the biogas and biomethane yield: A review. Przemysł Chem. 2017, 96, 1605–1611. [Google Scholar]
  12. Rietmann, N.; Lieven, T. How policy measures succeeded to promote electric mobility—Worldwide review and outlook. J. Clean. Prod. 2019, 206, 66–75. [Google Scholar] [CrossRef]
  13. Samuelsson, K.; Giusti, M.; Peterson, G.D.; Legeby, A.; Brandt, S.A.; Barthel, S. Impact of environment on people’s everyday experiences in Stockholm. Landsc. Urban Plan. 2018, 171, 7–17. [Google Scholar] [CrossRef]
  14. Liu, D.; Guo, X.; Xiao, B. What causes growth of global greenhouse gas emissions? Evidence from 40 countries. Sci. Total Environ. 2019, 661, 750–766. [Google Scholar] [CrossRef] [PubMed]
  15. Air Pollution: Our Health Still Insufficiently Protected. Available online: http://publications.europa.eu (accessed on 20 March 2019).
  16. Fernández-Dacosta, C.; Shen, L.; Schakel, W.; Ramirez, A.; Kramer, G.J. Potential and challenges of low-carbon energy options: Comparative assessment of alternative fuels for the transport sector. Appl. Energy 2019, 236, 590–606. [Google Scholar] [CrossRef]
  17. Arnold, M.; Tainter, J.A.; Strumsky, D. Productivity of innovation in biofuel technologies. Energy Policy 2019, 124, 54–62. [Google Scholar] [CrossRef]
  18. Demand for UCOME in Europe Falling as other Low GHG Fuels Step up the Pace. Available online: https://www.spglobal.com/ (accessed on 03 July 2019).
  19. Clean Transport; Urban Transport. Alternative Fuels for Sustainable Mobility in Europe. Available online: https://ec.europa.eu/transport/themes/urban/cpt_en (accessed on 28 April 2019).
  20. Hosseinzadeh-Bandbafha, H.; Tabatabaei, M.; Aghbashlo, M.; Khanali, M.; Demirbas, A. A comprehensive review on the environmental impacts of diesel/biodiesel additives. Energy Convers. Manag. 2018, 174, 579–614. [Google Scholar] [CrossRef]
  21. Mattioli, G.; Lucas, K.; Marsden, G. Reprint of Transport poverty and fuel poverty in the UK: From analogy to comparison. Transp. Policy 2018, 65, 114–125. [Google Scholar] [CrossRef]
  22. Alalwan, H.A.; Alminshid, A.H.; Aljaafari, H.A.S. Promising evolution of biofuel generations. Subject review. Renew. Energy Focus 2019, 28, 127–139. [Google Scholar] [CrossRef]
  23. Directive (EU) 2016/2284 of the European Parliament and of the Council of 14 December 2016 on the Reduction of National Emissions of Certain Atmospheric Pollutants, Amending Directive 2003/35/EC and Repealing Directive 2001/81/EC. Available online: https://eur-lex.europa.eu (accessed on 28 April 2019).
  24. National Environmental Protection Program until 2020 (with a Prospect until 2030). Available online: https://www.gov.pl/web/srodowisko (accessed on 28 April 2019).
  25. Kuklinska, K.; Wolska, L.; Namiesnik, J. Air quality policy in the U.S. and the EU—A review. Atmos. Pollut. Res. 2015, 6, 129–137. [Google Scholar] [CrossRef]
  26. Santos, F.M.; Gómez-Losada, A.; Pires, J.C.M. Impact of the implementation of Lisbon low emission zone on air quality. J. Hazard. Mater. 2019, 365, 632–641. [Google Scholar] [CrossRef]
  27. Tucki, K.; Mruk, M.; Orynycz, O.; Botwińska, K.; Gola, A. Toxicity of Exhaust Fumes (CO, NOx) of the Compression-Ignition (Diesel) Engine with the Use of Simulation. Sustainability 2019, 11, 2188. [Google Scholar] [CrossRef]
  28. Tucki, K.; Mruk, R.; Orynycz, O.; Wasiak, A.; Botwińska, K.; Gola, A. Simulation of the Operation of a Spark Ignition Engine Fueled with Various Biofuels and Its Contribution to Technology Management. Sustainability 2019, 11, 2799. [Google Scholar] [CrossRef]
  29. Sustainable Production of Next Generation Biofuels From Waste Streams. Available online: https://cordis.europa.eu/project/rcn/200420/factsheet/en (accessed on 16 August 2019).
  30. Wang, T.; Lin, B. Fuel consumption in road transport: A comparative study of China and OECD countries. J. Clean. Prod. 2019, 206, 156–170. [Google Scholar] [CrossRef]
  31. Kupczyk, A.; Mączyńska, J.; Redlarski, G.; Tucki, K.; Bączyk, A.; Rutkowski, D. Selected Aspects of Biofuels Market and the Electromobility Development in Poland: Current Trends and Forecasting Changes. Appl. Sci. 2019, 9, 254. [Google Scholar] [CrossRef]
  32. Mustapha, W.F.; Kirkerud, J.G.; Bolkesjø, T.F.; Trømborg, E. Large-scale forest-based biofuels production: Impacts on the Nordic energy sector. Energy Convers. Manag. 2019, 187, 93–102. [Google Scholar] [CrossRef]
  33. Krzywonos, M.; Tucki, K.; Wojdalski, J.; Kupczyk, A.; Sikora, M. Analysis of Properties of Synthetic Hydrocarbons Produced Using the ETG Method and Selected Conventional Biofuels Made in Poland in the Context of Environmental Effects Achieved. Rocz. Ochr. Środowiska 2017, 19, 394–410. [Google Scholar]
  34. Mączyńska, J.; Krzywonos, M.; Kupczyk, A.; Tucki, K.; Sikora, M.; Pińkowska, H.; Bączyk, A.; Wielewska, I. Production and use of biofuels for transport in Poland and Brazil—The case of bioethanol. Fuel 2019, 241, 989–996. [Google Scholar] [CrossRef]
  35. Leong, W.H.; Lim, J.W.; Lam, M.K.; Uemura, Y.; Ho, Y.C. Third generation biofuels: A nutritional perspective in enhancing microbial lipid production. Renew. Sustain. Energy Rev. 2018, 91, 950–961. [Google Scholar] [CrossRef]
  36. Wasiak, A. Modeling Energetic Efficiency of Biofuels Production. In Green Energy and Technology, 1st ed.; Springer Nature Switzerland: Cham, Switzerland, 2018; pp. 29–47. ISBN 978-3-319-98430-8. [Google Scholar] [CrossRef]
  37. Wasiak, A.; Orynycz, O. Computer modelling of the influences of subsystems’ interactions on energetic efficiency of biofuel production systems. In Proceedings of the ITM Web of Conferences, Lublin, Poland, 23–25 November 2017. [Google Scholar]
  38. Karthickeyan, V. Effect of combustion chamber bowl geometry modification on engine performance, combustion and emission characteristics of biodiesel fuelled diesel engine with its energy and exergy analysis. Energy 2019, 176, 830–852. [Google Scholar] [CrossRef]
  39. Gharehghani, A.; Mirsalim, M.; Hosseini, R. Effects of waste fish oil biodiesel on diesel engine combustion characteristics and emission. Renew. Energy 2017, 101, 930–936. [Google Scholar] [CrossRef]
  40. Curran, H.J. Developing detailed chemical kinetic mechanisms for fuel combustion. Proc. Combust. Inst. 2019, 37, 57–81. [Google Scholar] [CrossRef]
  41. Debnath, B.K.; Sahoo, N.; Saha, U.K. Thermodynamic analysis of a variable compression ratio diesel engine running with palm oil methyl ester. Energy Convers. Manag. 2013, 65, 147–154. [Google Scholar] [CrossRef]
  42. Singh, G.N.; Bharj, R.S. Study of physical-chemical properties for 2nd generation ethanol-blended diesel fuel in India. Sustain. Chem. Pharm. 2019, 12, 100130. [Google Scholar] [CrossRef]
  43. Zhang, Y.; Jia, M.; Wang, P.; Chang, Y.; Yi, P.; Liu, H.; He, Z. Construction of a decoupling physical–chemical surrogate (DPCS) for practical diesel fuel. Appl. Therm. Eng. 2019, 149, 536–547. [Google Scholar] [CrossRef]
  44. Sun, X.; Liang, X. Influence of Different Fuels Physical Properties for Marine Diesel Engine. Energy Procedia 2017, 142, 1159–1165. [Google Scholar] [CrossRef]
  45. Yeom, J.K.; Jung, S.H.; Yoon, J.H. An experimental study on the application of oxygenated fuel to diesel engines. Fuel 2019, 248, 262–277. [Google Scholar] [CrossRef]
  46. Liu, H.; Ma, J.; Dong, F.; Yang, Y.; Liu, X.; Ma, G.; Zheng, Z.; Yao, M. Experimental investigation of the effects of diesel fuel properties on combustion and emissions on a multi-cylinder heavy-duty diesel engine. Energy Convers. Manag. 2018, 171, 1787–1800. [Google Scholar] [CrossRef]
  47. Anantha Raman, L.; Deepanraj, B.; Rajakumar, S.; Sivasubramanian, V. Experimental investigation on performance, combustion and emission analysis of a direct injection diesel engine fuelled with rapeseed oil biodiesel. Fuel 2019, 246, 69–74. [Google Scholar] [CrossRef]
  48. Cheng, Q.; Tuomo, H.; Kaario, O.T.; Martti, L. Spray dynamics of HVO and EN590 diesel fuels. Fuel 2019, 245, 198–211. [Google Scholar] [CrossRef]
  49. The Potential for Using Tallow as a Fuel for the Production of Energy. Available online: https://www.sustainability.vic.gov.au/ (accessed on 12 August 2019).
  50. Bartholomew, D. Vegetable oil fuel. J. Am. Oil Chem. Soc. 1981, 58, 286–288. [Google Scholar] [CrossRef]
  51. Bello, E.I.; Mogaji, T.S.; Agge, M. The effects of transesterification on selected fuel properties of three vegetable oils. J. Mech. Eng. Res. 2011, 3, 218–225. [Google Scholar]
  52. Klimkiewicz, M. The Use of Crude Rapeseed Oil as a Fuel for Diesel Engines; Report on the implementation of the development Project No. R1003703; Faculty of Production Engineering, Warsaw University of Life Sciences: Warsaw, Poland, 2011. [Google Scholar]
  53. Mruk, R.; Klimkiewicz, M.; Botwińska, K. The studies of combustion processes mixtures of diesel oil with raw rapeseed oil as a part of product design. Logistyka 2015, 5, 397–404. [Google Scholar]
Figure 1. General scheme of the combustion apparatus used.
Sustainability 11 04449 g001
Figure 2. The effect of temperature, R100%: pk = 0.5 MPa, pCR = 65 MPa, λ= 1.25. (R—Rapeseed Oil).
Sustainability 11 04449 g002
Figure 3. The effect of temperature, R85% U15%: pk = 0.5 MPa, pCR = 65 MPa, λ= 1.25. (R—Rapeseed Oil, U—Unleaded Petrol).
Sustainability 11 04449 g003
Figure 4. The effect of temperature, R70% U30%: pk = 0.5 MPa, pCR = 65 MPa, λ= 1.25. (R—Rapeseed Oil, U—Unleaded Petrol).
Sustainability 11 04449 g004
Figure 5. The effect of temperature, R85% E15%: pk = 0.5 MPa, pCR = 65 MPa, λ= 1.25. (R—Rapeseed Oil, U—Unleaded Petrol).
Sustainability 11 04449 g005
Figure 6. The effect of temperature, R70% E30%: pk = 0.5 MPa, pCR = 65 MPa, λ= 1.25. (R—Rapeseed Oil, U—Unleaded Petrol). .
Sustainability 11 04449 g006
Figure 7. The effect of fuel composition [U]: T = 500 °C, pk = 0.5 MPa, pCR = 65 MPa, λ= 1.25. (U—Unleaded Petrol).
Sustainability 11 04449 g007
Figure 8. The effect of fuel composition [U]: T = 425 °C, pk = 0.5 MPa, pCR = 65 MPa, λ= 1.25. (U—Unleaded Petrol).
Sustainability 11 04449 g008
Figure 9. The effect of fuel composition [U]: T = 500 °C, pk = 0.5 MPa, pCR = 100 MPa, λ= 1.25. (U—Unleaded Petrol).
Sustainability 11 04449 g009
Figure 10. The effect of fuel composition [U]: T = 425 °C, pk = 0.5 MPa, pCR = 100 MPa, λ= 1.25. (U—Unleaded Petrol).
Sustainability 11 04449 g010
Figure 11. The effect of fuel composition [U]: T = 500 °C, pk = 0.9 MPa, pCR = 100 MPa, λ= 1.25. (U—Unleaded Petrol).
Sustainability 11 04449 g011
Figure 12. The effect of fuel composition [U]: T = 425 °C, pk = 0.9 MPa, pCR = 100 MPa, λ= 1.25. (U—Unleaded Petrol).
Sustainability 11 04449 g012
Figure 13. The effect of fuel composition [E]: T = 500 °C, pk = 0.5 MPa, pCR = 65 MPa, λ= 1.25. (E—Ethanol).
Sustainability 11 04449 g013
Figure 14. The effect of fuel composition [E]: T = 425 °C, pk = 0.5 MPa, pCR = 65 MPa, λ= 1.25. (E—Ethanol).
Sustainability 11 04449 g014
Figure 15. The effect of fuel composition [E]: T = 500 °C, pk = 0.5 MPa, pCR = 100 MPa, λ= 1.25. (E—Ethanol).
Sustainability 11 04449 g015
Figure 16. The effect of fuel composition [E]: T = 425 °C, pk = 0.5 MPa, pCR = 100 MPa, λ= 1.25. (E—Ethanol).
Sustainability 11 04449 g016
Figure 17. The effect of fuel composition [E]: T = 500 °C, pk = 0.9 MPa, pCR = 100 MPa, λ= 1.25. (E—Ethanol).
Sustainability 11 04449 g017
Figure 18. The effect of fuel composition [E]: T = 425 °C, pk = 0.9 MPa, pCR = 100 MPa, λ= 1.25. (E—Ethanol).
Sustainability 11 04449 g018
Figure 19. Normalized value of pressure increases in the chamber as a function of diesel oil content for various test parameters. Description of the sample: First number—temperature [°C], second number—initial pressure × 10−1 [MPa], third number—injection pressure [MPa], fourth number—excess air factor × 10−3. (U—Unleaded Petrol, E—Ethanol).
Sustainability 11 04449 g019
Table 1. Symbols used in calculations.
SymbolDescription
V volume
T temperature
R gas constant
R 1 individual gas constant
C s the heat of burning fuel
C p specific heat at constant pressure of the gas mixture in the chamber
C v specific heat at a constant volume of the gas mixture in the chamber
V c chamber volume
W u calorific value of fuel
t z z-th instant of time
t z 1 z-1 instant of time
t z + 1 z + 1 instant of time
p Pressure
p n pressure in the chamber at the z-th instant of time after smoothing
p ( t z ) pressure in the chamber at the z-th instant of time
p ( t z 1 ) pressure in the chamber in z-1 instant of time
p ( t z + 1 ) chamber pressure in z + 1 instant of time
p c m a x maximum pressure in the chamber
m gas mass
m p mass of burnt fuel or mass of injected fuel
m z the mass of gas at the instant z
m z 1 mass of gas at z-1 instant of time
y 1 , y 2 , y 3 , y 4 , y 5 coefficients, individual for each gas
d Q emitted heat
x H mass share of hydrogen in the fuel
x O mass fraction of oxygen in fuel
[ O 2 ] mass fraction of oxygen
[ N 2 ] mass fraction of nitrogen
[ C O 2 ] mass fraction of carbon dioxide
[ H 2 O ] mass fraction of water vapor
[ C p o 2 ] mass heat at constant oxygen pressure
[ C p N 2 ] mass heat at constant nitrogen pressure
[ C p C O 2 ] specific heat at constant carbon dioxide pressure
[ C p H 2 O ] specific heat at constant water vapor pressure
[ O 2 ] z mass fraction of oxygen at the z-th instant of time
[ N 2 ] z mass fraction of nitrogen at the z-th instant of time
[ C O 2 ] z mass fraction of carbon dioxide at the z-th instant of time
[ H 2 O ] z mass fraction of water vapor at the z-th instant of time
[ O 2 ] z 1 mass fraction of oxygen at the instant z-1
[ N 2 ] z 1 mass fraction of nitrogen at the instant z-1
[ C O 2 ] z 1 mass fraction of carbon dioxide at the instant z-1
[ H 2 O ] z 1 mass fraction of water vapor at the instant z-1
Table 2. Properties of fuel components used.
FuelRapeseed Oil (R)Ethanol (E)Unleaded Petrol (U)
Lower heating value [MJ/kg]37.529.747.3
Hydrogen mass fraction [%]11.413.014.0
Carbon mass fraction [%]77.452.286.0
Oxygen mass fraction [%]11.234.8-

