Article

Impact of Low-E Window Films on Energy Consumption and CO2 Emissions of an Existing UK Hotel Building

1
Department of Civil Engineering and Built Environment, School of Computing and Engineering, University of West London, London W5 5RF, UK
2
Research Department, The Chartered Institution of Building Services Engineers [CIBSE], London SW12 9BS, UK
3
Energy and Environment, Engineering Operations EMEA, Hilton, Maple Court, Reeds Crescent, Watford WD24 4QQ, UK
4
Engineering Operations EMEA, Hilton, Maple Court, Reeds Crescent, Watford WD24 4QQ, UK
*
Author to whom correspondence should be addressed.
Sustainability 2019, 11(16), 4265; https://doi.org/10.3390/su11164265
Submission received: 18 June 2019 / Revised: 2 August 2019 / Accepted: 5 August 2019 / Published: 7 August 2019

Abstract

:
In order to fulfil the UK government’s ambitious goal of 80% reductions in greenhouse gas emissions by 2050 compared to the levels of 1990s, unprecedented measures for improving the energy efficiency of buildings are needed. This study investigates the impact of a specific type of Low-emissivity (Low-E) window film—Thinsulate Climate Control 75—on the holistic energy consumption of an existing United Kingdom (UK) hotel building. Building modelling and energy simulation software EDSL TAS is used to conduct the study. The result of the simulations demonstrates that by applying Thinsulate films, savings in heating, cooling, and total energy consumptions are achieved by 3%, 20%, and 2.7%, respectively. Also 4.1% and 5.1% savings are achieved in annual CO2 emissions and total energy costs, respectively, while the initial costs may be an issue. This study found that application of Low-E window films results in slightly better energy performance of the hotel regarding its heating-dominant climate. The study also recommends using average annual actual energy consumption data for a time range, instead of picking a single year’s data for validating purposes.

1. Introduction

In recent years, with professionals and public showing concerns about the potential impacts of global warming, the United Kingdom (UK) government has set the ambitious goal of 80% reduction in greenhouse gas (GHG) emissions by 2050 compared to 1990s levels [1]. This needs unprecedented levels of effort and change in many sectors to make the necessary reductions, while keeping the energy sector secure and competitive. While different sectors will endeavor to meet this target, analyses indicate that high energy saving potentials lie within the building sector [2]. Among all the elements of a building fabric, windows and glazing units contribute heavily to the energy consumption of the building [3,4]. It has been claimed that windows can be blamed for up to 60% of a building’s total energy loss [5]. The energy performance of a window is assessed through thermal transmittance (U-value), total solar energy transmittance (g-value), and air leakage [6,7,8]. Compared to other building elements, windows have a remarkably higher U-value [7]. Where the U-values of a new building’s roof, floor, and external wall are expected to be in the range of 0.25 to 0.35 W/m2K, it can reach up to 2.2 W/m2K for a window [9]. However, due to their role in daylighting and ventilation and their psychological impact on occupants [10], windows are inevitable. Therefore, careful choice of glazing type is necessary for energy saving [11]. In recent decades, efforts have been made to improve the thermal performance of glazing systems through new technologies, among which, window films impose the least disturbance to occupants as a retrofitting measure [12].
There are different types of window films from an energy performance point of view. One of these types are sun control window films, which tend to reduce cooling energy consumption through a decrease in solar gain [13]. They can have a significant impact on reducing both the solar factor and light transmittance [14]. This quality is most suitable for a hot climate [15]. It was found by some researchers that when sun control coatings are applied, aside from a reduction in cooling demand, there might be an increase in heating demand due to reduced solar gain [13,16]. The final impact on the annual energy consumption is a function of the balance between heating and cooling energy consumptions.
Another type of window film widely in use is the Low-E (Low-emissivity) film, which is based on metals or metallic oxides and available in two types of soft and hard Low-E coatings. The hard coatings are based on tin oxide, while soft type coatings are based on a thin layer of silver. This type of coating provides a more transparent view. They are less durable compared to the hard films [7].
Low-E films can contribute to energy saving through both heat gain reductions and heat loss reductions. Low-E films are spectrally selective, which means that they tend to be very reflective in the infrared region. By reflecting the longwave infrared radiation from a space back inside—resulting in the heat being trapped inside—the Low-E coatings reduce the heat loss significantly [17]. This characteristic is favourable for areas where heating load is dominant. They can also reduce heat gain through a reduction in solar transmittance. This characteristic can be favourable in cooling dominant climates but in order for this characteristic to result in saving in cooling energy consumption, the reductions in heat gain must exceed the heat loss reductions caused by the film’s low emissivity. Otherwise, their inherent ability to trap heat inside will not be helpful in reducing the cooling energy consumptions in hot climates. Having their maximum performance in one specific climatic situation is quite common among other glazing solutions as well [18].
The study by Bahadori-Jahromi et al. [13] found savings in cooling energy consumption by sun control films in an existing UK hotel building. However, this reduction was mostly counteracted by the increase in heating energy consumption. The current paper aims to investigate the impact of Low-E window films on the energy consumption of the same building—Hilton Reading in Berkshire, UK—and its subsequent impact on CO2 emissions. In order to carry out the research, a combination of thermal analysis simulation (TAS) software, along with the site data, is used.
Going through the existing literature reveals a considerable body of knowledge about the impact of window films on energy consumption of buildings. A brief summary of some of these studies is presented in the following section.
One of the early studies on the impact of Low-E window films with various window-to-wall ratios [19] found that in both hot and cold climates, applying Low-E window films resulted in lower energy consumption in heating, cooling, and even lighting. Another study investigated the impact of several types of glazing—single clear, Low-E reverse pane, single Low-E, and double glazed Low-E windows—on cooling energy consumption of a mid-rise office building in Malaysia. The study reported savings in cooling energy consumption in the range of 3.4–6.4% by applying a Low-E film, and the highest saving was achieved through the Low-E double glazed window [20]. Collins and Simko [21] investigated different heat transfer processes possible for vacuum glazing units through modelling, and validated their results with the experimental data. They found that by applying Low-E coatings, radiant heat loss was mitigated significantly. Fang et al. [22] theoretically and experimentally studied the thermal performance of a vacuum glazing combined with air gap and Low-E coatings. They constructed a guarded hot box calorimeter to validate the result of the simulation they carried out. By adding an extra layer of Low-E coating (three in total), the glazing unit hit a significantly low U-value of 0.24 W/m2K, although in reality, applying three layers of Low-E coatings might not be financially viable. Karlsson and Roos [23] mentioned that when applied properly, the Low-E coatings can achieve savings up to 150 kW/m2 of glazed area per year. The researchers also mentioned that since its introduction in early 1980s, the Low-E thin film technology had achieved its maturity by the time of the research (2001) and had secured its position as a cost-effective measure for energy savings in most cases. Romagnoni et al. [24] investigated the impact of three different glazing systems—standard double glazing, double glazing with Low-E coating and air-filled gap, double glazing with Low-E coating and Krypton filled gap—on energy consumption of an office building in different Italian climatic conditions through computer simulation. Based on the performance of the three types, the researchers claimed that the contributions of Low-E coatings to energy savings is achievable in different climatic situation. The study recommended the unit with air gap for hot climate and the unit with Krypton for cold climatic conditions. Studies by [25,26] show that although a huge reduction in thermal emissivity is possible by applying Low-E coatings, their high production cost acts as an obstacle in a wider application of these coatings. According to the literature, the surface that the coating is applied on can change the amount of energy savings. Ye et al. [27] stated in their research that the best performance for a single layered window with Low-E coating is achieved when the coating is applied on the inner surface. Chow, Li and Lin [25] focused on cooling-dominant climates and found that by adding the Low-E coatings to the inner surface of the external layer of a double glazed window, there can be a reduction in heat gain up to 48% compared to a single clear glass, although the surface temperature exceeds 40 °C. In many cases, when the coating is applied to an existing window, it might not be possible to apply it inside the gap between the two layers. As the same study [25] shows, by applying the coating on the outer surface of the external glazing, the reductions in heat gain is less, so is the surface temperature of the window, around 35 °C. Ye et al. [27] suggested that as reduced emissivity is usually followed by a reduction in light transmittance, a Low-E coating suitable for summertime might not necessarily suit the needs of winter time. One study [28] suggested that Low-E coatings with high solar heat gain coefficient (SHGC) will perform better in heating-dominant climates, while the ones with low SHGC will be more suitable for cooling dominant conditions. Sadineni, Madala and Boehm [29] introduced additional antireflection treatment to apply on a Low-E glazing when a higher level of visible light transmittance is needed.
As the short summary above indicates, although there is a large body of knowledge about window films in general, the application of Low-E coatings on commercial/hotel buildings has not received much attention, which indicates a knowledge gap. The current study focuses on this matter and looks into the holistic impact of applying the specific films on total heating and cooling energy consumption of the building. Unlike many other studies, this study does not focus only on energy consumption, but it also investigates the potential impacts on occupants’ thermal comfort. Finally, this study compares the impact of applying Low-E window films against installing Low-E window units from the start to find out how the building will benefit from each of these alternatives.

2. Materials and Methods

This study aims to investigate the holistic impact of a commercially available Low-E coating on the annual energy consumption and CO2 emissions of Hilton Reading hotel, located in Berkshire, in the southeast of the UK. In order to have a base for investigating the impact of Low-E coatings, the hotel building in its current situation is modelled in EDSL TAS version 9.4.4 software. TAS is designed by the Engineering Development Solutions Limited (Milton Keynes, UK) and comprises different modules such as 3D Modeller, Building Simulator, Systems, etc., that simulate the thermal performance of the building and estimate the building’s energy consumption. TAS provides the opportunity to combine the dynamic thermal simulation of the building with control functions over natural and mixed mode ventilations [13]. A detailed description about the software and its capabilities can be found in [30,31].
Apart from the floor plans, information about building fabric, heating and cooling system specification, internal conditions, and occupancy profiles are needed as input data for the software. As obtaining the exact data about internal conditions of different spaces within a hotel can be very difficult, if not impossible, and due to constantly changing nature of occupancy profiles, the National Calculation Methodology’s (NCM) standard profiles for hotels are employed. This estimated energy consumption is then validated against the actual energy consumption data of the hotel to verify the reliability of the simulation. Finally, the Low-E window films are applied to the verified model to assess the overall impact.
As mentioned previously, the selected building for this study is Hilton Reading hotel, which is in Reading, Berkshire in the United Kingdom. The building has a total floor area of 12,360 m2. The ground floor encompasses areas such as the reception, lobby, restaurant, hall, administrative and meeting rooms, and laundry. The hotel also has a swimming pool and gym located on the ground floor level. First, second, and third floors accommodate 210 ensuite guest rooms. The building façade is mostly covered in curtain wall with a double-glazed unit comprising two 4 mm clear panes with a 50 mm air-filled gap. As the building was built in 2009, it complies with the 2006 UK building regulation [13]. The building is sealed and fully air conditioned. The heating and cooling are provided through the air handling units (AHUs) located on the roof and fan coil units (FCUs). Six gas-fired boilers are responsible for providing the domestic hot water (DHW). The building geometry and a typical floor plan are shown in Figure 1.
As demonstrated in Figure 1, the building is mostly elongated in north-south direction with massive glazing area facing east and west. A smaller fraction of the building comes with glazed area facing north-east and south-west. In general, a building’s orientation affects the energy consumption. In heating-dominant locations, using south facing windows in order to benefit from direct solar gain can help in reducing heating demand. Also, west-facing glazing can result in too much solar gain during the cooling dominant time of the year, when less solar gain is favourable. The current orientation of the building results in less solar gain during the time when more solar gain is desirable, and more solar gain during the April–September period compared to an East-West Orientation. Hence, the current orientation of the building has resulted in more heating energy consumption during the colder months of the year and more cooling energy consumption during April–September (Figure 2).
Like other thermal modelling and simulation software, TAS requires weather files to predict the energy consumption of a building. Two types of weather files that can be used with TAS are test reference year (TRY) and design summer year (DSY). DSY files are used for overheating analysis, while TRY is suitable for analysing the average energy consumption of a building—and it is also used for compliance with the UK building regulation [32]. Currently, the TRY weather files are available for 14 locations within the UK, and Reading is not one of these 14 locations. Reading is about 40 miles from Central London, which is the closest weather station. Therefore, the current London TRY weather file will be used in this study, issued by Chartered Institute of Building Services Engineers (CIBSE).
As this is a continuation of a previous study [13], the Low-E window films from the same manufacturer, 3M company [33], are used in this study, with the commercial name of Thinsulate Climate Control 75 and a transparent look. It also offers improvement in Low-E characteristics compared to similar products. Figure 3 shows all the possible alternatives for positioning a coating on a double-glazed window unit. Thinsulate films cannot be exposed to the external environment, which means ruling out alternative 1 of Figure 3. When a double-glazed unit is designed to be of Low-E quality from the start, the Low-E layer will be applied within the gap between two windowpanes and the internal surface of the external windowpane, alternative 2. But when the coating is applied on an existing window, it is usually not possible to have it positioned on either of the alternatives 2 or 3. Therefore, it is only applicable to apply Thinsulate film in a position such as alternative 4 of the Figure 3.
Thinsulate coating is expected to be suitable both in winter and summer time, which is due to qualities such as solar heat reduction during the summer and a reduction in radiative heat loss during the winter. Table 1 and Table 2 show the specification of 3M Thinsulate Climate Control film. In order to compare this film with another product of the same company, which was previously investigated by [13], the specifications of 3M Sun Control Prestige 70 and 40 Exterior are also illustrated.
As it can be observed from the tables, apart from minor differences in behaviour towards the visible light, there are major differences between the two types of coating for the G-value, heat gain/loss reductions, and emissivity. Based on this information, the Thinsulate coating lets more solar gain through the glazing compared to the sun control films. Therefore, the sun control films perform better in the summer. Another important factor to consider is that the sun control films do not contribute towards the heat loss reductions, while the Thinsulate can significantly reduce the heat loss through glazing—which is favourable for winter. This quality is achieved through a significantly lower emissivity rate for the Thinsulate film. In addition, as the hotel is located in a heating-dominant climate, the improved performance in heat loss reductions might be of more importance in energy saving field.

3. Results

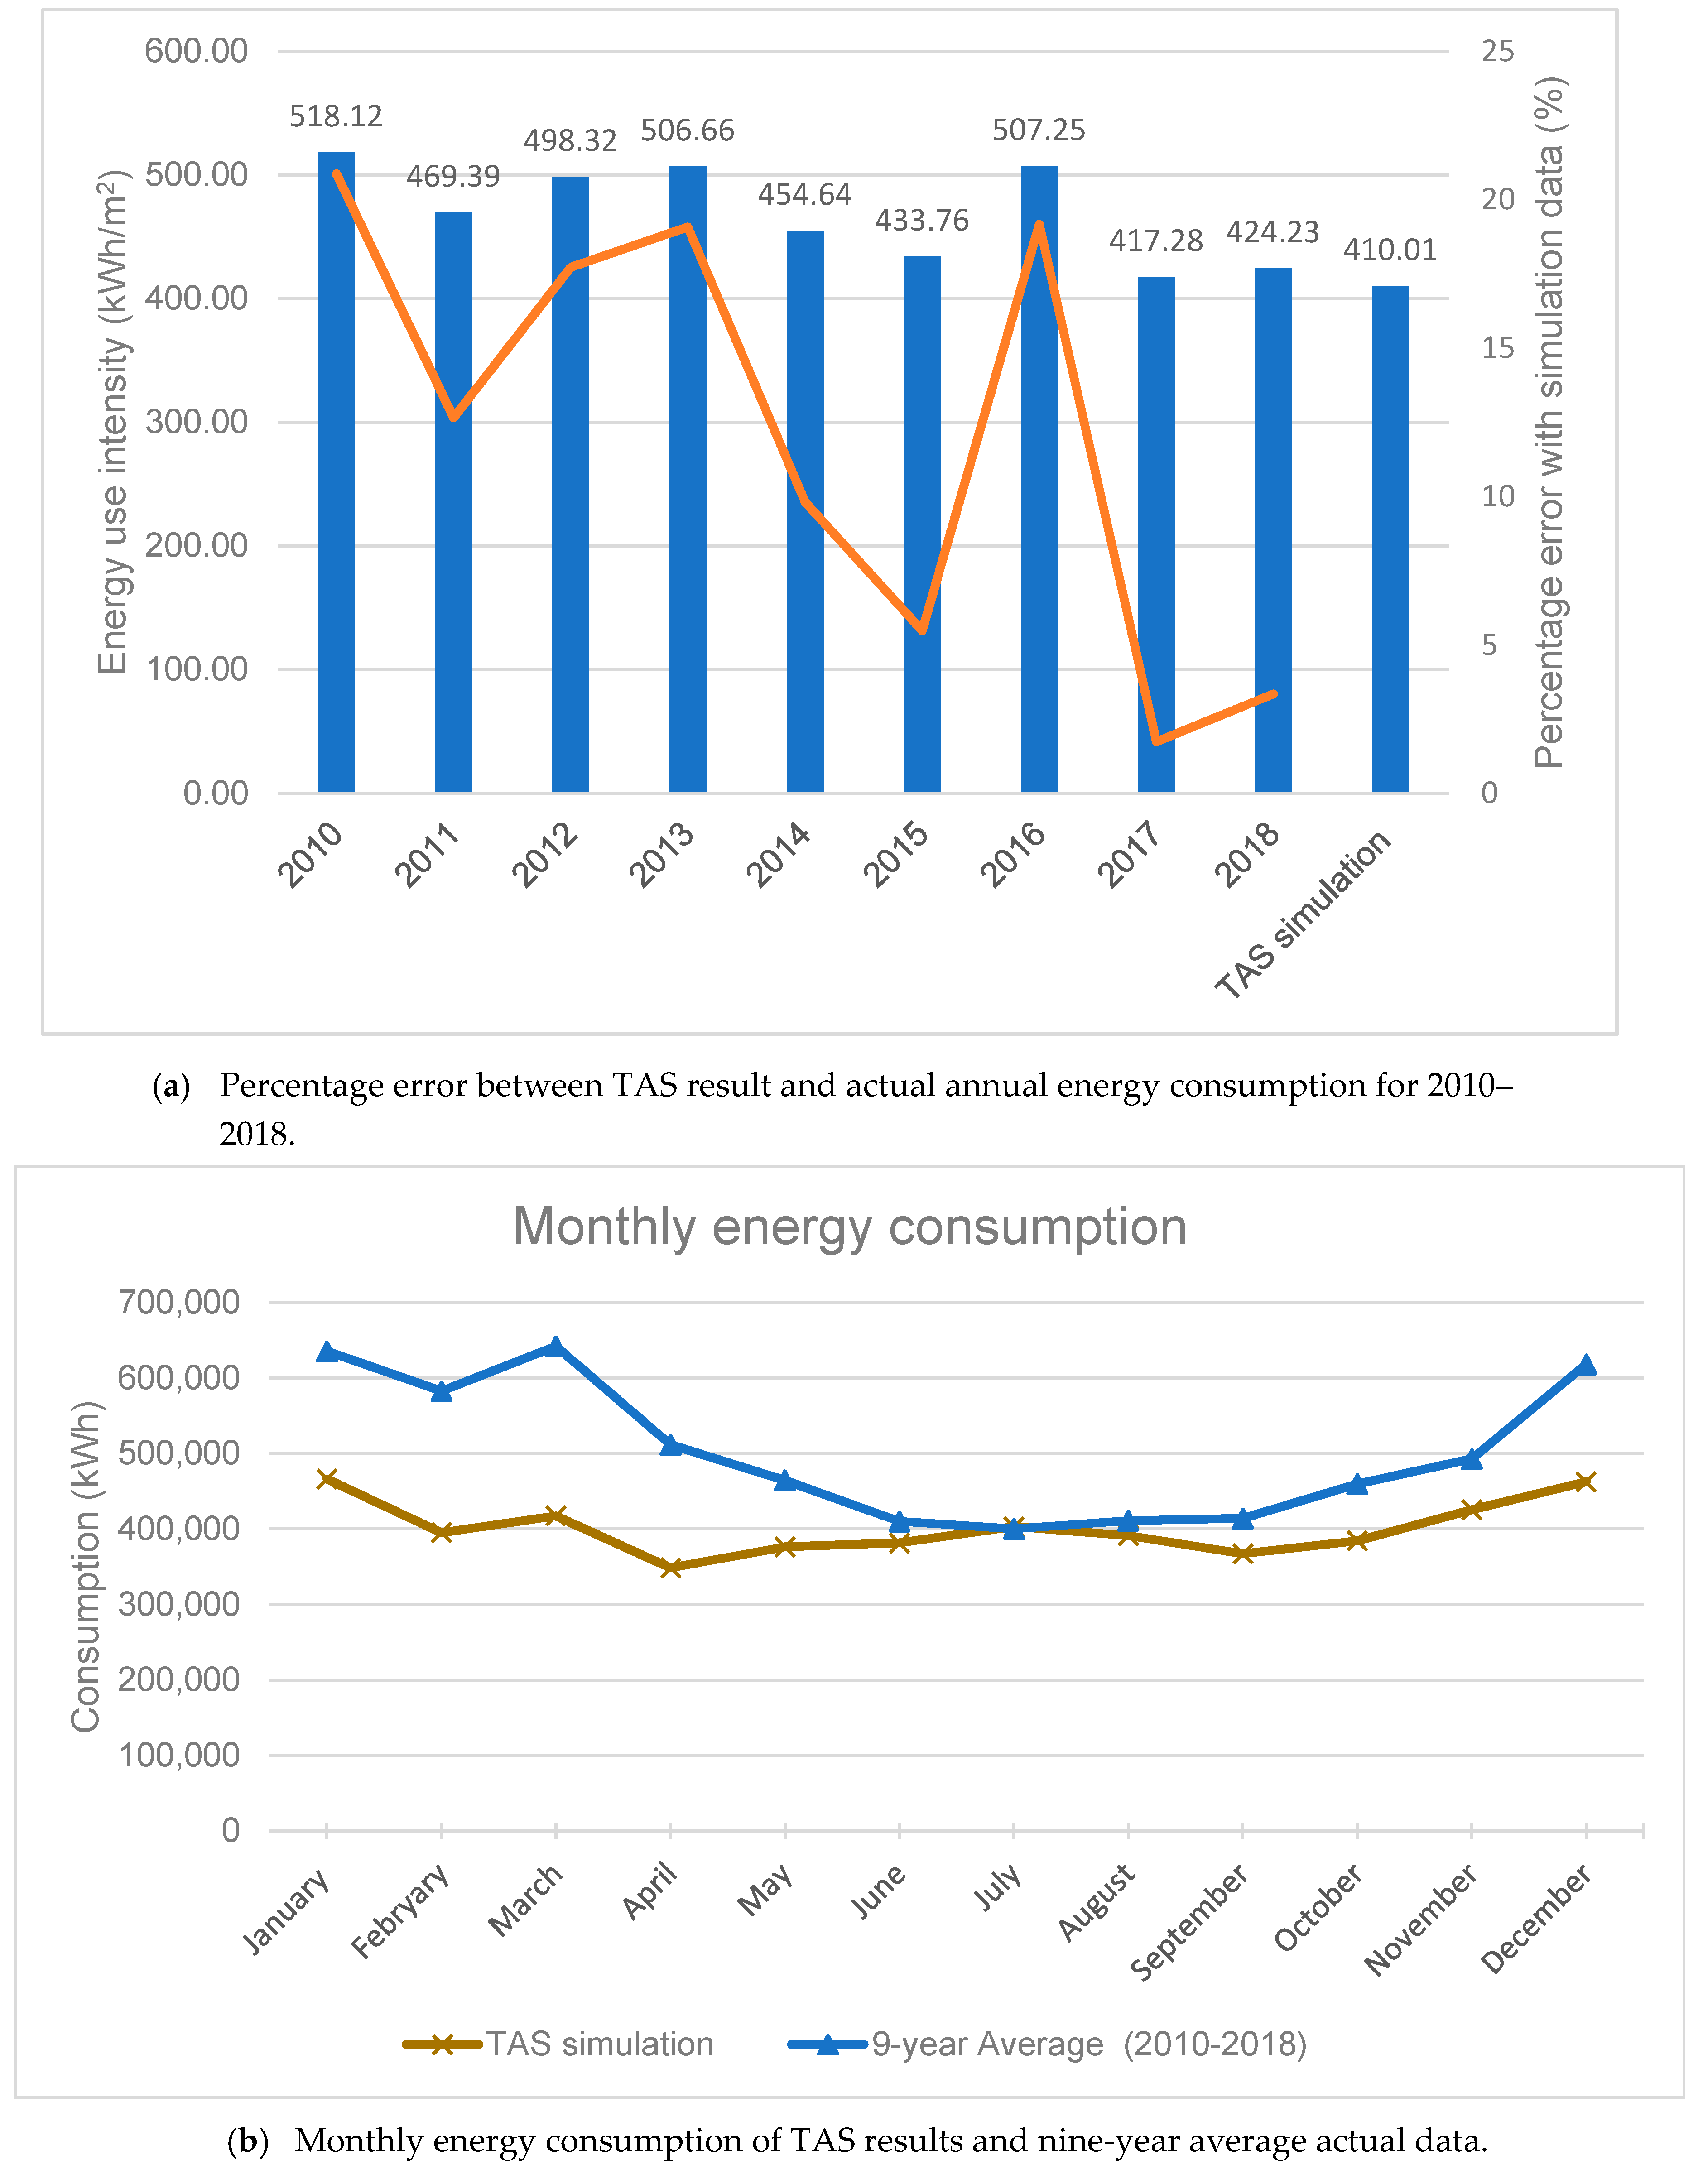
3.1. Validating the Simulation Results Against the Actual Data

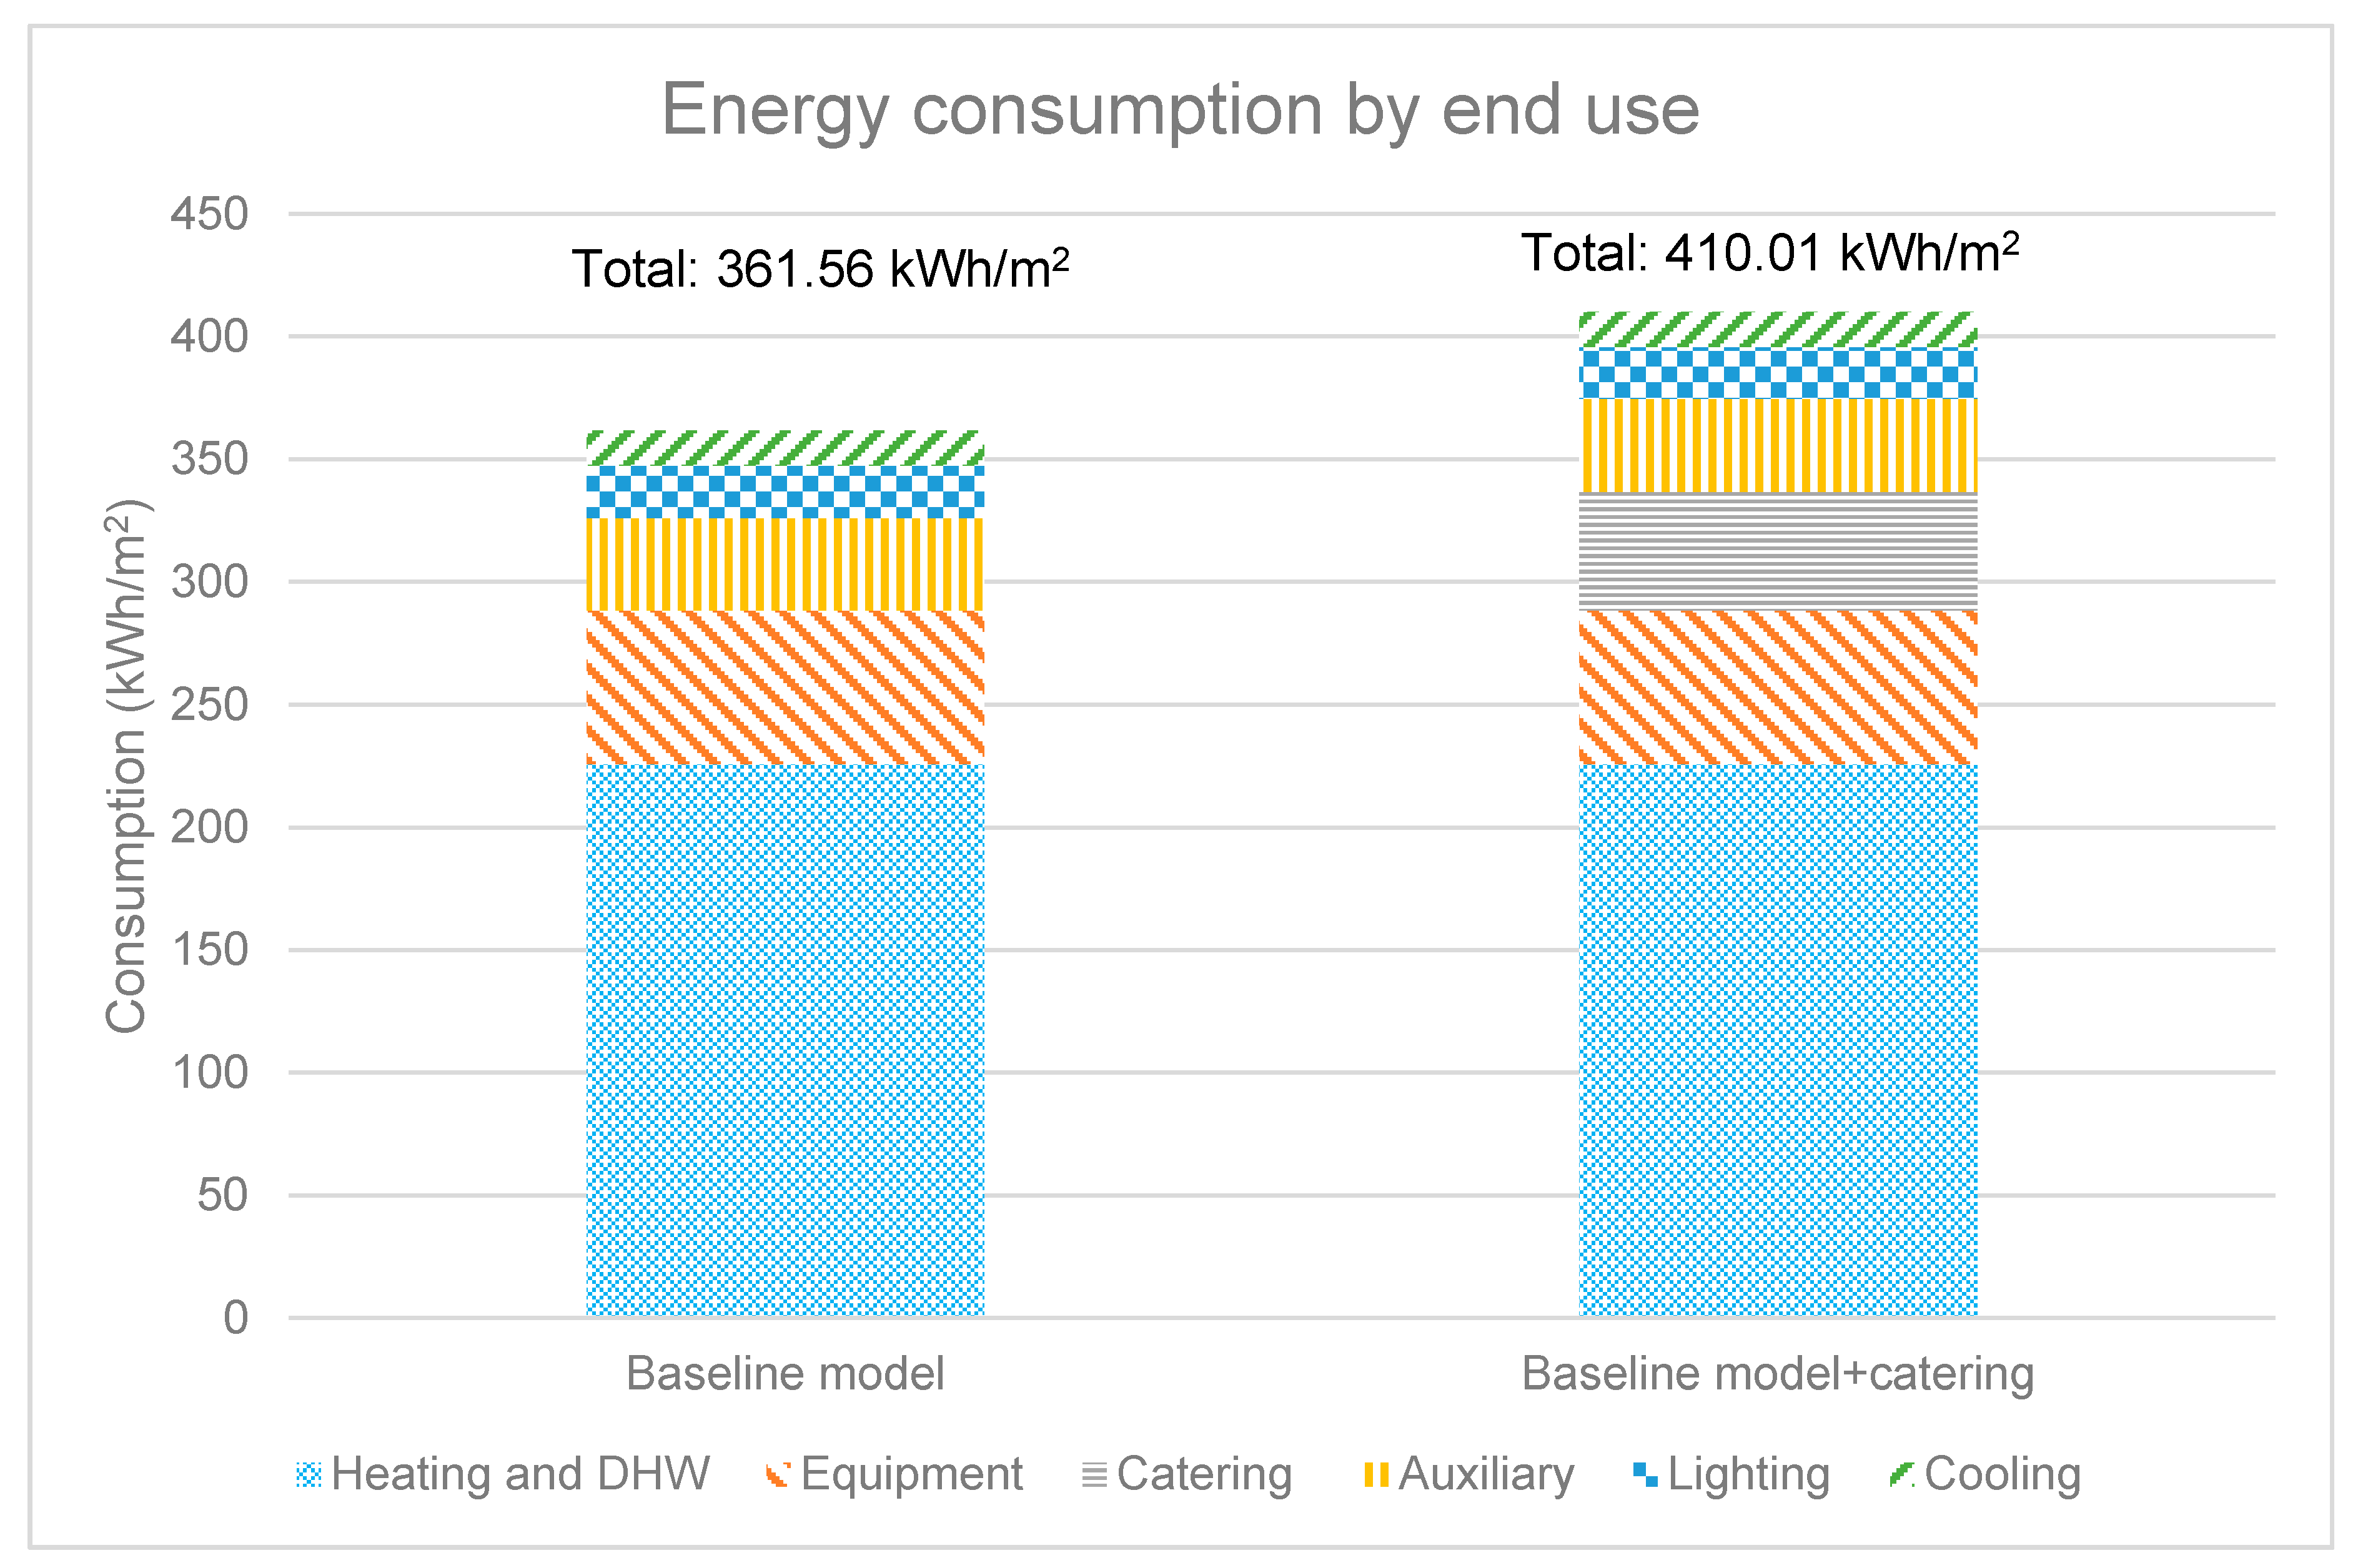
3.1.1. Baseline Model Energy Simulation

As mentioned earlier, the first step in the process of energy simulation is to investigate the energy consumption of the hotel in its existing form, prior to applying any retrofitting measure. TAS simulation accounts for heating, cooling, DHW, equipment, lighting, and auxiliary energy consumptions. In addition, simulation considers environmental energy consumption for catering activities—e.g., the lighting needed for cooking, without considering the energy used for food preparation. As it has been discussed thoroughly by [13,34], the operational catering energy consumption should be added to the TAS results, which is 2.54 kWh for fuel and 1.46 kWh for electricity per meal served in the hotel [35]. Figure 4 shows the energy consumption in the baseline model before and after adding the catering energy consumption, based on the actual number of meals served in the hotel.

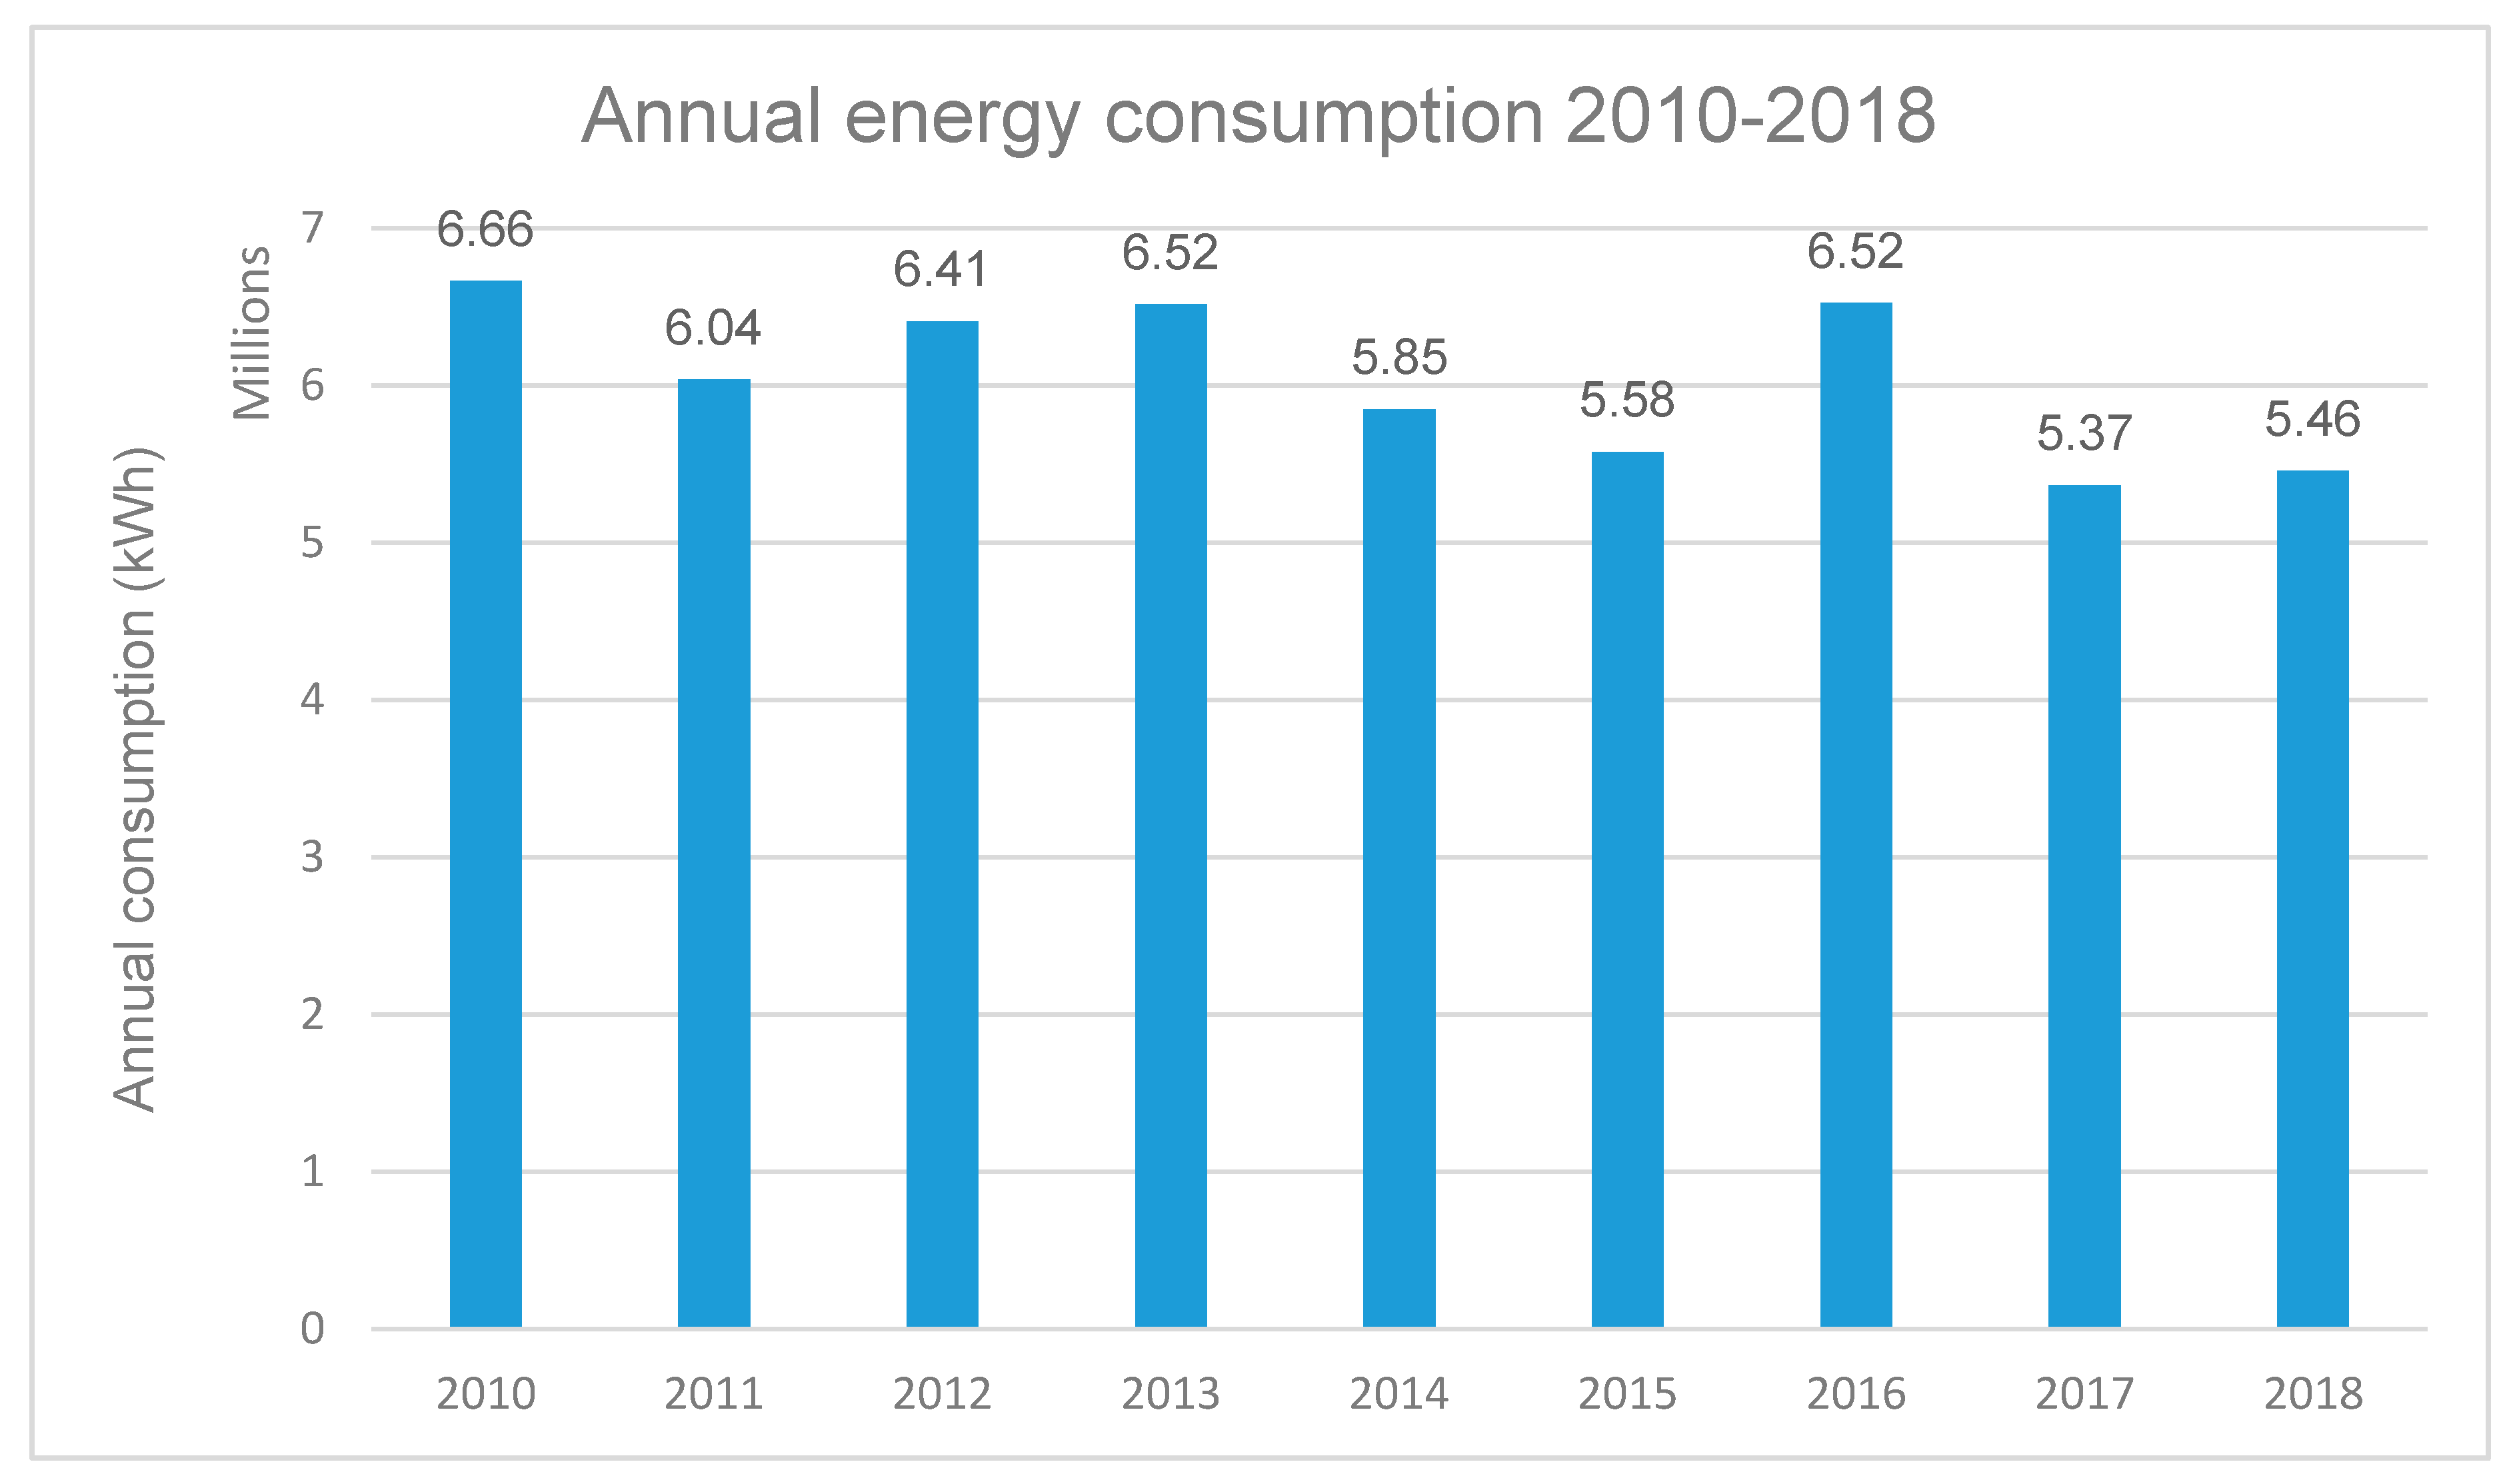
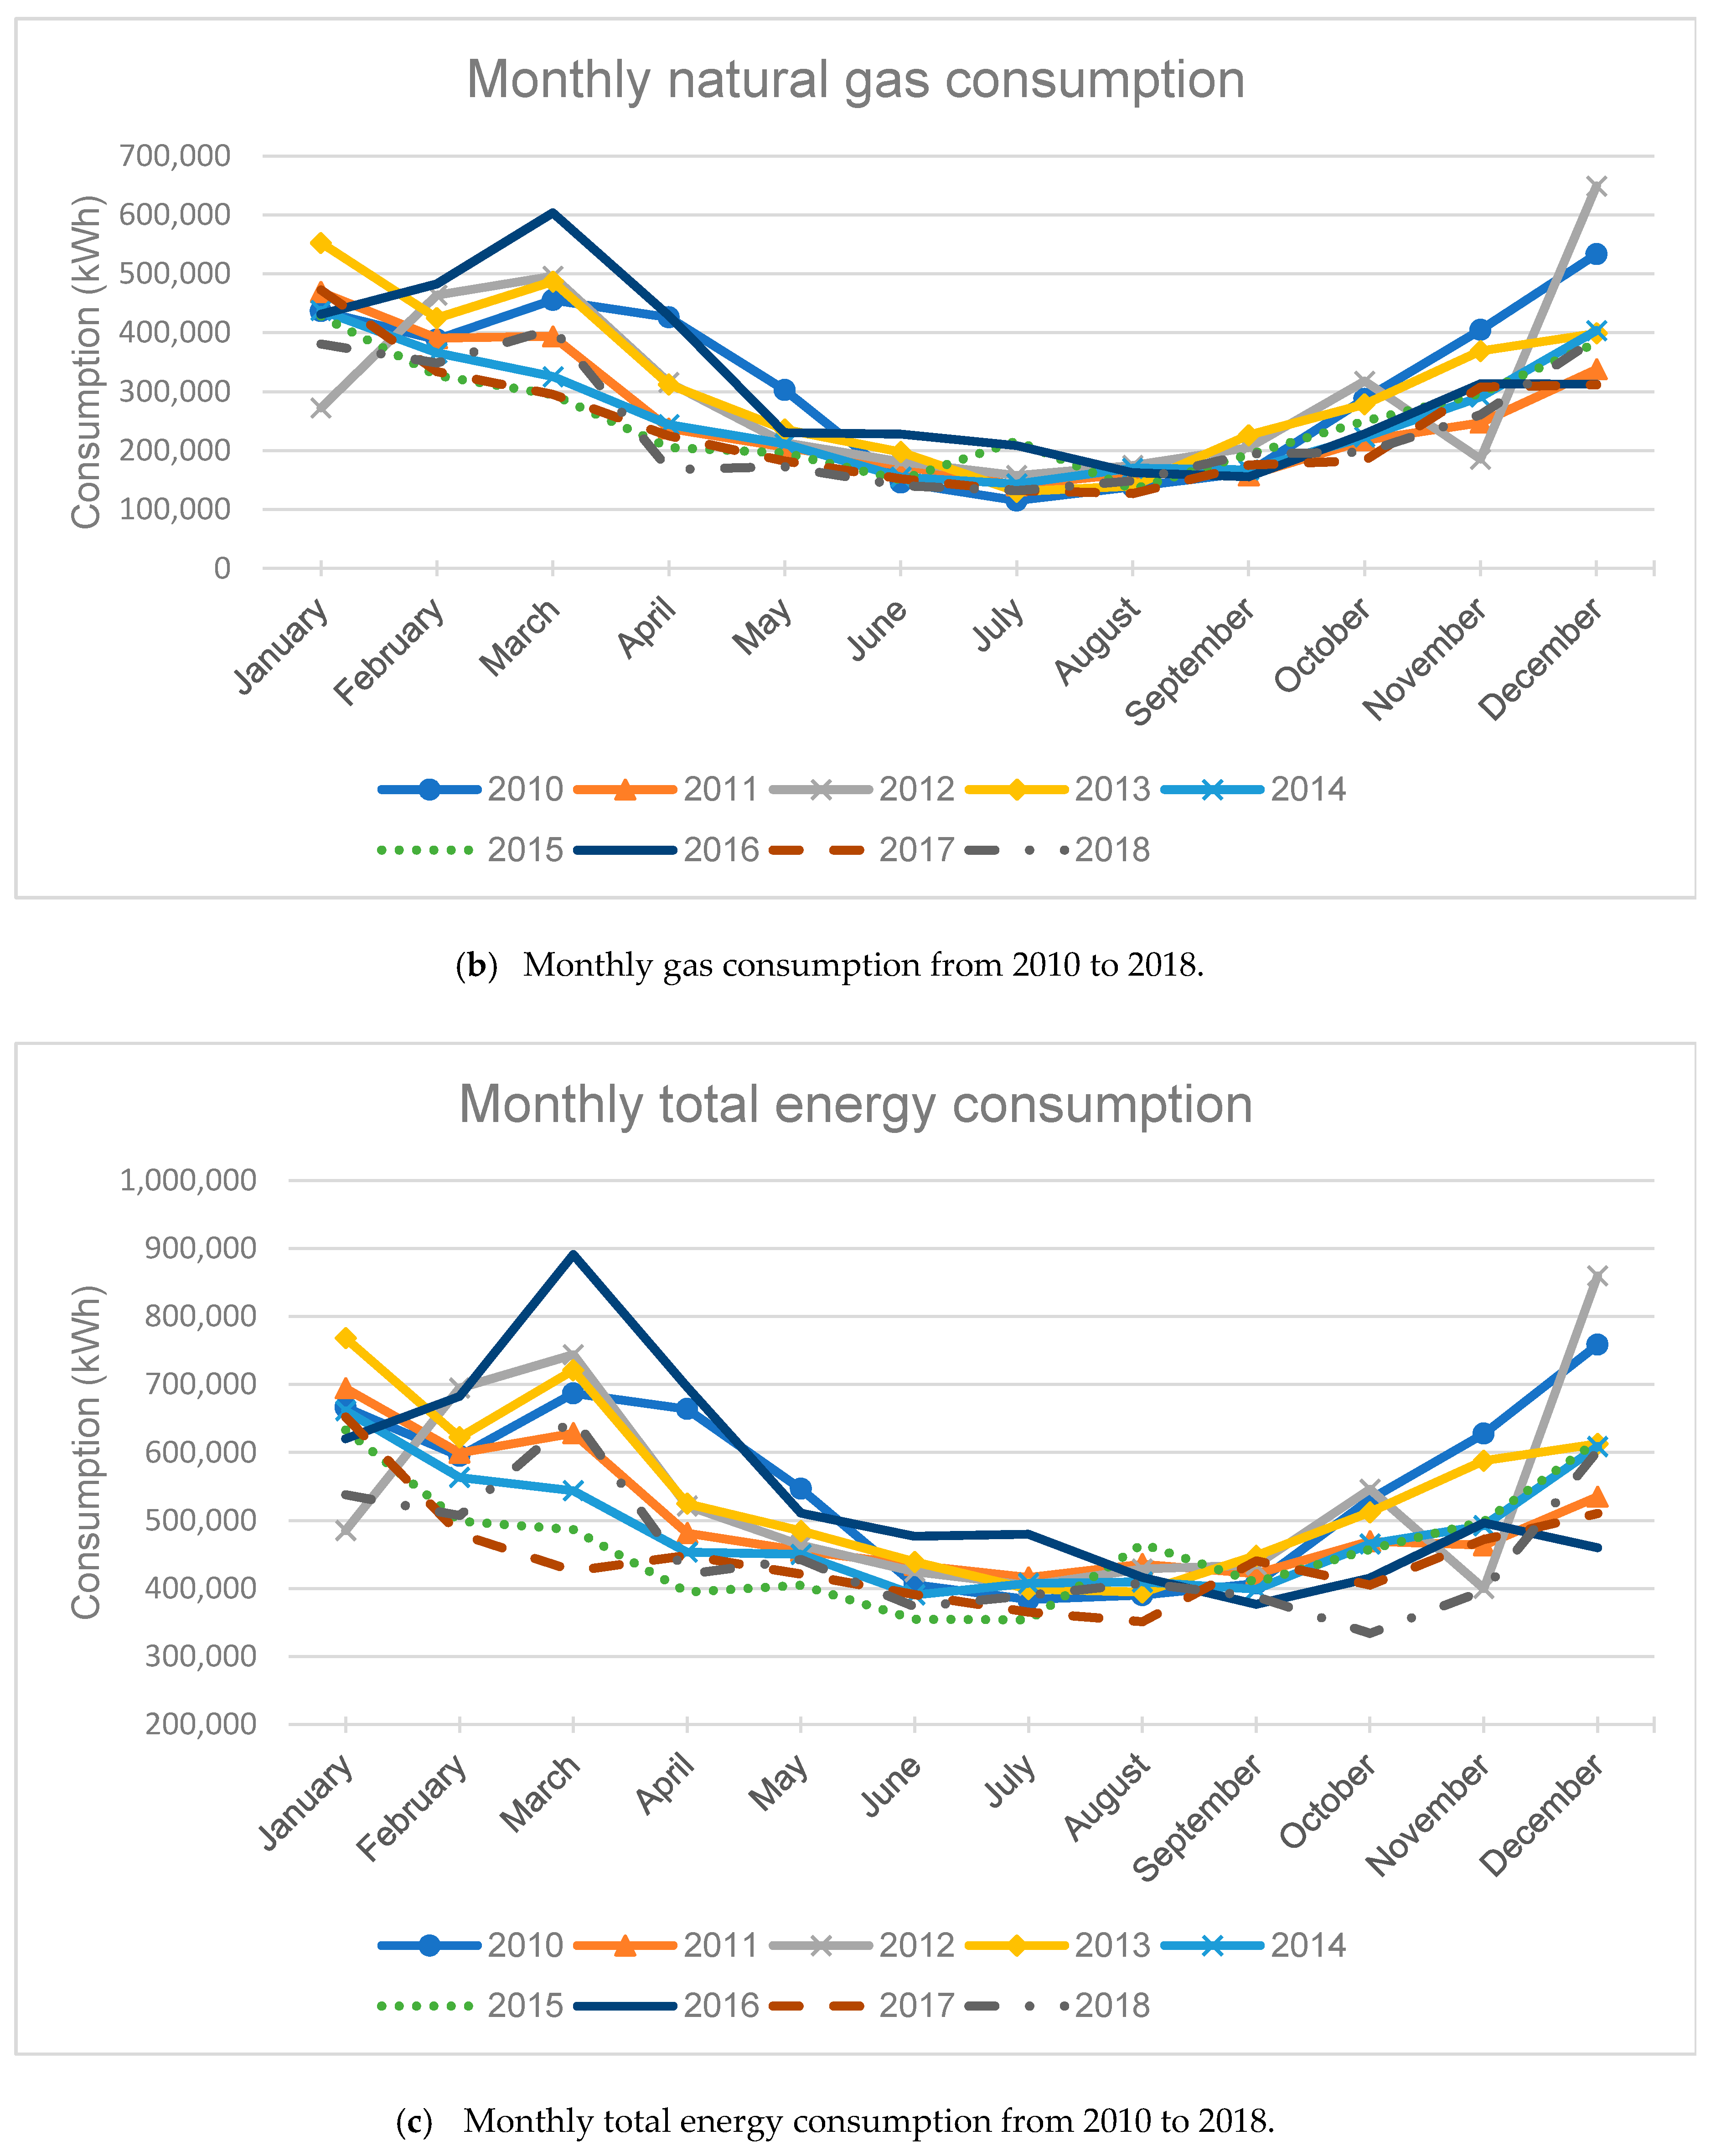
3.1.2. Actual Annual Consumption

As an important step in analysing and interpreting the data from a simulation tool, the energy consumption predicted by the software needs to be validated against the actual energy consumption data. The actual energy consumption varies from year to year (Figure 5).
Among different physical and operational elements that can affect energy consumption of a hotel—e.g., size, level of facilities, weather conditions, occupancy rate, and even thermal preference of the guests [36]—weather conditions and occupancy rates are most likely to change from one year to another. Looking at the monthly occupancy rate of the hotel during this period, Figure 6 shows that changes to occupancy rates of different years are similar, especially from 2012 onwards. Therefore, the changes in annual energy consumption cannot be attributed to occupancy rate, although there is a correlation between the two as demonstrated in Table 3. This is consistent with the literature, where it is suggested that the impact of occupancy rates on hotels’ energy consumption becomes obvious when there is significant changes to occupancy rate, and it goes well below 70% [37].
A close look at the monthly energy consumption and its breakdown into natural gas and electricity suggests that changes in monthly energy consumption have a significant similarity to those of gas consumptions, as opposed to the pattern of change in electricity consumption (Figure 7).
As the UK is a heating-dominant country, the strong impact of heating demand on the total energy consumption of the building is no surprise and can be demonstrated statistically. Table 4 shows the result of a regression analysis carried out to investigate the impact of heating degree days (HDDs) on total energy consumption. HDD is the measurement to quantify the demand for energy needed in order to heat a building based on the difference between a reference temperature (15.5 °C in the UK) and outdoor temperature [38]. Therefore, the weather conditions have a significant impact on the energy consumption of this hotel, which is consistent with the literature.

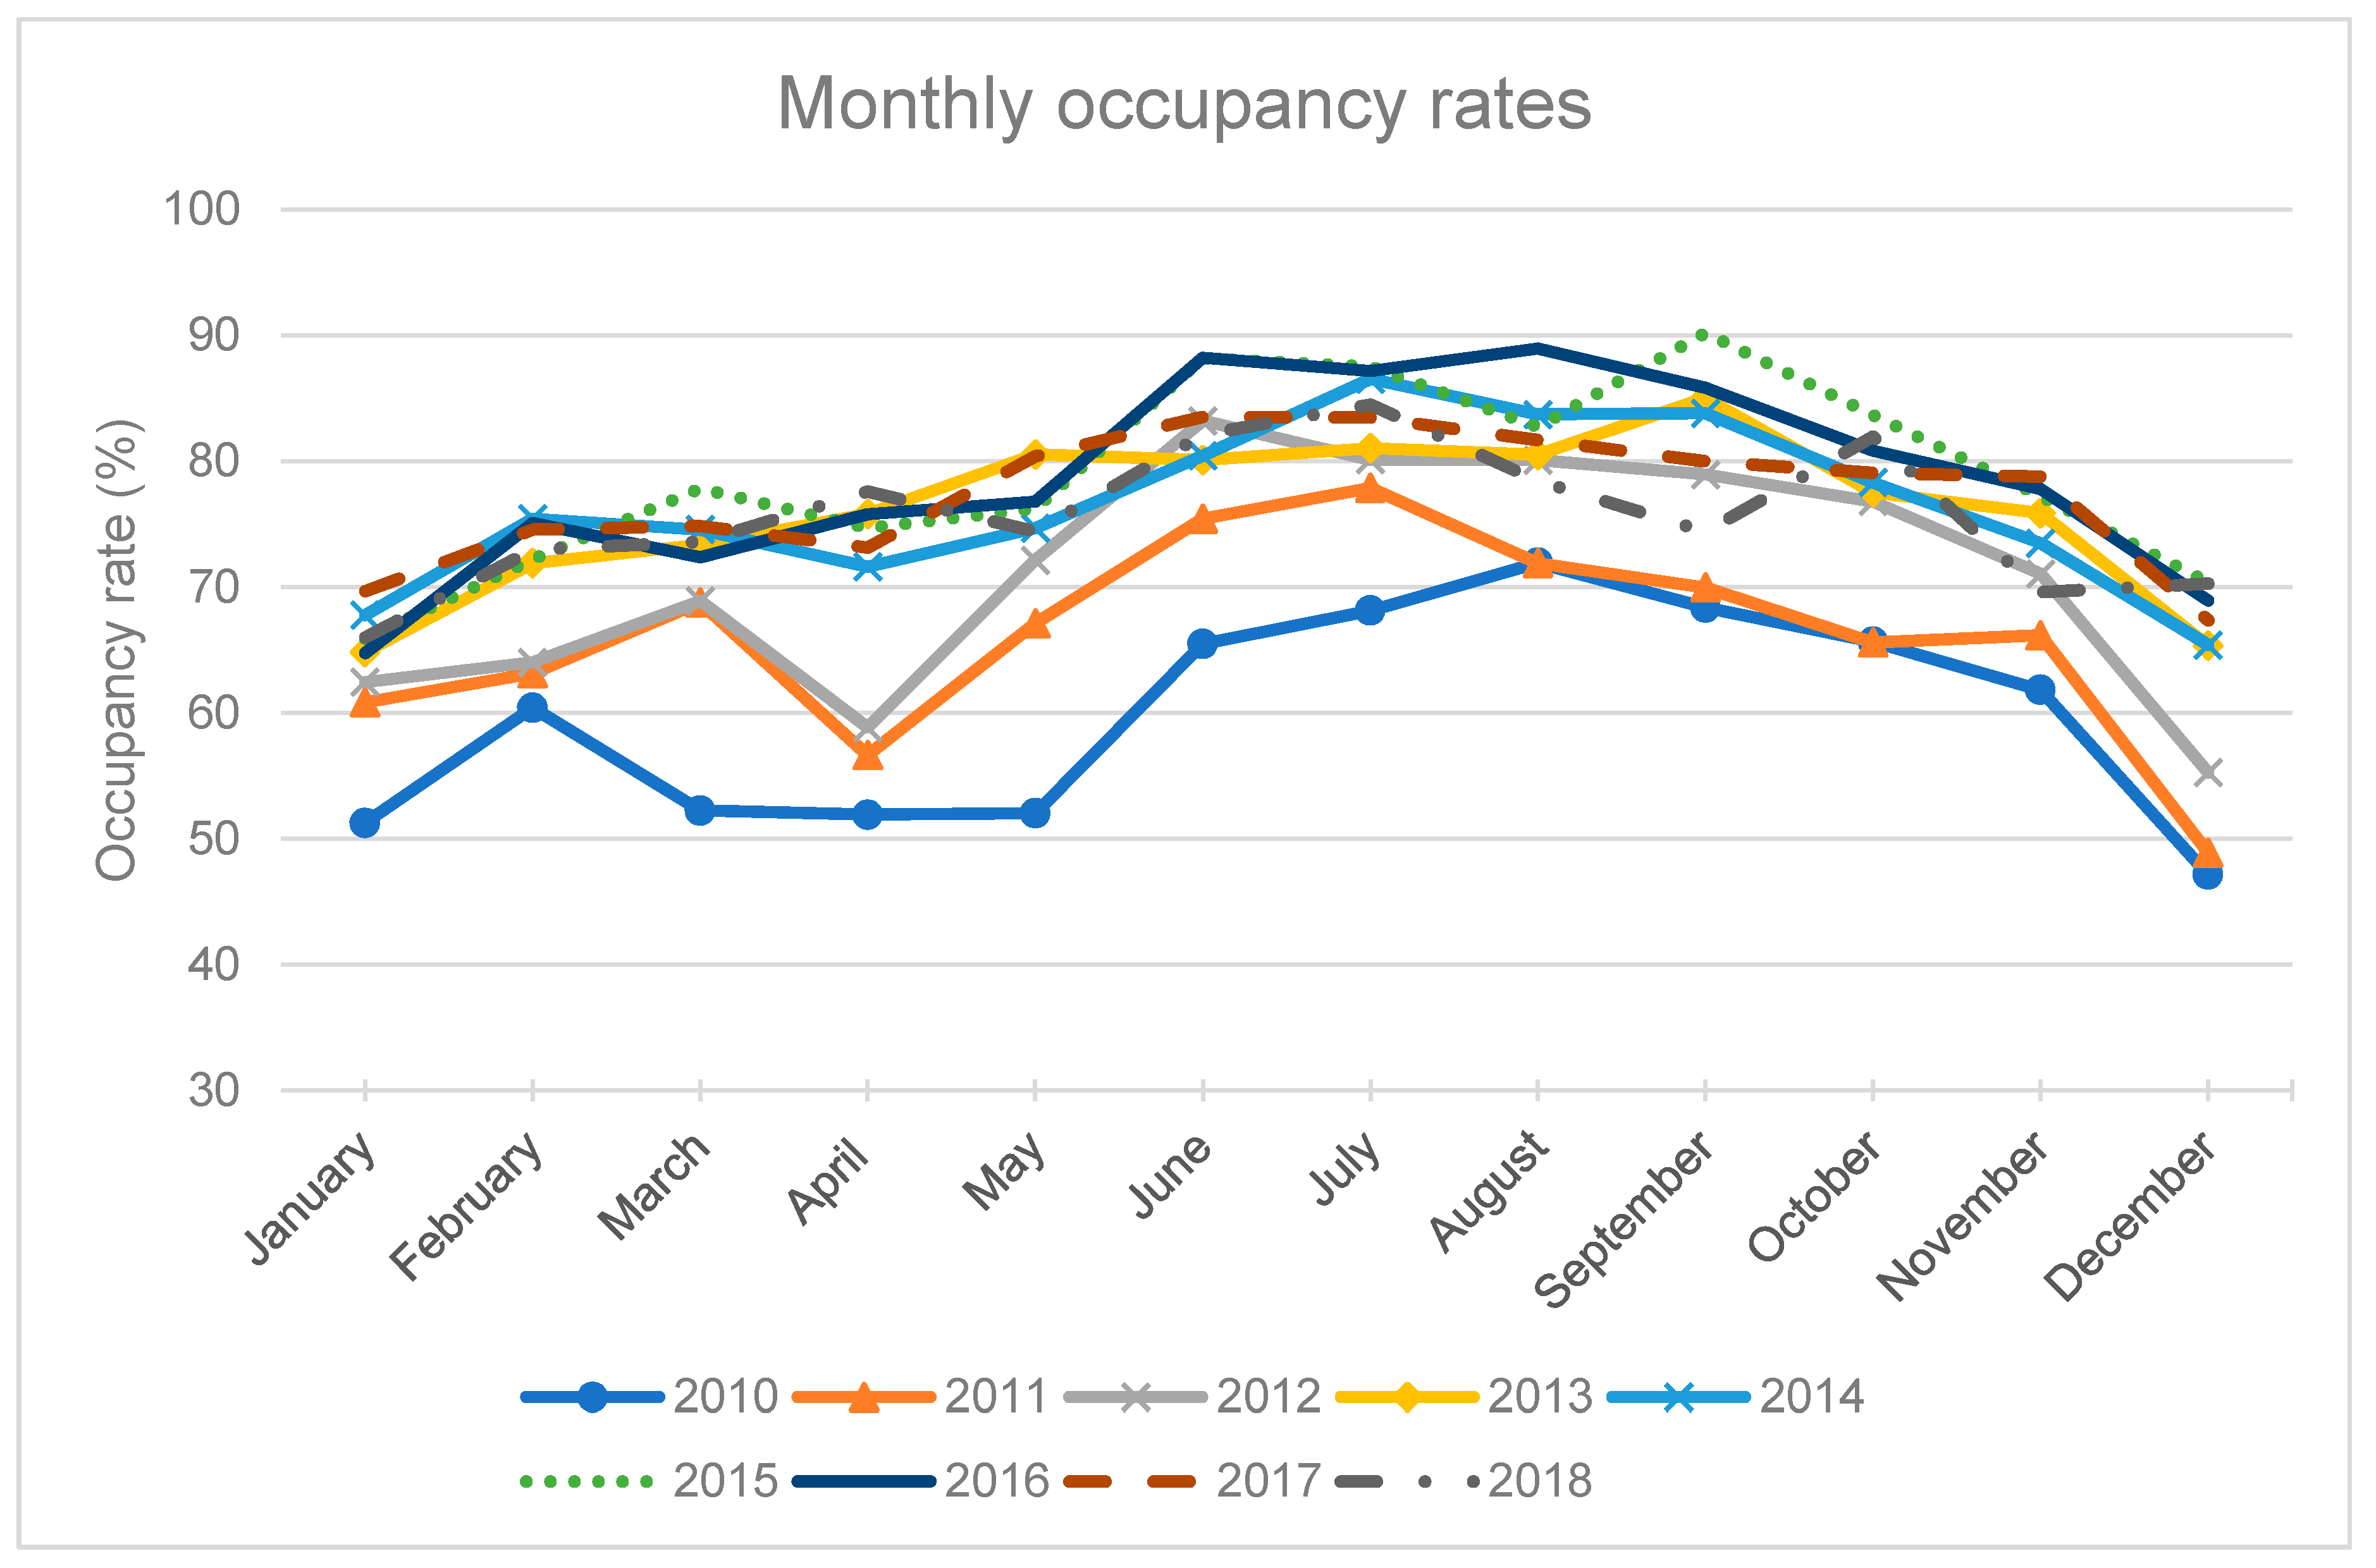
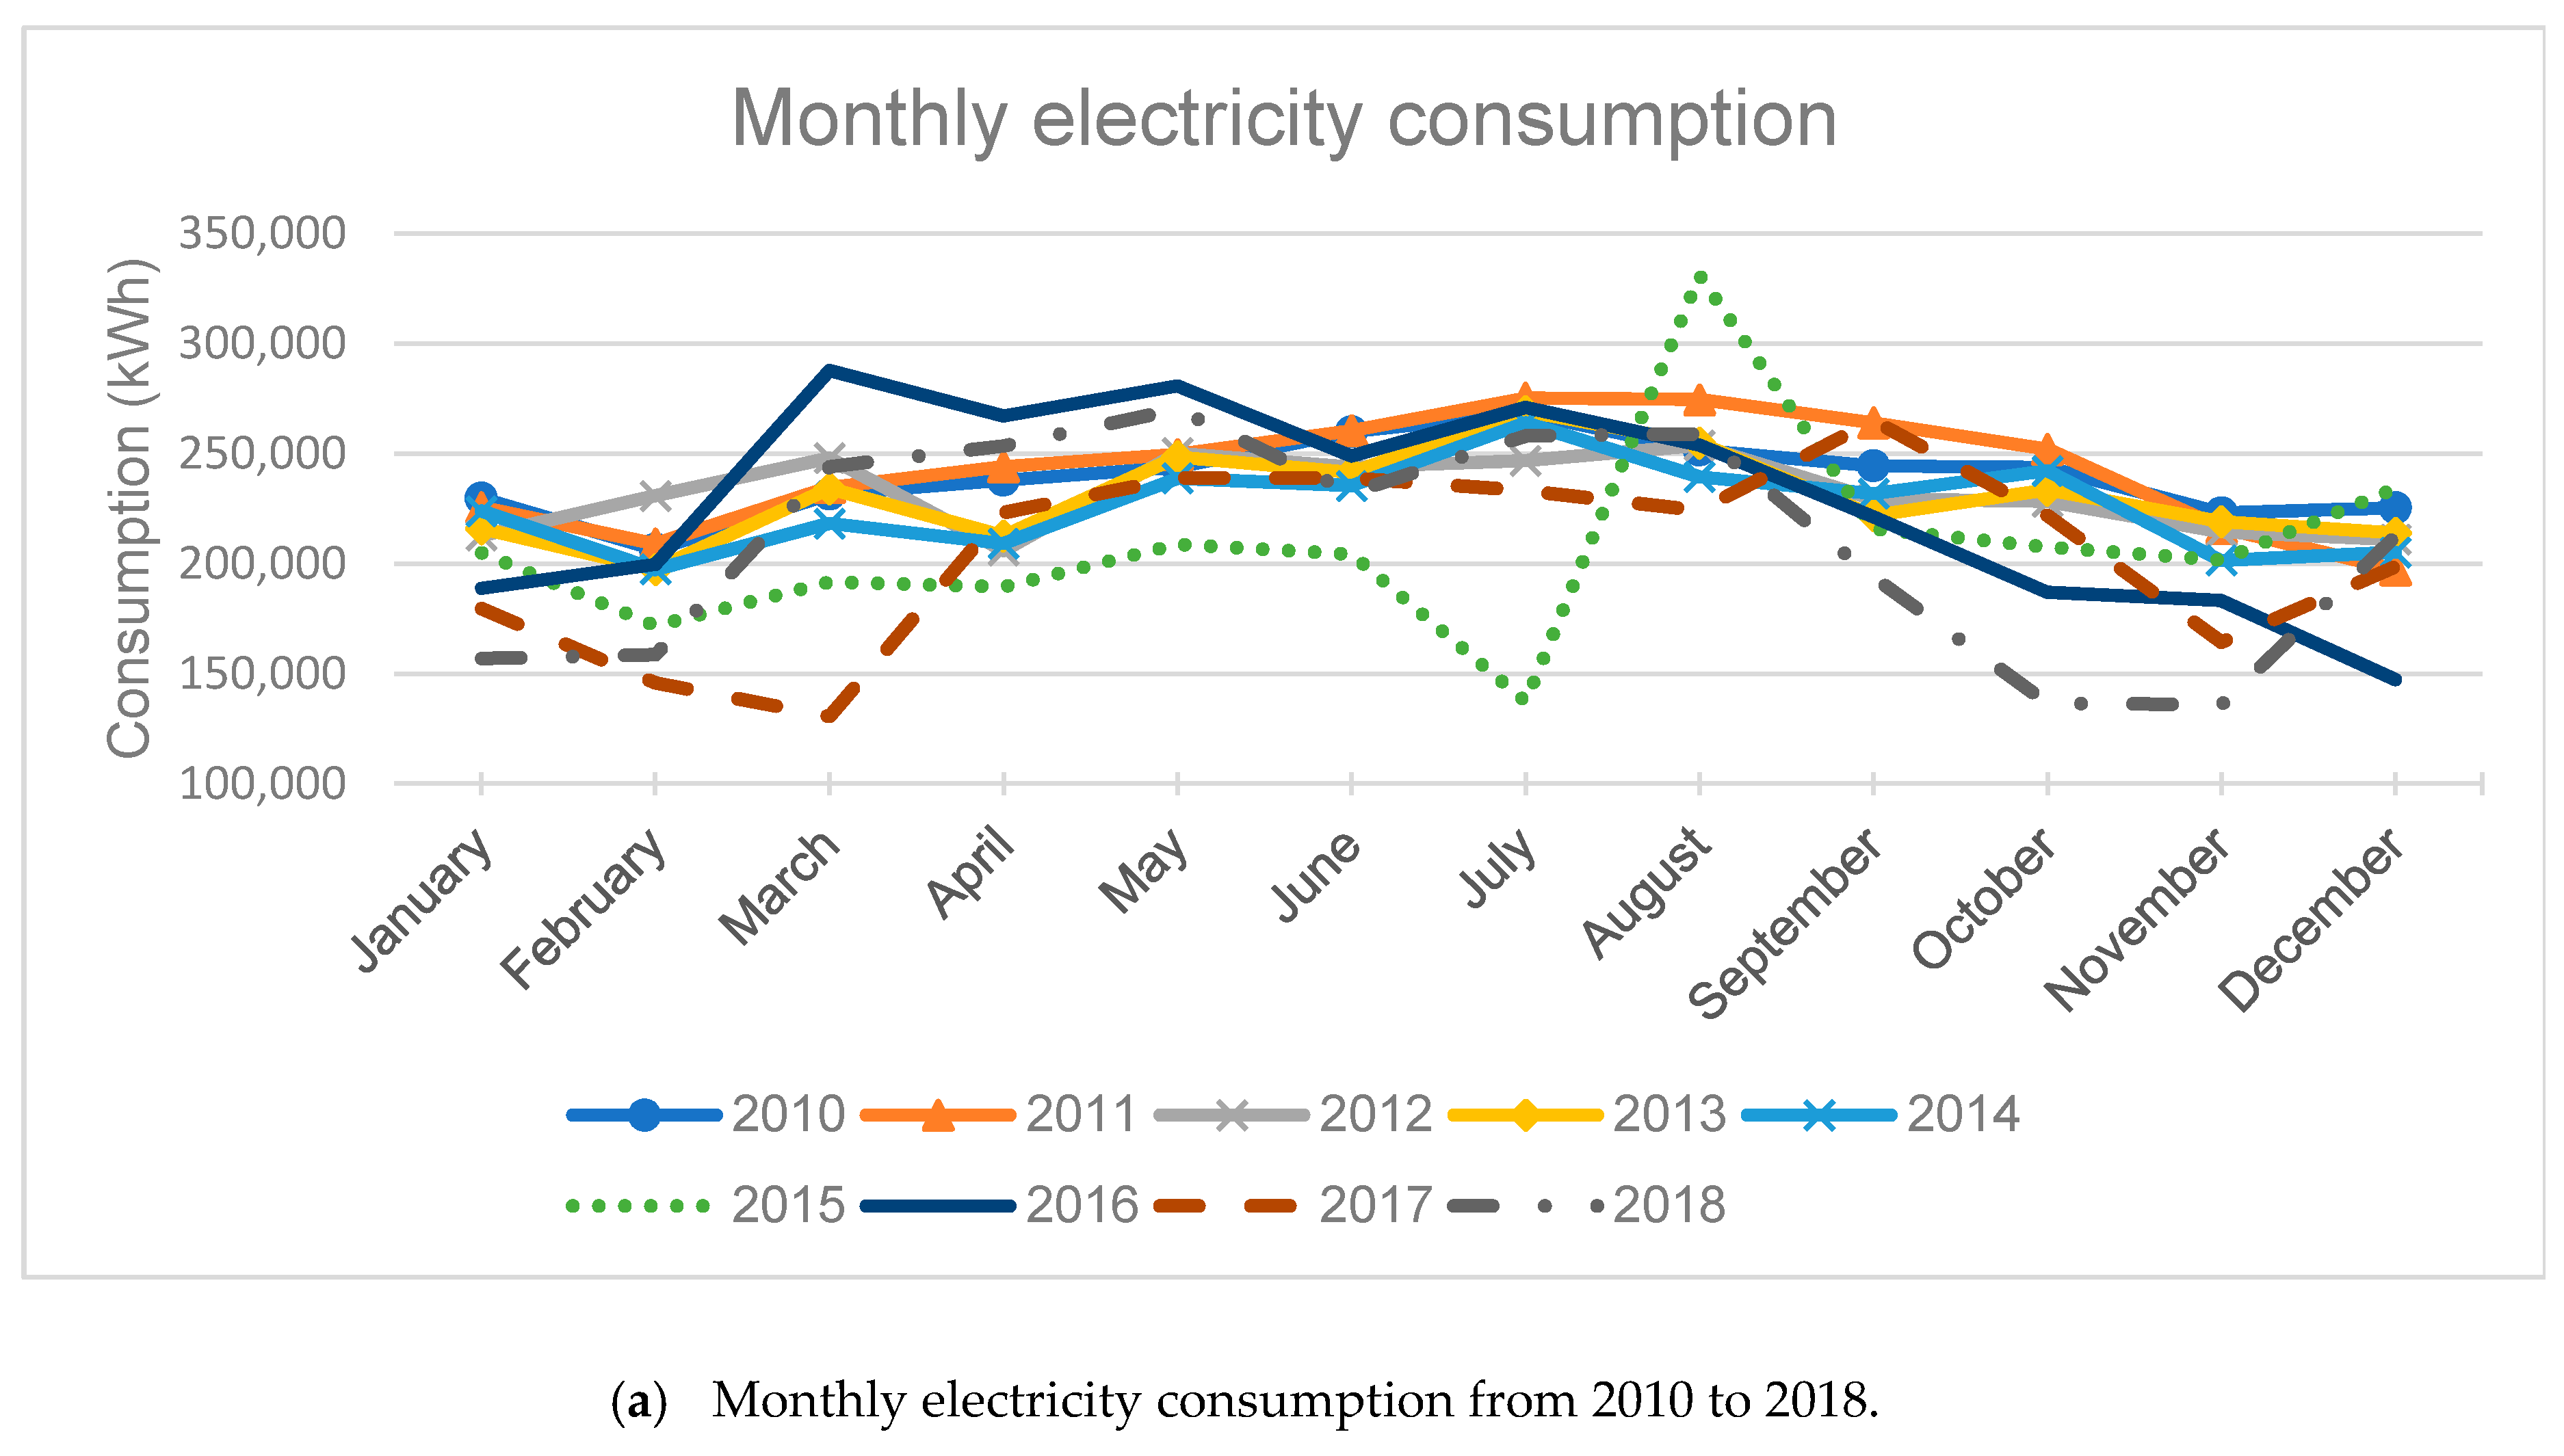
3.1.3. Choosing the Representative Data

As discussed in the previous section, if the hotel experiences extreme weather conditions, e.g., an extremely cold winter, the annual energy consumption of the hotel will increase accordingly. In a broader view, the energy consumption data for that extremely cold year may not be a proper representative of the annual energy consumption, which brings about the idea of using an average energy consumption of a time range for validating the simulation data rather than picking a random year. As shown in Figure 8a, the percentage error between TAS results and different years’ actual consumption ranges from below 5% up to above 20%. In the case of using the nine-year average consumption—from 2010 to 2018—the percentage error is around 12%. Figure 8b shows that the lines for TAS results and the average consumptions follow a very similar pattern.
The discrepancies in the direction of the lines during May–August in Figure 8b are attributable to the fact that TAS uses the London weather file where the summer temperatures tend to be higher compared to the actual situation in Reading (Figure 9). Therefore, TAS predicts a higher usage of air conditioning, which results in higher energy consumption for that period.

3.2. Model with Window Films

The results of the next step, applying the Thinsulate coatings on all external windows, are presented in this section. As mentioned earlier, due to its application as a retrofitting measure on an existing window, it is only practicable to apply the coating on the internal surface of the inner pane (see Figure 3). However, another set of modelling and simulation was carried out to investigate the results of having the same Low-E coating on the internal surface of the outer pane (alternative 2 of Figure 3). Therefore, the graphs in this section demonstrate the results of three models:
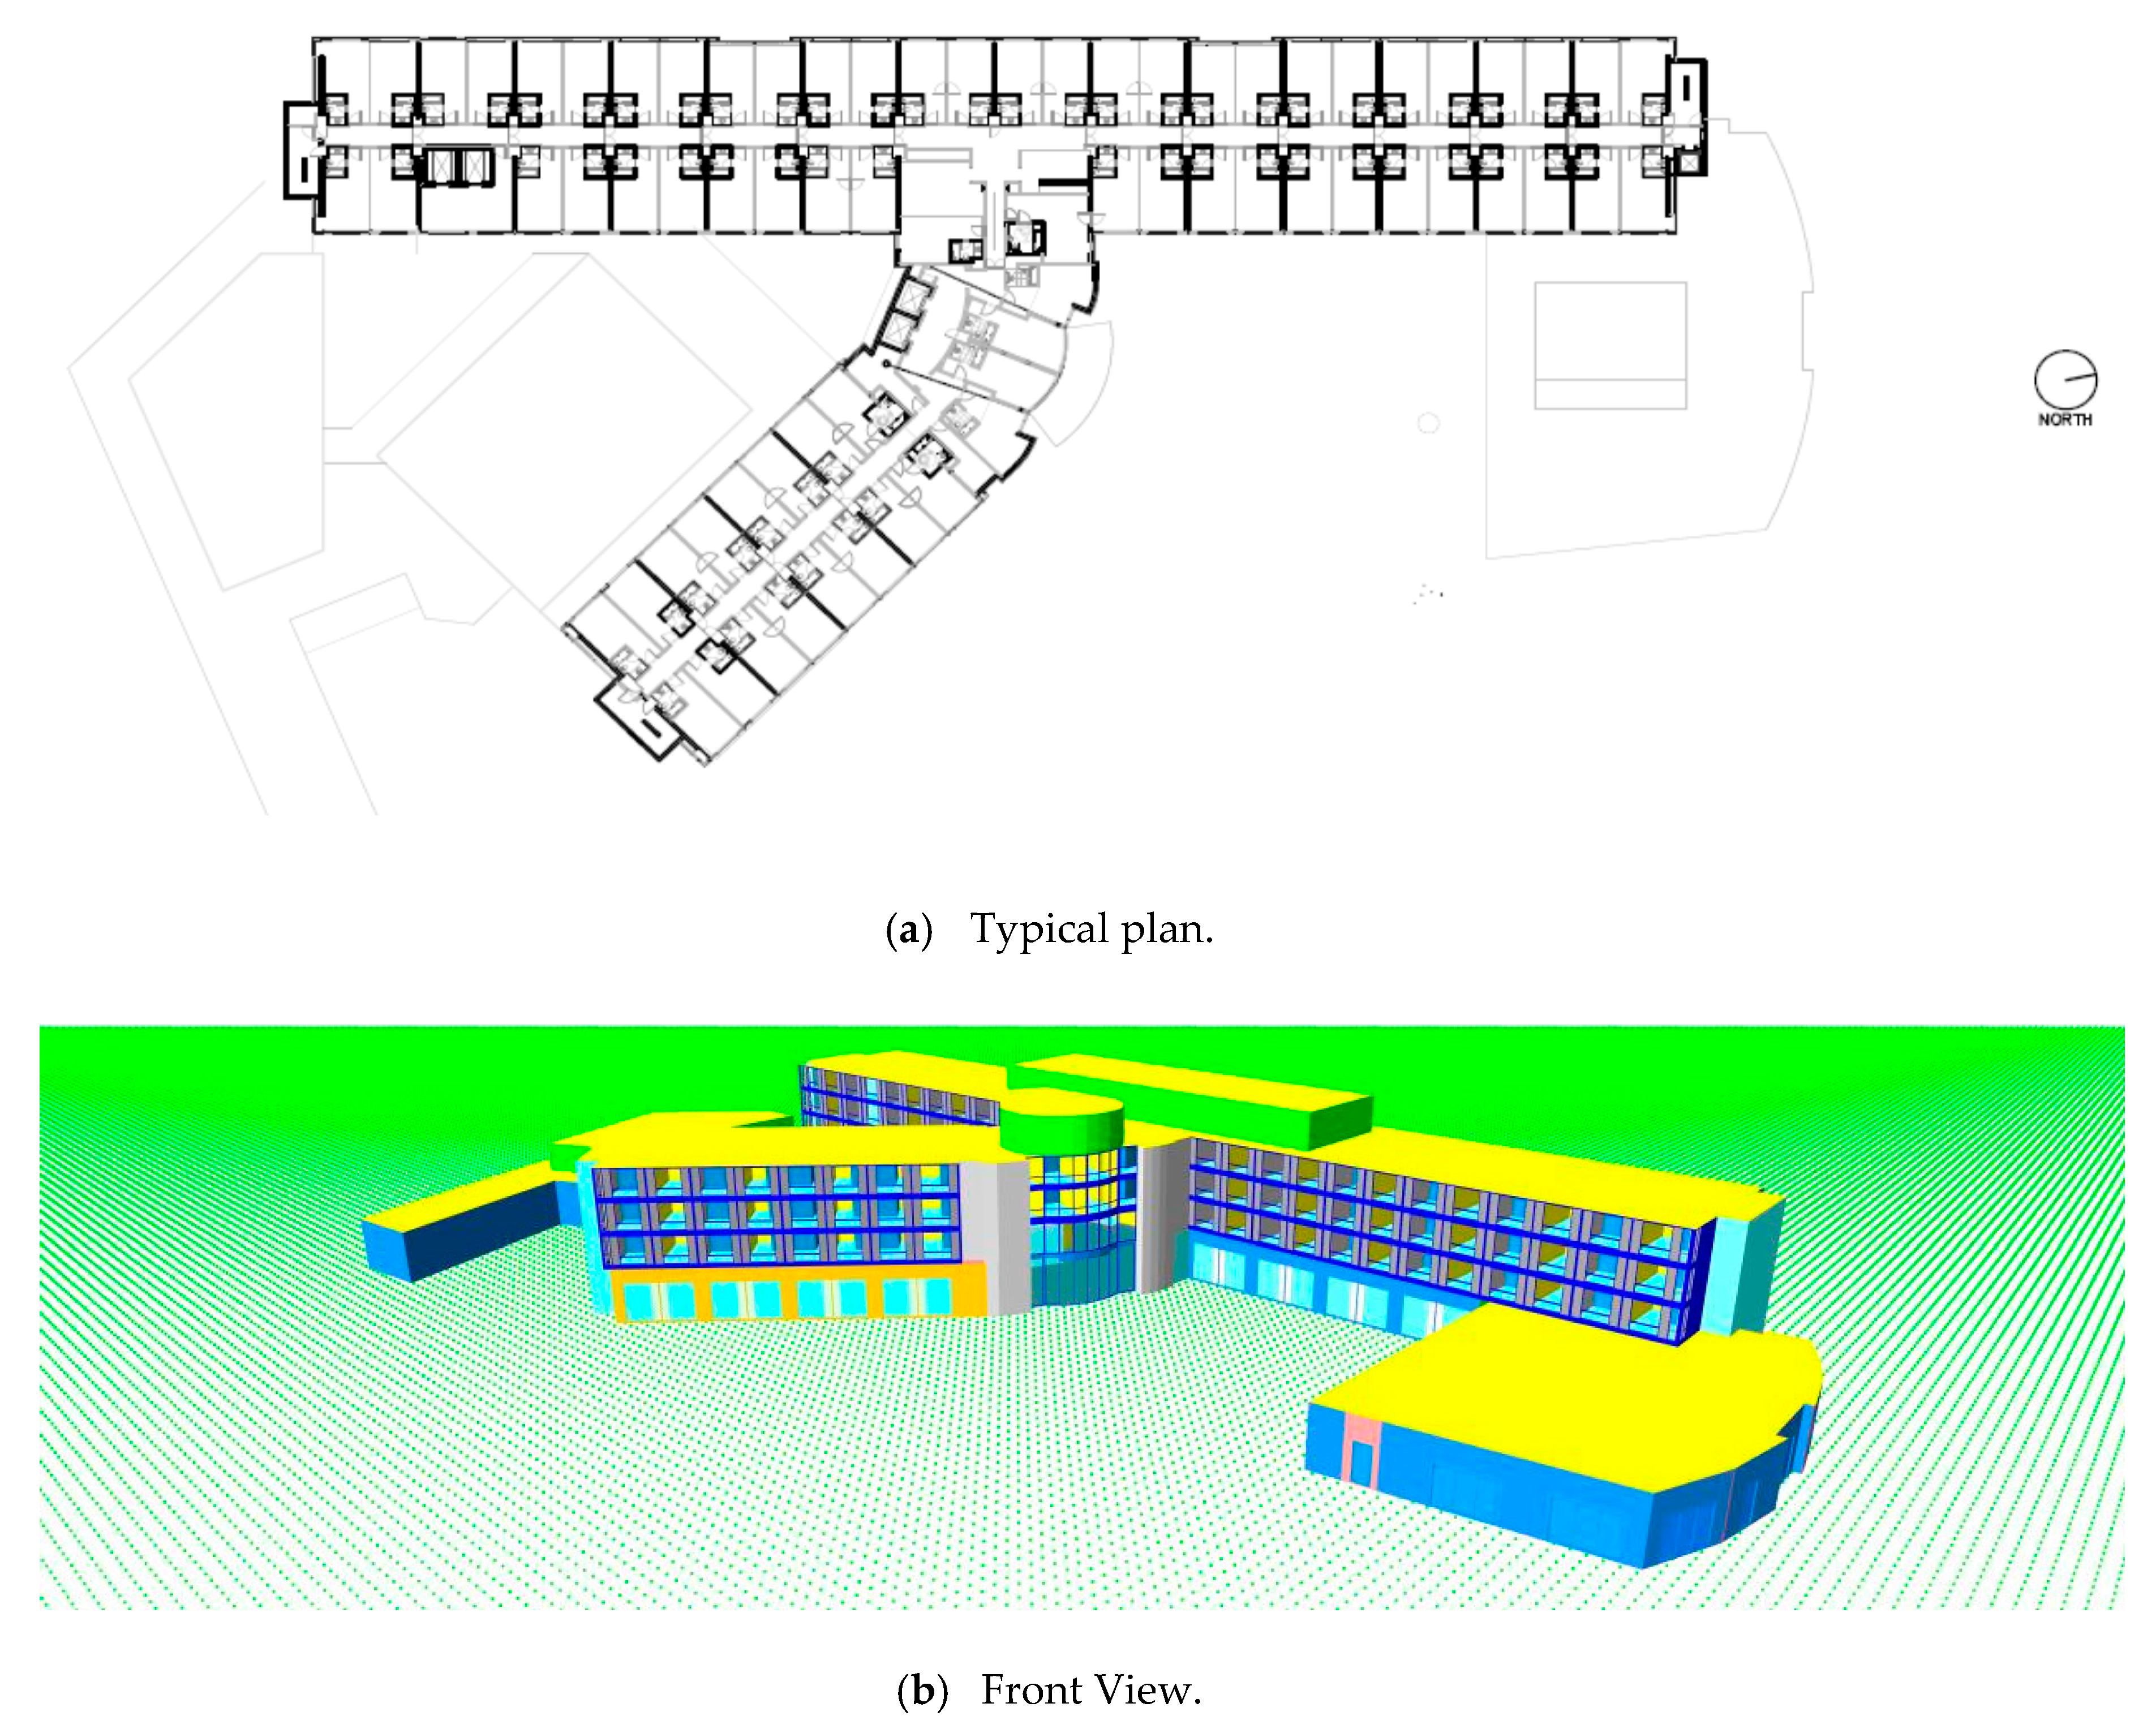
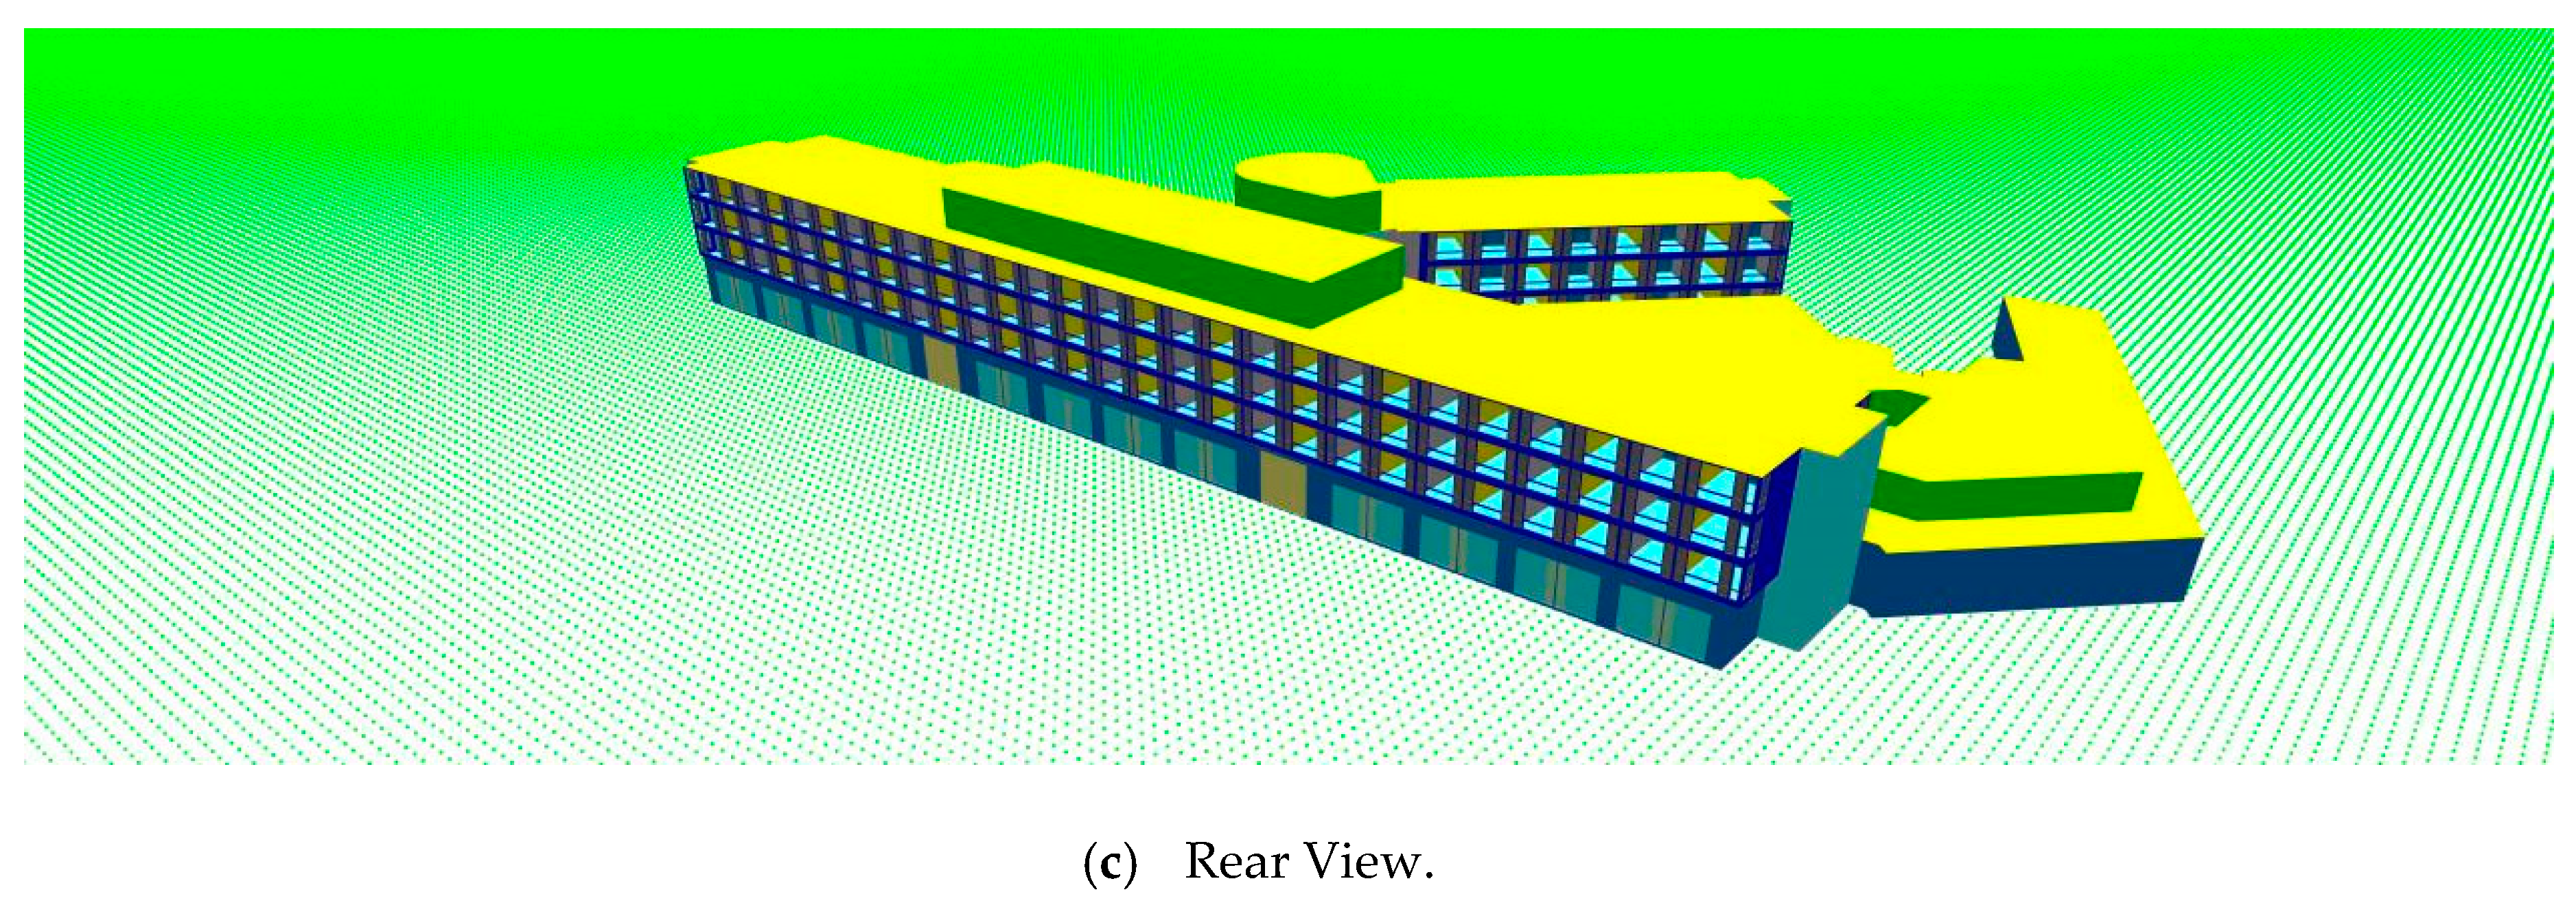
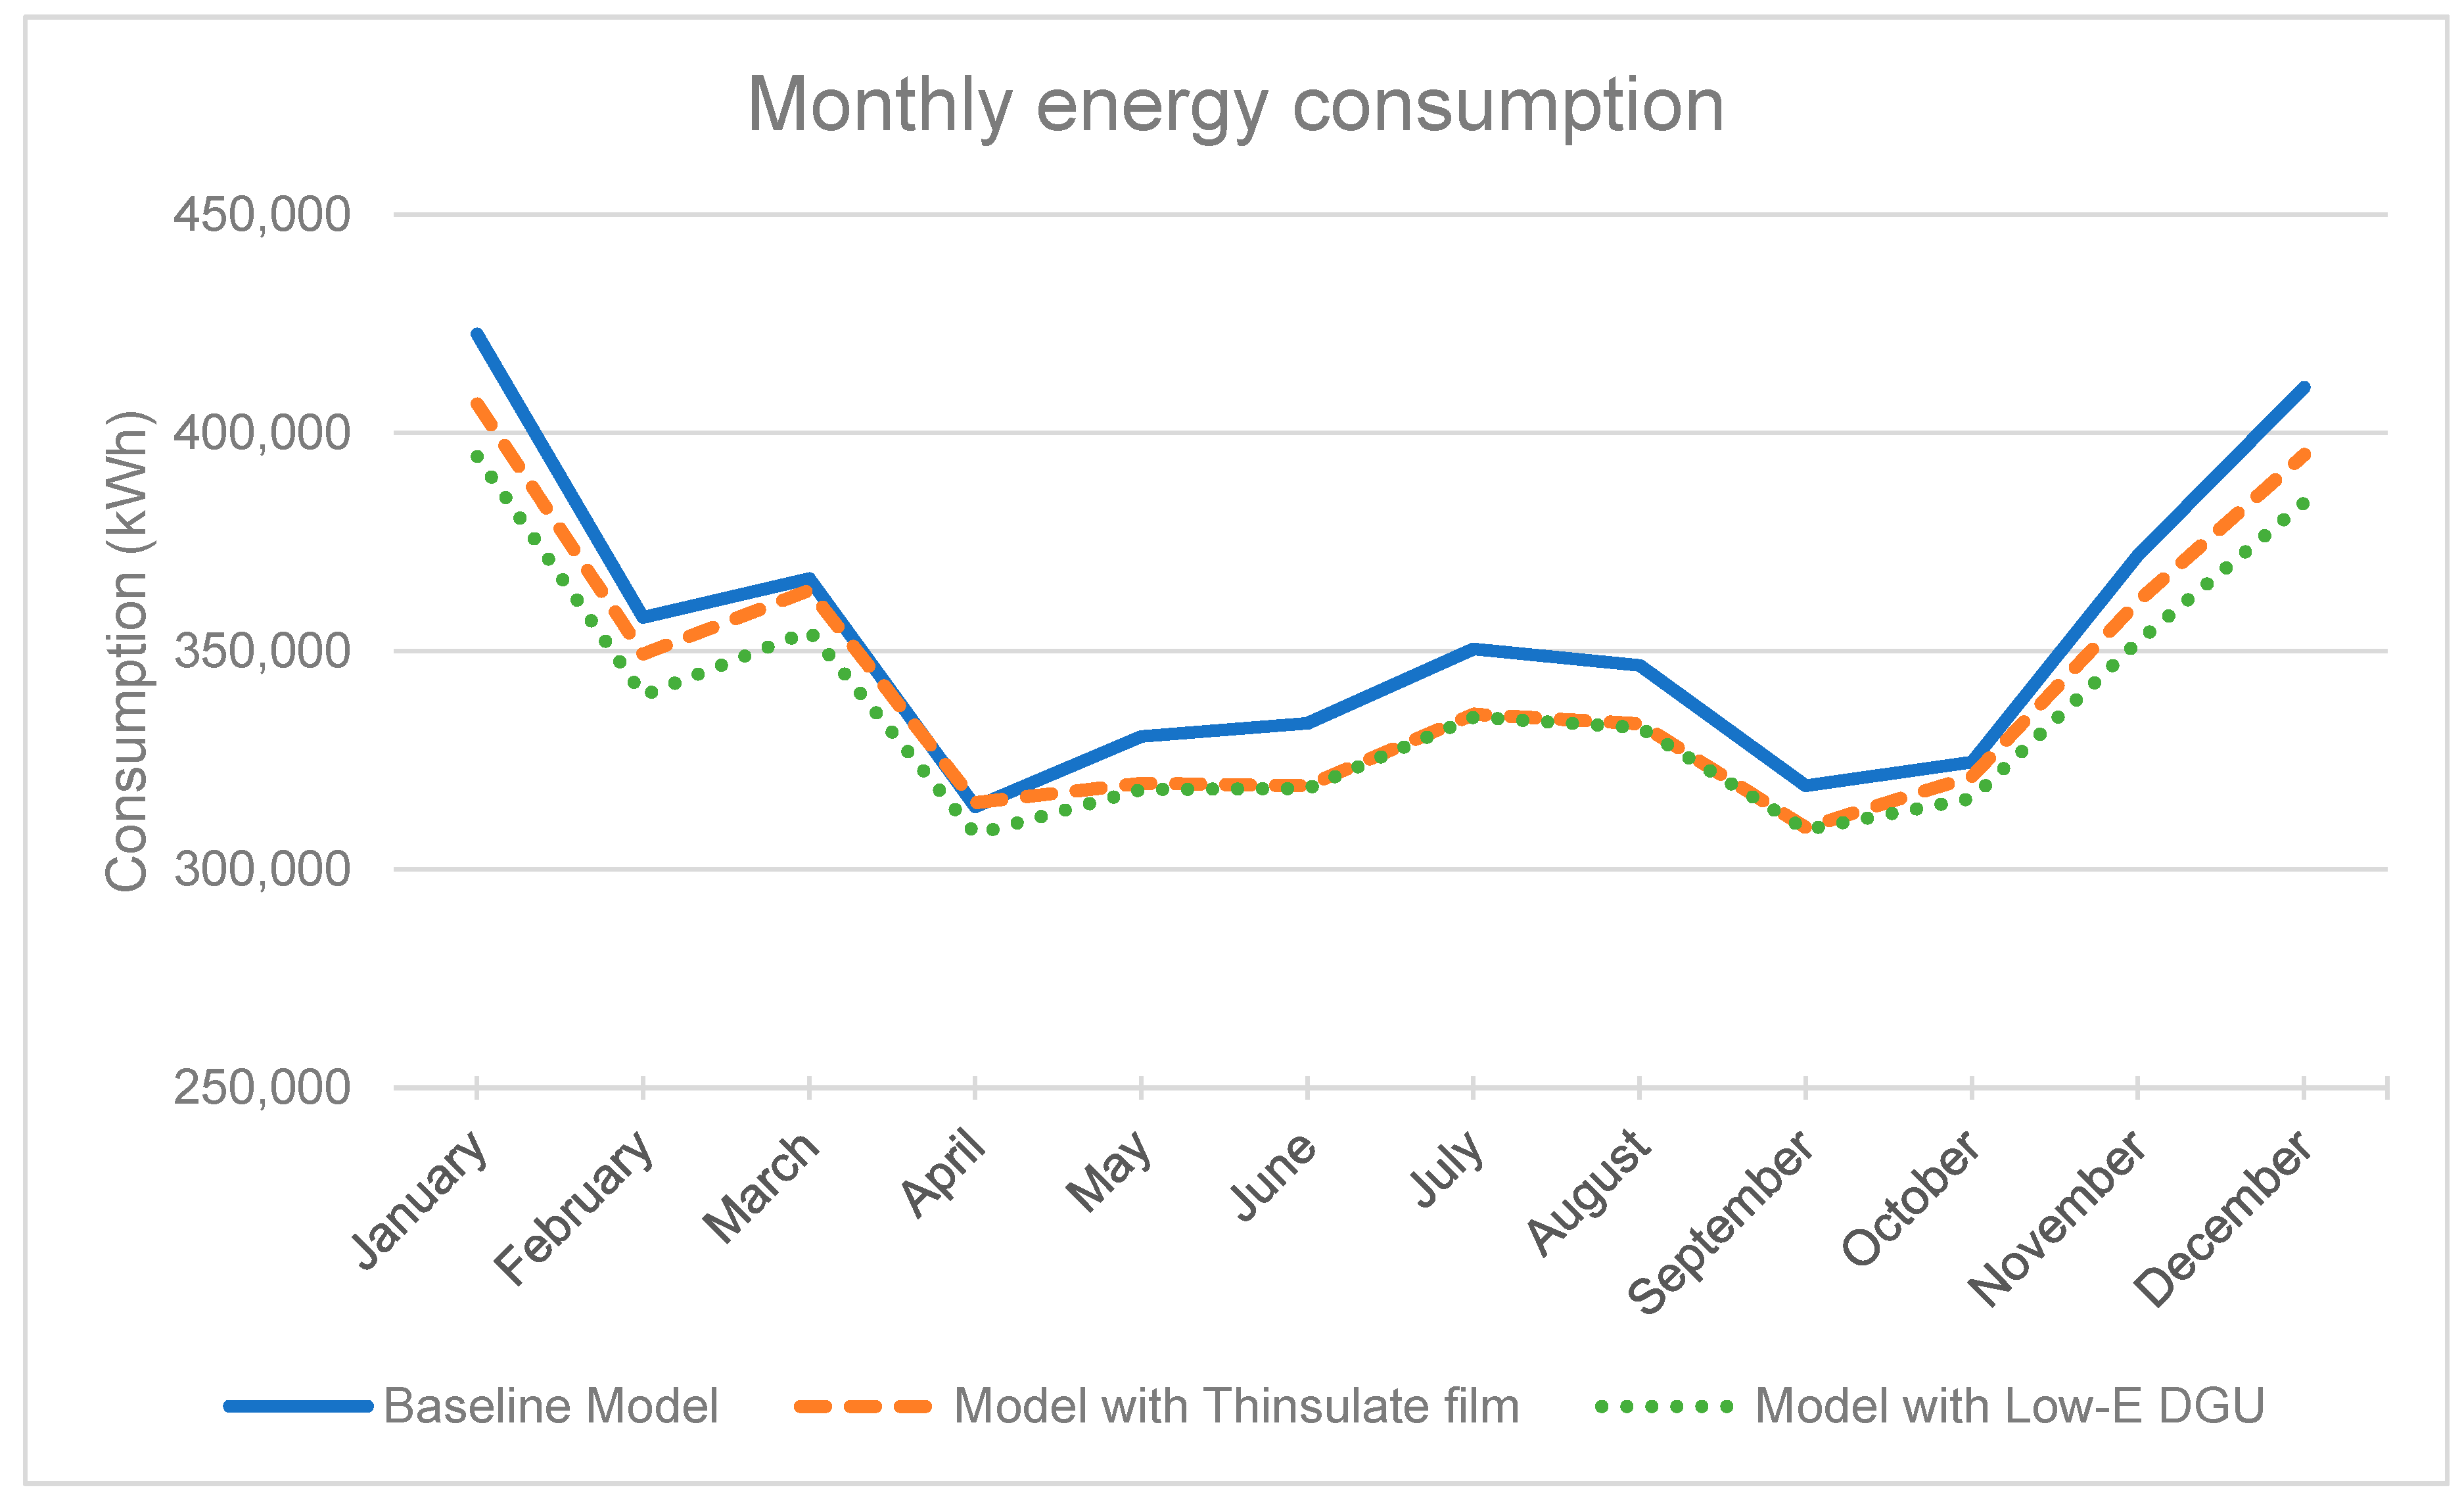
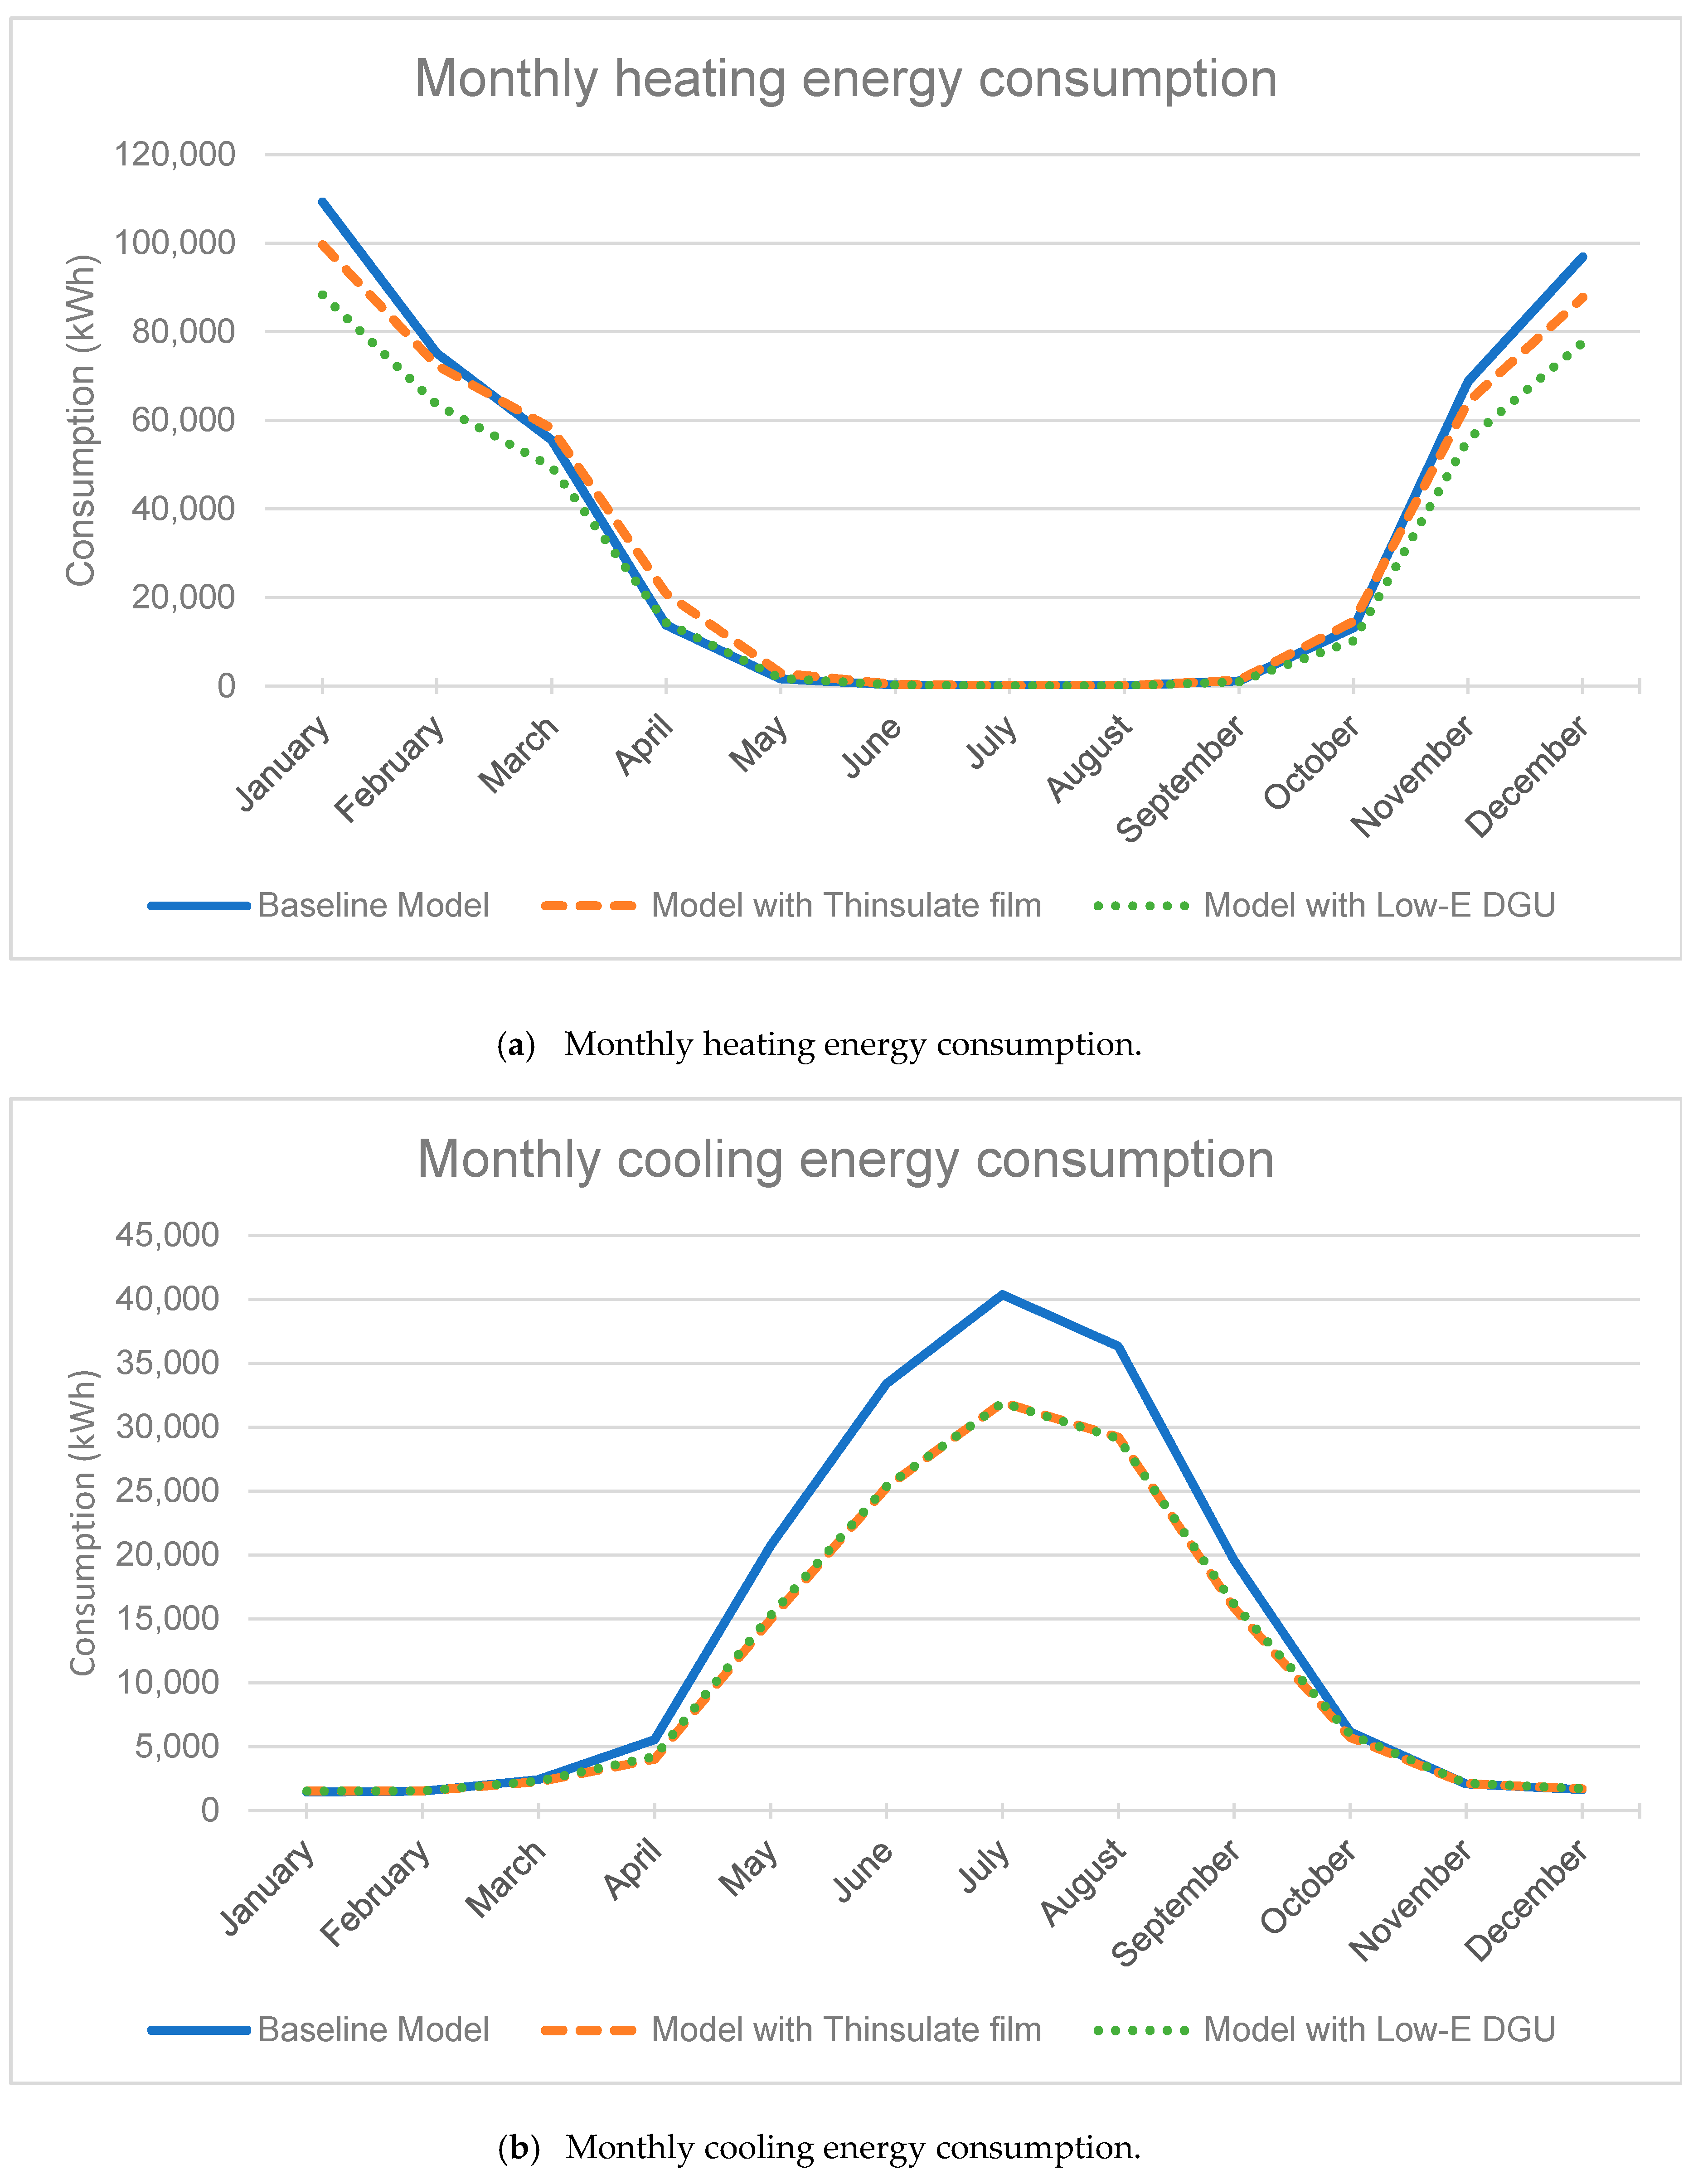
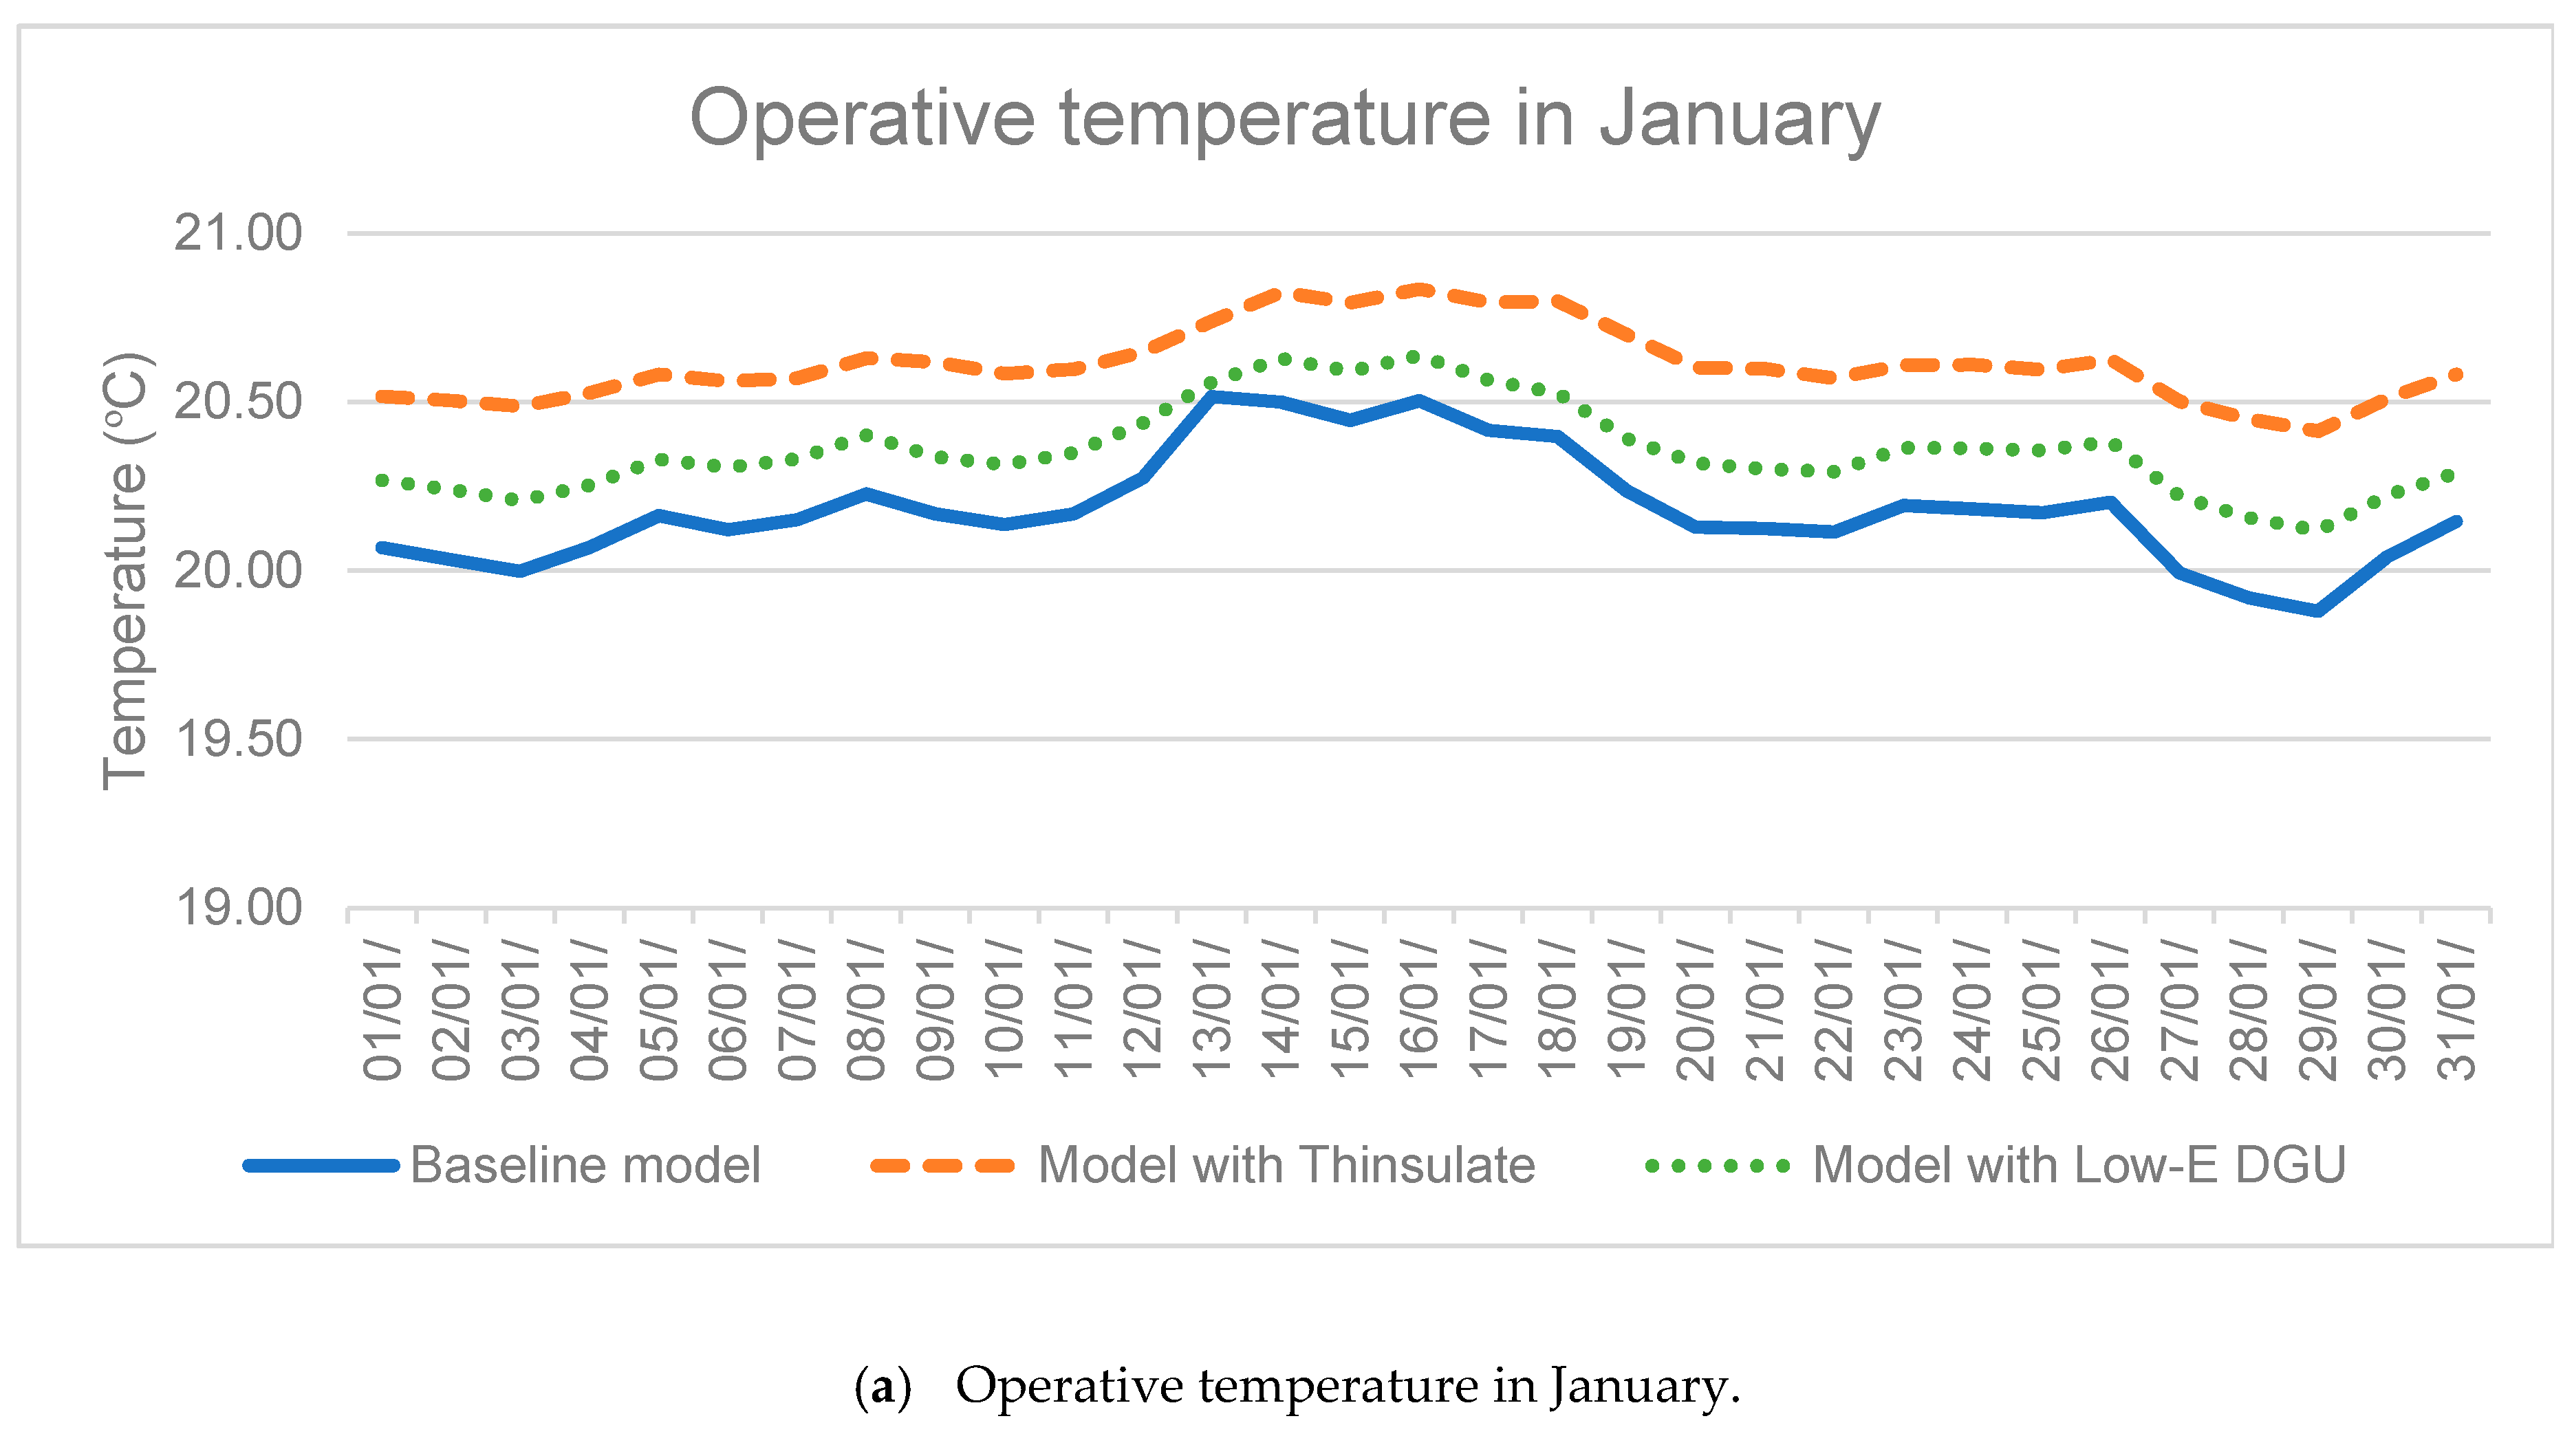
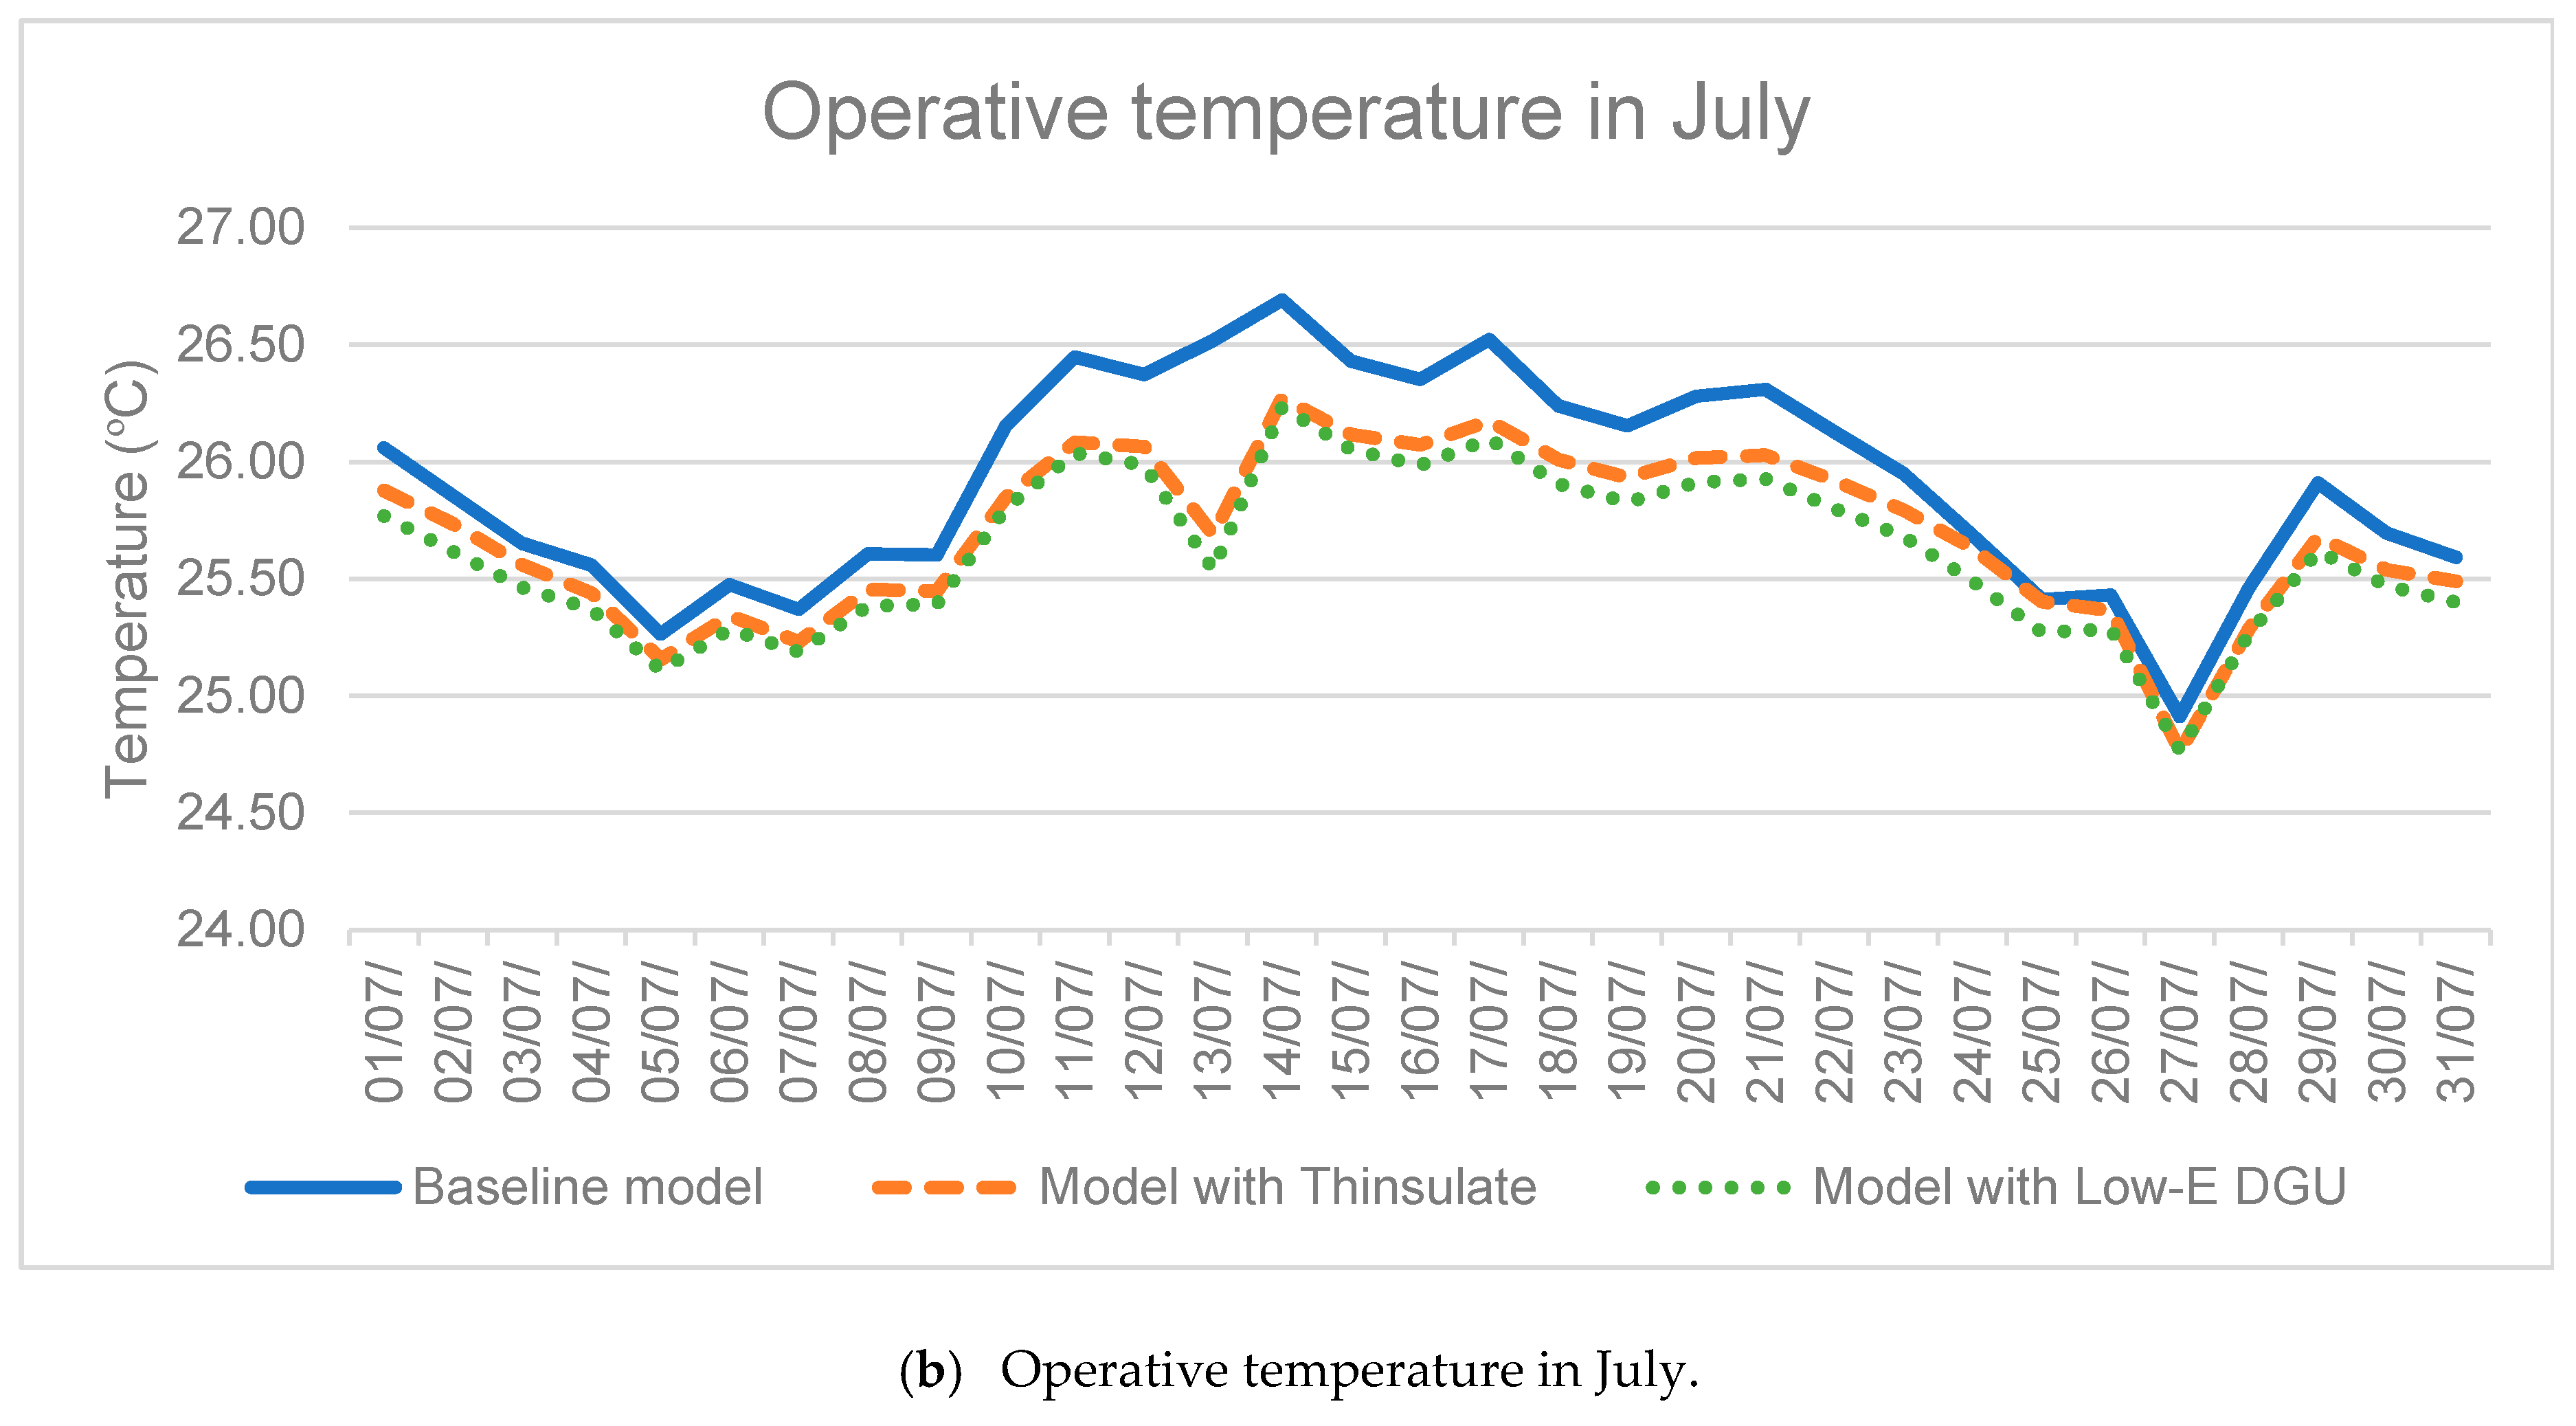
  • Baseline model: Hotel building in its existing state.
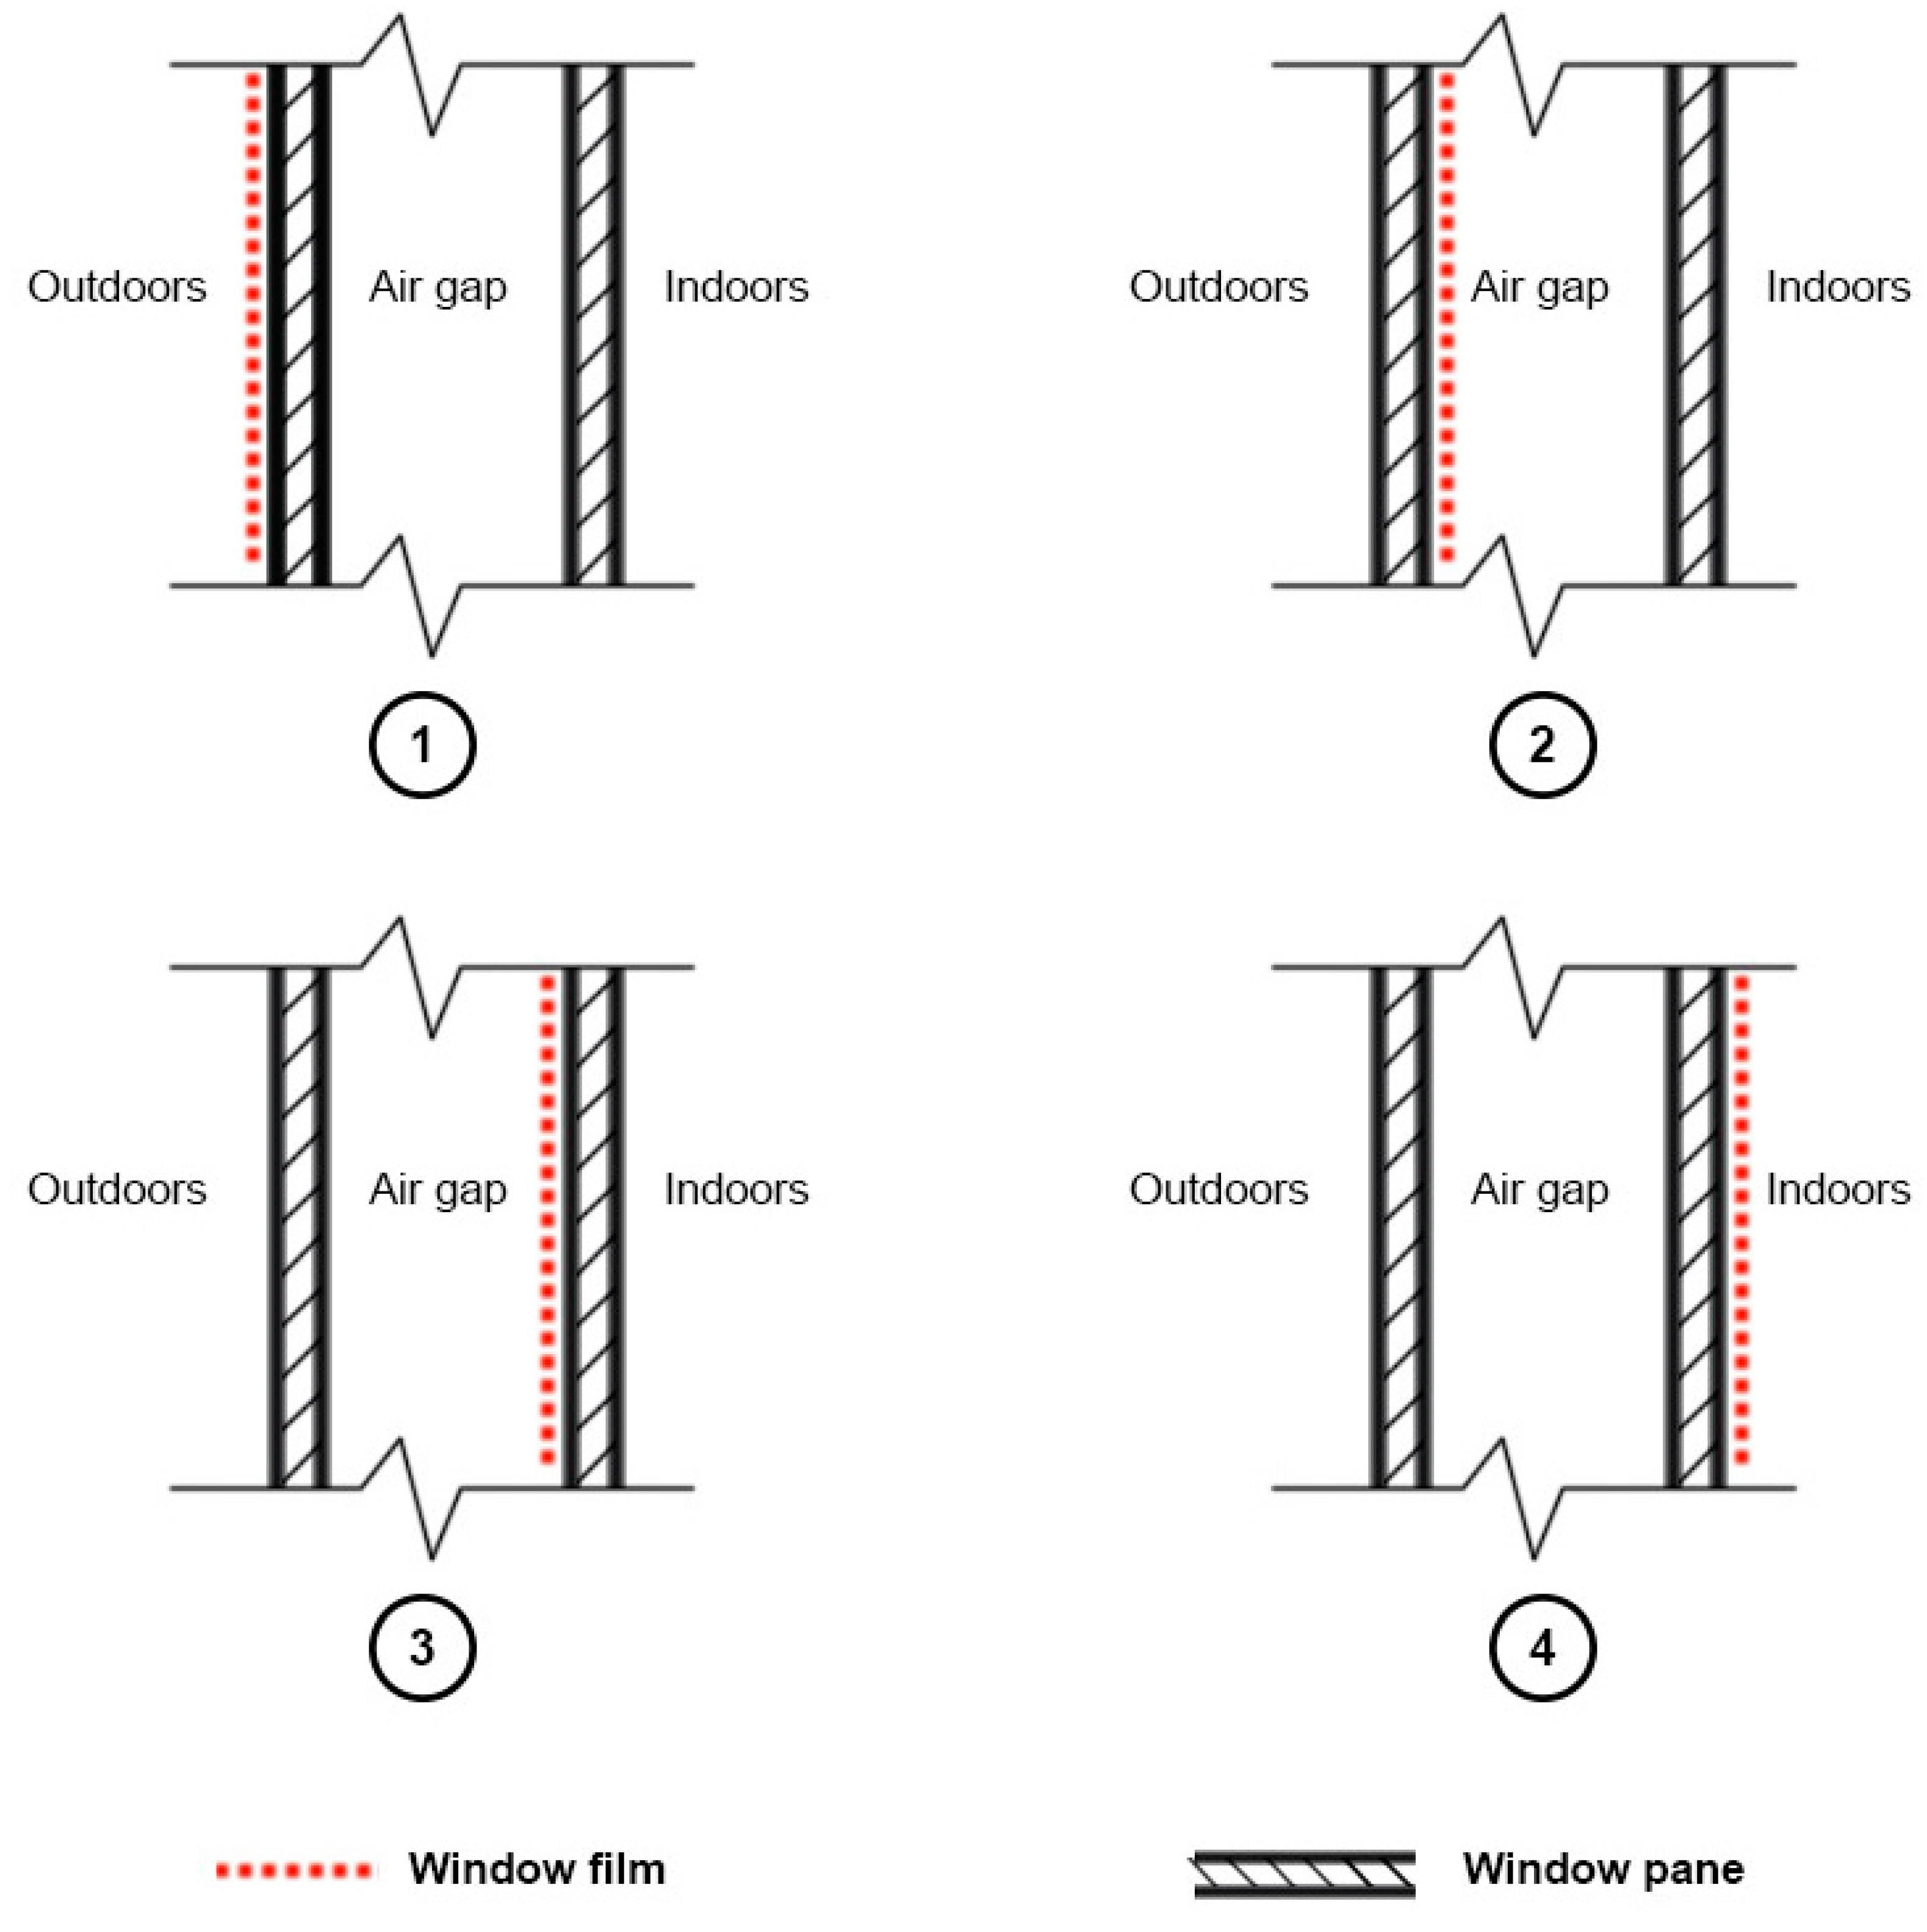
  • Model with Thinsulate film: Model with Thinsulate film applied as a retrofitting measure on the internal surface of the inner windowpane.
  • Model with Low-E double glazed unit (DGU): Model with a newly installed Low-E coated double glazed window unit.
Whenever the text is referring to models with Thinsulate film and models with Low-E DGU at the same time, they are mentioned as the retrofitted models. Also, all the figures in this section are excluding the catering energy consumption.
Figure 10a shows the energy consumption of the three models. As shown, the energy use intensity (EUI)—total energy used by the building in one year divided by the gross floor area—for both retrofitted models are decreased compared to that of baseline model, with reductions happening in heating, auxiliary, and cooling energy consumptions. Figure 10b compares the amount of these reductions in the three models. Several points are observed from this illustration:
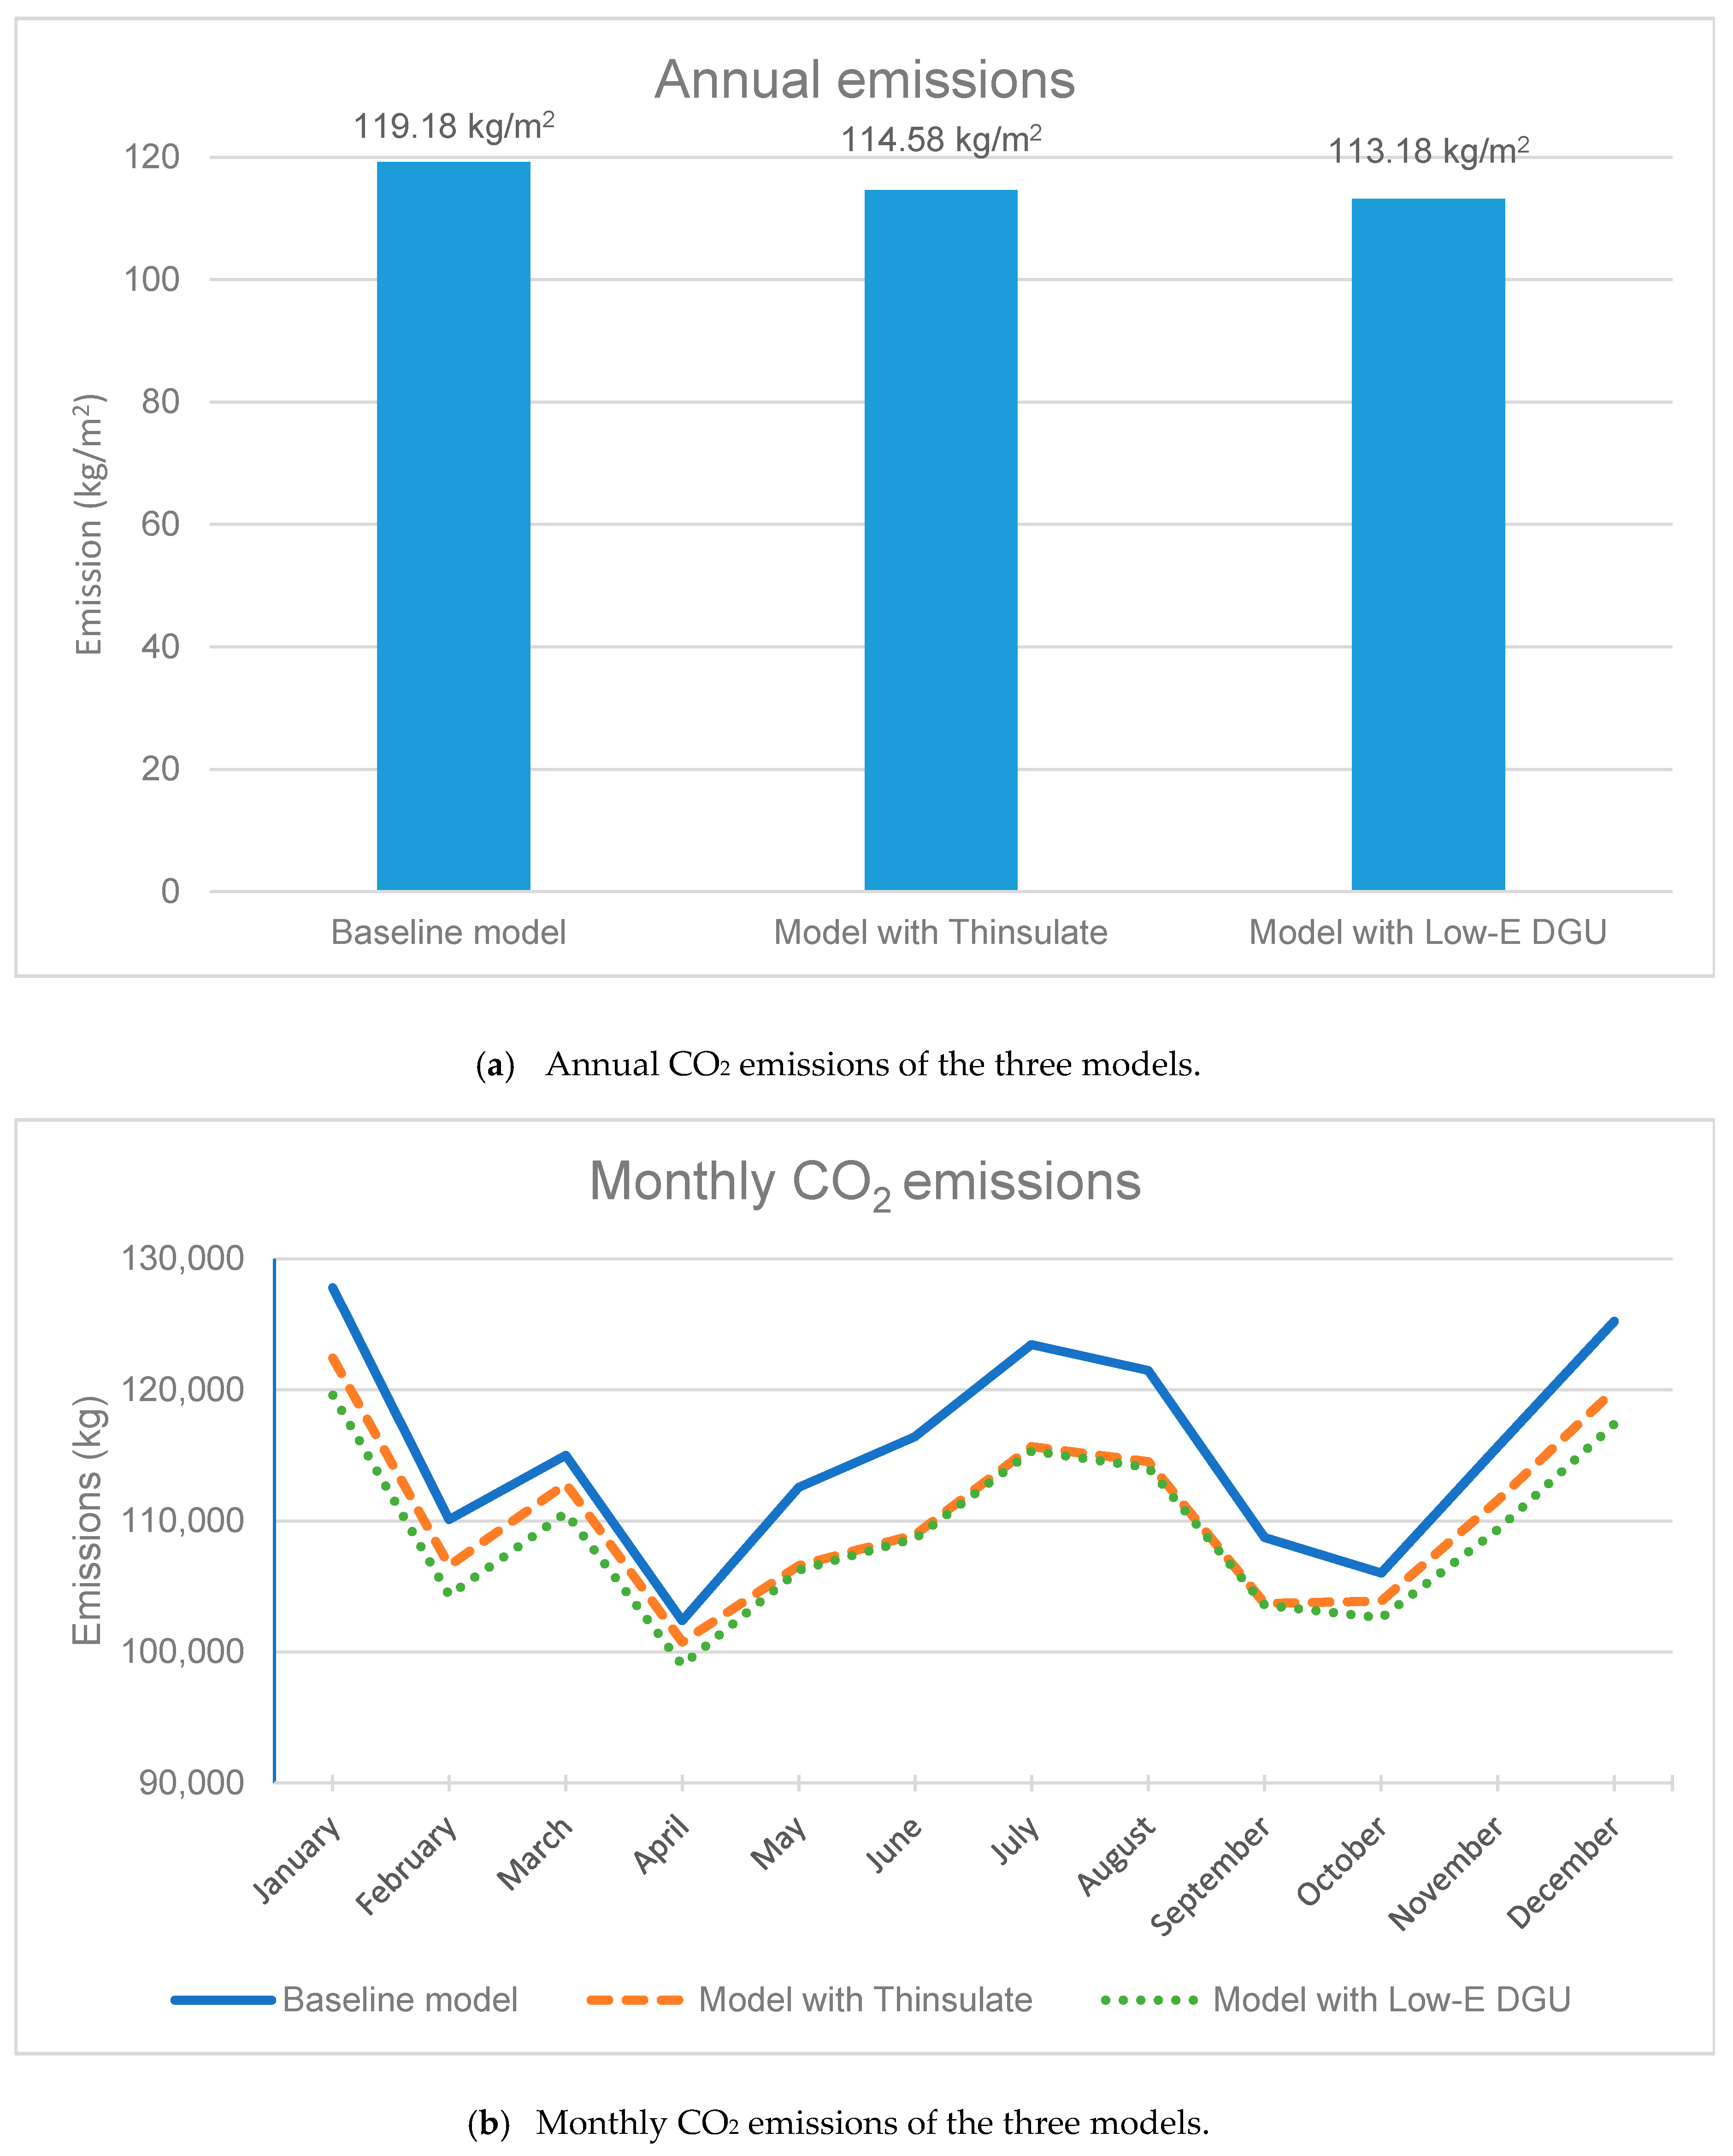
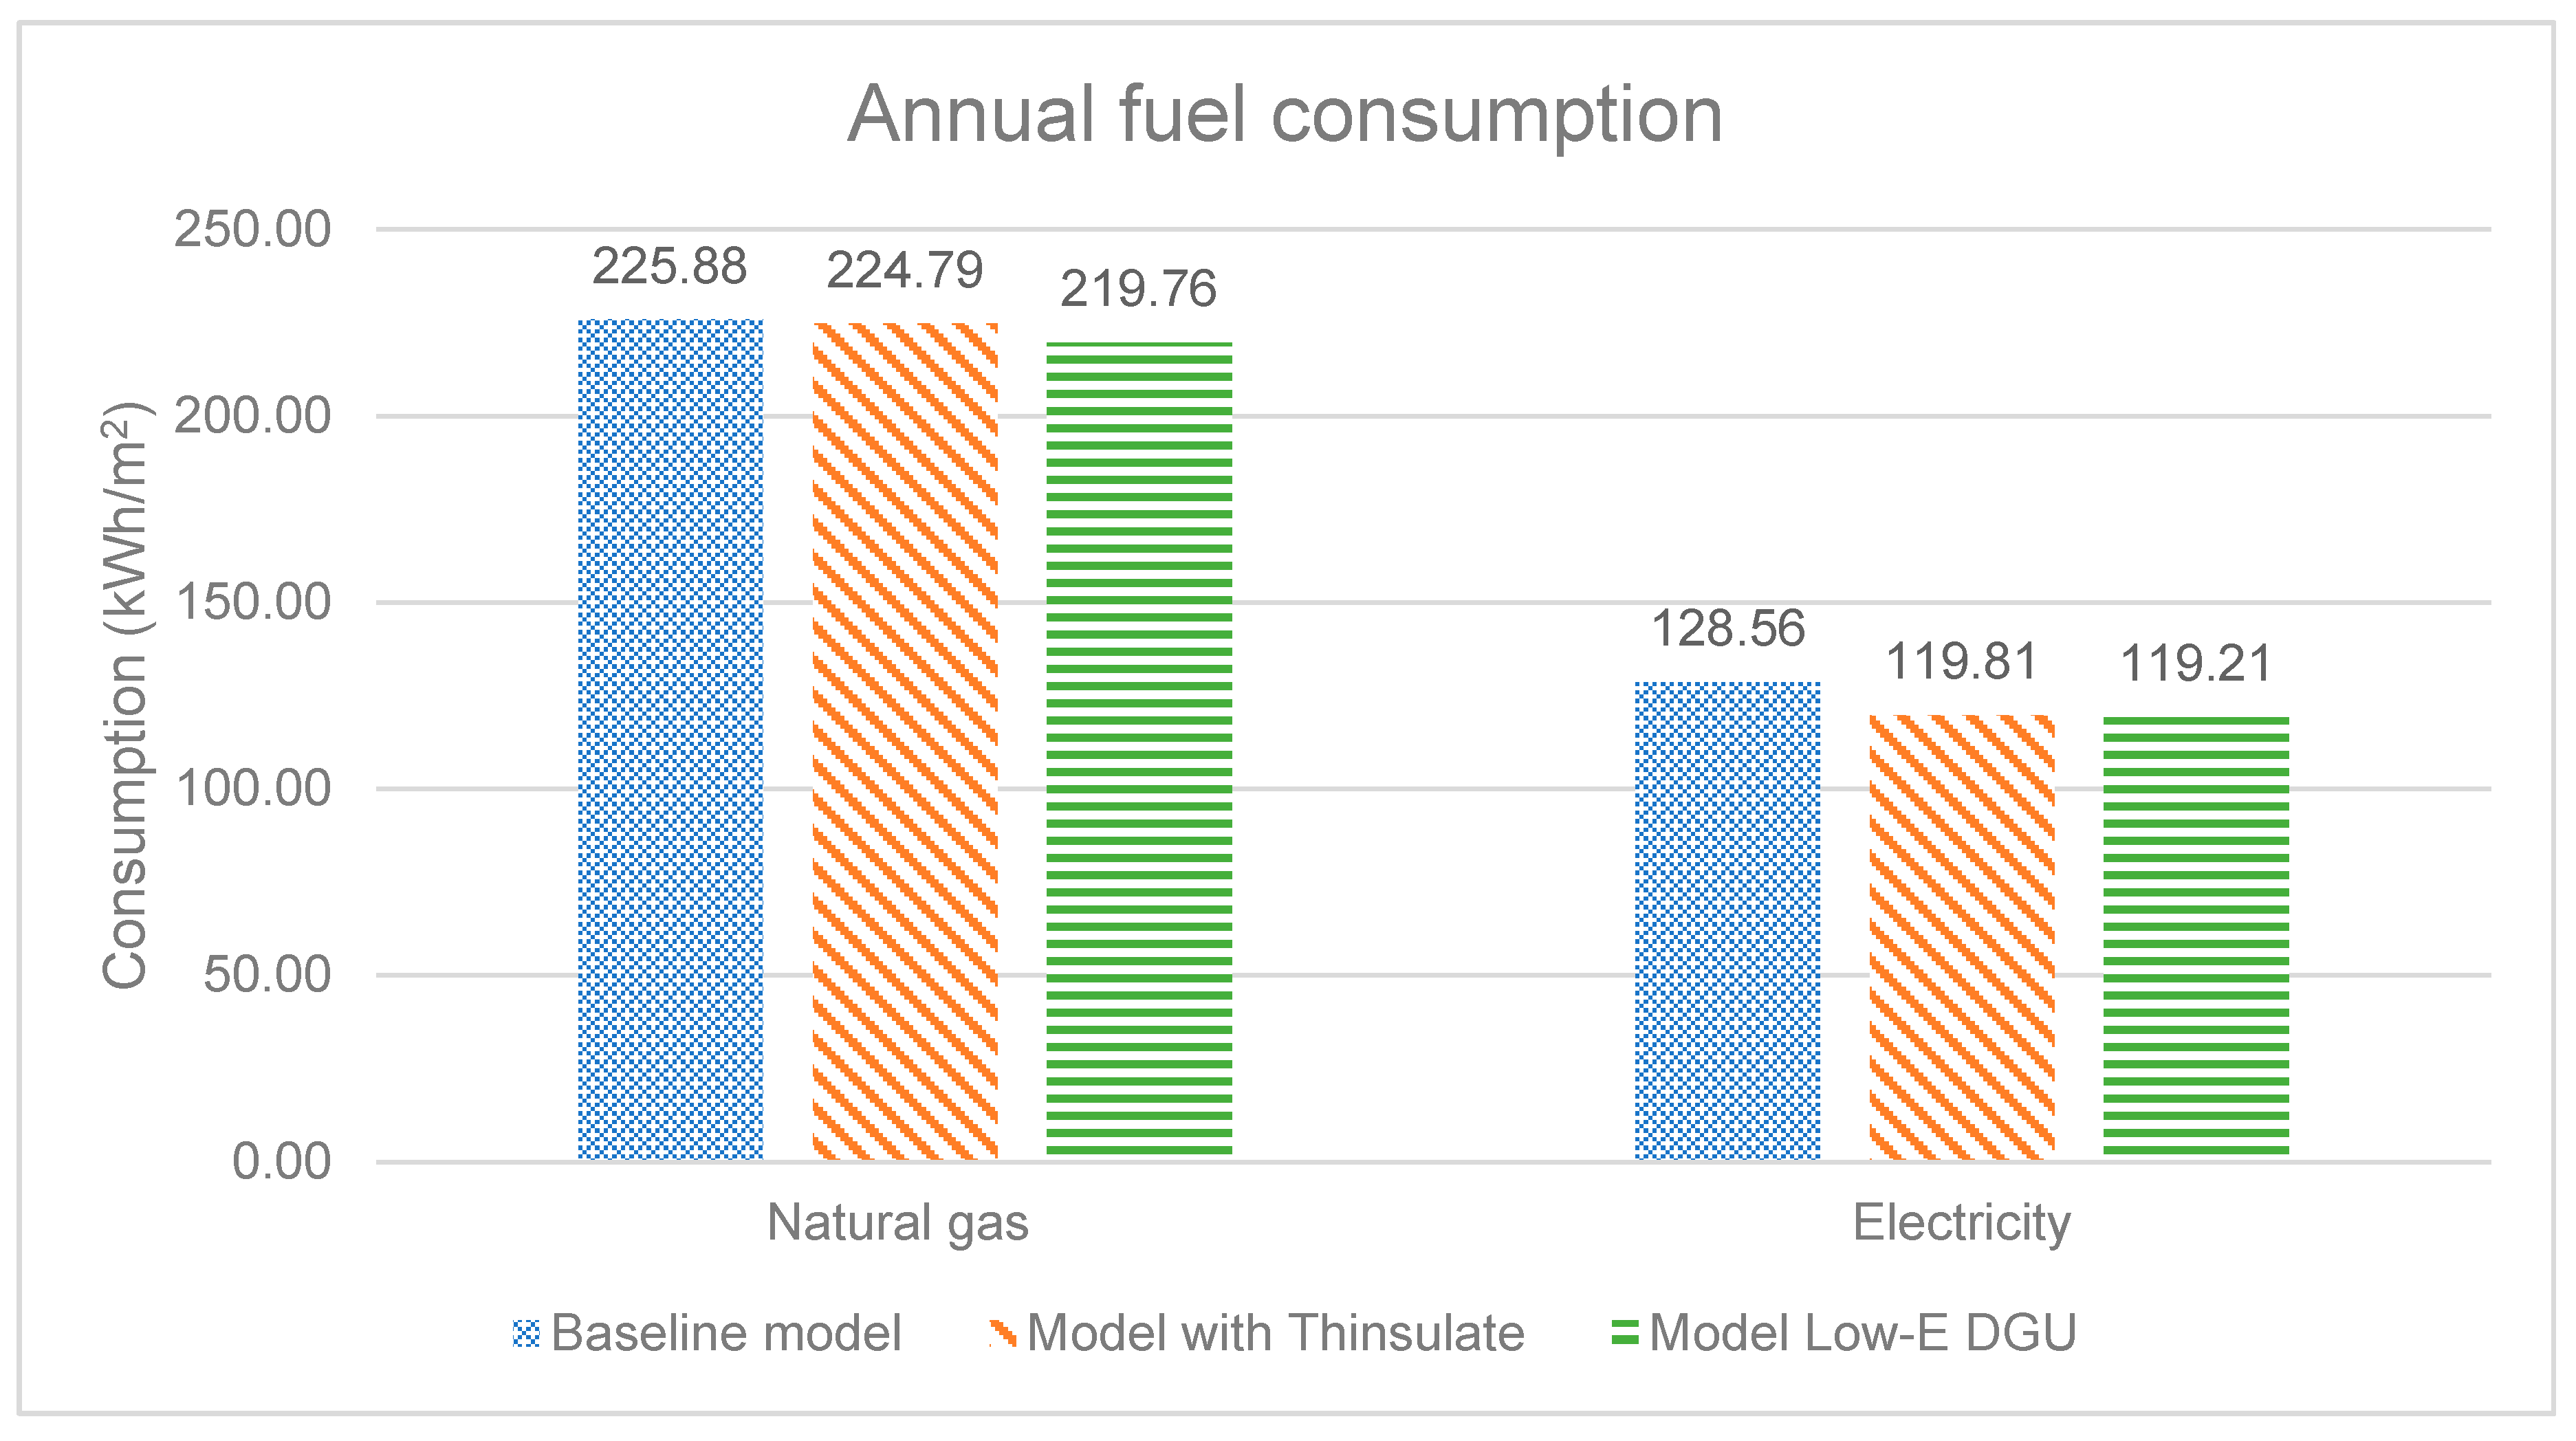
  • The reduction in total energy consumption is 4% for the model with Low-E DGU, and 2.7% for the model with Thinsulate, compared to the baseline model.
  • Heating and cooling consumptions are both reduced in the retrofitted models. Therefore, in this aspect, Low-E films can demonstrate a better performance (although not significantly) compared to sun control films.
  • The maximum reductions in different end use consumptions occur in auxiliary consumption, 14.9% for the model with Thinsulate and 16.7% for the model with Low-E DGU, which is due to a reduced usage of fans and pumps, as both heating and cooling energy consumptions are decreased.
  • The main difference between the two retrofitted models comes with their impact on reducing heating energy consumptions. The 17% reduction in heating energy consumption achieved in the model with Low-E DGU outweighs the 3% reduction received in the model with Thinsulate. This is consistent with the literature, where it states the maximum function of Low-E glazing/films is achieved when they are applied on the external layer. The two models show similar reductions in cooling energy consumption, around 20%.
  • The Low-E coating (regardless of its position) reduces the light transmittance—in the case of this study, the reduction is 20%. However, the lighting energy consumption is unaffected, which can be justified as below:
    • The NCM profile for hotels considers areas such as guestrooms to be vacant during the day (from 09:00 to 21:00) and occupied in the late afternoon/evening when there is already the need for using artificial lighting. Therefore, a reduced light transmittance will not increase the need for lighting in the guestrooms.
    • Areas with constant use such as the restaurant, lobby, and gym keep their lights on during their active time as part of the hospitality policy. Therefore, a reduced light transmittance will not increase the need for lighting in these areas, as well.
Figure 11 compares the monthly energy consumption of the three models. The amount of energy savings caused by Thinsulate film is not the same throughout the year, with the reductions being more obvious from April to October; however, the maximum savings in monthly consumption happen in January and December. With the UK climate being mostly heating-dominant, and the highest monthly energy consumption occurring in January and December, any measure that can reduce the heating consumption will be of high importance. As mentioned earlier, Low-E coatings can contribute to this through a reduction in heat loss caused be a low emissivity.
Simulation results have demonstrated improvement in monthly total energy consumption and annual heating/cooling energy consumption for both retrofitted models. As it is related to the context of this study, monthly heating and cooling energy consumptions are also shown in Figure 12. The maximum saving in heating energy consumption occurs in January and December, when an increase in heating demand occurs. The Thinsulate film’s ability to trap the heat inside the space reduces the heat loss and, subsequently, the heating energy consumption. On the other hand, the maximum saving to cooling energy consumption occurs in July, where the Thinsulate film’s ability to reduce solar gain outperforms its inherent ability to trap heat inside, and results in reducing the need for cooling. It is understood from these two figures (Figure 12a,b) that Thinsulate films show their highest performance during the peak heating and cooling demands and out of this period, their contribution to energy savings is not significant, e.g., an increase in heating energy consumption occurs in March, April, May, and October (Figure 12a). This is attributable to the fact that during these months, the Thinsulate film’s impact on reducing the solar heat gain outweighs its ability to trap heat inside the space.
Changes to CO2 emission rates are given in Figure 13. By applying Thinsulate films, annual CO2 emissions of the hotel are reduced by 4.1%. In the case of the model with Low-E DGU, annual reductions could reach 5.3% (Figure 13a). As the CO2 conversion factor for electricity is bigger than that of natural gas—0.519 kg/kWh and 0.216 kg/kWh, respectively—savings in electricity result in higher reduction in CO2 emissions. Therefore, as shown in Figure 13b, the difference between emissions in the baseline model and the retrofitted models is bigger during the cooling-dominant time of the year, where the electricity consumption is the highest. The maximum reduction happens in July.
A further step in evaluating the viability of using Thinsulate films is to take a closer look at how the energy savings occur. Although the savings to monthly/annual heating/cooling energy were discussed earlier, it is noteworthy to investigate the impact on gas/electricity consumption, especially as electricity is more expensive than natural gas. Figure 14 demonstrates the savings in natural gas and electricity consumption. As natural gas is consumed to provide heating energy and DHW, its reduction is similar to that of heating energy consumption, while the reduction in electricity consumption is a result of savings achieved in cooling and auxiliary energy consumptions.
With the UK government gas and electricity prices for non-domestic sectors including Climate Change Levy rates [40], Figure 15 shows the changes to electricity, gas. and total fuel consumption costs. The prices for a medium-sized consumer for 2018 follow as below:
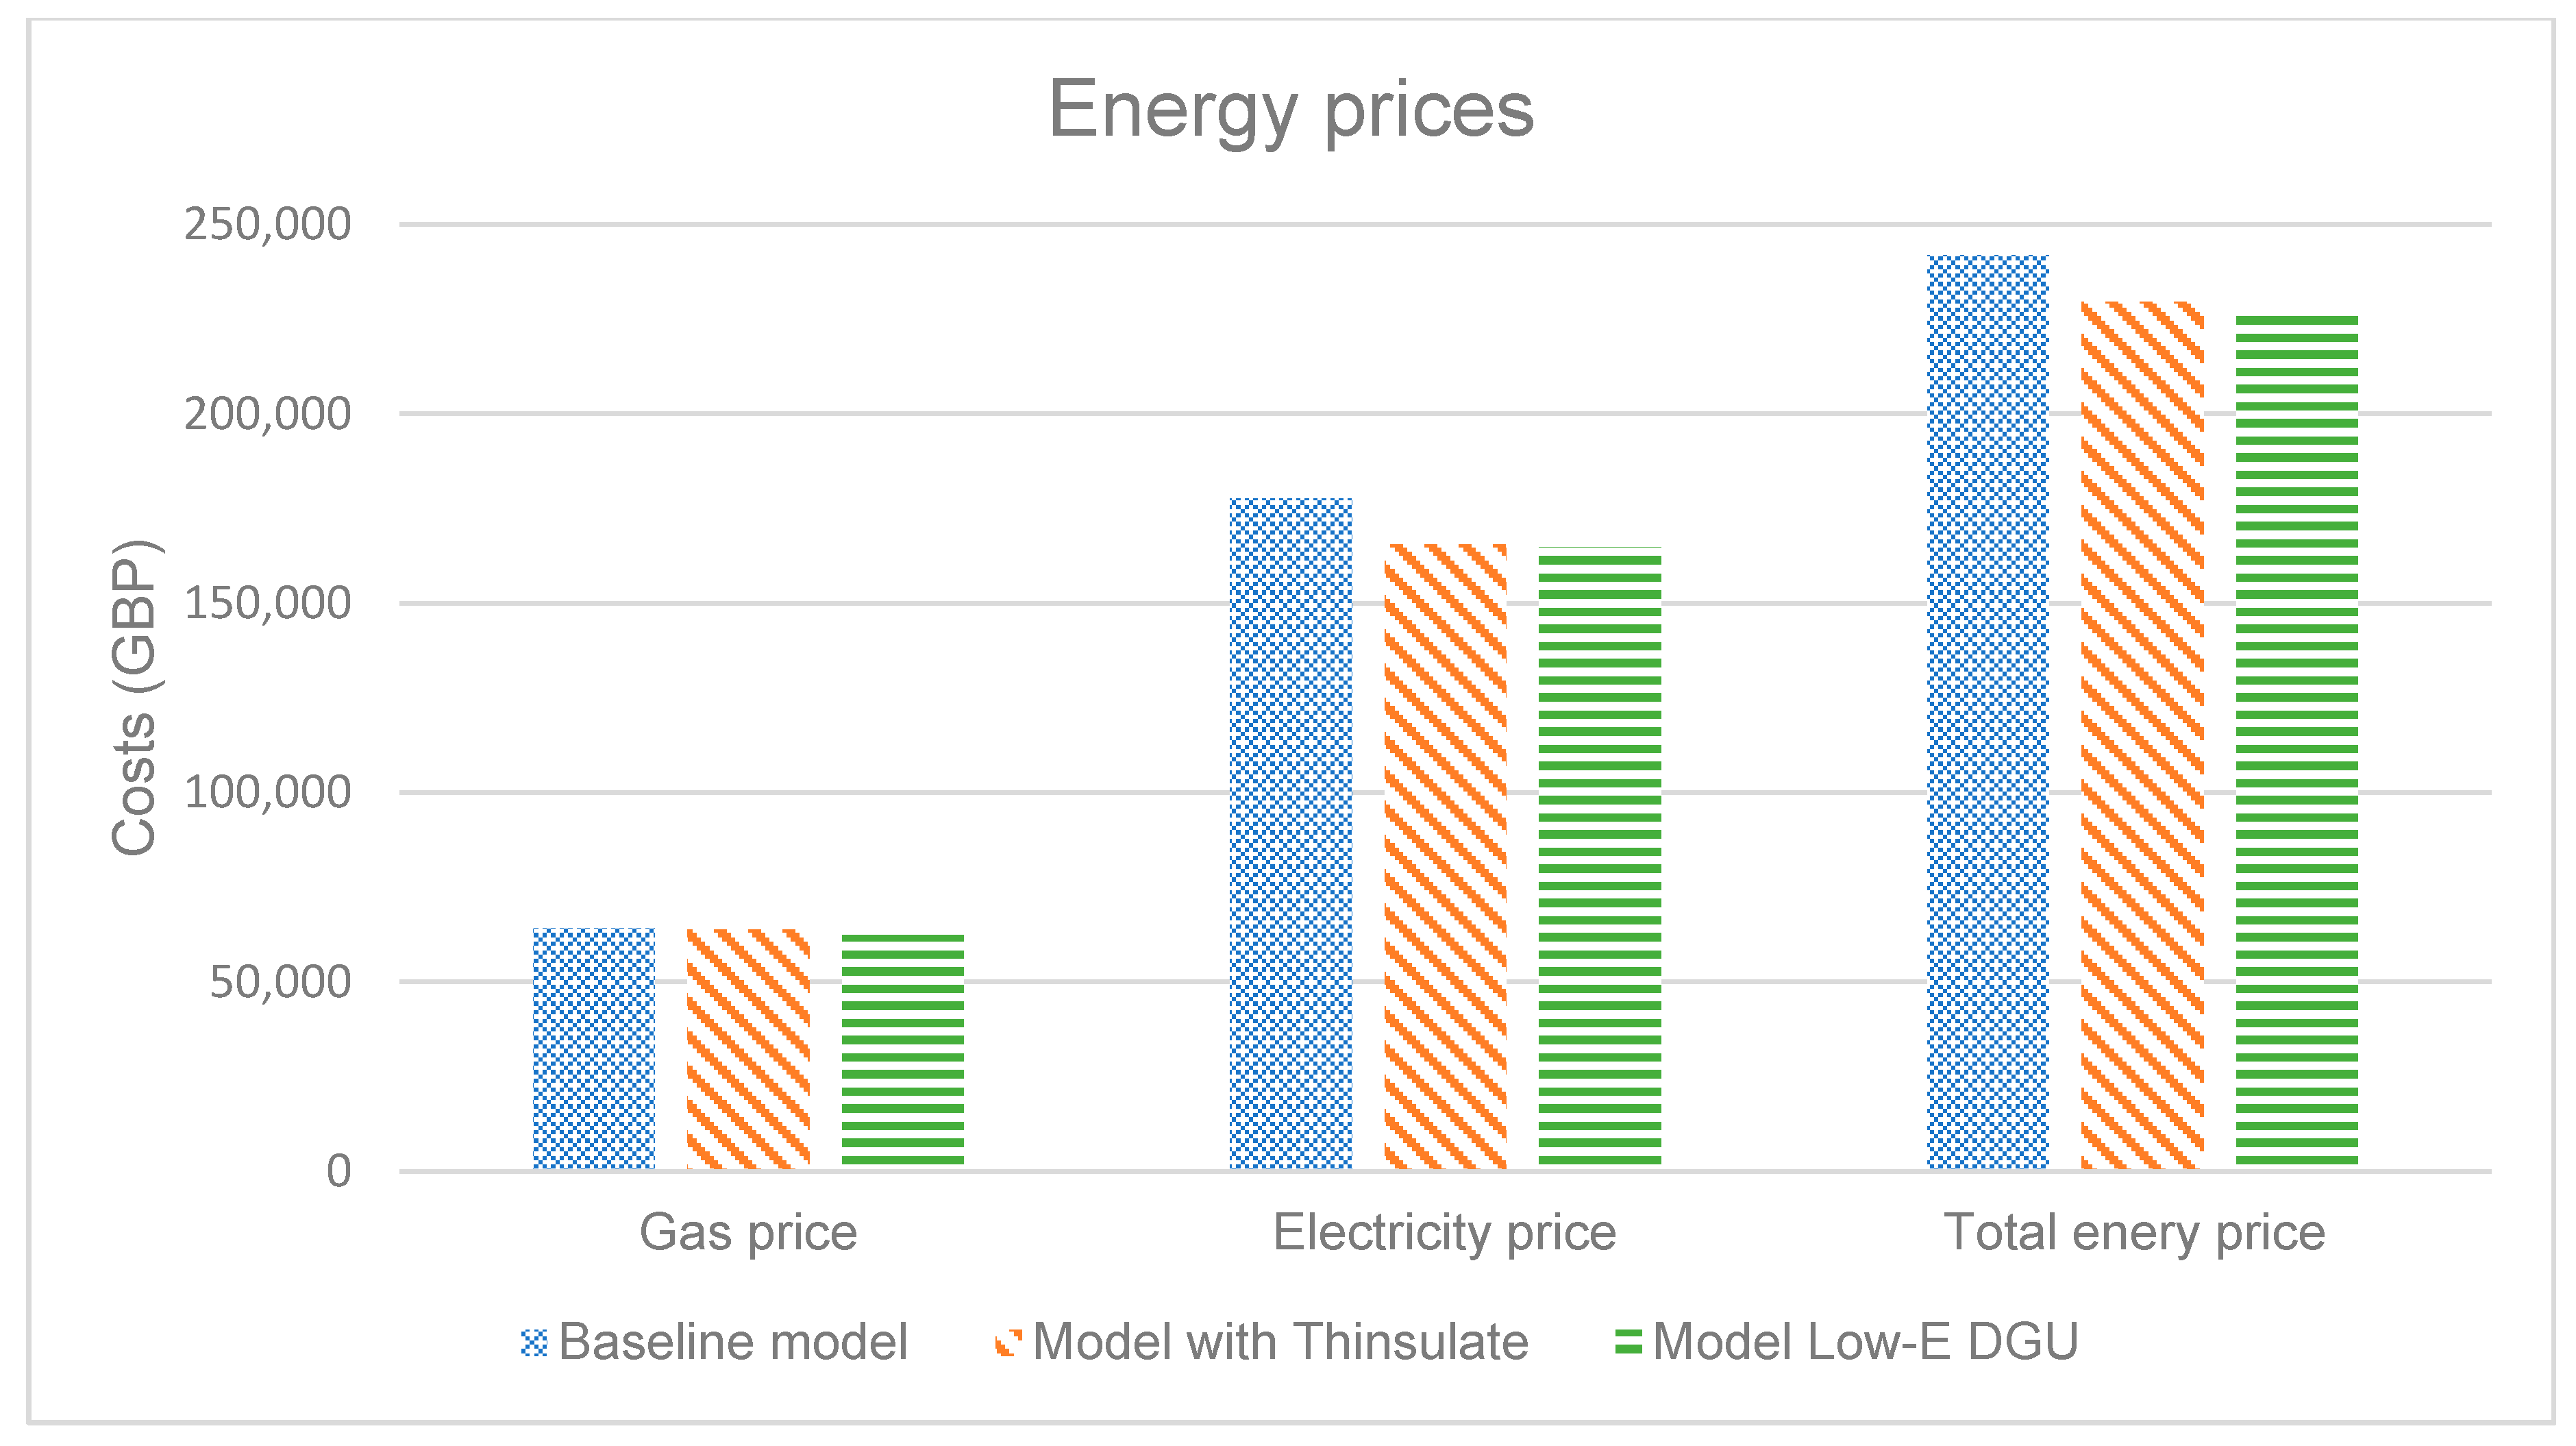
  • Electricity: 11.53 Pence/kWh
  • Natural gas: 2.371 Pence/kWh
Therefore, by applying Thinsulate films, there would be a saving of 12,400 GBP in annual energy costs compared to the energy costs of the baseline model. Regarding the price difference between electricity and gas, the saving in annual costs comes mostly from electricity cost reductions.
The impact of applying Thinsulate films on guests’ thermal comfort is also investigated. Among all the factors affecting a thermal environment—temperature, humidity, air velocity, clothing insulation, and level of activity [41]—temperature is the only aspect of thermal comfort in this study that is affected, as all other factors remain the same. If the operative temperature—a combination of the room air temperature and radiant temperature [18]—undergoes a change of 2 to 3 °C, there will be a tangible change to the thermal comfort of the occupants [41].
The recommended operative temperature by CIBSE for hotel guestrooms during winter and summer time are 19 to 21 °C and 21 to 25 °C, respectively [41]. Figure 16 shows the average operative temperature in guestrooms during the peak of heating- and cooling-dominant times of the year.
As shown in Figure 16a, during January all three models have temperatures within the CIBSE recommended range, with Thinsulate films providing a slightly higher temperature that can be favourable during winter. During the summer—May to August—all three models frequently exceed the upper limit of the CIBSE recommendation (Figure 16b), with the percentage of hours over the recommended temperature being 83%, 78%, and 79% for the baseline model, model with Thinsulate, and model with Low-E DGU, respectively.
Table 5 compares the findings of this study with that of the previous study on sun control window films done by Bahadori et al. [13]. Other multi-story hotel buildings within the UK or other locations with similar climate might benefit from the findings of this study.

4. Discussion

As discussed in Section 3, using Thinsulate window films results in reductions of annual energy consumption and emissions, alongside savings in energy costs. Also, it does not impose any adverse effects on occupants’ thermal comfort. While these findings indicate a better performance of Thinsulate films over solar control films, it is important to consider the costs of purchase and installation of the window films.
Based on the information from the manufacturer and the distributor, the price per square meter of glazing (material purchase and installation) for this hotel is approximately 122 GBP for solar control films and 135 GBP for Thinsulate window films (the prices are excluding value-added tax (VAT)). Regarding the area of clear glazing in the building façade that is approximately 1900 square meter, the cost of material and installation of solar control films or Thinsulate films would be around 232,000 or 265,500 GBP, respectively.
Although the actual energy consumption of the hotel is higher than that of baseline model (see Figure 8)—hence savings in energy cost could be higher than the 12,400 GBP already mentioned—this gap can be attributed to different things such as the electricity used by lifts (that TAS does not account for) and different patterns of using air conditioning systems in the guest rooms etc. In order for the hotel owners to decide on the cost effectiveness of adding window films, it is essential to know how much of the actual energy consumption of the hotel can be reduced by applying the films. This is not possible until a further breakdown of the annual energy consumption to different end uses, i.e., air conditioning, lighting, DHW etc., becomes available.

5. Conclusions

This work presented a study on investigating the impact of applying a specific type of Low-E window film, commercially known as Thinsulate Climate Control 75, on energy consumption of an existing hotel in the UK. A previous study [13] on the same building investigated the impact of solar control films from the same manufacturer.
Analysis of the actual consumption data for the years 2010 to 2018 showed that, unlike occupancy rate, the climatic situation could have a significant impact on annual energy consumptions. Moreover, as extreme weather conditions do not occur very often, the use of average consumption data for a time range is more reliable than a random year for validating the energy simulation results.
The results from the simulation showed that Thinsulate window films are capable of reducing the heating and cooling consumption by 3% and 20%, respectively, resulting in a 2.7% saving in total energy consumption. Applying Thinsulate films reduces the need for heating and cooling in the peak heating- and cooling-dominant times of the year. This is an advantage of Thinsulate films over sun control films. A reduction of 4.1% can be achieved in annual CO2 emissions by applying Thinsulate films. Also, with less than a 1% reduction in gas cost and a 6.8% reduction in electricity costs, an overall saving of 5.1% is achieved in total energy consumption. Overall, while sun control films show a better performance in reducing cooling demand, Thinsulate films perform better in reducing total annual energy consumption, caused by reducing heating and cooling demand, resulting in improvements in annual emission and energy cost reductions. Regarding the relatively high cost of material and installation of window films, the decision on cost effectiveness of the measure needs further breakdown of actual energy consumption into its different end uses.

Author Contributions

A.B.-J., A.M., P.G., and D.C. conceived and designed the project; S.A. performed the experiments and analysed the data. S.A. and A.B.-J wrote the paper. A.B.-J., A.M., P.G., and D.C. reviewed the paper.

Funding

This research received no external funding.

Conflicts of Interest

The authors declare no conflict of interest.

References

  1. Committee on Climate Change. Meeting Carbon Budgets—Ensuring a Low-Carbon Recovery: 2nd Progress Report to Parliament Committee on Climate Change; Committee on Climate Change: London, UK, 2010. [Google Scholar]
  2. Boßmann, T.; Eichhammer, W.; Elsland, R. Policy Report; Contribution of energy efficiency measures to climate protection within the European Union until 2050; Federal Ministry for the Environment, Nature Conservation and Nuclear Safety (BMU): Berlin, Germany; Fraunhofer Institute for Systems and Innovation Research ISI: Karlsruhe, Germany, 2012.
  3. Ralegaonkar, R.V.; Gupta, R. Review of intelligent building construction: A passive solar architecture approach. Renew. Sustain. Energy Rev. 2010, 14, 2238–2242. [Google Scholar] [CrossRef]
  4. Mirrahimi, S.; Mohamed, M.F.; Haw, L.C.; Ibrahim, N.L.N.; Yusoff, W.F.M.; Aflaki, A. The effect of building envelope on the thermal comfort and energy saving for high-rise buildings in hot-humid climate. Renew. Sustain. Energy Rev. 2016, 53, 1508–1519. [Google Scholar] [CrossRef]
  5. Jelle, B.P.; Hynd, A.; Gustavsen, A.; Arasteh, D.; Goudey, H.; Hart, R. Fenestration of today and tomorrow: A state-of-the-art review and future research opportunities. Sol. Energy Mater. Sol. Cells 2012, 96, 1–28. [Google Scholar] [CrossRef] [Green Version]
  6. Urbikain, M.K.; Sala, J.M. Analysis of different models to estimate energy savings related to windows in residential buildings. Energy Build. 2009, 41, 687–695. [Google Scholar] [CrossRef]
  7. Cuce, E.; Riffat, S.B. A state-of-the-art review on innovative glazing technologies. Renew. Sustain. Energy Rev. 2015, 41, 695–714. [Google Scholar] [CrossRef]
  8. Djamel, Z.; Noureddine, Z. The Impact of Window Configuration on the Overall Building Energy Consumption under Specific Climate Conditions. Energy Procedia 2017, 115, 162–172. [Google Scholar] [CrossRef]
  9. The Building Regulations 2010. Approved Document L2A: Conservation of Fuel and Power in New Buildings Other than Dwellings; RIBA Publishing: London, UK, 2010. [Google Scholar]
  10. Jaber, S.; Ajib, S. Thermal and economic windows design for different climate zones. Energy Build. 2011, 43, 3208–3215. [Google Scholar] [CrossRef]
  11. Hassouneh, K.; Alshboul, A.; Al-Salaymeh, A. Influence of windows on the energy balance of apartment buildings in Amman. Energy Convers. Manag. 2010, 51, 1583–1591. [Google Scholar] [CrossRef]
  12. Li, C.; Tan, J.; Chow, T.T.; Qiu, Z. Experimental and theoretical study on the effect of window films on building energy consumption. Energy Build. 2015, 102, 129–138. [Google Scholar] [CrossRef]
  13. Bahadori-Jahromi, A.; Rotimi, A.; Mylona, A.; Godfrey, P.; Cook, D. Impact of window films on the overall energy consumption of existing UK hotel buildings. Sustainability 2017, 9. [Google Scholar] [CrossRef]
  14. Moretti, E.; Belloni, E. Evaluation of energy, thermal, and daylighting performance of solar control films for a case study in moderate climate. Build. Environ. 2015, 94, 183–195. [Google Scholar] [CrossRef]
  15. Mohelníková, J. Window Glass Coatings. In Energy Efficiency and Renewable Energy Through Nanotechnology; Zang, L., Ed.; Springer: London, UK, 2011; pp. 913–934. ISBN 978-0-85729-638-2. [Google Scholar]
  16. Yin, R.; Xu, P.; Shen, P. Case study: Energy savings from solar window film in two commercial buildings in Shanghai. Energy Build. 2012, 45, 132–140. [Google Scholar] [CrossRef]
  17. Rezaei, S.D.; Shannigrahi, S.; Ramakrishna, S. A review of conventional, advanced, and smart glazing technologies and materials for improving indoor environment. Sol. Energy Mater. Sol. Cells 2017, 159, 26–51. [Google Scholar] [CrossRef]
  18. Costanzo, V.; Evola, G.; Marletta, L. Thermal and visual performance of real and theoretical thermochromic glazing solutions for office buildings. Sol. Energy Mater. Sol. Cells 2016, 149, 110–120. [Google Scholar] [CrossRef]
  19. Sweitzer, G.; Arasteh, D.; Selkowitz, S. Effects of low-emissivity glazings on energy use patterns in nonresidential daylighted buildings. ASHRAE Trans. 1987, 93, 1–15. [Google Scholar]
  20. Sadrzadehrafiei, S.; Sopian, K.; Lim, C. Application of Advanced Glazing to Mid- Rise Office Buildings in Malaysia. In Proceedings of the 9th WSEAS International Conference on Environment, Ecosystems and Development, Montreux, Switzerland, 2011; pp. 197–201. [Google Scholar]
  21. Collins, R.E.; Simko, T.M. Current status of the science and technology of vacuum glazing. Sol. Energy 1998, 62, 189–213. [Google Scholar] [CrossRef]
  22. Fang, Y.; Arya, F.; Hyde, T.J.; Hewitt, N. A Novel Building Component Hybrid Vacuum Glazing—A Modelling and Experimental Validation. ASHRAE Trans. 2013, 119, 430–441. [Google Scholar]
  23. Karlsson, J.; Roos, A. Annual energy window performance vs. glazing thermal emittance—The relevance of very low emittance values. Thin Solid Films 2001, 392, 345–348. [Google Scholar] [CrossRef]
  24. Romagnoni, P.; Cappelletti, F.; Peron, F.; Toffoli, S. Analysis of energy performance of commercial buildings with different extension of glazed area. In Proceedings of the 5th International Conference on Sustainable Energy Technologies, Vicenza, Italy, 2006. [Google Scholar]
  25. Chow, T.-t.; Li, C.; Lin, Z. Innovative solar windows for cooling-demand climate. Sol. Energy Mater. Sol. Cells 2010, 94, 212–220. [Google Scholar] [CrossRef]
  26. Gorgolis, G.; Karamanis, D. Solar energy materials for glazing technologies. Sol. Energy Mater. Sol. Cells 2016, 144, 559–578. [Google Scholar] [CrossRef]
  27. Ye, H.; Meng, X.; Long, L.; Xu, B. The route to a perfect window. Renew. Energy 2013, 55, 448–455. [Google Scholar] [CrossRef]
  28. Wang, J.; Shi, D. Spectral selective and photothermal nano structured thin films for energy efficient windows. Appl. Energy 2017, 208, 83–96. [Google Scholar] [CrossRef]
  29. Sadineni, S.B.; Madala, S.; Boehm, R.F. Passive building energy savings: A review of building envelope components. Renew. Sustain. Energy Rev. 2011, 15, 3617–3631. [Google Scholar] [CrossRef]
  30. Amoako-attah, J.; B-jahromi, A. Impact of standard construction specification on thermal comfort in UK dwellings. Adv. Environ. Res. 2014, 3, 253–281. [Google Scholar] [CrossRef]
  31. Rotimi, A.; Bahadori-jahromi, A.; Mylona, A.; Godfrey, P.; Cook, D. Estimation and Validation of Energy Consumption in UK Existing Hotel Building Using Dynamic Simulation Software. Sustainability 2017, 9, 1391. [Google Scholar] [CrossRef]
  32. Eames, M.E.; Ramallo-gonzalez, A.P.; Wood, M.J. An update of the UK’s test reference year: The implications of a revised climate on building design. Build. Serv. Eng. Res. Technol. 2016, 316–333. [Google Scholar] [CrossRef]
  33. M Thinsulate Window Films Climate Control Series. Available online: https://www.3m.com/3M/en_US/company-us/all-3m-products/~/3M-Thinsulate-Window-Film-Climate-Control-Series-for-Residential/?N=5002385+3292123816&preselect=3293786499&rt=rud (accessed on 20 March 2019).
  34. Salem, R.; Bahadori-jahromi, A.; Mylona, A.; Godfrey, P.; Cook, D. Carbon Emissions and Evaluation of the Potential Energy, Carbon Emissions, and Financial Impacts from the Incorporation of CHP and CCHP systems in Existing UK Hotel Buildings. Energies 2018, 11, 1219. [Google Scholar] [CrossRef]
  35. Chartered Institution of Building Services Engineers (CIBSE). Energy Efficicency in Commercial Kitchens, CIBSE TM 50; Chartered Institution of Building Services Engineers: London, UK, 2009. [Google Scholar]
  36. Bohdanowicz, P.; Martinac, I. Determinants and benchmarking of resource consumption in hotels-Case study of Hilton International and Scandic in Europe. Energy Build. 2007, 39, 82–95. [Google Scholar] [CrossRef]
  37. Priyadarsini, R.; Xuchao, W.; Eang, L.S. A study on energy performance of hotel buildings in Singapore. Energy Build. 2009, 41, 1319–1324. [Google Scholar] [CrossRef]
  38. Chartered Institution of Building Services Engineers (CIBSE). Degree-Days: Theory and Application, TM41; Chartered Institution of Building Services Engineers: London, UK, 2006. [Google Scholar]
  39. MET Office UK Climate. Available online: https://www.metoffice.gov.uk/public/weather/climate (accessed on 8 June 2019).
  40. UK Government Gas and Electricity Prices in the Non-Domestic Sector. Available online: https://www.gov.uk/government/statistical-data-sets/gas-and-electricity-prices-in-the-non-domestic-sector (accessed on 27 March 2019).
  41. Chartered Institution of Building Services Engineers (CIBSE). Environmental design, CIBSE Guide A; Chartered Institution of Building Services Engineers: London, UK, 2015. [Google Scholar]
Figure 1. Typical floor plan and views of the building.
Sustainability 11 04265 g001aSustainability 11 04265 g001b
Figure 2. Building’s solar gain in different elongation.
Sustainability 11 04265 g002
Figure 3. Different alternatives for positioning a window film.
Sustainability 11 04265 g003
Figure 4. Baseline model’s energy consumption breakdown.
Sustainability 11 04265 g004
Figure 5. Annual actual energy consumption from 2010 to 2018.
Sustainability 11 04265 g005
Figure 6. Monthly occupancy rate of the hotel from 2010 to 2018.
Sustainability 11 04265 g006
Figure 7. Monthly total energy consumption and its breakdown.
Sustainability 11 04265 g007aSustainability 11 04265 g007b
Figure 8. Illustration of thermal analysis simulation (TAS) results and the actual energy consumptions.
Sustainability 11 04265 g008
Figure 9. Average maximum temperature from 1981 to 2010 [39].
Sustainability 11 04265 g009
Figure 10. Energy consumption of the three models. Low-E: Low-emissivity; DGU: double glazed unit.
Sustainability 11 04265 g010
Figure 11. Monthly total energy consumption for the three models.
Sustainability 11 04265 g011
Figure 12. Monthly energy consumption in three models.
Sustainability 11 04265 g012
Figure 13. Changes to CO2 emissions of the three models.
Sustainability 11 04265 g013
Figure 14. Changes to fuel consumption of the three model.
Sustainability 11 04265 g014
Figure 15. Changes to energy costs of the three models.
Sustainability 11 04265 g015
Figure 16. Operative temperatures during the peak of heating- and cooling-dominant periods.
Sustainability 11 04265 g016aSustainability 11 04265 g016b
Table 1. Window film specification applied on a single pane window.
Type of Window FilmVisible LightG-ValueLight to Solar Gain (LSG)UV BlockHeat Gain Reduction %Heat Loss Reduction %
Reflected % (Interior)Reflected % (Exterior)Transmitted %
Thinsulate CC 751216740.531.499.93540
PR 70 EXT77710.481.599.941-
PR 40 EXT56420.391.699.953-
Table 2. Window film specification applied on a double pane window.
Type of Window FilmVisible LightG-ValueLight to Solar Gain (LSG)UV Block %Heat Gain Reduction %Heat Loss Reduction %Emissivity
Reflected % (Interior)Reflected % (Exterior)Transmitted %
Thinsulate CC 751721660.511.399.927400.15
PR 70 EXT1412630.391.699.945-0.84
PR 40 EXT137370.291.399.959-0.84
Table 3. Summary of the regression analysis for the impact of occupancy rate on energy consumption.
Number of ObservationsMultiple RR Squaredp-Value
1080.6080.370<0.005
Table 4. Summary of the regression analysis for the impact of heating degree day (HDD) on energy consumption.
Number of ObservationsMultiple RR Squaredp-Value
1080.7750.600<0.005
Table 5. Summary of the impacts of Thinsulate and sun control films.
Measure TakenHeating Energy Consumption %Cooling Energy Consumption %Total Energy Consumption %CO2 Emissions from Gas %CO2 Emissions from Electricity %Total CO2 Emissions %Gas Costs %Electricity Costs %Total Energy Costs %
Thinsulate Films3202.70.56.84.10.56.85.1
Low-E DGU16.8 19.84 2.77.25.32.77.2 6
PR 70 EXT−0.2282.1−0.5 53N/A53
PR 40 EXT−1.3321.9−163N/A63
Note: The negative numbers represent an increase in energy consumption/CO2 emissions. N/A: Not Available.

