1. Introduction
Numerous recessions in the past have wreaked havoc on the roots of state-based industries with many negative effects, including economic slowdown. Global threats, such as the 2008 subprime mortgage crisis in the US and the 2016 financial crisis in China, may affect other countries, as well. Therefore, there is an increasing need to prepare for these threats by detecting their risk. Several studies have been conducted to predict the possibility of financial accidents through monitoring. However, if such monitoring is not performed correctly, it may lead to more adverse effects. Furthermore, if misleading policies are established for a company, the company may face crucial credit consequences, such as bankruptcy. In addition, investors are particularly sensitive to monitoring. If they make a wrong choice, they may pay for it dearly. Therefore, investors are trying to obtain meaningful results for their investment by acquiring and analyzing a variety of information using their own methods. It is important for investors to know what kind of data to acquire and how to acquire new data. If investors can acquire diverse data, they are more likely to make unbiased decisions. Furthermore, if they acquire newer data, they may obtain more favorable results. Besides accuracy, acquiring unbiased and fresh data is also important to assist users to invest.
Many studies have exploited firm data, such as financial statements and disclosure data. These data can be used as the basic data for analyzing companies because they objectively represent the company. Thus, many studies have analyzed firm data as fundamental data that objectively express the firm [
1,
2]. Firm data could be used to exploit the risk level of the firm. They also provide information about the superiority of the enterprise [
3,
4]. Other studies have proposed that companies could be evaluated with not only firm data but also in other ways, such as with social data. Several studies have shown that risk detection can be performed through social data [
5,
6,
7,
8,
9,
10]. These studies have suggested that economic news and social data may trigger financial market movements and organizational behavior, and that patterns of SNS (Social Network Services) investors can have a significant impact on other investors’ trading behaviors. Since the crime rates of stock price manipulation through organizational behavior and arbitrage transactions using non-transaction information are increasing recently, these movements can be detected by using news and social data. However, the data used to analyze firms in previous studies have limitations. First, in the case of data disclosure or financial statements, the analysis of data may have results that are different from actual investment results. Even companies that are sound in their financial statements may manipulate their accountings or have incidents that are not recorded in their accountings. If investors make investment decisions based on these data, it is too late. In other words, when data are confirmed, and an investment is linked to those data, it is too late for investors to respond, because the information is likely to be reflected in the market already. In previous studies exploiting opinion mining, real-time updates were not made because their data were acquired and analyzed in advance. As a result, the data used in previous studies may be biased. In addition, data analysis may not be performed in real time. Therefore, it is possible to make wrong choices when investing through acquired information.
To overcome the limitations of previous studies, it is important to develop an intelligent investment decision support algorithm. This algorithm combines disclosure data, artificial intelligence, and opinion mining with vast amounts of social data and news and can be used to not only analyze firm data, but also to reflect investors’ opinions. To do this, a database is constructed in this study by collecting data related to investment based on web crawling. In addition, a sentiment lexicon associated with investment is created for machine learning. With the collected data, we conducted semi-supervised learning and detected a promising/risk signal for each firm. Finally, by selecting the investment risk group according to the detected signal, we suggest the at-risk investment firm, visualize the result, and present the result as a system. Through this study, users can minimize diversion from data by acquiring and analyzing various data sources. In addition, these data can be periodically collected to update the information and reflect the update in the results so users can quickly identify meaningful information. Our ultimate goal is to present a tool that can be easily grasped by users by suggesting and leveling risk based on the obtained information.
Chapter 2 describes background theories related to financial decision-making support systems, opinion mining, and risk detection. Chapter 3 designs a system for developing a financial risk prediction algorithm. Chapter 4 illustrates analysis results based on actual cases and visualizes them as a system UI. Chapter 5 discusses issues of the proposed system’s output. Finally, Chapter 6 presents the conclusions and limitations of this study and suggests future research.
2. Background
2.1. Financial Decision-Making Support System
One of the most important activities in business management is decision-making. The business environment is becoming more complex. The connectivity of various elements is also increasing. Thus, decision-making is becoming difficult and unpredictable. A decision support system is currently being used to assist decision makers not only in firms, but also in individual units. Its use is increasing day by day. Different systems are being used in various fields, as there are various methodologies for providing solutions. Yazdani et al. [
11] conducted research to provide an ideal solution based on the Quality Function Deployment (QFD) in the agricultural supply chain. Scalia et al. [
12] proposed a multi-variate decision-making system for pancreatic islet transplant. A decision-making system that assists in uncertainty during medical diagnosis using a fuzzy system was also developed [
13].
In the stock market, decision-making systems are used in various ways. Paniagua et al. [
14] suggested an autonomous emotional decision-making system using artificial emotions to improve the decision-making autonomy of the system and achieve better investment results. An adaptive stock index trading decision system has been proposed to predict the movement of stock index prices, capture trading opportunities, and minimize errors and costs [
15]. Weng et al. [
6] developed a financial expert system for predicting short term stock prices based on counts and sentiment scores of news articles. Another system to assist users in financial trading has also been proposed, to predict stock trading patterns by integrating the support vector machine and portfolio selection theory [
16].
However, these previous studies mainly reflected the perspective of the company, while perspective of investor was not simultaneously reflected. Since the investor is one of the most important roles in the financial field, the investor needs to be reflected to derive an accurate result. Thus, a business-oriented indicator considering the objectivity of a firm is proposed in this study. Another type of indicator that reflects the perspective of investors is also proposed. Based on both types of indicators, the results reflect both perspectives and show the proper overall risk level of the enterprise, to assist investors for future investment.
2.2. Opinion Mining
Opinion mining, also known as sentiment analysis, refers to the extraction of subjective emotional information. Human language is divided into positive and negative elements, which are freely described according to natural language processing and text mining [
17]. Opinion mining research can be categorized and has been used to derive quantitative and qualitative information. Research that derives quantitative information from opinion mining is focused on the perspective of emotional analysis, while the other is focused on the perspective of content analysis. Quantitative information opinion mining proposes sentiment value for information based on the degree of positive and negative opinions. Sentiment value suggests the relative value of negative and positive numbers. However, it is not a binary classification of affirmative or negative. Singh et al. [
18] analyzed movie review data and derived an evaluation from users. Min and Park [
19] proposed a methodology for screening and using review data based on sentiment value. Qualitative information opinion mining aims to extract specific contents from opinion. Lee [
20] extracted the needs of users from online reviews. Thorleuchter [
21] explored potential customers based on the characteristics of the reviewers. Ghazizadeh et al. [
22] tried to determine the complaints of specific targets from various reviews and proposed ways to solve these complains. Alkubaisi et al. [
5] suggested a classification model in the stock market exchange based on a sentiment analysis of Twitter. Zhang et al. [
7] developed a model for the reliability of stock comments by considering analysts’ opinions and their shifting patterns.
In the current study, factors that could influence the investment choice of each firm were proposed from the perspective of a combination of quantitative and qualitative analyses. The influence of each factor was then presented as a quantitative value. News and subjective investor opinions were analyzed to determine the objective and subjective opinions of each company. Since news conveys objective facts for each company, it can be interpreted as a factor through which investors can decide whether to invest or not. Furthermore, subjective investor opinions of objective facts about companies, expressed in SNS and the security community, can be used as an effective basis for decision-making by other investors who do not express such opinions. The derived data were exploited to extract positive and negative core keywords that could influence investment choice. Each core keyword is derived by a Naïve Bayes Classifier. By using graph-based semi-supervised learning, the emotional values of the SNS and news documents were derived by calculating the emotional values of the factors related to the company, excluding core keywords. Finally, the risk signal is predicted from four perspectives to derive a unified indicator of the investor’s perspective. This value is then used to monitor bad credit events for the company with a credit risk.
2.3. Risk Detection in Financial
Firms need to consider many aspects of their business. They especially need to monitor risks that may arise. To avoid or prepare for risks, firms have been constantly exploring the development of systems that can anticipate and alert firms about risks in advance. An early warning system (EWS) is a representative system that can reduce the risk of an enterprise or an individual by predicting an unusual situation. It can also assist in the identification of risks quantitatively based on current conditions and possible risks [
23]. EWS can be used in various fields, including financial monitoring and reporting of potential problems, risks, and opportunities before they may affect financial statements. Therefore, EWSs provide opportunities to prevent or mitigate potential problems [
23].
The EWS used in the financial field has been developed based on several models. A traditional EWS exploits regression models, such as logistic and probit models [
24,
25]. A model that reflects country-specific characteristics has been proposed using various indicators [
26]. A multiple-criteria decision analysis (MCDM) based methodology has also been used [
27]. An EWS using an artificial neural network has also been proposed. For example, Brockett and Cooper [
28] proposed an EWS using a neural network based on various variables. Kim et al. [
29] used EWS models based on an analysis of the Korean economy using an Artificial Neural Network (ANN) as an indicator. Yang et al. [
30] exploited the EWS with ANN to detect the financial risk of a bank. However, these studies were focused on indicators that could represent the status of companies, while the opinions of investors were not reflected sufficiently. This problem needs to be overcome because it can lead to biased results due to enterprise-centered evaluation.
Therefore, the present study suggests a new concept in risk detection by adding a process that can reflect the opinions of investors. This concept exploits indicators that can represent the company. The risk level from the firm’s perspective and the opinion level from the investor’s perspective are linked with each other to derive a comprehensive risk level. The degree of risk is then determined by judging the trend or situation of the firm. Based on the degree of risk, investment strategies are provided. Finally, a system is proposed and results derived from the system are illustrated.
3. System Design
3.1. Basic Concept
The main purpose of crisis detection research is to find signals by collectively using data related to companies. Disclosure data and financial statements are usually exploited to identify risk signals because these data describe the firm objectively. These data can be used to identify firm activity and credit events of the past. Thus, they are useful to determine corporate soundness and pinpoint companies that need monitoring. Although some companies can be evaluated as sound companies by data such as financial statements, they may possess hidden risks, such as accounting manipulations or serious events that are not presented in the disclosure data. For such companies, a risk signal can be derived by analyzing data other than financial data, such as the opinions of investors. Therefore, opinion mining is exploited to derive hidden information or reflect investors’ opinions about the firm. These two datatypes are then exploited together to calculate a risk signal indicator for each company. The risk signal indicator is defined based on the probability of the occurrence of a credit event. The risk level of the company is also derived by the calculated indicator. Finally, a series of processes are systemized to enable continuous risk signal detection of the firm. Thus, this study evaluates a crisis in two aspects: (1) the opinion mining aspect of corporate data that can objectively express the company; and (2) investors’ opinions of the company as shown in
Figure 1. Such a comprehensive risk assessment could lead to more accurate risk level monitoring for the firm.
3.2. System Process
3.2.1. Credit Risk Evaluation
For credit risk evaluation, financial statements and disclosure data are used so that the risk degree of a company can be assessed quantitatively. Financial statements and disclosure data are quantitative documents that show the financial status and business performance of a company. As described in
Section 2, these data have been analyzed in various studies. Financial indicators based on disclosure data are selected to identify the possibility of the following credit events that could occur in the company: (1) abolishment of a listing, (2) insolvency, (3) rehabilitation proceedings, and (4) bankruptcy. The related indicators for each credit event, and their explanations, are listed in
Table 1.
The monitoring indicator is proposed to evaluate the risk level of a firm based on a financial statement and prior studies of financial indicators [
31,
32,
33,
34,
35,
36,
37]. Indicators already used by banks are examined first, due to their availability, to choose proper indicators. The final set of assessment indicators was reviewed by the researchers and financial experts at a leading financial investment company in Korea. These indicators used by banks are shown in
Table 2.
Table 3 shows monitoring indicators associated with each credit event based on financial statements. Monitoring indicators based on disclosure data are counted when each type of incident related indicator is registered. The validity of the disclosure data is measured within three months, six months, and one year, because the Korean financial services commission has suggested that the situation of a debtor should be monitored for about three months for its ability to repay future obligations. The world’s top three rating agencies—Moody’s corporation, S&P, and Fitch group—have a grace period of six months for credit rating adjustments. KOSDAQ and KOSPI in the Korean stock market are currently evaluating delisting criteria for a period of one year. Referring to these cases mentioned above, the disclosure data of a firm are evaluated by dividing the period into three sections (3 months, 6 months, and 1 year).
Some proposed disclosures may have positive and negative effects on the market. For instance, the disposal of treasury stock can be interpreted as positive if it is used as a means to improve the firm’s environment or to raise investment resources for the long term. On the other hand, there is room for negative interpretations. For example, it can be interpreted that the company lacks money for financing.
Table 4 shows the list of the possibilities through which the monitoring index can be evaluated as positive or negative and the proposed criteria for evaluating the decision. Candidates for each indicator were selected by referring to previous studies [
34,
38,
39] and, finally, after a review by experts, as shown in
Table 2 and
Table 3. If an indicator is evaluated as positive, it is counted as −1. If the indicator is evaluated as negative, it is counted as +1.
3.2.2. Opinion Mining
The opinion mining process conducts opinion mining evaluations of companies based on corporate news and community opinions. First, firm related news and opinions are gathered. Unnecessary information and advertisements are then removed from these collected data. These refined data are then parsed for sentiment analysis and word2vec analysis. After data collection and refinement, stock prices are exploited to assign sentiment values. It is assumed that the period that news and social data can affect stock price volatility is three days. For instance, if the stock price of company A rises on September 1, opinions registered between August 29 and August 31 are considered as positive. These three days were used as a standard period in which opinions were well reflected in the stock price through qualitative evaluation.
Keywords with definite polarity values are selected. Sentiment values are then assigned to opinions to derive the sentiment value for each word. Four keywords with the largest sentiment values among the calculated words are selected. Based on the co-occurrence of the word using previously parsed data, word embedding is performed with word2vec. The coordinate value of the word is then derived based on embedding. Finally, sentiment values and coordinates for the core keyword derived from the above are associated with the word embedding result. The sentimental value for each word is then derived using the distance between the core keyword and other words. When the core keyword is positive, similar characteristic words will be embedded near the core keyword. Thus, they can be evaluated as positive words. Likewise, when the core keyword is negative, embedded words near the core keyword can be evaluated as negative words. Ultimately, the sentiment values of all words can be calculated based on their distance from the core keyword. After calculating the sentiment values for all words, the sentiment value per document is calculated.
The distance between the word and the core keyword uses Euclidean distance. The sentiment value is allocated in inverse proportion to the distance. The sentimental value of the keyword, the proximity index between the keyword and core keyword, and the distance between the keyword and core keyword are as follows:
For example, if there are two core keywords, ‘shipping’ and ‘buying’, coordinates of ‘shipping’ are derived as (1.2522, 0.0515), and the sentiment value is −17.1. Coordinates of ‘buying’ are derived as (−5.1012, 3.1122), and the sentiment value is 20. If the coordinate value of the word ‘high altitude’ is (1.8050, 0.7221), the distance difference between ‘high altitude’ and ‘shipping’ is 1.3233, while the difference between the coordinates of ‘high altitude’ and ‘buying’ is 0.0187. If the sentiment value is calculated according to the above equation, it is −22.2658.
The monitoring index for opinion mining is then calculated based on the sentiment value of the document. The above-mentioned monitoring indicators are used to indicate the negative level of a firm by analyzing the ratio of negative documents or the period during which the negative opinion is maintained in order to determine the risk signals of the firm. Since units for the various indicators are different, standardization is exploited to integrate the indicators. Definitions and explanations of each indicator and unit are shown in
Table 5 3.2.3. Signal Detection
The risk signal of a company is explored by utilizing the monitoring index, including the index based on disclosure data and financial statements and the index based on opinion mining. Financial statements and disclosure data can be treated as external evaluations of corporate activities and the status of the company. Opinion mining is not only related to corporate activities but also to investors’ opinions or external environmental assessments. Financial statements and disclosure data are updated regularly or irregularly according to the time of submission. On the other hand, the sentiment value of opinion mining always changes. Therefore, the signal should be divided into two perspectives. The value is expressed as follows:
To suggest a risk signal, each type of indicator is classified into five grades. To classify these grades, cut-off values are defined. A total of 528 cases are analyzed to determine cut-off values. Cut-off values are determined according to the top 20%, 40%, 60%, and 80% of each index, as shown in
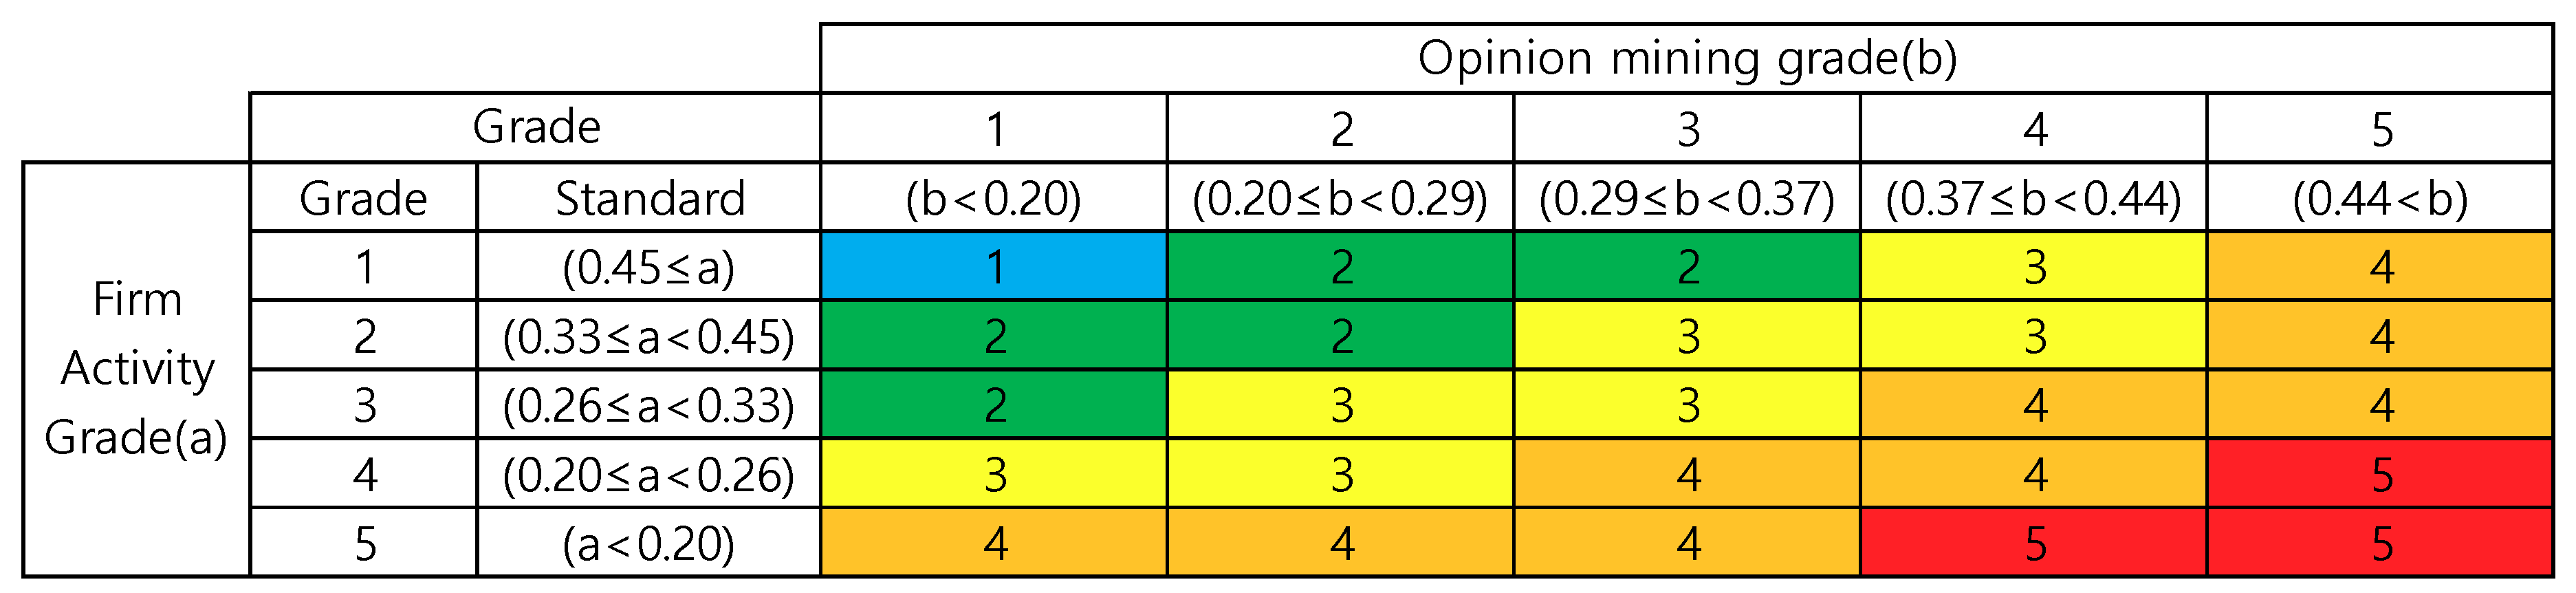
Table 6. Each indicator was standardized from 0 to 1. An integrated index was calculated by the weighted sum between them. In this case, the weight of firm activity was defined as 40% in the financial statement weight and 60% in the disclosure data weight. There is no significant change within one year in the case of financial statements. However, since disclosure data can always be obtained, these disclosure data are assigned a higher weight because they are highly likely to affect the investment of the company. In other words, it is possible to make a more accurate prediction by using an indicator that constantly fluctuates from a fixed perspective. Finally, based on the measured business activity index and opinion mining index, the interval average grade is measured for 1 year, 6 months, and 3 months. Furthermore, the total risk grade is derived by following the total risk grade matrix based on the calculated firm activity grade and the opinion mining grade. This value is shown in
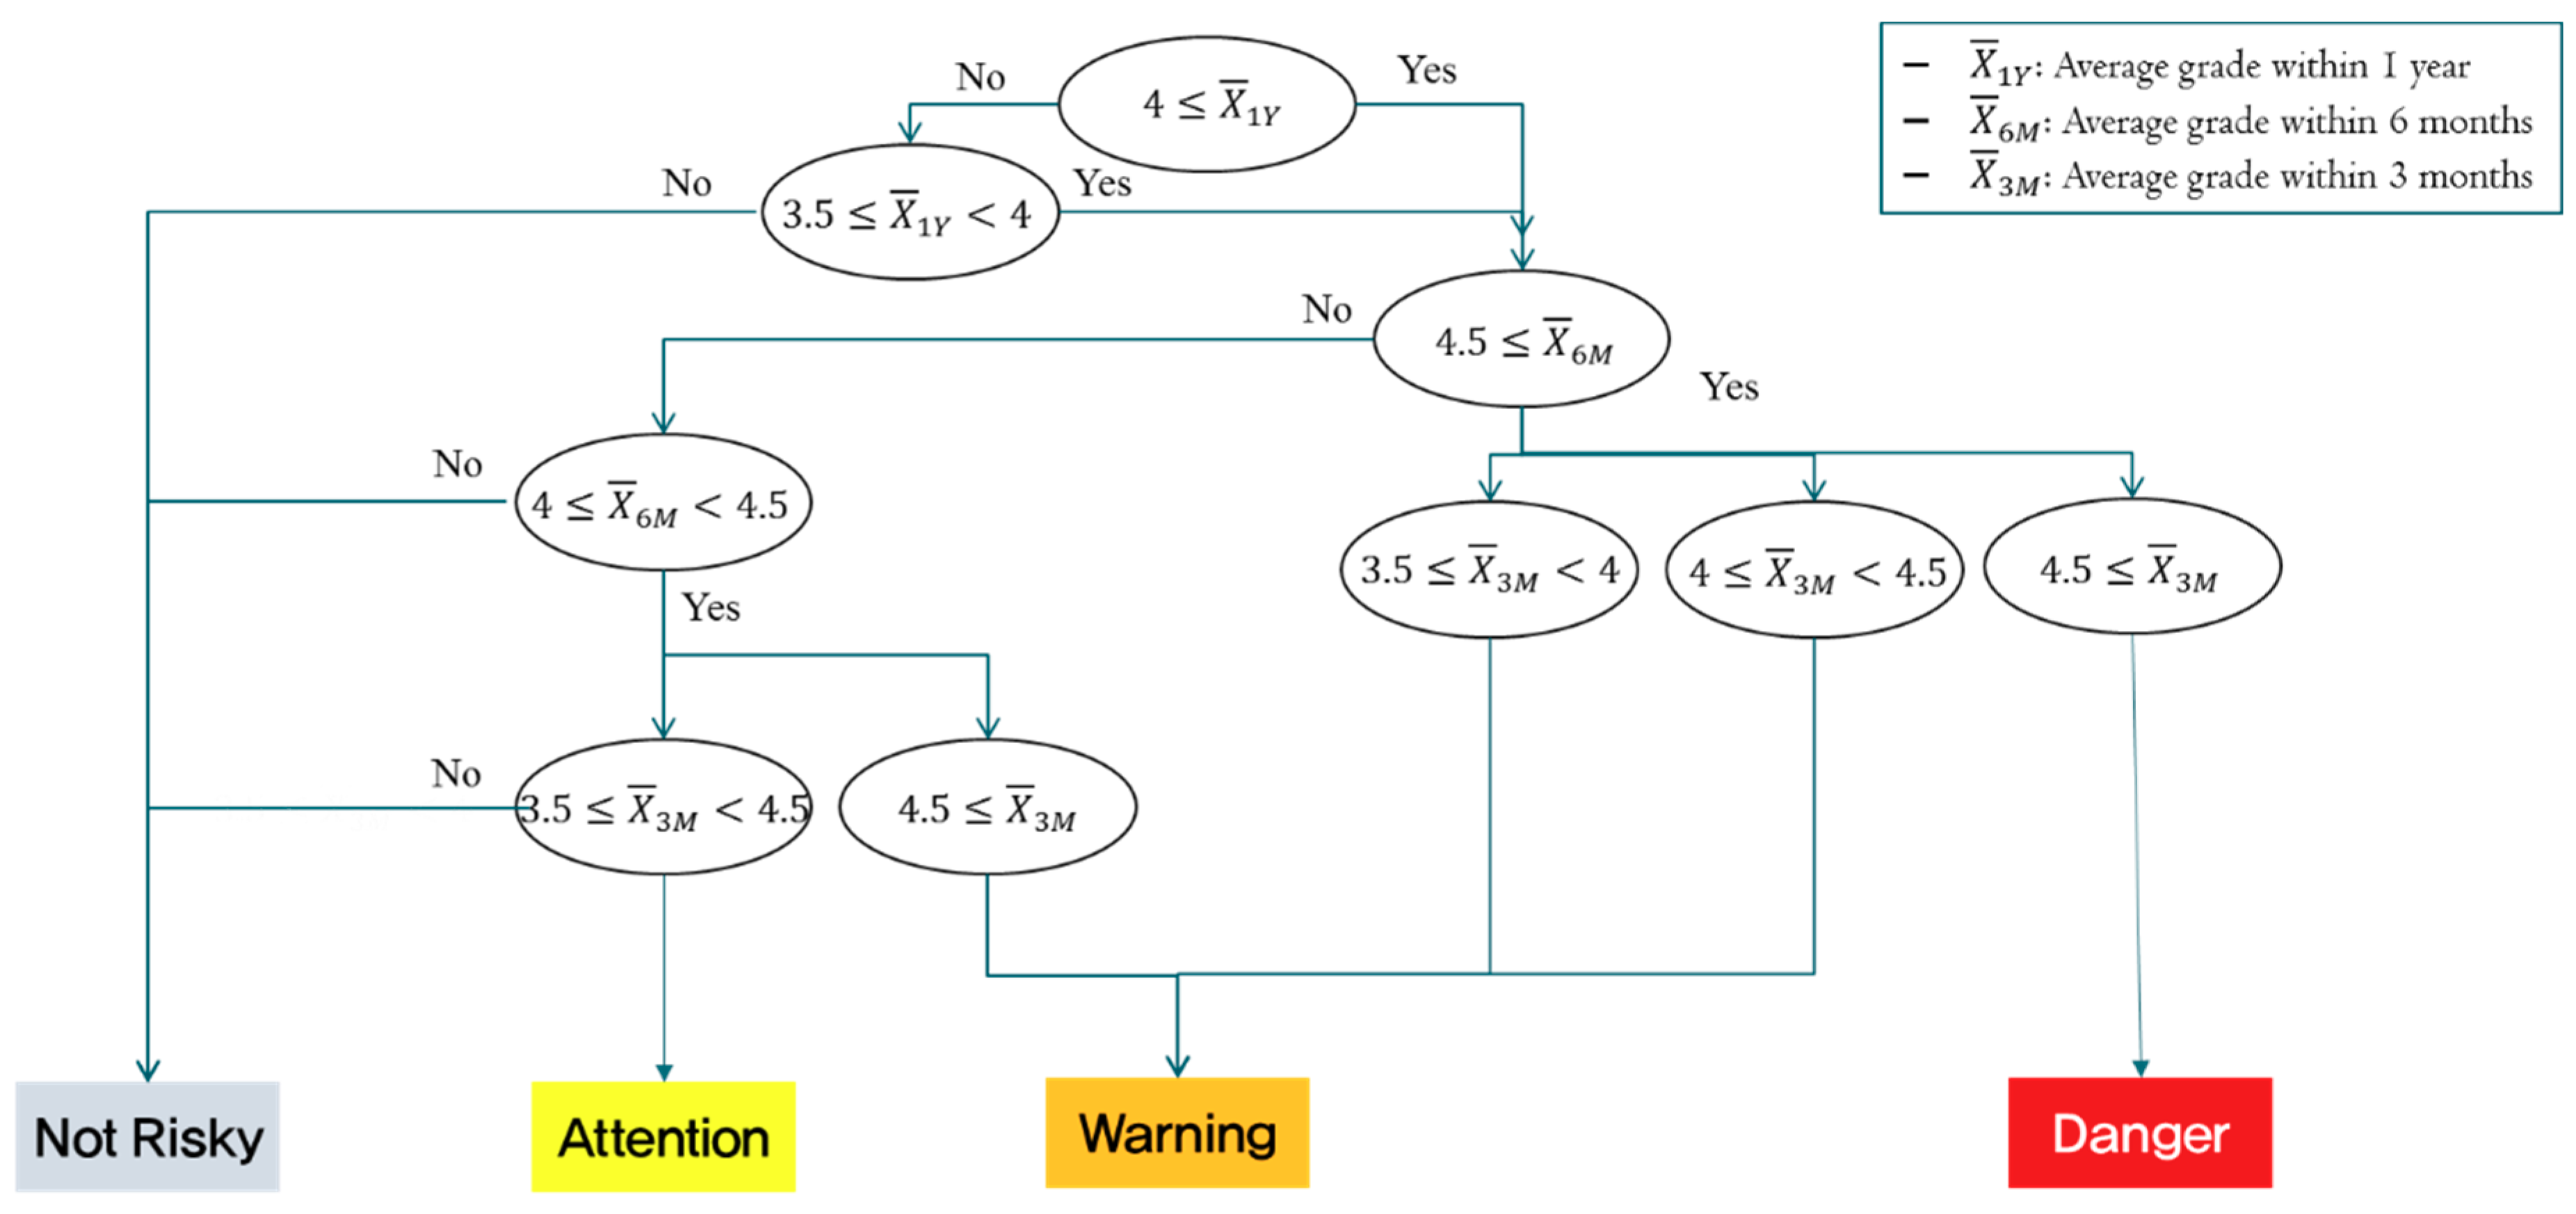
Figure 2. Grades are then classified into danger, warning, or attention signals. The total risk grade is evaluated from two perspectives: the firm activity grade and the opinion mining grade, derived in total from grades 1 to 5. For example, if the firm activity grade is more than 0.45, and the opinion mining grade is less than 0.20, then the total risk grade is ranked #1, with the lowest risk value. In contrast, if the firm activity grade is less than 0.20, and the opinion mining grade is more than 0.44, the total risk grade is selected as the highest risk grade of 5. The criteria used for distinguishing these risk signals are shown in
Figure 3.
In this study, the risk was conservatively recognized. The average of two indicator classes was rounded up for strict management. However, if the difference between the two grades is 4, the integrated risk grade itself is defined as 4 because grades deviating from each other may produce distorted results when using averages.
3.3. System Architecture
In this section, the types and modules of DB (Database) are defined. These types and modules are required for the system to systematize the research result. The system architecture shows what data are required for each module and where these data come from. A real system user interface will be illustrated in Chapter 4.
3.3.1. Database
To derive results from the risk assessment process, data are required. Since the data required for each process module are different, databases associated with these data are also different. The DB required for this process is divided into three categories: a corporate information DB, which contains disclosure data and financial statement of the firm, a news DB, where corporate news is collected, and a social DB that collects social data. First, the corporate information DB collects data related to company activities that are disclosed by each company. It contains financial statements and disclosure data. The news DB collects news data by searching articles linked to Korean search portal sites. These are collected by web crawling. Finally, the social DB exploits company-specific keywords on several community sites. Twitter is a representative example. The social DB also exploits web crawling for data collection. Unnecessary information and advertisements are then removed from news and social data. Preliminary processing is then performed by parsing for sentiment analysis and word2vec analysis.
3.3.2. Modules
Modules are needed to construct the risk assessment process. There are three modules: the credit risk assessment module, the opinion mining module, and the signal detection module. First, the credit risk assessment module evaluates the financial soundness of a company based on its business activities. The module then derives companies that are predicted to be at risk of bankruptcy as the risk group and uses them for analysis of the target companies. Based on the collected companies’ information, a Support Vector Machine (SVM) analysis is conducted to predict companies that have a possibility of default. SVM exploits past corporate data to distinguish between the credit event occurrence group and the normal repayment group. Financial indicators (business performance, profitability, stability evaluation) and non-financial indicators (number of disclosures) are exploited as independent variables. Credit events are used as dependent variables. The opinion mining module exploits news / social data and assigns sentiment values to opinions based on the fluctuation of stock prices. If the stock price rises, news and social comments created on that date are evaluated as positive. On the other hand, when the stock price declines, news and social comments are considered to be negative.
Finally, the signal detection module predicts the credit risk of companies that are selected as risk companies. Based on the characteristics of each signal, the possibility of future credit events and the risk level are then derived. To this end, the firm activity index and opinion mining index are used to generate ratings for each indicator of the company and identify the integrated risk level for each period. As a result of the module, changes in the risk level over time are plotted, and an investment risk signal is presented. Consequently, this signal can be divided into three stages (risk, warning, and attention), thereby presenting a risk level for each company.
3.3.3. Functions
This system can automatically check news articles, personal postings, and public information about the pre-selected company and provide the results of a numerical index-based risk assessment based on a sentiment analysis. In addition, system users can directly participate in the evaluation by marking data sources, such as news articles, as positive or negative. The results are reflected in the learning process of sentiment analysis and are dynamically updated to enhance analysis performance. For systemization, each module loads different data from the DB. First, the credit risk assessment module retrieves data from the corporate information database because the module is based on the company’s information. Its data include financial statements and disclosure data that contain a history of business activities. This module invokes a positive integer, such as how each major credit event occurs, and a normalized number that describes variables in financial statements. Next, the opinion mining module retrieves data parsed from the news DB and social DB. Finally, the signal detection module exploits the sentiment value of the opinion mining module and company information from the credit risk assessment module.
4. Illustration
4.1. Data Collection
In this section, we will illustrate a real firm in stock market. Company
A was chosen as the target for analysis. Company
A produces titanium dioxide and cobalt sulfate in Korea. It is currently an important company. Its stock has risen more than three times over the entire stock market and the KOSDAQ market, as of September. In addition, opinions of its users are diversified, and it has various disclosures. Thus, it is appropriate to select Company
A as a subject to be analyzed in this study. A period of one year (from September 2016 to August 2017) was selected as the analysis period. First, the data of company
A were collected. The collected data of company
A are shown in
Table 7. To collect the firm data, we developed R code for web crawling.
4.2. Credit Risk Evaluation
To evaluate the business activity index for company
A, data were taken from the company information DB. The number of financial statements and credit events in the disclosure data are the required data. For company
A, the number of disclosures in 2017 increased significantly. In addition, its corporate activity index changed drastically due to the issuance of corporate bonds (CB, EB). As a result, company
A had 8 credit events. Company
A is evaluated as a company that has a good asset size and quality. However, its business performance derived is not particularly good. In addition, its derived repayment ability is weak. Specific details are shown in
Table 8.
4.3. Opinion Mining
To evaluate the opinion mining index for company A, collected news and social data were fetched. Based on these data, a word2vec analysis was performed and the sentiment value was propagated to neighboring words based on the sentiment value of the core keyword. Sentiment scores of the entire document were calculated using the sentiment value of each word. Ultimately, it was possible to calculate the opinion mining index for company A. Through this process, a figure-like result was derived. In May 2017, the negative word ‘split’ appeared. In August 2017, negative words such as ‘convertible bonds’ were mentioned frequently. Very negative keywords appeared in relation to the issuance of corporate bonds in March 2017. In August, there were sudden market fluctuations. At the same time, negative terms such as ‘convertible bonds’ overlapped, indicating very negative values. On the other hand, in accordance with the government’s electric car policy, there was a period in which company A emerged as a beneficiary and was evaluated positively. In that period, a positive score was derived.
4.4. Signal Detection
The business activity index and opinion mining index for company
A are shown in
Table 9. Company
A showed large fluctuations in both ratings. In particular, the business activity level fell from 2 to 5 within one year. This was because the number of disclosures increased significantly in 2017. In 2017, the Korea Financial Authority requested disclosure from company
A four times, in order to evaluate company
A’s rumors. In addition, company
A issued two convertible bonds (CB) to secure operating funds. The risk level for company
A continued to fluctuate while proceeding to spin-off. As a result, company
A’s integrated risk rating was evaluated as very dangerous (4.4 for one-year, 4.31 for the past six months, and 4.50 for the recent three months). A high score was derived for its business activity. The opinion mining index, which scored over 3.5, was simultaneously calculated to be high. Thus, the integrated risk rating was evaluated as ‘caution’. This indicates that there is a need to pay attention to investment in company
A. It also indicates that continuous observation is necessary for company
A.
4.5. Interface Implementation of Risk Signal Detection System
After evaluating the integrated risk rating of a company, positive / negative keywords and relevant contents are visualized, key perspective points are then presented after assessing the integrated risk level for each company. Positive / negative keywords for each key point in the corporate valuation are presented. Keyword-related company data are then derived in the form of a keyword map. Customized monitoring and investment strategies for each risk assessment are then derived. In addition to the above-mentioned integrated risk level, this systemization will provide users with necessary information. This system aims to visualize the results after taking the required data from the DB and performing the necessary processes for each module, as shown in Chapter 3 above.
The process of collecting data begins by collecting new news, community comments, and dart announcements on a daily basis. When the program is executed, data collection starts automatically for the analysis of the target companies entered in advance. These collected data are presented in the UI (User Interface) as shown in
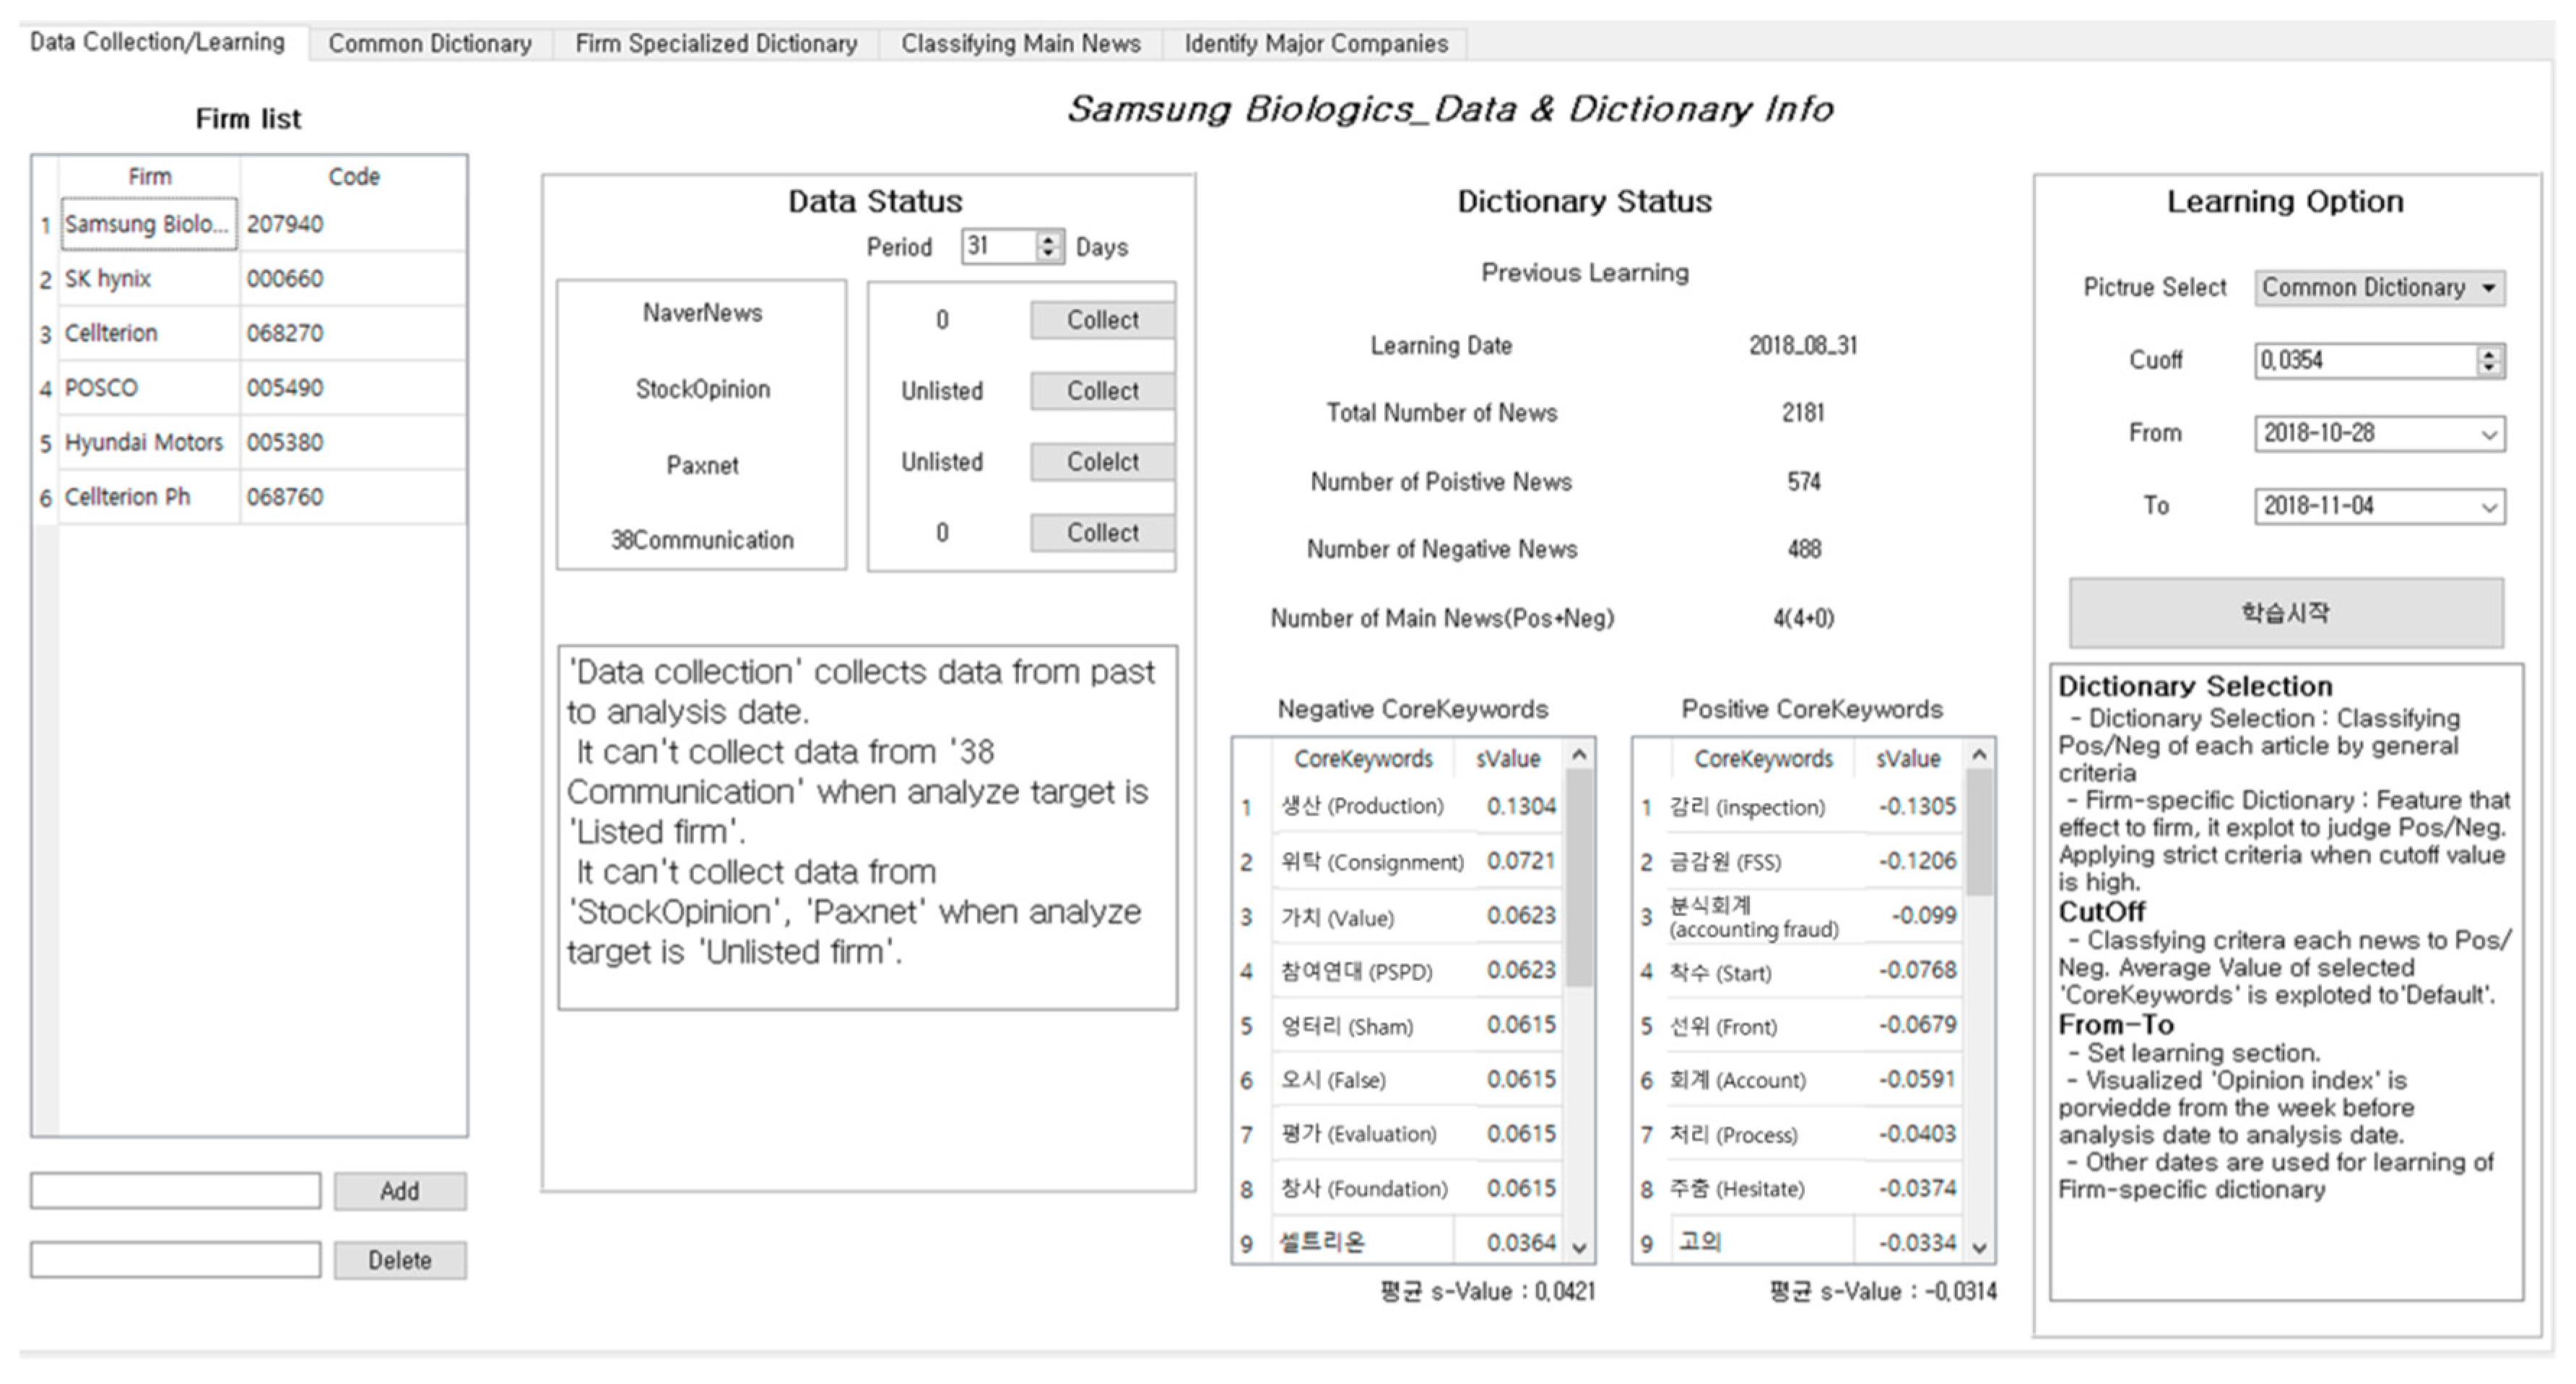
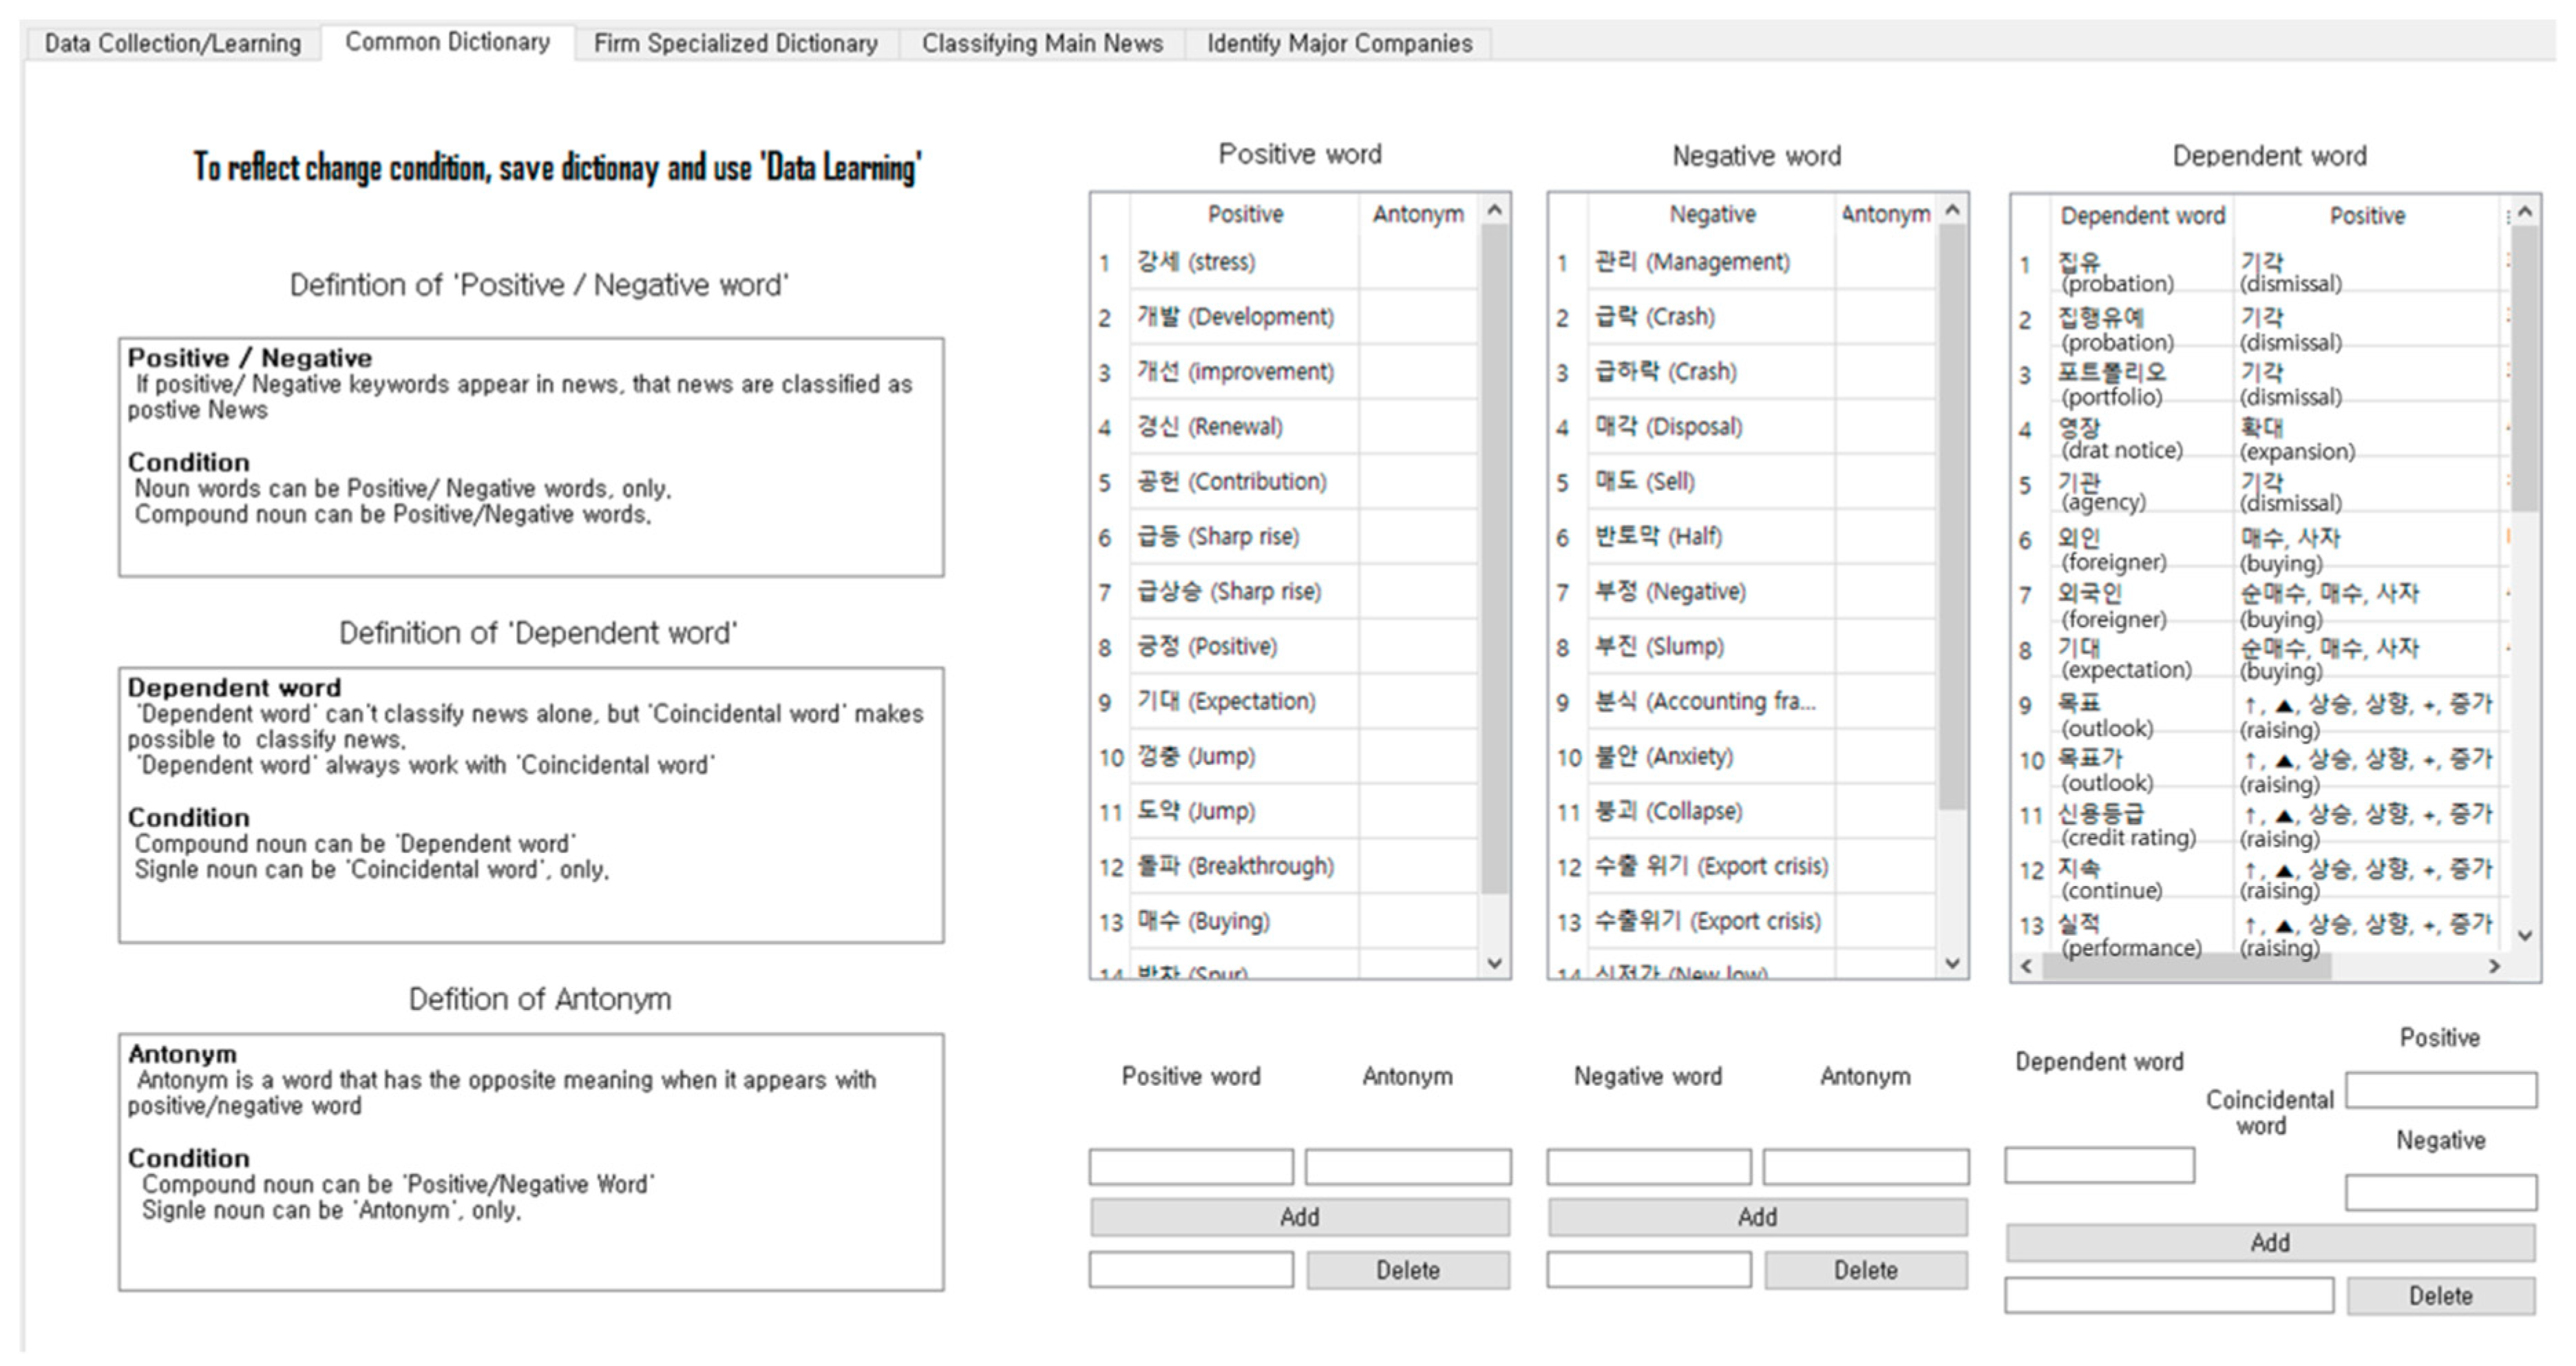
Figure 4. The period of analysis can also be set. In addition, positive and negative words registered in advance can be checked to improve the accuracy of the sensitivity analysis for each company as shown in
Figure 5. Word importance cut-off values and an analysis target period for learning the data are then set. When the setting is completed, the ‘start learning’ button can be pressed to move to the next step.
The main interface searches for companies and provides information about the opinion mining of the searched companies, as shown in
Figure 6. It provides opinion mining scores along with the daily news increase and decrease for all observed companies that the user has registered in advance. In addition, the main interface provides weekly positive and negative changes in the opinion index and news counts, which can be visualized in a word cloud, to visualize which core keywords appear in positive news and negative news.
If users want to acquire detailed information about an individual company, they can click on the name of the company on the left to go to the UI, which provides detailed information about the company. As shown in
Figure 7, users can see company-specific news, community opinions, and disclosure data in the UI.
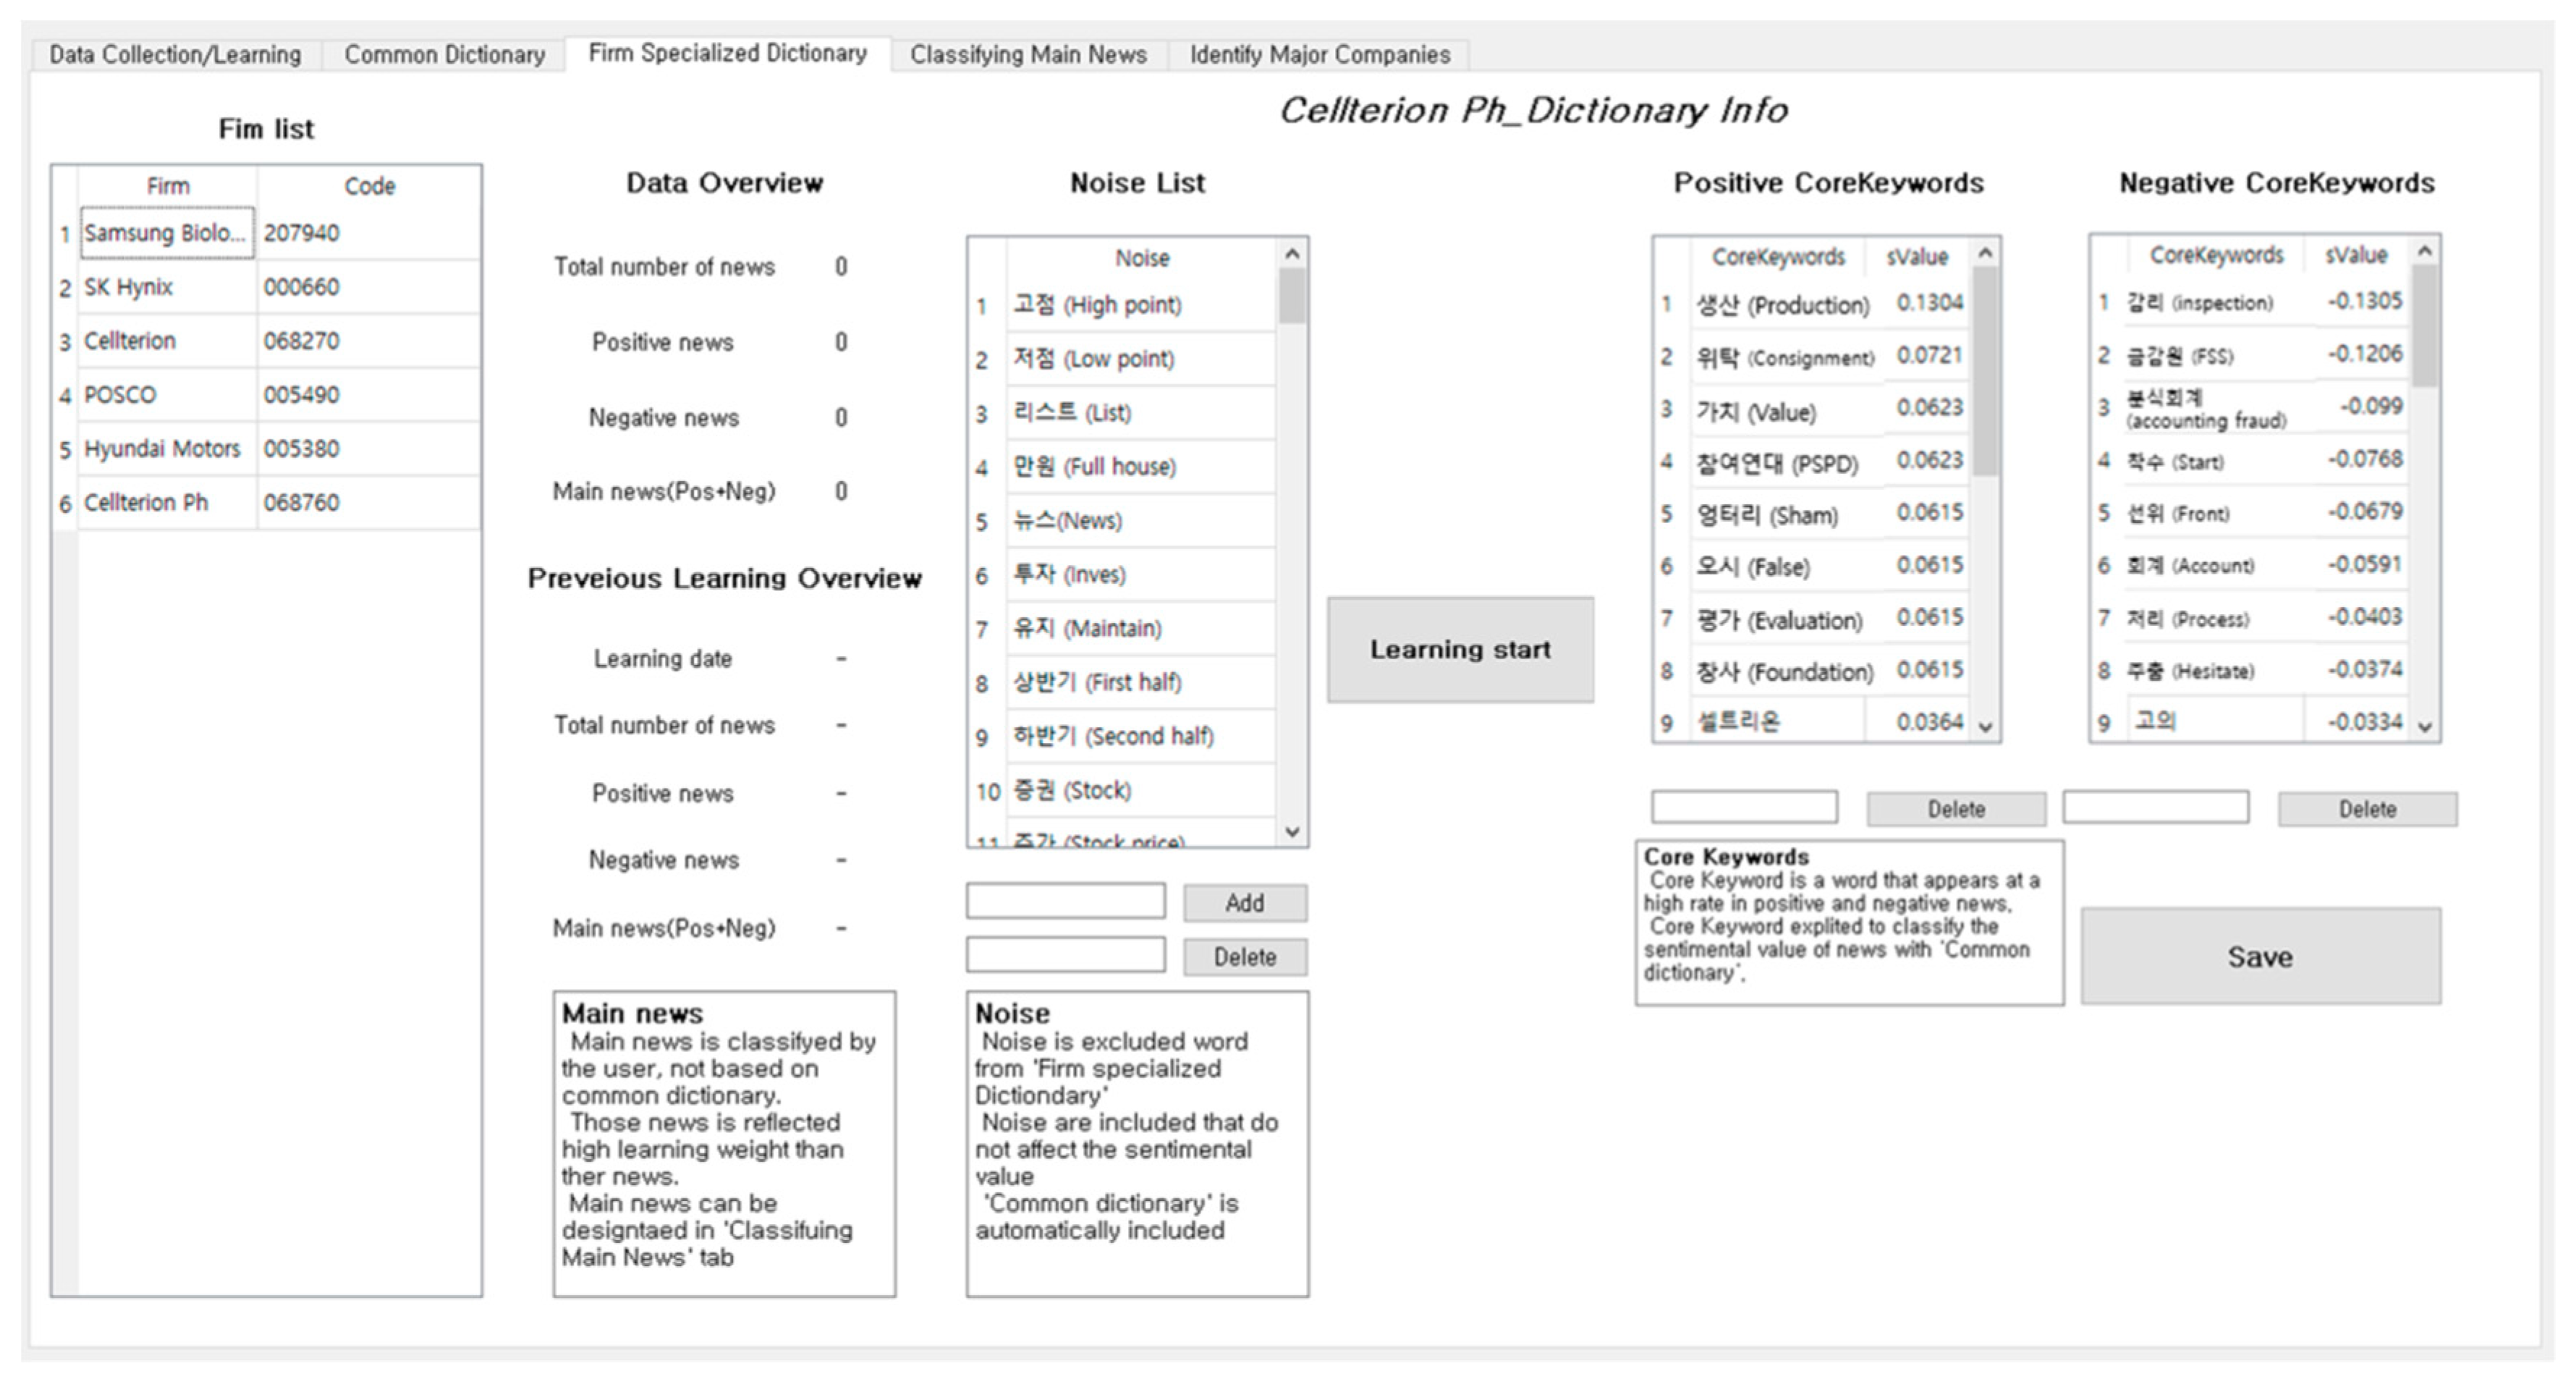
In order to acquire information about companies that are not registered, the system needs to learn about companies, as mentioned in the framework. The above UI screen is a UI for learning a company that has not yet been registered. The system then adds the company to the DB. First, the name of the company can be to be added in the lower left corner as shown in
Figure 8. The period of data to be learned is then set. The cut-off value that distinguishes between positive and negative news is set, and learning is conducted for company data. It is possible to increase the accuracy of the data by determining the positive or negative values of words by using the dictionary function or by adding the company’s core keyword as shown in
Figure 9.
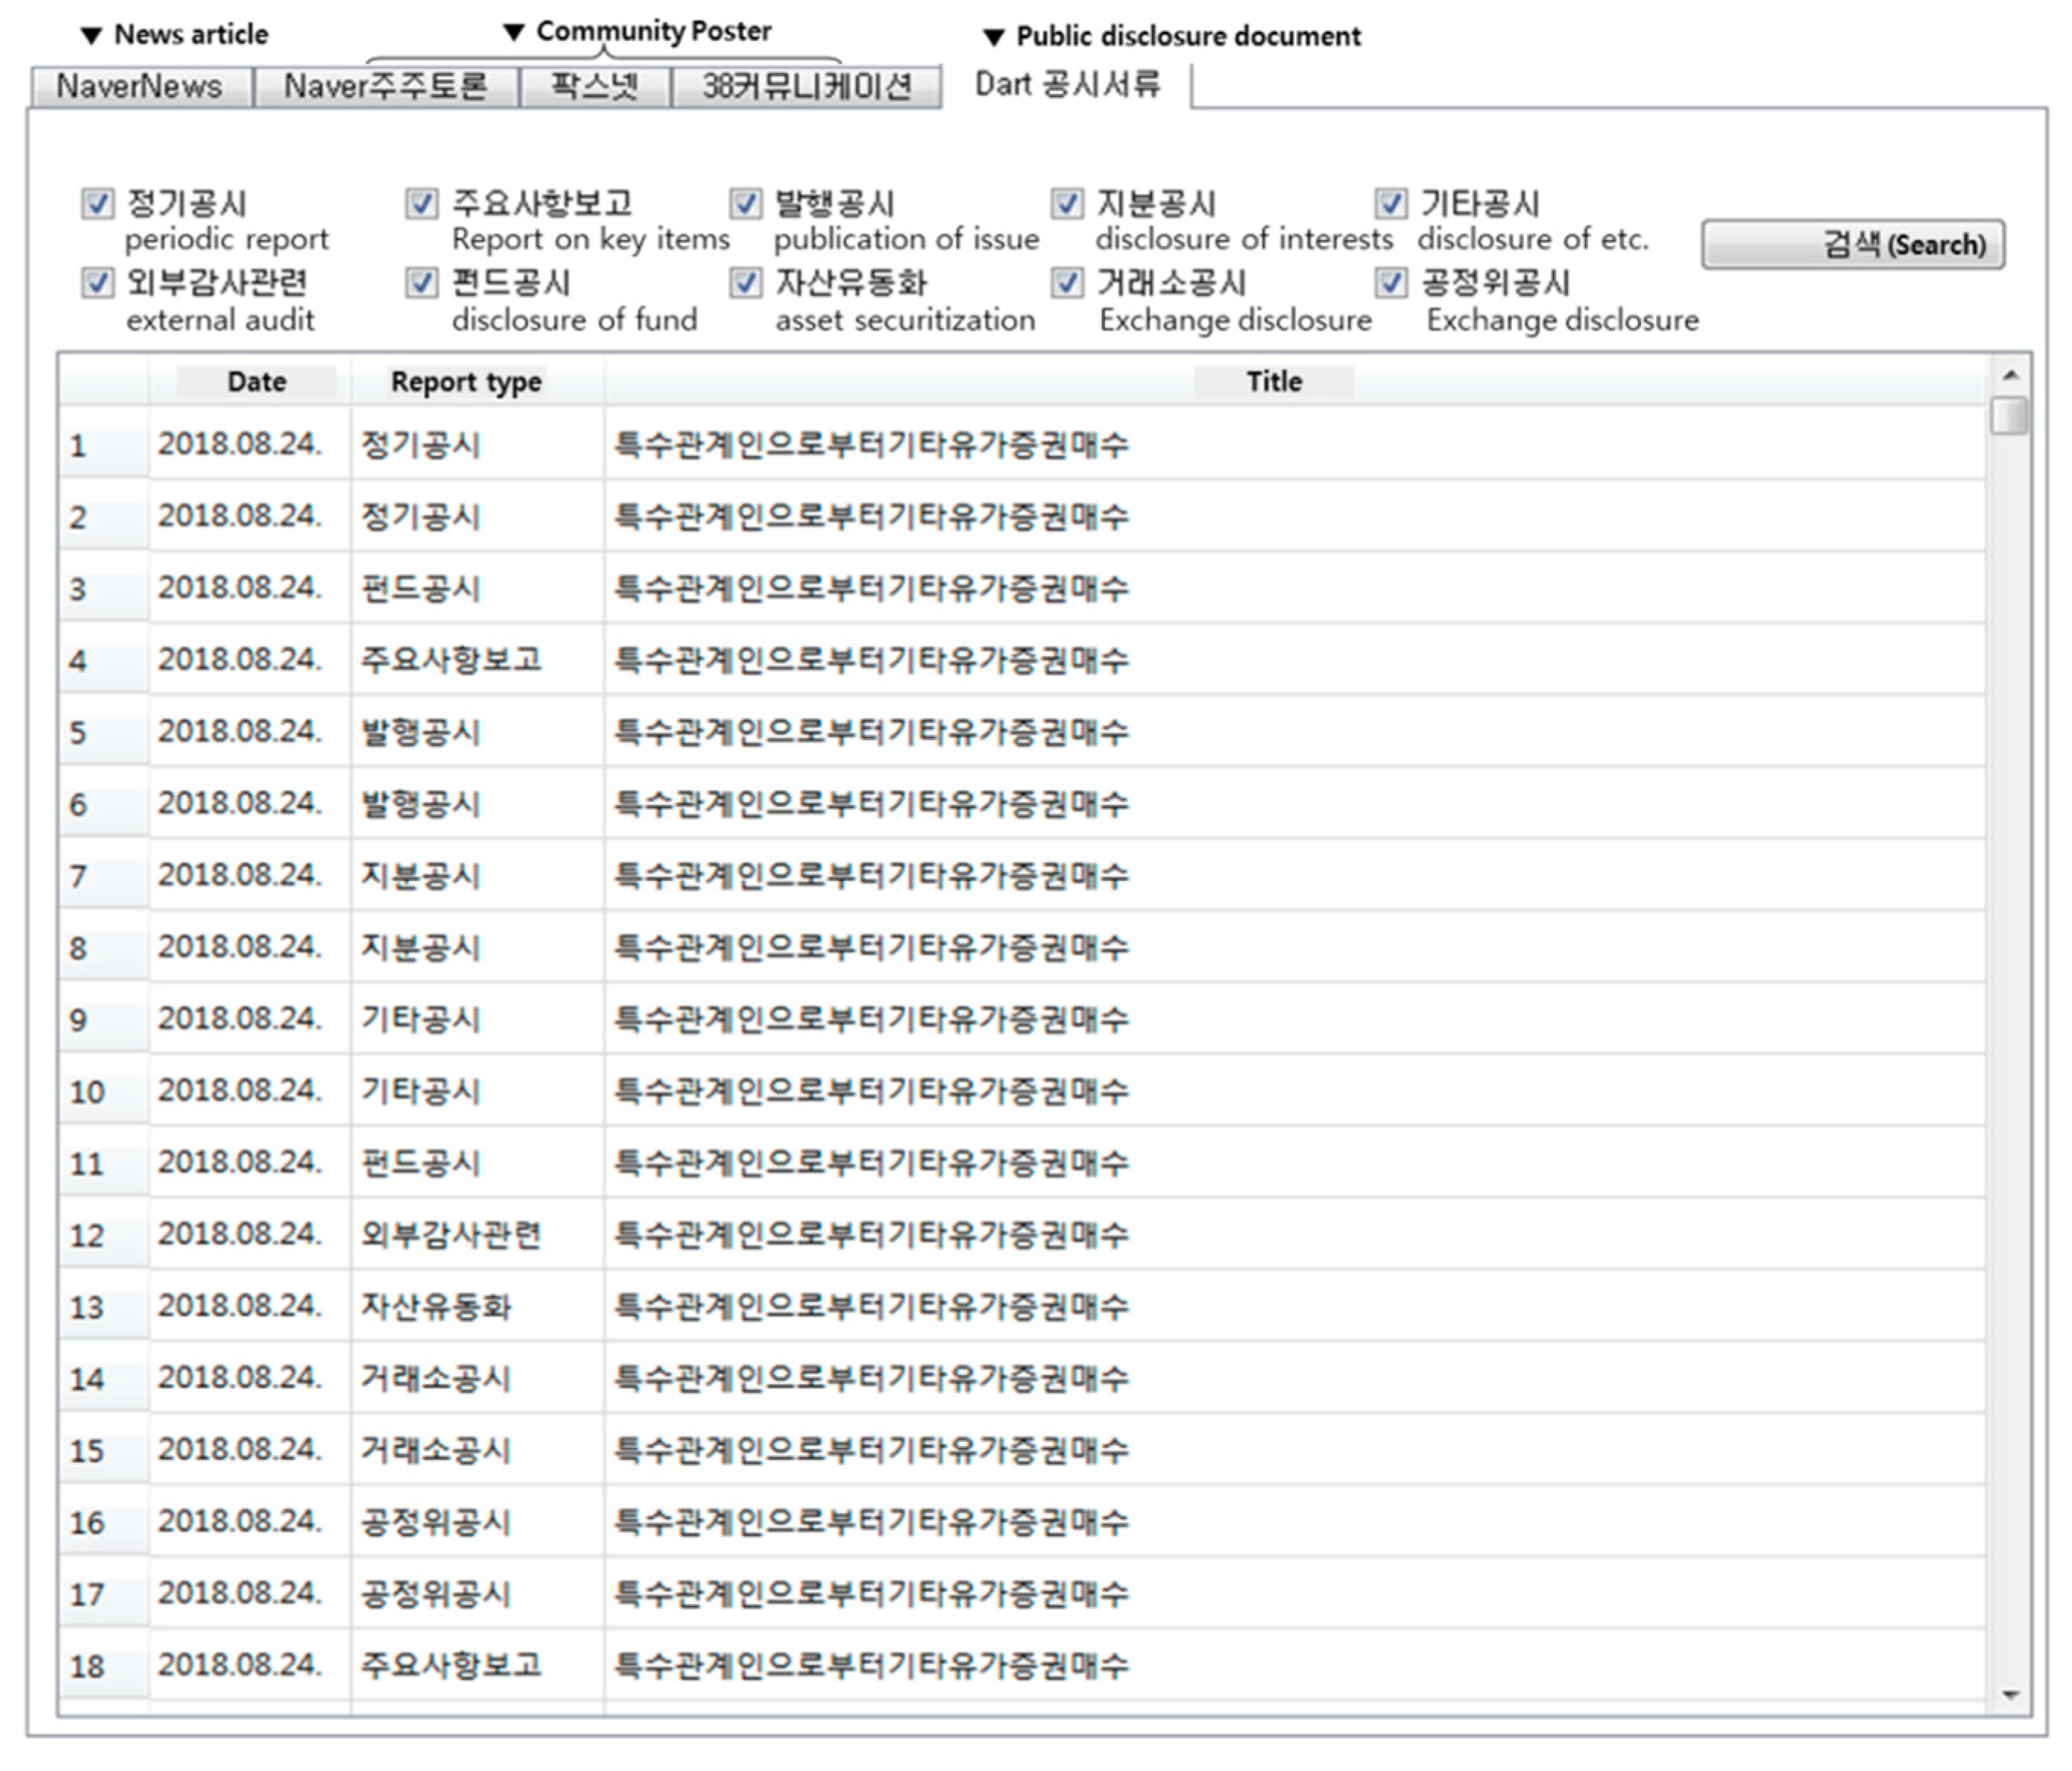
Based on the learned data, news can be checked based on what types of news have been reported for companies registered in the DB. These date are presented in the UI, as shown in
Figure 10. Using the proposed system UI, we can see that both the credit risk assessment module and the opinion mining module explained in the framework are utilized.
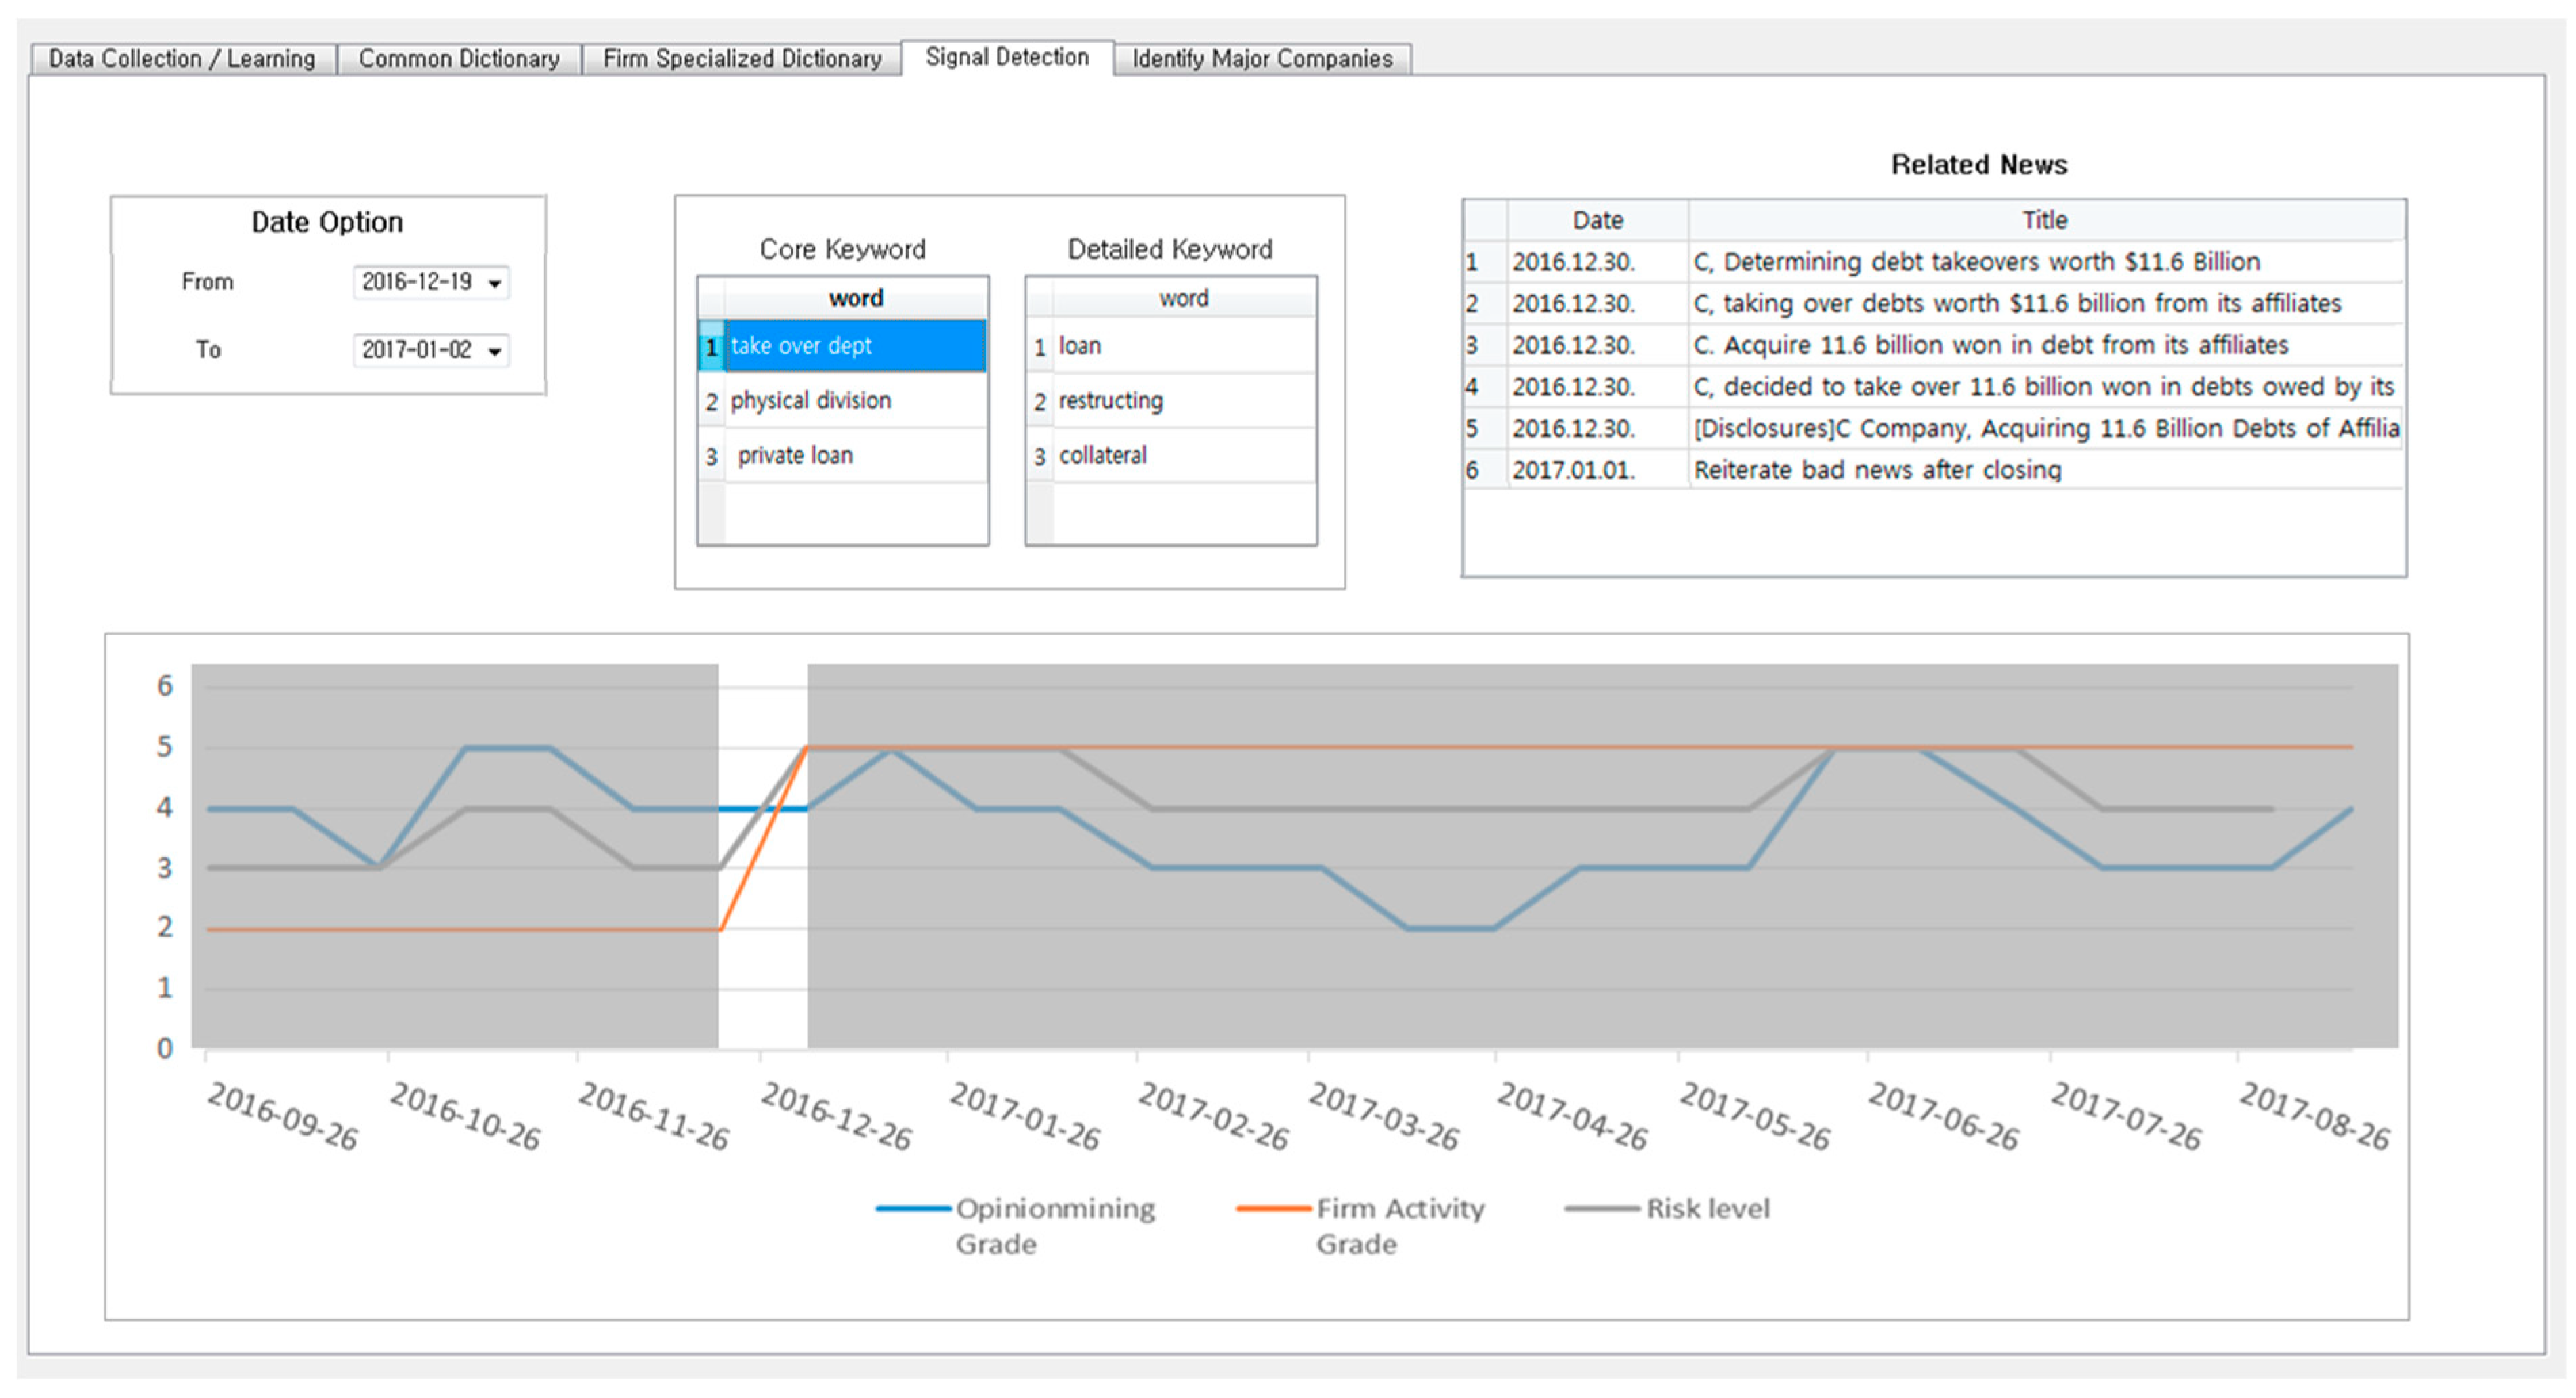
Next, signal detection is performed based on the derived firm activity and opinion mining grade. As shown in
Figure 11, the time period in which the rating changes sharply in the risk level graph is highlighted. For the highlighted interval, the core keyword of the period is presented. Each core keyword is then divided into detailed keywords that describe the core keyword. A news article or a social opinion related to the keyword is then visualized. The system then suggests what type of risk signal the company is. Ultimately, visualization of the system allows users to acquire information more easily. By obtaining these refined data, users will be able to make more informed decisions.
5. Discussion
The risk signal detection system proposed in this study can improve usability by providing immediate convenience to users and real time analysis. Indeed, many security firms are collecting real-time data. However, most of the data that play a key role in the company, such as news and disclosure data, are hand-drawn. This may produce a slow response from the brokerage firm when an incident occurs. In the worst case scenario, even a main event is missed. If our system is utilized, it will be possible to improve the accuracy and automate the work, which is currently dependent on manual hand-drawn work. In other words, it is possible to minimize the above-mentioned problems.
In addition, all events occurring in the security system are not determined in advance. In some cases, events that are normally evaluated as negative can be evaluated positively and can be reflected positively in stock prices. On the other hand, events that were evaluated as positive might have an adverse effect on stock price. Therefore, the most important part of making a decision on security investments should be to quickly understand how investors’ opinions are reflected in the stock price. In this way, the system exploited disclosure data and financial statements, which can be considered objectively. This system also quantifies opinions of individuals, that are subjective. Thus, the system provides a basis for supporting decision-making.
Finally, the system has the advantage of utilizing qualitative and quantitative methodologies appropriately in the risk assessment process. If the system is biased toward a qualitative method, there may be a question about the reliability of the system. If it lacks numerical visualization, it can confuse users. Conversely, if the system is biased in a quantitative way, it may exclude unseen information, resulting in a result that does not reflect reality. For this reason, it is important to properly combine both methodologies. This system demonstrates a risk management technique that properly utilizes both quantitative and qualitative information.
However, this system has a drawback in that it is too dependent on keywords. Depending on the positive or negative aspect of the keyword, the sentiment value of neighboring words also changes. It is possible that positive and negative keywords are mixed due to the natural characteristics of word2vec. Thus, it is necessary to suggest complements or alternatives for the visualization data of word2vec in the system because it can be difficult to grasp the whole flow. Even visualized data can provide inaccurate views when users interpret the data. In addition, since the system exploits NLTK, a Korean language processing package, it has a problem in that the name of the firm is not recognized as a proper noun. This can degrade the accuracy of the analysis, requiring the cumbersome process of adding the word to the dictionary in advance.
In order to improve the accuracy of the analysis, the selected words, which were reflected in the dictionary and limited to noun forms, should be sophisticated. Although different parts of speech, such as verbs and adjectives, could affect the sentiment value, these parts of speech were excluded because they created a large amount of noise. Therefore, the sentiment analysis needs to be undertaken more precisely.
Furthermore, this study can extend the framework by applying a deep learning-based model that automatically optimizes parameters according to learning data [
40,
41]. In addition, corporate opinion data can be applied to a variety of areas in managerial works [
42]. In other words, the purpose of analysis can be expanded to a model applicable to various industries by applying it to marketing and other areas, such as the development of products and technologies, rather than from a financial investment perspective.
6. Conclusions
In this study, an intelligent security investment decision support system was developed by linking opinion mining of news data, social data, and corporate data to existing security investments. First, to screen at-risk firm groups, firm data were obtained, and the system tried to exploit SVM and identify the keyword appearance frequency of credit events. From the credit event identification process, a firm assessment score was derived. After the screening process, the sentiment value of the document was calculated by exploiting the core keyword sentiment value derived from the news and investor opinion. Thus, each risk value of the firm (the so-called opinion mining score) was derived. With the firm assessment score and the opinion mining score, the risk value of the firm was calculated. This value was exploited to forecast credit risk and suggest information about the analyzed firm. All derived data could be visualized and were utilized in the system.
In previous studies, the development of such an algorithm was mainly conducted by using either firm data, such as disclosure data, financial statements, or opinion mining. However, biased result may be derived. Thus, both types of data were exploited in this study. First, it is possible to evaluate the company as at-risk by using only firm data. However, investors are subjects of the investment. Their opinions are not reflected in the company’s activities. Thus, it is possible to acquire information that cannot be reflected by corporate data by using opinion mining to reflect the opinions of investors. For instance, important news and rumors about a company may not be reflected in the disclosure data or financial statements. However, they can be reflected in investors’ opinions. In other words, it is possible to capture rumors before they are reflected in corporate data. This can help investors act before the speculation is materialized and reflected in stock prices. In addition to company A illustrated in this study, a medium sized company B was also analyzed. Company B’s firm activity grade was derived as 3, meaning that the firm’s business was relatively good. However, the opinion rating for company B was over 4.5. Thus, negative signals were found, and the investment outlook was determined to be in danger. Immediately after the analysis of company B, the stock price of company B fell by more than 30%.
Conversely, analysis focused on opinion mining can result in a loss of business performance. In the case of company A, the opinion mining rating was about 3.5. However, its business activity rating was 5. This means that investors evaluated the company positively, even though the actual performance of company A was not good. In fact, the stock price of company A continued to rise. Investors had many positive opinions about company A. Therefore, the company’s stock price is 10 times higher than its price a year ago, just after the analysis period. However, as the company continued to struggle with its poor financial conditions and management rights, it eventually recorded a decline. As a result, the stock price fell by 40% during the analyzed period. Thus, in order to evaluate a company, it is necessary to evaluate the company’s data along with opinion mining.
Although quantitative methodologies have been widely used in existing risk management systems, they are difficult to understand. In addition, the objectivity can deteriorate if a methodology relies heavily on the qualitative opinions of experts. On the other hand, our system visualizes all results and makes it easy for the public to grasp the information. By automating most processes, users do not have to expend significant resources to derive the information that they need, because they can easily process the information. The proposed system succeeds in ensuring objectivity by relying less on expert opinions. The contribution of the proposed system in this study is that text-based structured qualitative data is used as a quantitative corporate risk assessment indicator through data analysis. This system allows users to see objective corporate evaluation results at a glance by utilizing not only internal confidential information but also shared information on the Internet. In addition, users can easily evaluate and participate in the sentiment evaluation of each data source based on their on-site know-how. This participation is reflected in real-time learning in the system.
From a theoretical point of view, this study suggests a novel methodology to detect a company’s risk signal by utilizing both an indicator of structured corporate data alongside unstructured social data-based opinion mining in the financial stock market. This study has developed a methodology for helping financial investment entities achieve their goals, with the aim of detecting financial risks, indexing corporate information (including financial statements), and analyzing the degree of positivity and negativity through the opinion mining of social data. A novel methodology was presented on the basis of the hypothesis that information on financial risk can be quantitatively analyzed through sentiment analysis on social data extracted from news articles and internet postings.
Based on results of this study, it is possible to derive risk signals through integrated monitoring. It is also possible to obtain various types of decision data for users. Through analysis of one-year data, we can provide signals according to the risk level for each company and provide information that can help investors make decisions based on risk signals. Besides analyzing existing financial statements and disclosure data, we sought to utilize information that could not be derived from existing data through opinion mining. This provides an opportunity to identify new investment momentums while at the same time identifying the risk factors of a company.
However, in this study, since the cut-off value of the risk level was set according to 534 cases of existing companies, the criteria can be derived differently according to data from a raw data set. In addition, the characteristics of company information by industry can be different. Such characteristics were not included in this study. Moreover, there is a lack of expertise in the area of investments according to the signals presented through literature research and case studies. Thus, investment knowledge needs to be added and supplemented. In addition, because data collection takes a long time, real-time analysis may be difficult. Indeed, real-time analysis might be unsuitable for short-term stock trading, such as scaling or high frequency trading. Opinion mining also uses very subjective indicators, which makes it easy to understand the overall flow. However, confidence in the accuracy of opinion mining is not high. Finally, in the case of proper nouns, there is a disadvantage in adding a terminology dictionary because, due to the limitations of natural language processing, a company’s name might not be recognized correctly. In addition, social data usage requires the pre-validation of data sources, such as false articles on the Internet. Since this study did not cover fake filtering, further studies will require an in-depth study of the process of data refining.
In future research, it will be necessary to define not only enterprise analysis for investment, but also an enterprise evaluation index for various utilization purposes. In addition, further studies need to provide an evaluation result based on indicators. In addition, the scope of the analysis should be extended to individuals, rather than confined to companies, so that it becomes possible to utilize artificial intelligence for customer-specific credit analysis and new customer credit analysis. This will set parameters for each customer, analyze the credit for each type of customer, and process it into another system.


