Article

Exploration of Sustainable Urban Transportation Development in China through the Forecast of Private Vehicle Ownership

1
School of Business Administration, Zhongnan University of Economics and Law, Wuhan 430073, China
2
China Center for Special Economic Zone Research, Shenzhen University, Nanhai Ave 3688, Shenzhen 518060, China
3
Department of Gardens, Southwest Forestry University, Kunming 650224, China
*
Author to whom correspondence should be addressed.
Sustainability 2019, 11(16), 4259; https://doi.org/10.3390/su11164259
Submission received: 22 June 2019 / Revised: 3 August 2019 / Accepted: 5 August 2019 / Published: 7 August 2019
(This article belongs to the Special Issue Urban Transformations Towards Sustainability)

Abstract

:
With the acceleration of China’s urbanization process, the urban transportation problem has become increasingly serious. The rapid expansion of private vehicle ownership, in particular, has become one of the barriers to the realization of sustainable urban transition. This paper applied the Gompertz model to analyze the non-linear relationship between private vehicle ownership and per capita GDP in China using provincial data. In addition, we forecasted private vehicle ownership for 31 Chinese provinces for the period of 2019–2030 and predicted the time to reach the upper limit of 1000 people vehicle ownership of each province according to different scenarios. The main findings revealed that the number of private vehicles owned in China’s provinces was in line with “S”-shaped development and was currently in the process of accelerated growth. Under the scenario of an annual per capita GDP growth rate of 6%, China’s private vehicle ownership will reach 246 million, 375 million, and 475 million in 2020, 2025, and 2030, respectively. This indicates that China’s expansion of private vehicle ownership will generate significant challenges, such as on-road vehicle-related fossil fuel consumption, pollutant emissions, traffic congestion, and scrapped vehicle recycling. These issues will become increasingly prominent. In provinces such as Hubei, Hebei, Hunan, and other central provinces that have a 50–60% urbanization rate, the large potential for income promotion will significantly stimulate the increase in private vehicle ownership, and the upper limit of 1000 people vehicle ownership in each province will be reached in 2032, 2037, and 2046 with annual per capita GDP growth rates of 8%, 6%, and 4%, respectively.

1. Introduction

While entering the new millennium, the world’s total urban population surpassed the rural population and become the main habitat for human beings [1]. With the continuously increasing rate of economic development in China, the urbanization level increased from 36.2% to 59.6% between 2000 and 2018 [2]. Simultaneously, the high rate of urbanization and industrialization has triggered the rapid development of China’s automobile sector. Between 2009 and 2018, automobile sales in China were ranked first in the world for ten consecutive years [3,4]. According to the Traffic Management Bureau of the Ministry of Public Security, in 2018, there were 31.72 million newly registered motor vehicles in China, and total vehicle ownership reached 240 million. Meanwhile, for the first time, the number of private vehicles exceeded 200 million. From 2000 to 2018, China’s private vehicle ownership increased sharply from 6.25 million to 207 million, an annual growth rate of 21.4%: this growth has played a principal role in China’s automobile growth [5].
On the one hand, the popularity of vehicles has driven economic development and the improvement of living standards. In addition, scrapped vehicles—a so-called “urban mine”—can provide secondary resources [6]. However, on the other hand, the rapid growth of vehicle ownership has placed heavy social and environmental pressures on the urban system and challenged the realization of sustainable urban development. The increasing on-road vehicle-related fossil fuel consumption and pollutant emissions have become a leading issue that is testing the wisdom of the urban manager. Lin and Du’s [7] research showed that China’s vehicle sector contributed 10.4% of the total energy consumption in 2016, which has increased by three times in a decade. Du and Lin [8] also pointed out that the vehicle sector was responsible for more than half of the total oil consumption in 2016. He et al. [9] estimated that the transportation sector was responsible for more than 30% of total CO2 emissions in China. In addition, automobile-induced air pollution—especially the concentration of fine particulate matter (PM2.5)—has become increasingly serious in recent years [10]. Therefore, forecasting the development trend of vehicle ownership in China is crucial for the government’s ability to establish appropriate strategies for transportation infrastructure, air pollution control, energy planning, and scrapped vehicle management.
Many scholars have conducted theoretical and empirical research to predict China’s vehicle ownership on the basis of the economic growth rate. Using the average growth rate of seven developed countries, Wang et al. [11] have forecasted that China’s total vehicle ownership will reach 359 million in 2024. Huo and Wang [12] and Huo et al. [13] have predicted that China’s vehicle ownership will range between 247 million 287 million by 2030 and between 486 million and 662 million by 2050, respectively. Wu et al. [14] have estimated that by 2050, the annual vehicle ownership per 1000 people in China will be 500, and the growth rate of vehicle ownership will reach an inflection point in 2030. Dargay et al. [15], utilizing an improved Gompertz model, have predicted that China’s total vehicle ownership will reach 390 million in 2030. Hao et al. [16] stated that by 2050, for the “business as usual” and alternative scenarios, China’s annual vehicle ownership per 1000 people will be 347 and 397, respectively. Some researchers have focused on the prediction of electric vehicle ownership. For example, by comparing the Gompertz model with the logistic model, Li et al. [17] forecasted that China’s electric vehicle ownership will reach an inflection point in 2035. These studies aimed to forecast the future development trend of vehicle ownership for all of China, and this approach ignores regional socioeconomic characteristics. Using the panel data of 31 provinces (cities) in China with the Gompertz model, Gu et al. [18] predicted the ownership and inflection point of civil automobiles in all provinces (cities) of China up to 2020. Hao [19] used the Gompertz model and linear extrapolation model to forecast the number of passenger and commercial vehicles in China. The results show that the number of cars in China will reach 420 million by 2030. Before 2030, the rate of car ownership in China will increase rapidly, but there will always be a considerable gap compared with developed countries.
Using county-level data in China in 2008, Zheng et al. [20] extended the Gompertz model to estimate vehicle ownership and emissions at a regional level and found that the approach could be used to simulate the development trend of future vehicle ownership in Chinese cities. Zhang et al. [21] pointed out that the regional heterogeneity of vehicle ownership in China should be taken into account. Therefore, they proposed an empirical model to reveal the evolution of vehicle ownership in western, central, and eastern China.
The previous theoretical and empirical research has deepened our understanding of vehicle ownership prediction with data at national and regional levels. However, to the best of our knowledge, five aspects can be further explored. First, as a result of data availability, the majority of the previous research has been at the national level or performed for international comparative studies, and few studies have forecasted vehicle ownership at the regional level. Second, differences not only exist among countries but also among regions. As China’s territory is vast, the economic development and the degree of urbanization are not equal among Chinese provinces; therefore, conducting comparative research using the characteristics of Chinese provinces is necessary. Accordingly, targeted policies can be proposed from the projection of private vehicle ownership for Chinese provinces. Third, most of the previous studies have forecasted total vehicle ownership. However, compared with developed countries, China is undergoing the primary stage of vehicle popularity. At the primary stage, the development of private vehicles is one of the most important drivers of total vehicle growth. Fourth, Gu et al. [18] pointed out that urbanization is a crucial factor that restricts the growth of vehicle ownership. Therefore, the stage of urbanization should be taken into account when forecasting private vehicle ownership. Finally, the Gompertz model requires setting the upper limit of 1000 people vehicle ownership, the selection of historical data, and the assumption of future economic growth. The higher the upper limit of 1000 people vehicle ownership, the newer the historical data, and the faster the assumed future economic growth, the higher the forecast results [19]. Therefore, although the same method has been used in all studies, there may still be gaps in the predicted results. Therefore, compared with the fixed values in the previous research, models were established for many scenarios in this study. The results differ and depend on whether the future economic growth rate is 4%, 6%, or 8%. With the development of a regional economy, the S-curve deviates to varying degrees on the premise of maintaining the overall consistency and the regional heterogeneity of the system. In addition, calculations based on the saturation rates of developed countries show that China’s specific automobile consumption habits and population policies, among other factors, set the saturation value range, which is divided by the level of urbanization. It is more reasonable to set the higher upper limit of 1000 people vehicle ownership in regions than to use a uniform higher upper limit of 1000 people vehicle ownership for the whole country.
The Gompertz model was used in this study to explore the non-linear relationship between private vehicle ownership and the GDP per capita using data from 31 Chinese provinces. We aimed to clarify the development trend of China’s private vehicle ownership and forecast private vehicle ownership in each province with different levels of urban transition. In addition, we estimated the time to reach the upper limit of 1000 people vehicle ownership for each province, which can be used as supporting data for the green transformation of the automobile sector and sustainable urban transition in China. Compared with previous studies, this research offers three main contributions. First, we applied Chinese provincial panel data and grouped the provinces by urbanization level; therefore, the parameters were more rigorous and the accuracy of the prediction was improved. Second, using scenario analysis, we forecasted the time to reach the upper limit of 1000 people vehicle ownership for each province. These results can help the government formulate targeted medium- and long-term policies for the transportation sector and also help automobile manufacturers make macro-decisions. Third, the prediction of private vehicle ownership can improve China’s management of the future pressures of urban transportation.
This study is organized as follows. Section 2 introduces the Gompertz prediction model and data sources. Section 3 presents empirical results, and Section 4 lists the conclusions and policy implications.

2. Materials and Methods

2.1. Population Index Method

Urbanization can be defined by many dimensions, such as population and land. Many scholars emphasize the importance of population distribution in the process of urbanization. The essence of urbanization is the development of cities and the improvement of urban functions. As the builders of cities, citizens have a predominant position in the development of urban transition. Population aggregation has introduced a scale effect, promoted economic development, improved public infrastructure, and driven the urban transition. Furthermore, urban development provides citizens with more conveniences and opportunities, thereby compelling non-urban populations to flock to cities. This change in the population distribution is the most intuitive embodiment of urbanization, so the definition and description of population distribution is always the central part of the definition of urbanization. This paper follows the mainstream approach in the research and measures urbanization by population distribution, that is, the proportion of the urban population to the total population. The population index method is prevalent in the evaluation of the process and level of urban transition. The formula is as follows:
U = p u p × 100 %
where U represents the urbanization level of one region, p u denotes the urban population of the region, and P is the total population of the region.

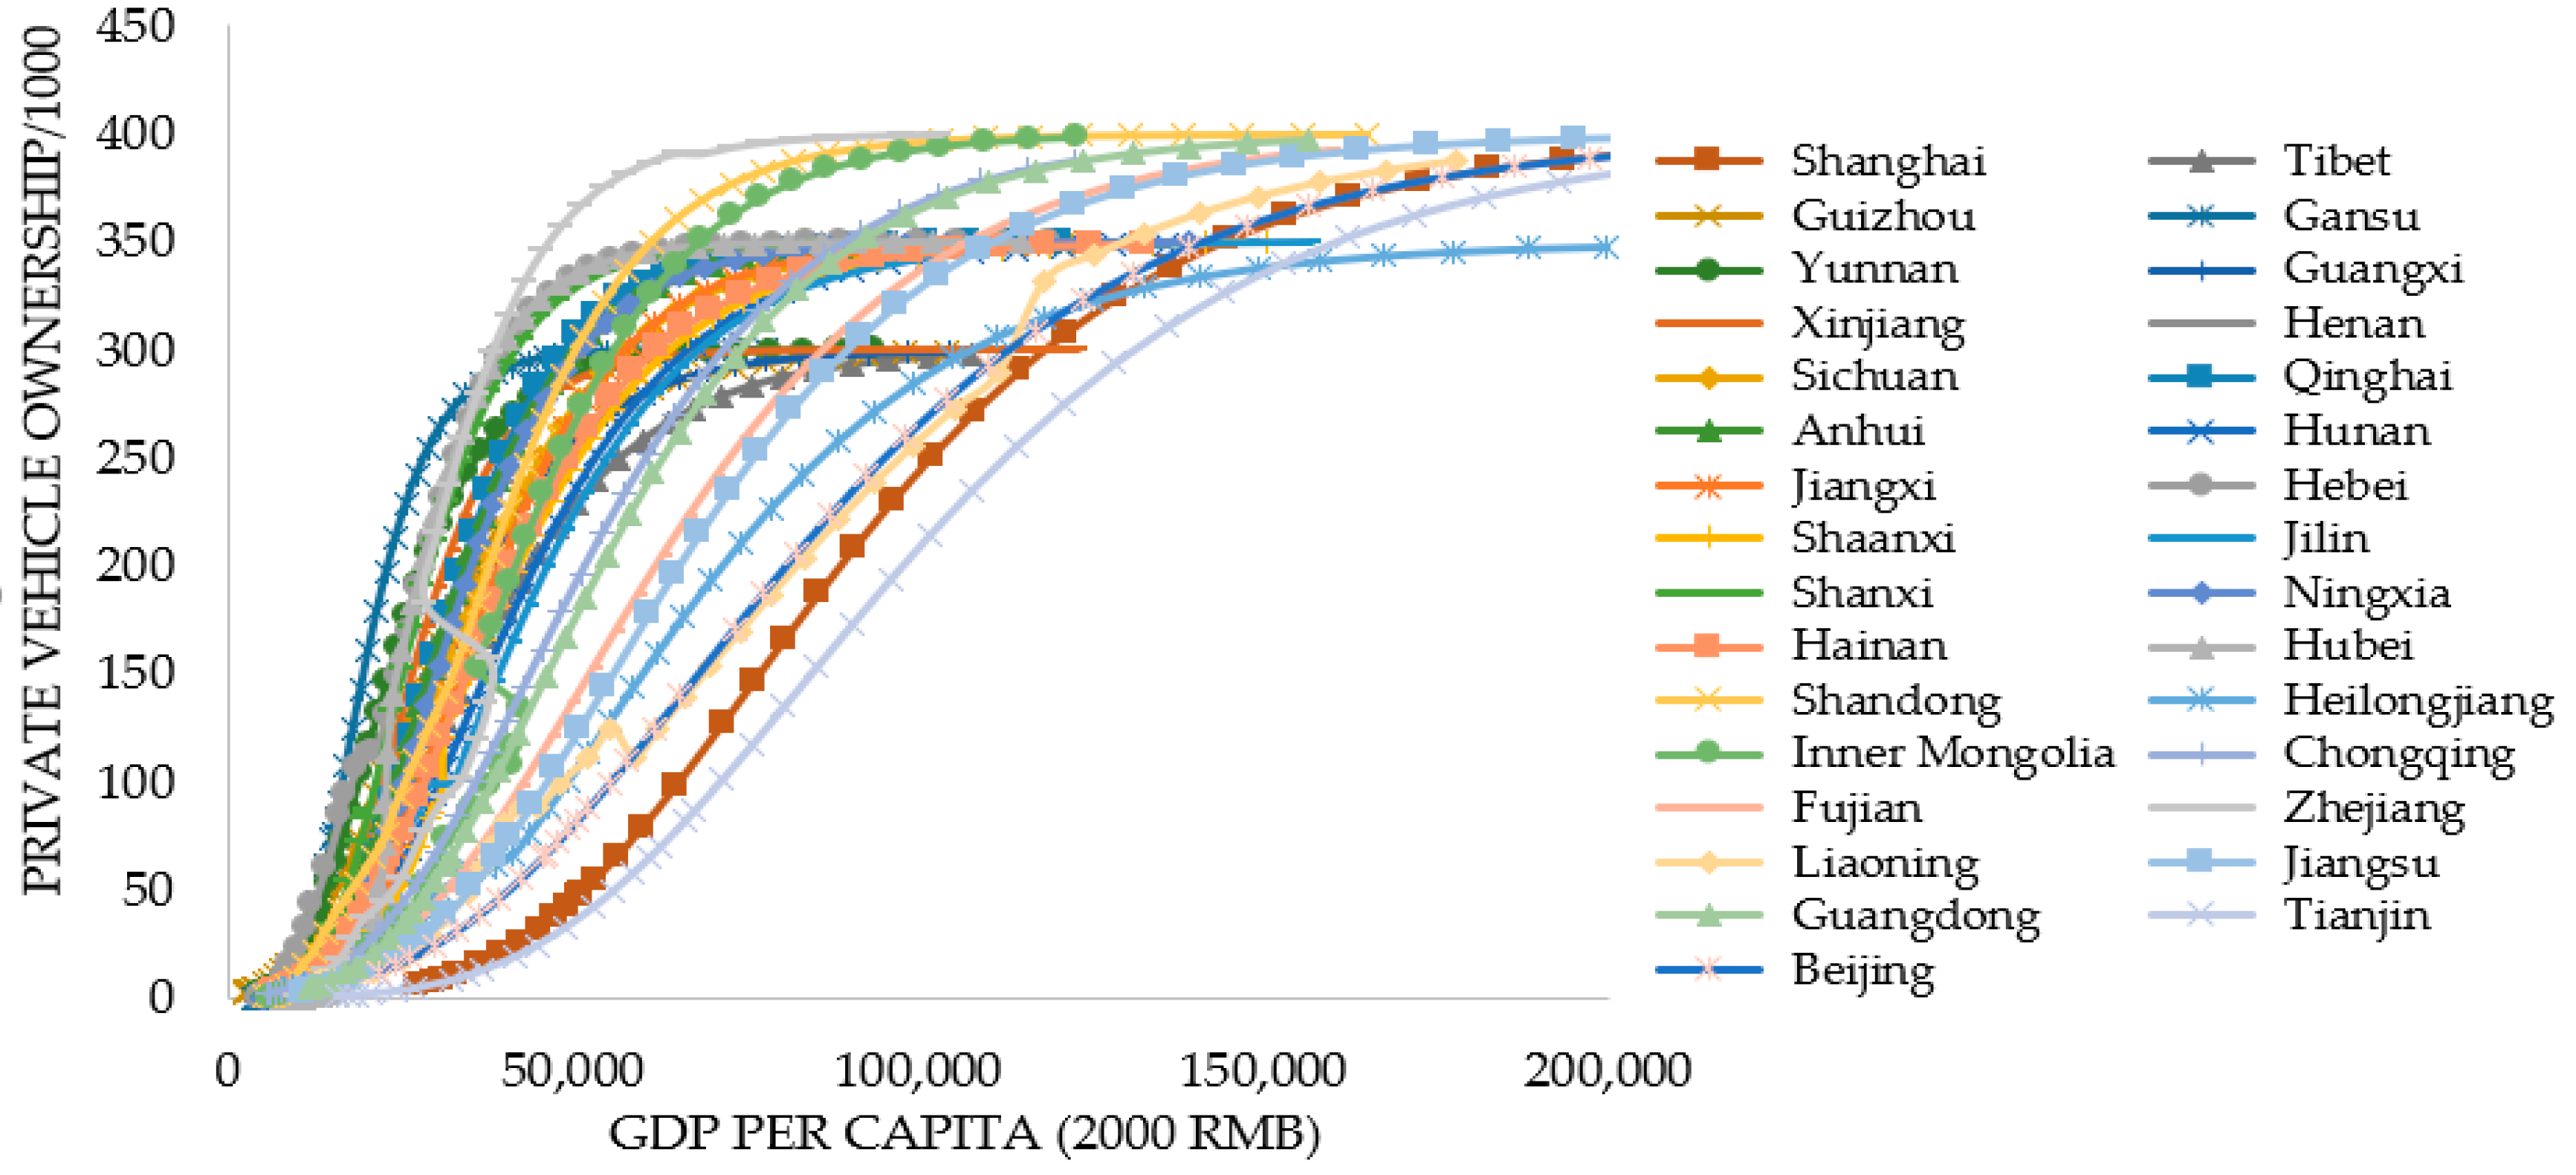
2.2. Forecast of Vehicle Ownership: The Gompertz Curve Model

Vehicle ownership forecasting is a very complex undertaking, and the research on vehicle ownership has always been a hotspot in international scientific research, and there are many related theories and studies. No single model can provide the best performance in all situations, so prediction methods depend on the objective and context of the study [22].
At present, the forecasting methods of vehicle ownership can be roughly divided into two categories: equilibrium analysis models and demand models. Equilibrium analysis models can be further divided into the market equilibrium model and the traffic equilibrium model. The market equilibrium model establishes the demand and supply function of the household vehicle. The traffic equilibrium model is based on Wardrop’s equilibrium principle [23]. With this model, the optimal model of household vehicle ownership can be established, and the household vehicle ownership can be obtained. The demand model considers the demand of urban households or individuals for automobiles and predicts it by establishing a demand function. The demand model can be divided into two categories: disaggregate and aggregate [24]. The disaggregate method focuses on family and individual choices. It follows the behavioral assumption of utility maximization and uses the family or individual as the decision-making unit to be modeled. It is mostly used for short-term prediction and require a large amount of data. The multinomial logit model and the multinomial probit model are disaggregate models. The aggregate method mainly refers to an econometric model, which is widely used for long-term forecasting and takes the whole region as the research object. The aggregate method includes two types: the unsaturated level limit and the saturated level limit. The logarithmic linear model is the most commonly used model for unsaturated horizontal constraints. The logarithmic linear model regards the logarithm of the vehicle ownership rate as a linear equation of the logarithm of some potential determinants, such as population and per capita GDP [25]. The disadvantage of logarithmic models is that the elastic coefficients are fixed, rather than changing with the location of the demand curve. Regression models are most commonly used in saturation level modeling, that is, the correlation between vehicle ownership and the main driving factors is established using lateral data, and then the strain (private vehicle ownership) is predicted by measurable independent variables. The commonly used model with saturation level constraints is the Gompertz model. Compared with the logarithmic model, the Gompertz model is more flexible, especially for different income stages, and it allows for different curvatures [15]. More importantly, in the Gompertz model, the income elasticity coefficient varies for different income points, while, in the logarithmic model, this coefficient is fixed [18].
In the past 50 years, developed countries, such as the United States, Britain, France, and Japan have experienced significant improvements in vehicle ownership. In reality, many factors can affect the growth of vehicle ownership. Among them, per capita income plays a decisive role in the increase in vehicle ownership. Per capita income refers to the per capita national income in a strict sense because per capita GDP determines the level of per capita income, which is replaced by per capita GDP in this paper. As shown in Figure 1, according to the historical development of vehicle ownership in developed countries, the national occupancy rate of vehicles is similar to the development trend of the growth of per capita GDP, that is, the “slow–urgent–slow” S-shaped development process. In the early stages of per capita GDP, most households cannot afford to purchase vehicles, and the growth rate of vehicle ownership per 1000 people is relatively slow. With increases in income, a larger number of households can afford vehicles, and the growth rate of vehicle ownership per 1000 people enters a rapid development stage. With the popularity of vehicles, the growth of vehicle ownership tends to become flat and gradually approach saturation. That is, the initial stage of growth is slow, the middle stage of growth is rapid, and the last stage of growth is slow and enters the saturation stage.
A vehicle ownership forecast is closely related to important issues such as energy demand research and environmental pollution research. The Gompertz curve model can better describe the development of vehicle ownership compared with other life cycle models, such as the logistic model, and it can incorporate the development of the auto industry into the country’s macroeconomic development system. The model requires simple data and is more suitable for predicting the growth of vehicle ownership for developing countries such as China. This paper analyzes the characteristics of the historical data on private vehicle ownership in developed countries and uses the Gompertz curve model to predict the level of private vehicle ownership in China.
The function of the Gompertz model is:
Y t = V × a b t
where a and b are parameters to be estimated; V is the upper limit of Y t , which is determined before the estimation and has a lower limit of 0; and t is the time trend variable and increases with time. The parameter a determines the position of the curve, the parameter of b determines the slope of the asymptote, and ( ( ln b ) / a , V/e) is the inflection point.
In China, there are many socioeconomic factors that affect private vehicle ownership, and they can be grouped into three categories: (1) policy factors, such as private vehicle development policy and local transportation policy; (2) social factors, such as urban planning, population density, and road network density; and (3) economic factors, such as per capita GDP, income level, and vehicle price. On the basis of the above analysis, the panel data of China’s provinces in the past 20 years were chosen to explore the relationship between vehicle ownership and per capita GDP, population density, and road network density. Figure 2 shows that the curves for the provinces generally conform to the S-shaped curve. In the areas lacking restrictions on vehicle purchasing, despite provincial differences, there was a strong positive correlation between the number of private vehicles owned per 1000 people and per capita GDP. In most areas, compared with GDP per capita, population density and road network density had no significant impact on the private vehicle ownership per 1000 people. In the areas affected by limited purchasing, such as Shanghai, Beijing, and Tianjin, the number of private vehicles owned per 1000 people was lower for a similar per capita GDP. However, it is worth noting that China’s purchase restriction policy has different effects on the vehicle market because their implementation objectives, implementation time, and policy content all differ. For example, since 2018, Hainan Province has become China’s ninth area to restrict automobile purchasing, but its vehicle ownership is low. The intent of the purchase restriction is not to limit the purchase volume but to prioritize environmental protection and encourage the purchase of new-energy vehicles [26]. Therefore, it can be predicted that its purchase restriction policy has little impact on vehicle ownership. This result is in line with previous studies, which have frequently concluded that many variables affect the actual vehicle ownership rate, but in China, per capita GDP explains most of the changes in the vehicle ownership rate [27]. Therefore, this paper forecasts the development trend of China’s private vehicle ownership in the future using the development law of vehicle ownership in developed countries and the status quo of private vehicle ownership in China’s provinces.
The Gompertz curve was used to fit the “slow–urgent–slow” S-shaped development process of vehicle ownership that forms with increasing per capita GDP. At different input stages, the elasticity of the model shows a trend from small to large and then vice versa (from large to small). It also has a saturation value: that is, when the input increases, the output of the model does not change substantially, reflecting that the vehicle ownership rate tends to be saturated when per capita GDP reaches a certain level.
The Gompertz function of vehicle ownership can be described as:
s ( t ) = K × e α e β g ( t )
where s(t) represents annual vehicle ownership per 1000 people; K is the upper limit of s(t), that is, the saturation of private vehicle ownership, the value of which is always determined before estimation; 0 is the lower limit of s(t); α and β are parameters to be estimated, with 0 < α < 1 and 0 < β < 1; and g(t) denotes the time trend variable, which is per capita GDP in year t in this study.
China’s private vehicle ownership has risen sharply, but compared with developed countries, it is still in the initial stage of vehicle popularization and can be predicted to have a large potential for growth. Given that China’s auto industry is only in its infancy, simply fitting the data on China’s private vehicle ownership will introduce biases, so we applied provincial panel data analysis while considering regional heterogeneity.
In summary, the development process of vehicle ownership in developed countries with a mature automobile industry was referenced in this study to predict the future development trend of private vehicle ownership for 31 Chinese provinces. The following assumptions were made: (1) private vehicle ownership and regional per capita GDP have a positive correlation [15,28,29]; (2) the number of private vehicles does not always increase with the growth of regional per capita GDP and will reach a saturation point when it reaches a certain stage [12]; (3) the urbanization process is an important factor that restricts the growth of automobile ownership: the higher the urbanization rate, the higher the saturation value, which will converge at a certain regional urbanization level.
Two decisive factors should be determined when using the correlation between annual private vehicle ownership per 1000 people and per capita GDP: first, the assumed saturation value of private vehicle ownership per 1000 people should be set according to an empirical hypothesis, and second, the future per capita GDP should be established. Only when the future development trends of these two influencing factors are determined can the Gompertz model curve be fitted. However, for predictive models, more influential factors mean that the judgment of the future trend is more complicated, and the prediction is more uncertain. On the basis of the above problems, this paper assumes that the growth of private vehicle ownership in China is in accordance with the law of the Gompertz model and returns to the initial time-series analysis characteristics of the Gompertz model to estimate the growth trend of private vehicle ownership over time. We set the parameters as follows.

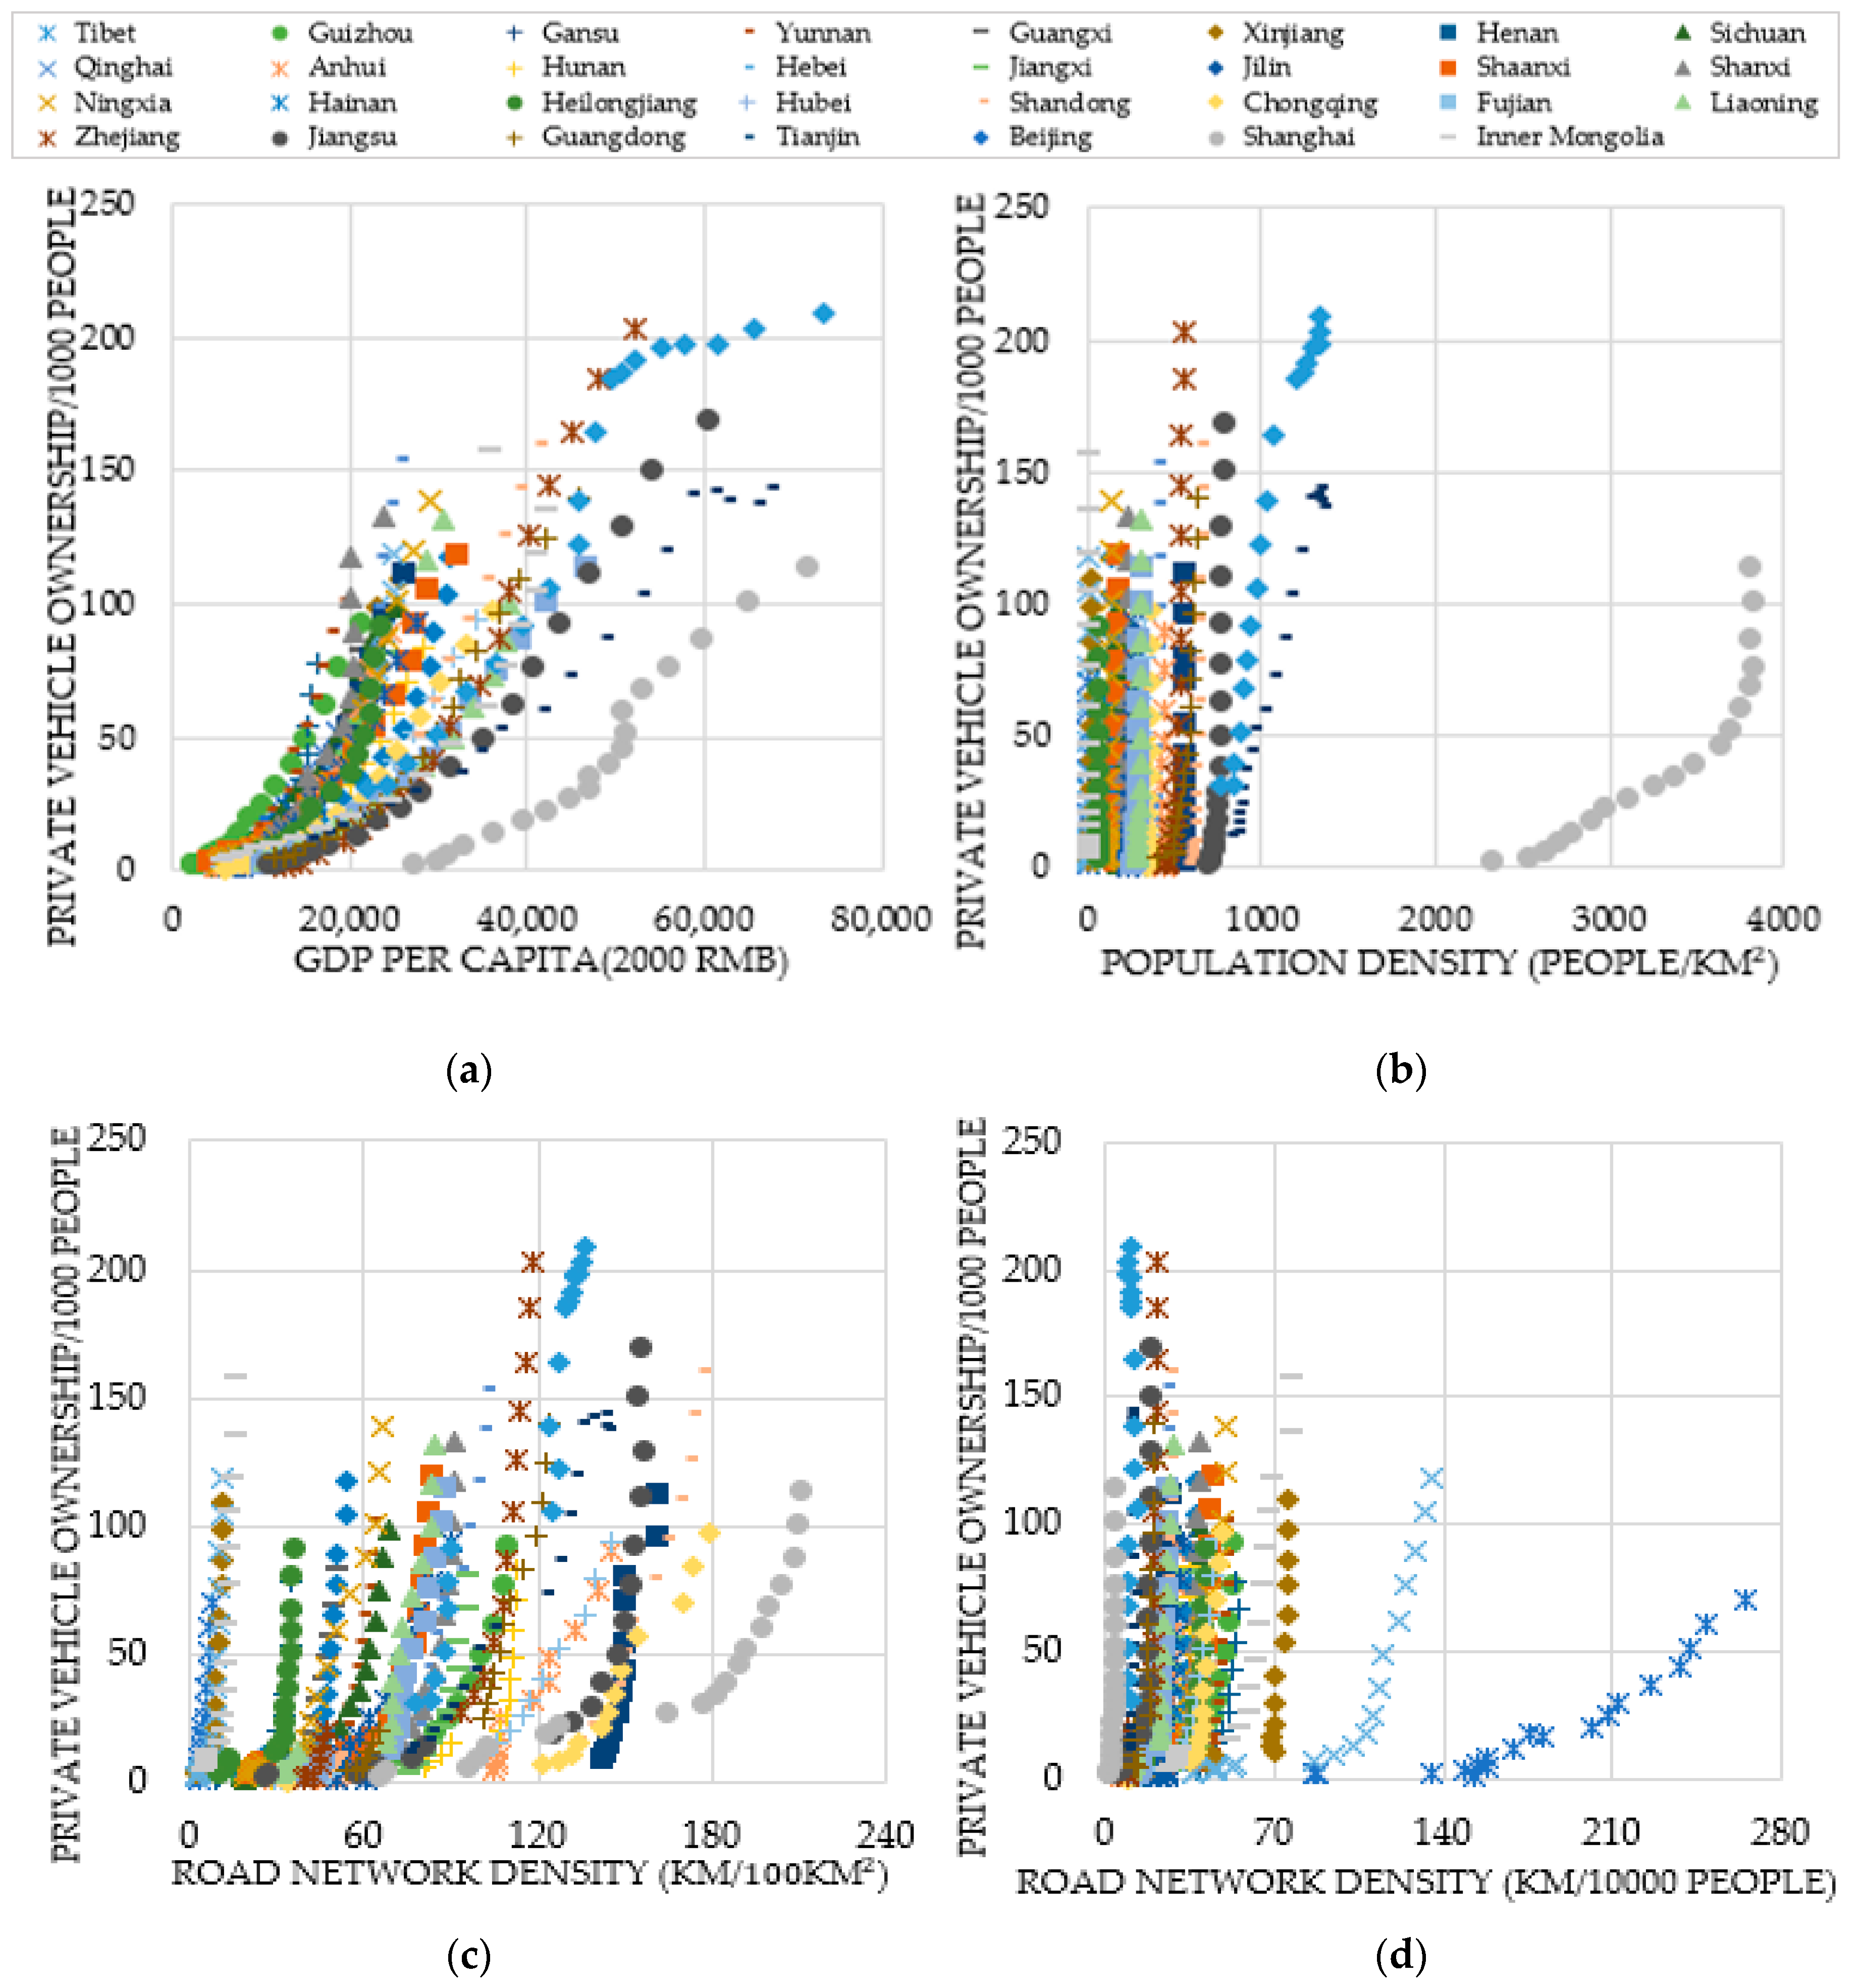
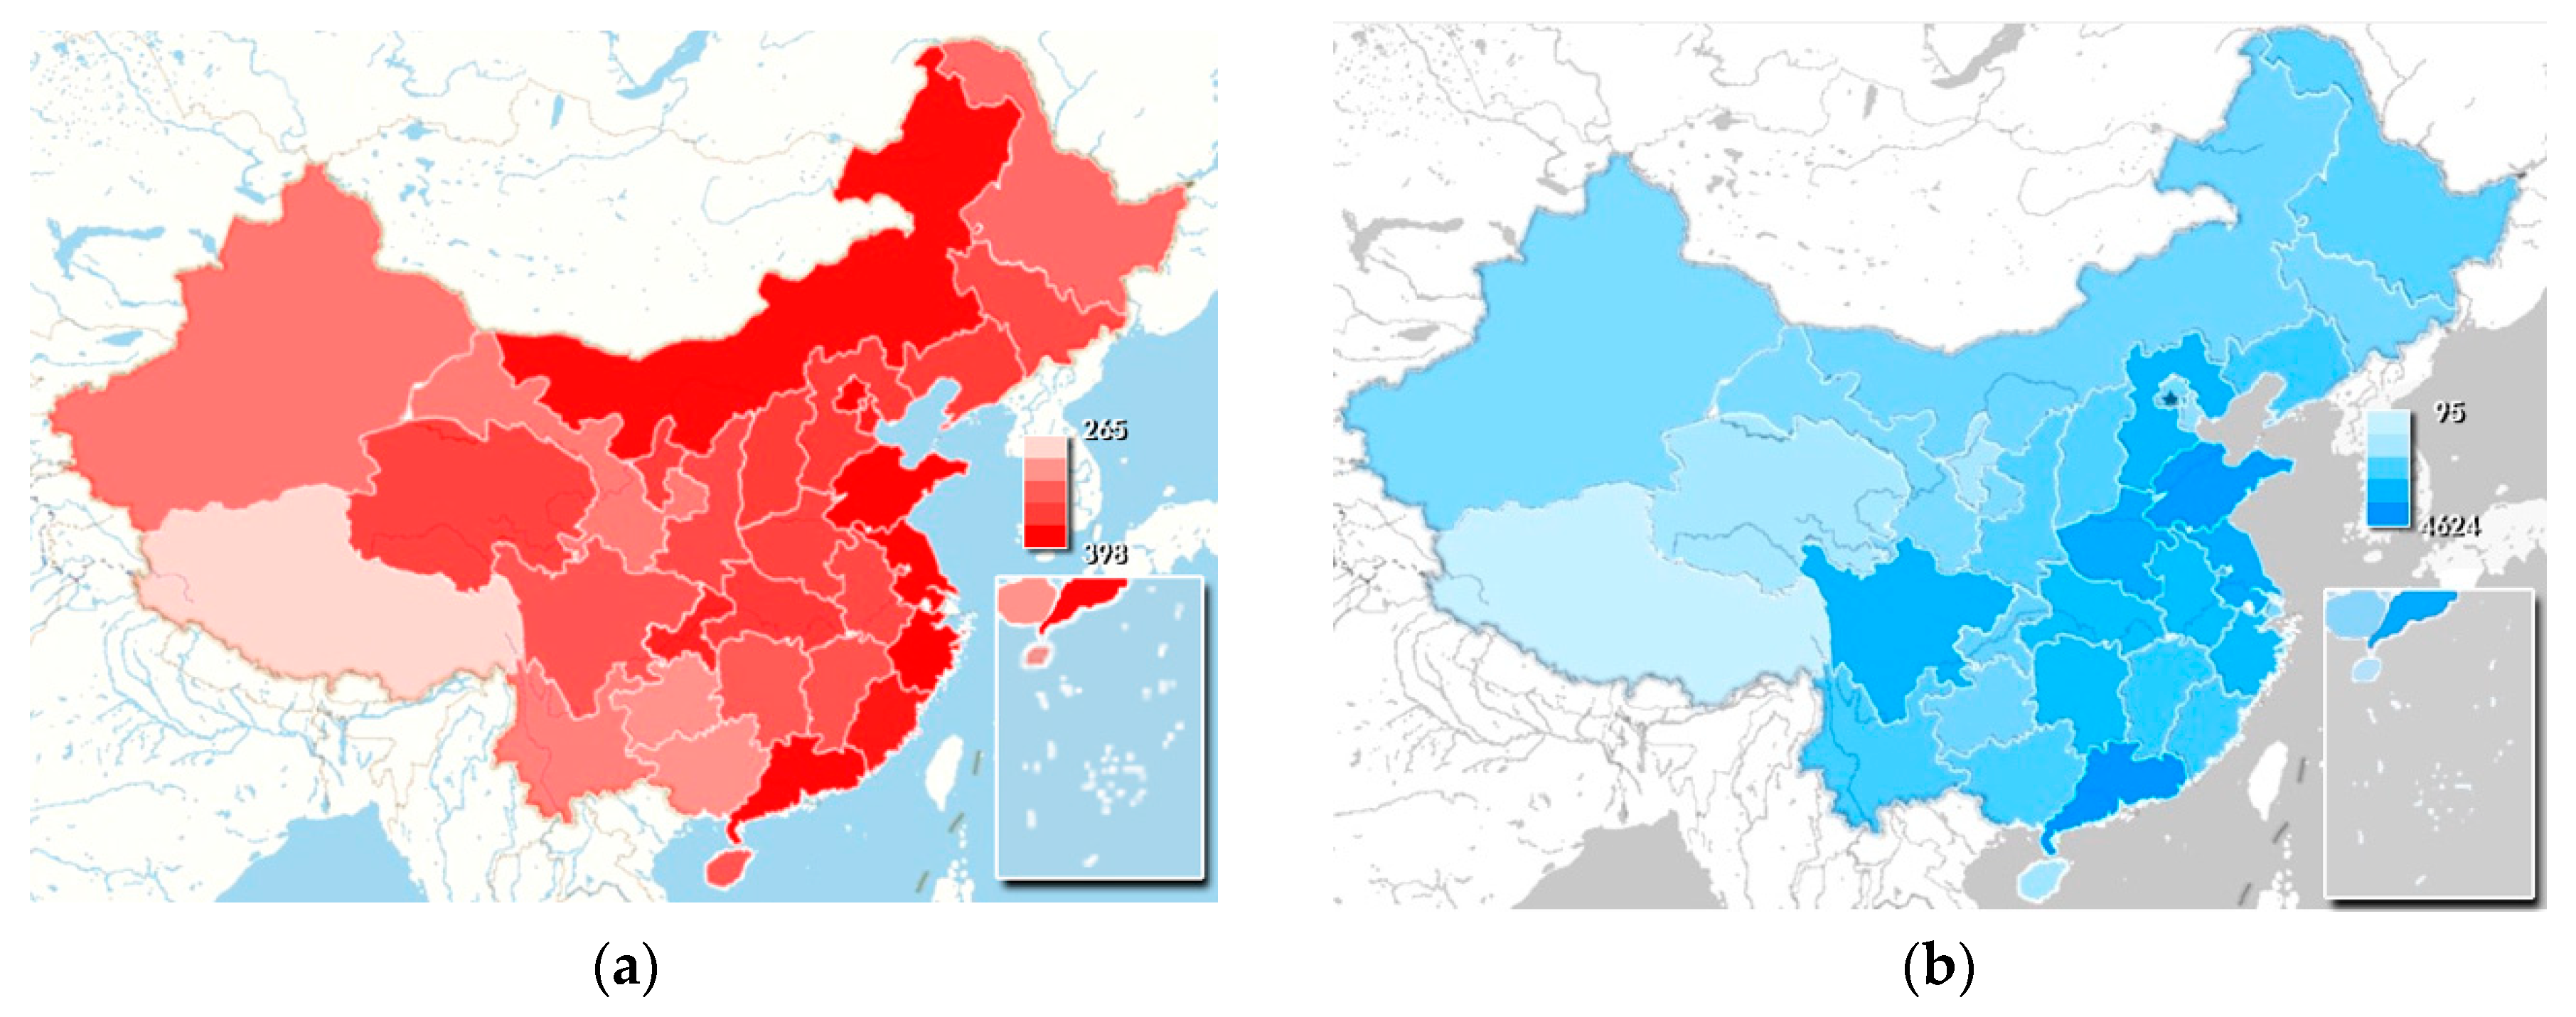
2.2.1. The Value of Saturation K

In this paper, K of the Gompertz curve model was the upper limit of 1000 people vehicle ownership, which means that when the market is saturated, private vehicle ownership per 1000 people should be stable; that is, the growth rate should fluctuate slightly around zero. At present, there is no objective technique to estimate the saturation level of private vehicle ownership. Developed countries entered automobile society earlier. The existing literature [29] and the data on the United States, Britain, France, and Japan were referenced in this study to set the saturation value of the average value of 1000 people vehicle ownership; the saturation value was, therefore, regarded as corresponding to a change rate of less than 2% for more than three consecutive years. Calculations using data on the United States, Britain, France, and Japan for 1960–2012 indicate that the automobile market in developed countries has been virtually saturated since the 1990s. The automobile saturation values are 728 per 1000 people in the United States, 502 per 1000 people in Britain, 475 per 1000 people in France, and 439 per 1000 people in Japan. Since our research focused on private vehicles, the saturation value should be lower. The automobile consumption habit in China is to purchase private vehicles by households. The average size of Chinese households in 2017 was 3.03 people per household [2]. If each household has a private vehicle, the ownership of private vehicles can reach 330 per 1000 people per household. At the same time, we need to account for the dual effects of an aging population and the few-children issue, as well as China’s two-child policy. For example, the average household population of Shanghai in 2017 was 2.49; on the other hand, the two-child policy has made it possible to have a three- or four-person family per household. The calculations in this paper set the upper limit of vehicle ownership by combining the data on vehicle ownership in developed countries with China’s economic and social situation. The result of these calculations was an upper limit of vehicle ownership of 300–400.

2.2.2. Parameters α and β to Be Estimated

The least squares method and the linear program method can be used to estimate the parameters α and β. By comparing the predicted value and the actual value of the number of private vehicles per 1000 people, we can estimate α and β when the difference between the predicted value and the actual value is the lowest. Assigning different provinces with different α and β values can improve the accuracy of the fitting. After determining α and β for each province, their values are used to predict future private vehicle ownership and the time to reach the saturation value.

2.2.3. Per Capita GDP

As stated in its governmental plan, China aims to reach the per capita income level of the middle-income group of developed countries. According to data released by the National Bureau of Statistics of China on 21 January 2019, China’s GDP in 2018 was 90.0309 trillion yuan. Conversion at an average exchange rate results in a total economic output of 13.6 trillion US dollars. With a population of 139.538 million in mainland China at the end of 2018, the per capita GDP was close to 10,000 US dollars. The World Bank’s 2015 standards [30] indicate that the per capita GDP of low-income countries was less than $1045, that of lower-middle-income countries was between $1045 and $4125, that of upper-middle-income countries was between $4126 and $12,735, and that of high-income countries was above $12,736. According to estimates, China’s per capita GDP in 2018 was about 9780 US dollars, which is already at a high level in upper-middle-income countries. Therefore, it is foreseeable that if China continues to maintain a growth rate of 6%, it will reach the level of the World Bank’s high-income country by 2023. However, the economic development in Chinese provinces is uneven, and the pace of urbanization is different. Analyzing the consumption of durable goods such as vehicles reveals that, although the retention rate of private vehicles in most provinces increases with the growth of per capita income, the growth trend in each province is not the same. This paper analyzes and predicts the duration of this rapid growth trend and future private vehicle ownership.

2.3. Data Sources

We utilized the panel data of 31 provinces for the period between 1999 and 2018. The main data were derived from the China Statistical Yearbook and each province’s Statistical Yearbook between 1999 and 2018. The private vehicle ownership was derived from the China Automobile Industry Yearbook, World Motor Vehicle Statistics, and the China Statistical Yearbook. All economic data were transformed into the 2000 constant price. The indicator for the saturation level of private vehicle ownership and GDP per capita come from the World Bank Open Data and the China Statistical Yearbook. Table 1 lists the data sources of each variable.

3. Results and Discussion

3.1. Urbanization Rate

With its fast pace of economic development, China’s urbanization process has developed rapidly. According to the data released by the National Bureau of Statistics, the urbanization rate of permanent residents in China reached 59.6% at the end of 2018, and the urbanization rate of the household registered population was 43.37%. The urbanization rate of permanent residents in 2018 was close to the target set for 2020. At the end of 2018, Shanghai, Beijing, and Tianjin had the highest urbanization levels of over 80%; the urbanization rate of Guangdong, Jiangsu, Zhejiang, Liaoning, and other eastern regions was around 70%; and the urban population of Yunnan, Gansu, Guizhou, and Tibet was less than 50% but higher than 30%. Figure 3 shows the urbanization level of 31 Chinese provinces during the period 1998–2018.
According to an urbanization study by the American geographer Northam [31], the world’s urbanization occurred in three stages. In the initial stage (urban population below 30%), the rural population was dominant, industrial and agricultural productivity was low, industry provided limited employment opportunities, and surplus agricultural labor could not be released. In the medium term (urban population 30–70%), the industrial base was relatively strong, economic strength was markedly enhanced, rural labor productivity improved, and the surplus labor turned to the industrial sector. At this stage, the proportion of the urban population quickly exceeded 50% and then rose to 70%. In this late stage (urban population 70–90%), the transformation of the rural population into the urban population tends to stop, the proportion of the rural population is stable at around 10%, and the urban population reaches about 90% and tends to be saturated. At this stage, urbanization is no longer the migration of people from rural to urban areas; instead, it is the structural shift of the urban population between industries, mainly from the secondary industry to the tertiary industry. Figure 3 indicates that China’s urbanization process has entered the middle and late stages.
The urbanization rate is also an important factor that restricts the growth of the vehicle ownership rate. The urbanization rate reflects the income level, population aggregation, and the construction of better transportation facilities. The development of urbanization promotes upgraded consumption and then promotes the rapid development of automobile consumption. In addition, contrary to previous research which set one saturation value, we considered the heterogeneous characteristics of each province and set the upper limit of 1000 people vehicle ownership according to the urban transition level of the province. Therefore, in order to further explore the development of private vehicle ownership under different urbanization levels, we divided all provinces into three groups according to their urbanization rate. In this study, the private vehicle ownership data were linked to the urbanization rate by referring to the urbanization rate data of 2017.
The scenario analysis was as follows: (1) provinces with an urbanization rate of less than 50%, namely, Xinjiang, Guangxi, Yunnan, Gansu, Guizhou, and Tibet, represented the low scenario (K = 300). (2) Provinces with urbanization rates between 50% and 60%, namely, Hubei, Heilongjiang, Hainan, Ningxia, Shanxi, Shaanxi, Jilin, Jiangxi, Hebei, Hunan, Qinghai, Sichuan, and Henan, represented the base scenario (K = 350). (3) Provinces with an urbanization rate greater than 60%, namely, Shanghai, Beijing, Tianjin, Guangdong, Jiangsu, Zhejiang, Liaoning, Fujian, Chongqing, Inner Mongolia, and Shandong, represented the high scenario (K = 400).

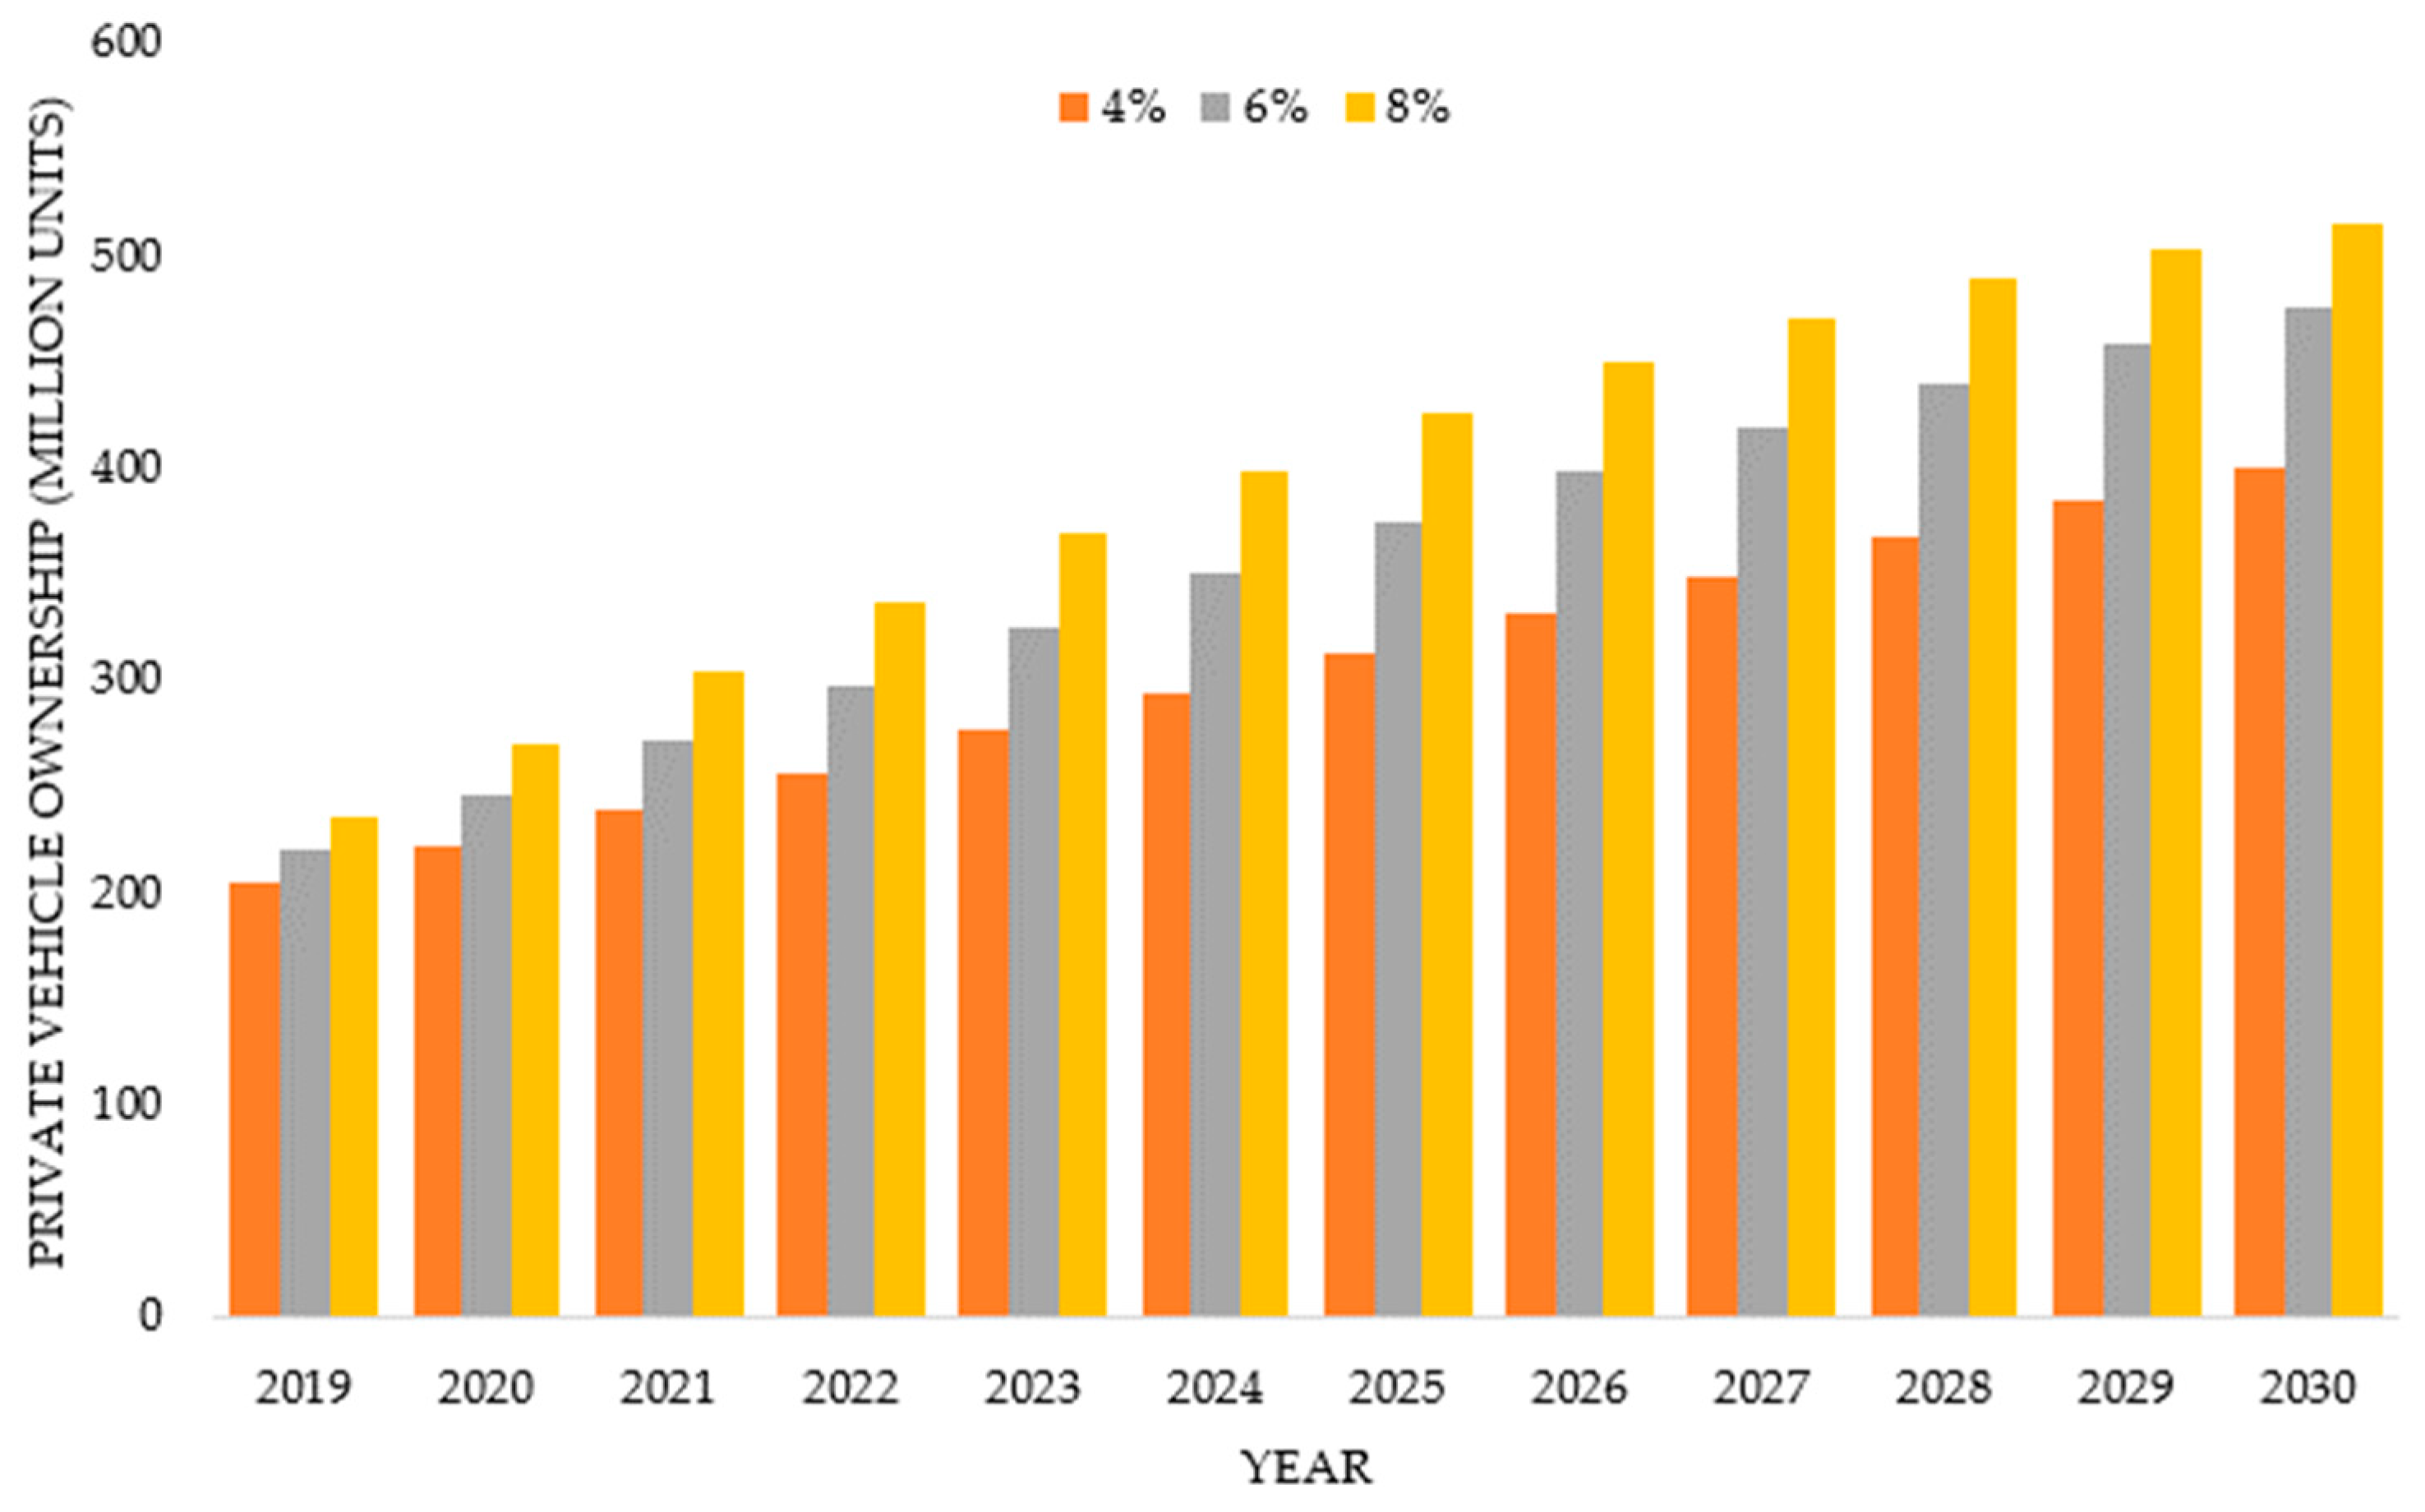
3.2. Private Vehicle Ownership

The private vehicle ownership and per capita GDP (in the 2000 base period, yuan) in China for 1999–2017 was fitted by calculating the model parameters α and β using the least squares method. The parameters and the corresponding time to reach the saturation value is shown in Table 2. This paper compares the forecast results of 1999–2017 with the existing statistical data. The goodness-of-fit is denoted by R2: the closer the R2 value is to 1, the better the fitting effect. As shown in Table 2, the goodness-of-fit values are all greater than 0.9, and they are higher than 0.95 for the majority of the provinces, meaning that our setting is rational.
In this study, considering the different speeds of economic development in various regions, scenario analysis was used in order to make targeted decisions. Following Huo et al. [12] and Zhao [29], we set three scenarios: the low-income growth scenario, the mid-income growth scenario, and the high-income growth scenario. When the average annual per capita GDP growth rate is 4% (low-growth scenario), the first four provinces that reach saturated values are Zhejiang (2046), Xinjiang (2047), Hubei (2048), and Hebei (2048). When the annual per capita GDP growth rate is at 6% (mid-growth scenario), the first four provinces that reach saturated values are Zhejiang (2037), Xinjiang (2037), Hubei (2038), and Hebei (2038). When the annual per capita GDP growth rate is 8% (high-growth scenario), the first four provinces that reach saturated values are Zhejiang (2032), Xinjiang (2032), Hubei (2033), and Hebei (2033). The number of private vehicles in each Chinese province is in line with the “S”-type development trend and is currently in an accelerated growth period. When the annual per capita GDP growth rate is 8%, after 2030, all of the regions will gradually become saturated with private vehicle ownership at different income levels and enter a period of decelerating growth. It is imperative to build a harmonious automobile society and formulate a scientific urban development plan.
The simulation results of China’s private vehicle ownership per 1000 people and the per capita GDP under the 6% scenario is shown in Figure 4. As shown in the figure, according to the relationship between the per capita GDP and private vehicle ownership per 1000 people, different regions with different levels of urbanization correspond to different Gompertz curves. High GDP regions do not necessarily have high private vehicle ownership per 1000 people.
According to data from the National Bureau of Statistics of China, the sixth population census specifies that the average annual growth rate of China’s population is 0.57% (China conducts a population census every 10 years, and the year in which the mantissa is zero is the census year. The sixth census was in 2010). The average annual growth rate of the population in this study was set to 0.5% (In 2019, the Chinese Academy of Social Sciences released the “Green Paper on Population and Labor: China Population and Labor Issues Report No. 19”, which indicated that the Chinese population will reach a peak of 1.442 billion in 2029, and it will continue to experience negative growth from 2030 onward. Combined with the current second-child policy, the effect is not obvious. This paper assumes that the law of population growth is not significantly different from before). By using the future population and the future private vehicle ownership per 1000 people, we can forecast the private vehicle ownership of each province.
The forecast for 2030 under the 8% scenario is shown in Figure 5. The forecast of China’s private vehicle ownership per 1000 people scenario is shown in (Figure 5a). Zhejiang is the province with the highest private vehicle ownership, with 391 private vehicles owned per 1000 people. In addition, Shandong, Jiangsu, Beijing, Tianjin, Shanghai, Fujian, Guangdong, Chongqing, and Inner Mongolia have more than 350 private vehicles owned per 1000 people, which is much higher than the national average (341 private vehicles owned per 1000 people). The lowest rates of ownership are Tibet (265 private vehicles owned per 1000 people), which is determined by its geographical location and geographical environment. Our results are lower than those of Wu et al. [14], since the urbanization rate was an important factor in our work, and this may influence the estimation results, as discussed above. However, our estimation is higher than that of Zhao et al. [29], since they set one constant saturation value for all regions, thereby ignoring the regional differences.
The forecast of China’s private vehicle ownership is shown in (Figure 5b). Guangdong and Shandong will exceed 40 million in 2030, which is related to the large population of the two provinces (the largest and second largest in the country, respectively). In Tibet, Qinghai, and Ningxia provinces, the number of possessed vehicles is relatively small, with values of 0.95 million, 2.17 million, and 2.51 million, respectively. As a result of population and natural environmental constraints, there is little room for future growth. The current urbanization rate of 50–60% for provinces such as Hubei, Hebei, Hunan, and other central provinces have a high potential for income increase, and the rapid economic development of these provinces will greatly promote their private vehicle ownership.
From the above analysis, we can predict the private vehicle ownership in China. The results are shown in Figure 6. As an example, with the mid-growth scenario, China’s private vehicle ownership will reach 246 million, 375 million, and 475 million in 2020, 2025, and 2030, respectively, indicating that China’s motorization process will expand significantly. Energy consumption, exhaust emissions, traffic pressure, scrapped vehicle recycling, and other problems will become increasingly prominent.
In 2019, the Chinese Academy of Social Sciences released the “Green Paper on Population and Labor: China Population and Labor Issues Report No. 19”, which indicated that the Chinese population will reach a peak of 1.442 billion in 2029, and it will continue to experience negative growth from 2030 onward. Combined with the current second-child policy, the effect is not obvious. This paper assumed that the law of population growth is not significantly different from before.
In addition, the impact of the K value on the overall results was examined by increasing or decreasing it by 10%. If only the K value was adjusted, the number for private vehicle ownership changed by the same rate. With the settings reported in this paper, if the K value changed, the S-curve needed to be adjusted to ensure that the predicted value of private vehicle ownership per 1000 people reflected the actual statistical value. The results are shown in Table 3 and Table 4. During the forecast period, the change in the range of private vehicle ownership was smaller than that of the K value.

4. Sustainable Transportation Policy under Urban Transition in China

China is the world’s largest auto market; private vehicle ownership has risen sharply and will continue to increase at a high rate. Nowadays, many large Chinese cities have entered into an auto society. Vehicles have increased the scope of the city and promoted the process of urbanization in China. However, the continued rapid growth of private vehicle ownership in China’s urban areas has also exerted many negative effects on urban development, such as traffic congestion, serious exhaust pollution, and scrapped vehicle recycling pressures.

4.1. Traffic Congestion Problems and Solutions

From the perspective of motor vehicle types, private vehicles account for the largest proportion of travel. According to our estimation, with the acceleration of urbanization, the total number of private vehicles will rise sharply over the next few decades. In order to solve the traffic congestion problems, national and regional governments have implemented a series of transportation policies. From the demand side of transportation, many cities have implemented traffic control policies, including traffic restrictions based on license plate numbers and limitations on purchasing private cars by restricting license plate numbers. As early as 1994, Shanghai initially proposed an auction policy to assign licenses to private cars, and nine cities have implemented policies that restrict private car purchasing. In addition, more than 100 Chinese cities have adopted traffic restriction policies that limit the travel of private cars on the basis of the last number of the license plate. Despite these administrative methods, many cities have also tried to use economic traffic control methods, such as congestion fees; however, congestion fees have not been put into practice yet. Although some relevant traffic control policies have been implemented, the traffic congestion problem is still serious in the majority of Chinese cities. Therefore, many large cities have tried to promote the sustainable development of diversified green transportation by sharing or leasing models and adopting traffic control policies to restrict on-road traffic flow to relieve congestion. In Chinese megacities, such as Beijing, in the last stage of urbanization, people travel mainly by public transportation, such as buses and subways, and private vehicles are used to supplement public transportation. In recent years, provinces that are at a high level of urbanization have tried to encourage the sharing of automobiles, decrease the frequency of private vehicle use, and create a new development mode in the transportation industry. In addition, promoting the transformation of shared transportation into the “Internet Plus” model and working toward sustainable urban development have had an alleviating effect on urban traffic problems. The preferential allocation of resources avoids the disorderly development of resource waste and repeated reconstruction in the shared transportation field. For the provinces at a moderate level of urbanization, with improved economics, the rapid growth of private vehicles will inevitably become significant. Therefore, these regions are encouraged to improve the public transportation system and service facilities and to promote urban compactness to increase accessibility to public transportation. For the provinces at a low level of urbanization, the saturation value of private vehicle ownership per 1000 people is lower than that of other provinces. Because of limitations due to the presence of geographical and economic conditions, the large-scale construction of urban railway transport is unrealistic. Therefore, a better strategy is to design a rational urban network to ease the pressures placed on roads. Last but important, the urban form should also be taken into account. For high-density cities such as Beijing, Shanghai, Shenzhen, and Guangzhou, urban designers should make efforts to construct walkable cities that are highly reliant on the convenience of the public transportation system and mixed-use of land. For low-density cities, urban designers should pay attention to the sprawl of urban land due to the promotion of private transportation.

4.2. Pollutant Emissions and Solutions

At present, the rapid increase in private vehicle ownership has caused the accelerated deterioration of the environment in China’s large cities, and environmental pollution in many large cities has reached warning levels. Traditional fuel vehicle exhaust emissions have become the main source of environmental pollution in large cities in China. The main substances in automobile exhaust are carbon monoxide (CO), sulfur dioxide (SO2), nitrogen oxides (NOX), fine particular matter (PM2.5), and hydrocarbons (HCs), which are also the main substances that constitute urban air pollution. In recent years, the continuous increase in private vehicle ownership has caused China’s air pollution to shift from the original coal-smoke type to a mixture of automobile exhaust and soot. In response, the Chinese government has tried to promote the popularity of the electric car through subsidy policies and purchase tax exemption policy. However, replacing oil-fueled vehicles with electric vehicles is not a cure, and it is impossible to fundamentally improve pollution because China’s electricity is still based on thermal power. In addition, carbon emissions can increase during the production of electric cars. Therefore, some countries, such as Singapore, treat electric cars as a serious source of pollution and impose pollution taxes. Rapid urbanization, motorization, and traffic pollution have become important issues that hinder China’s sustainable urban transition. Therefore, it is necessary to strengthen the management of inspection services for in-use power-driven vehicles to ensure that current vehicles meet national standards, environmental protection supervision institutions are strengthened, and regulations and plans for motor vehicle pollution prevention and control are formulated as soon as possible. In addition, the governments of regions at high and medium levels of urbanization should promote the transition from traditional oil-fueled vehicles to energy-efficient and new-energy vehicles. However, because of the high cost of new-energy vehicles, provinces at a low level of urbanization and economic development should take action to improve the quality of fuel oil to prevent traffic pollution.

4.3. Scrapped Private Vehicle Recycling Problems and Solutions

China’s current vehicle scrap rate is about 4%, while the scrap rate is about 6–8% in developed countries. Given China’s current situation and the scrap rate in developed countries, we set the scrap rate in our scenarios to 4–6%. For example, for an annual GDP growth rate of 6% per capita, the number of private vehicles scrapped in China will range between 9.2 million and 13.8 million, between 13.6 million and 20.4 million, and between 17.20 million and 25.8 million in 2020, 2025, and 2030, respectively. The problem of recycling scrapped private vehicles will become increasingly serious. At the technical level, manual dismantling remains China’s automobile dismantling treatment technology. Limited by the technical level, the valuable resource recovery rate is low, and the waste is substantial. At the institutional level, although the number of scrapped vehicles has retained a high growth rate, the recovery rate of automobiles is only 0.5–1%, which is far lower than the 5–7% recovery rate in developed countries. A large number of scrapped vehicles flow into informal channels and black markets for resale, which results in significant environmental problems and safety hazards. It is extremely urgent to (1) implement a system that extends the responsibility of the producer to ensure that the regular dismantling of scrapped vehicles occurs and (2) promote the development of remanufacturing.
This research is still in its preliminary stage. Three main aspects can be further explored in future studies. First, the accuracy of our forecasted results could be influenced by the future implementation of restriction policies, such as purchase limitation and traffic control. Second, we used a simple method to set the saturation value, and a more precise model is needed in future work. In addition, we only set three saturation values, which could be extended to establish more specific saturation values for each province. Third, this study only used the Gompertz model to estimate the influence of GDP per capita on private vehicle ownership. Other influential factors should be taken into account in future studies.

Author Contributions

The contributions of each author are as follows: conceptualization, Y.L. and L.M.; methodology, Y.L.; software, Y.L.; resources, Y.H.; data curation, Y.L.; writing—original draft preparation, Y.L. and L.M.; writing—review and editing, Y.L. and L.M.; visualization, Y.C.; supervision, Y.L. and L.M.; project administration, Y.L. and L.M.; funding acquisition, Y.L. and L.M.

Funding

This research received funding from the National Natural Science Foundation of China (No. 71804195 and No. 41801218) and Humanity and Social Science Project for Young Teachers of Shenzhen University (No. 18QNFC08).

Conflicts of Interest

The authors declare no conflict of interest.

References

  1. UN-Habitat. Report on Human Settlements 2007: Enhancing Urban Safety and Security; UN-Habitat: London, UK, 2007. [Google Scholar]
  2. National Bureau of Statistics of China. China Statistical Yearbook 2000–2018; China Statistics Press: Beijing, China, 2000–2018. (In Chinese)
  3. China Association of Automobile Manufactures. China Automotive Industry Yearbook 2018; China Automotive Industry Yearbook House (CAIY): Tianjin, China, 2018. (In Chinese) [Google Scholar]
  4. China Association of Automobile Manufactures. Bulletins of the Production and Sales of Automobiles in China. 2019. Available online: https://www.sohu.com/a/222448944_276701 (accessed on 18 June 2019).
  5. National Bureau of Statistics of China Homepage. Available online: http://www.stats.gov.cn/tjsj/zxfb/201902/t20190228_1651265.html (accessed on 18 June 2019).
  6. Li, Y.; Fujikawa, K. Potential of the Renewable Resources of End-of-Life Vehicles in China. Environ. Sci. 2017, 30, 184–189. (In Japanese) [Google Scholar] [CrossRef] [PubMed]
  7. Lin, B.; Du, Z. How China׳s urbanization impacts transport energy consumption in the face of income disparity. Renew. Sustain. Energy Rev. 2015, 52, 1693–1701. [Google Scholar] [CrossRef]
  8. Du, Z.; Lin, B. Changes in automobile energy consumption during urbanization: Evidence from 279 cities in China. Energy Policy 2019, 132, 309–317. [Google Scholar] [CrossRef]
  9. He, D.; Meng, F.; Wang, M.Q.; He, K. Impacts of Urban Transportation Mode Split on CO2 Emissions in Jinan, China. Energies 2011, 4, 685–699. [Google Scholar] [CrossRef]
  10. Zhang, Y.; Shuai, C.; Bian, J.; Chen, X.; Wu, Y.; Shen, L. Socioeconomic factors of PM2.5 concentrations in 152 Chinese cities: Decomposition analysis using LMDI. J. Clean. Prod. 2019, 218, 96–107. [Google Scholar] [CrossRef]
  11. Wang, Y.; Teter, J.; Sperling, D. Will China’s Vehicle Population Grow Even Faster than Forecasted? Working Papers 2012, 1, 30–33. [Google Scholar]
  12. Huo, H.; Wang, M. Modeling future vehicle sales and stock in China. Energy Policy 2012, 43, 17–29. [Google Scholar] [CrossRef]
  13. Huo, H.; Wang, M.; Johnson, L.R.; He, D. Projection of Chinese motor vehicle growth, oil demand, and CO2 emissions through 2050. Transp. Res. Rec. 2007, 2038, 69–77. [Google Scholar] [CrossRef]
  14. Wu, T.; Zhao, H.; Ou, X. Vehicle Ownership Analysis Based on GDP per Capita in China: 1963–2050. Sustainability 2014, 6, 4877–4899. [Google Scholar] [CrossRef]
  15. Dargay, J.; Gately, D.; Sommer, M. Vehicle Ownership and Income Growth, Worldwide: 1960–2030. Energy J. 2007, 28, 143–170. [Google Scholar] [CrossRef]
  16. Hao, H.; Liu, Z.; Zhao, F.; Li, W.; Hang, W. Scenario analysis of energy consumption and greenhouse gas emissions from China’s passenger vehicles. Energy 2005, 91, 151–159. [Google Scholar] [CrossRef]
  17. Li, X.; Wang, E.; Zhang, C. Prediction of Electric Vehicle Ownership Based on Gompertz model. In Proceedings of the 2014 IEEE International Conference on Information and Automation (ICIA), Hailar, China, 28–30 July 2014; pp. 87–91. [Google Scholar]
  18. Gu, J.; Qi, F.; Wu, J. Forecasting on China’s civil automobile-owned based on Gompertz model. Technol. Econ. 2010, 29, 57–62. (In Chinese) [Google Scholar]
  19. Hao, H.; Wang, H.; Ouyang, M. Predictions of China’s passenger vehicle and commercial vehicle stocks. J. Tsinghua Univ. (Sci.Tech.) 2011, 51, 868–872. (In Chinese) [Google Scholar]
  20. Zhang, Z.; Jin, W.; Jiang, H.; Xie, Q.; Shen, W.; Han, W. Modeling heterogeneous vehicle ownership in China: A case study based on the Chinese national survey. Transp. Policy 2017, 54, 11–20. [Google Scholar] [CrossRef]
  21. Zheng, B.; Huo, H.; Zhang, Q.; Yao, Z.L.; Wang, X.T.; Yang, X.F.; Liu, H.; He, K.B. A new vehicle emission inventory for China with high spatial and temporal resolution. Atmos. Chem. Phys. Discuss. 2013, 13, 32005–32052. [Google Scholar] [CrossRef]
  22. Huang, B. The Use of Pseudo Panel Data for Forecasting Car Ownership (Dissertation). University of London(Dissertation) 2007. Available online: https://mpra.ub.uni-muenchen.de/7086/ (accessed on 18 June 2019).
  23. Wardrop, J.G. Some Theoretical Aspects of Road Traffic Research; Institution of Civil Engineers: London, UK, 1952; Volume 1, pp. 325–362. [Google Scholar]
  24. Train, K. Qualitative Choice Analysis, Theory, Econometrics, and an Application to Automobile Demand; The MIT Press: Cambridge, MA, USA, 1986. [Google Scholar]
  25. Button, K.; Ngoe, N.; Hine, J. Modeling vehicle ownership and use in low income countries. J. Transp. Econ. Policy 1993, 27, 51–67. [Google Scholar]
  26. The People’s Government of Hainan Province. Available online: http://www.hainan.gov.cn/hn/yw/jrhn/201805/t20180517_2634806.html (accessed on 18 June 2019).
  27. Miao, L. Examining the impact factors of urban residential energy consumption and CO2 emissions in China—Evidence from city-level data. Ecol. Indic. 2017, 73, 29–37. [Google Scholar] [CrossRef]
  28. Wang Y, N. Car Ownership Forecast In China—An Analysis Based on Gompertz Equation. Res. Financ. Econ. Issues 2005, 11, 43–50. [Google Scholar]
  29. Zhao, H.M. The medium and long term forecast of China’s vehicle stock per 1000 people based on the Gompertz model. J. Ind. Technol. Econ. 2012, 7, 7–23. (In Chinese) [Google Scholar]
  30. World Bank Open Data. Available online: https://data.worldbank.org.cn (accessed on 18 June 2019).
  31. Northam, R.M. Urban Geography; John Wiley Sons: New York, NY, USA, 1975. [Google Scholar]
Figure 1. Vehicle ownership per 1000 people and the per capita GDP for the US, the UK, France, Japan, and China, depicted by an illustrative Gompertz function (1960–2017).
Sustainability 11 04259 g001
Figure 2. (a): China’s private vehicle ownership per 1000 people and the per capita GDP (1999–2017); (b): China’s private vehicle ownership per 1000 people and the population density (1999–2017); (c): China’s private vehicle ownership per 1000 people and the road network density based on area (1999–2017); (d): China’s private vehicle ownership per 1000 people and the road network density based on population(1999–2017).
Sustainability 11 04259 g002
Figure 3. Urbanization rate of Chinese provinces (1998–2018). Source: National Bureau of Statistics.
Sustainability 11 04259 g003
Figure 4. Simulation results of China’s private vehicle ownership per 1000 people and the per capita GDP (1999–2017). Note the growth rate of GDP per capita under the scenario of 6%.
Sustainability 11 04259 g004
Figure 5. (a) The forecast of China’s private vehicle ownership per 1000 people in 2030; (b) the forecast of China’s private vehicle ownership in 2030 (10,000 units). Note the growth rate of GDP per capita under the scenario of 8%.
Sustainability 11 04259 g005
Figure 6. The forecast of China’s total private vehicle ownership. Note the growth rate of GDP per capita under the scenarios of 4%, 6%, and 8%.
Sustainability 11 04259 g006
Table 1. Data Sources.
Variable/ParameterDetailSource
UUrbanizationNational and Regional Statistical Yearbook (1999–2018)
P u Urban population of one provinceNational and Regional Statistical Yearbook (1999–2018)
PTotal population of one provinceNational and Regional Statistical Yearbook (1999–2018)
sPrivate vehicle ownership per 1000 peopleChina Automobile Industry Yearbook (2017), World Motor Vehicle Statistics (2016), China Statistical Yearbook (1999–2018)
KThe indicator of the saturation level of vehicle ownershipThe World Bank Open Data, China Statistical Yearbook (1999–2018)
gNational and regional GDP per capitaThe World Bank Open Data, China Statistical Yearbook (1999–2018)
Table 2. Simulation results of private vehicle ownership.
Provinceα × 10−3βR2Time to Reach Saturation
4%6%8%
Shanghai0.0610.7430.957205220422036
Beijing0.7270.7210.905205420422036
Tianjin0.1190.7690.942205820452038
Guangdong0.5690.6440.992205420422036
Jiangsu0.6430.6970.997205220412035
Liaoning2.8500.6990.977206220472039
Zhejiang0.0160.5770.994204620372032
Fujian1.3950.6950.994205820452038
Chongqing1.1640.6440.998206020462039
Inner Mongolia0.1210.6260.968205420422036
Shandong0.0430.5590.998205120402034
Hubei0.0010.4490.989204820382033
Heilongjiang0.6180.5340.936206220472040
Hainan0.6180.5340.994205820452038
Ningxia0.0400.4400.994205120402035
Shanxi0.0090.3540.923205020402034
Jilin0.2160.5420.971205620432037
Shaanxi1.2630.5690.992205620442037
Hebei0.0010.3400.952204820382033
Jiangxi0.1210.4780.999205820442038
Hunan0.5110.5560.998205920462039
Anhui0.1800.4510.995205520432037
Qinghai0.0190.4160.987205320422036
Sichuan1.7630.5240.994205920462039
Henan0.0950.4500.996205420422036
Xinjiang0.0010.3250.979204720372032
Guangxi0.3030.3580.978205820452038
Yunnan0.2670.3480.990205420422036
Gansu0.0010.2150.952205020402034
Guizhou3.8110.4830.997205920462039
Tibet2.7950.5190.988206420482040
Table 3. The forecast of China’s private vehicle ownership per 1000 people.
Initial KAdjusted K (+10%)Adjusted K (−10%)
Vehicle Ownership per 1000 PeopleVehicle Ownership per 1000 PeopleVariation (%)Vehicle Ownership per 1000 PeopleVariation (%)
20191481554146−1
20201651734162−2
20211831915177−2
20222002095193−4
20232172285208−4
20242342465223−5
20252502635236−5
20262652795249−6
20272792945261−6
20282913076272−7
20293033196281−7
20303133306289−8
Note the growth rate of GDP per capita under the scenario of 6%.
Table 4. The forecast of China’s private vehicle ownership (million units).
Initial KAdjusted K (+10%)Adjusted K (−10%)
Vehicle Ownership (Million Units)Vehicle Ownership (Million Units)Variation (%)Vehicle Ownership (Million Units)Variation (%)
20192202231212−3
20202462502236−4
20212722782260−5
20222983063283−5
20233253343307−6
20243503623329−6
20253753894351−6
20263984154371−7
20274204384390−7
20284404615408−8
20294594815423−8
20304754995437−8
Note the growth rate of GDP per capita under the scenario of 6%.

