Article

Does the Low-Carbon Pilot Initiative Reduce Carbon Emissions? Evidence from the Application of the Synthetic Control Method in Guangdong Province

1
Business School, Ningbo University, Ningbo 315211, China
2
Donghai Institute, Ningbo University, Ningbo 315211, China
3
Law School, Ningbo University, Ningbo 315211, China
*
Authors to whom correspondence should be addressed.
Sustainability 2019, 11(14), 3979; https://doi.org/10.3390/su11143979
Submission received: 24 May 2019 / Revised: 16 July 2019 / Accepted: 18 July 2019 / Published: 23 July 2019

Abstract

:
As the world’s top energy consumer and carbon emitter, China’s carbon emissions policies, including the low-carbon pilot initiative (LCPI) implemented in July 2010, have important effects on global climate change. Therefore, accurately assessing the effect of this policy has become extremely important for low-carbon development. This article analyses the impact of implementing LCPI on regional carbon emissions by using Guangdong Province as the study area, which has the largest economic scale, population size and carbon emissions amongst China’s low-carbon pilot provinces. The results suggest that for the entire 2010–2015 period, Guangdong’s carbon emissions were reduced by about 10% due to the implementation of LCPI. This policy produced a significant impact on the carbon emissions from manufacturing industries but showed minimal impact on the carbon emissions from energy production. Unlike previous researchers who relied on estimations, the authors of this work obtained unified carbon emissions data for 1997–2015 from the China Emission Accounts and Datasets and then constructed comparison groups by using the synthetic control method instead of performing a subjective selection. The authors also examined the impact of LCPI on carbon emissions from different sources. This article proposes that policy support and low-carbon action are necessary for reducing regional carbon emissions and that the policies must be constantly adjusted during their implementation. The successful experiences in low-carbon pilots are also worth exploring and promoting in other regions.

1. Introduction

Over the past century, the global average temperature increased by 0.4–0.8 °C, which is expected to increase further to 1.4–5.8 °C over the next 100 years. Global warming has created many environmental problems, such as the melting of bipolar glaciers, rising sea levels, increased frequency of extreme weather and ecological damage, thereby turning this phenomenon into one of the major challenges being faced by the world today [1,2,3,4]. Scientific studies have confirmed a direct relationship between greenhouse gas emissions (e.g., carbon dioxide) and global climate change [5,6,7,8]. In addition, the amount of global carbon dioxide emissions continues to increase despite the calls of climate scientists and international organizations, including the United Nations, for cuts in energy consumption [9]. The research of Global Carbon Project reveals that the amount of global CO2 emissions has increased by 1.6% in 2016–2017 and is expected to increase by 2.7% in 2018 [10].
China is the world’s top energy consumer and CO2 emitter [11]. Since its accession to the WTO in 2001, China’s GDP growth rate has reached an average of 10% a year, thereby turning China into the world’s second largest economy. However, the rapid development of China’s economy comes at the cost of consuming huge amounts of resources. According to the National Bureau of Statistics of China, the total energy consumption of China increased by nearly three times from 1555 million tce (ton of standard coal equivalent) in 2001 to 4490 million tce in 2017 [12]. Such large quantification energy consumption also results in huge amounts of carbon emissions. Previous studies reveal that 27% of global carbon emissions in 2017 originated from China [10].
China and other countries around the world have reached a consensus that promoting a low-carbon economy with the goal of reducing greenhouse gas emissions can effectively solve those problems driven by climate change [13,14,15,16]. In 2004, the National Development Reform Commission (NDRC) promulgated the Medium and Long-Term Special Plan for Energy Conservation (2004) to reduce energy intensity [17]. Subsequently, China’s top administrative institution, the State Council, promulgated China’s National Climate Change Program (2007) and White Paper on China’s Actions and Strategy on Climate Change (2008) to reduce the country’s greenhouse gas emissions [18,19]. In 2009, the State Council announced its target to reduce the country’s carbon intensity by 40%–45% by 2020 compared to its 2005 level [20], and this target was subsequently included in the National 12th Five Year Plan in 2010 [21]. To achieve such target, in July 2010, the NDRC started implementing its low-carbon pilot initiative (LCPI) in the five provinces of Liaoning, Hubei, Guangdong, Yunnan, and Shaanxi.
The implementation of LCPI has motivated many researchers to examine the effect of this policy. For example, Chu (2017), Deng (2017), and Dai (2015) argued that the implementation of LCPI has significantly inhibited regional carbon emissions and that this effect continues to increase every year. [22,23,24]. However, Lu (2017) argued that not all pilot areas were influenced by LCPI, with only Shaanxi showing significant reductions in its carbon emissions [25]. Similarly, Zhao (2018) argued that the effect of LCPI varies across different provinces. For instance, this policy effectively reduced the agricultural carbon emissions in Shaanxi, Hubei, and Liaoning but did not produce any obvious effect in Guangdong and Yunnan [26].
Previous studies have evaluated the effectiveness of LCPI, but their conclusions greatly vary and even contradict one another because of the differences in their data and methodologies. For instance, the most important outcome variable used in these studies (CO2 emissions) was estimated by using different methods. However, emissions estimates are relatively uncertain in many circumstances and show large gaps [27]. The methodologies employed in previous research, including the Differences-in-Differences method, also show some limitations in evaluating policy effects, with researchers often selecting their comparison groups subjectively [28]. In addition, previous researches do not study deeply the impact of the LCPI on carbon emissions from different sources.
In this study, the authors obtained annual CO2 emissions data at the provincial level for 1997–2015 from China Emission Accounts and Datasets (CEADs), which was constructed in 2017 and is considered by far the most authoritative and unified carbon emission dataset for emission-related research in China. The authors also used Guangdong Province as the study area given that this province has the largest economic scale, population size and carbon emissions amongst China’s low-carbon pilot provinces. Data-driven procedures were also employed to construct suitable comparison groups based on the synthetic control method proposed by Abadie to examine whether LCPI has actually reduced the regional carbon emissions of China. The impact of this policy on carbon emissions from different sources has also been investigated.

2. Materials and Methods
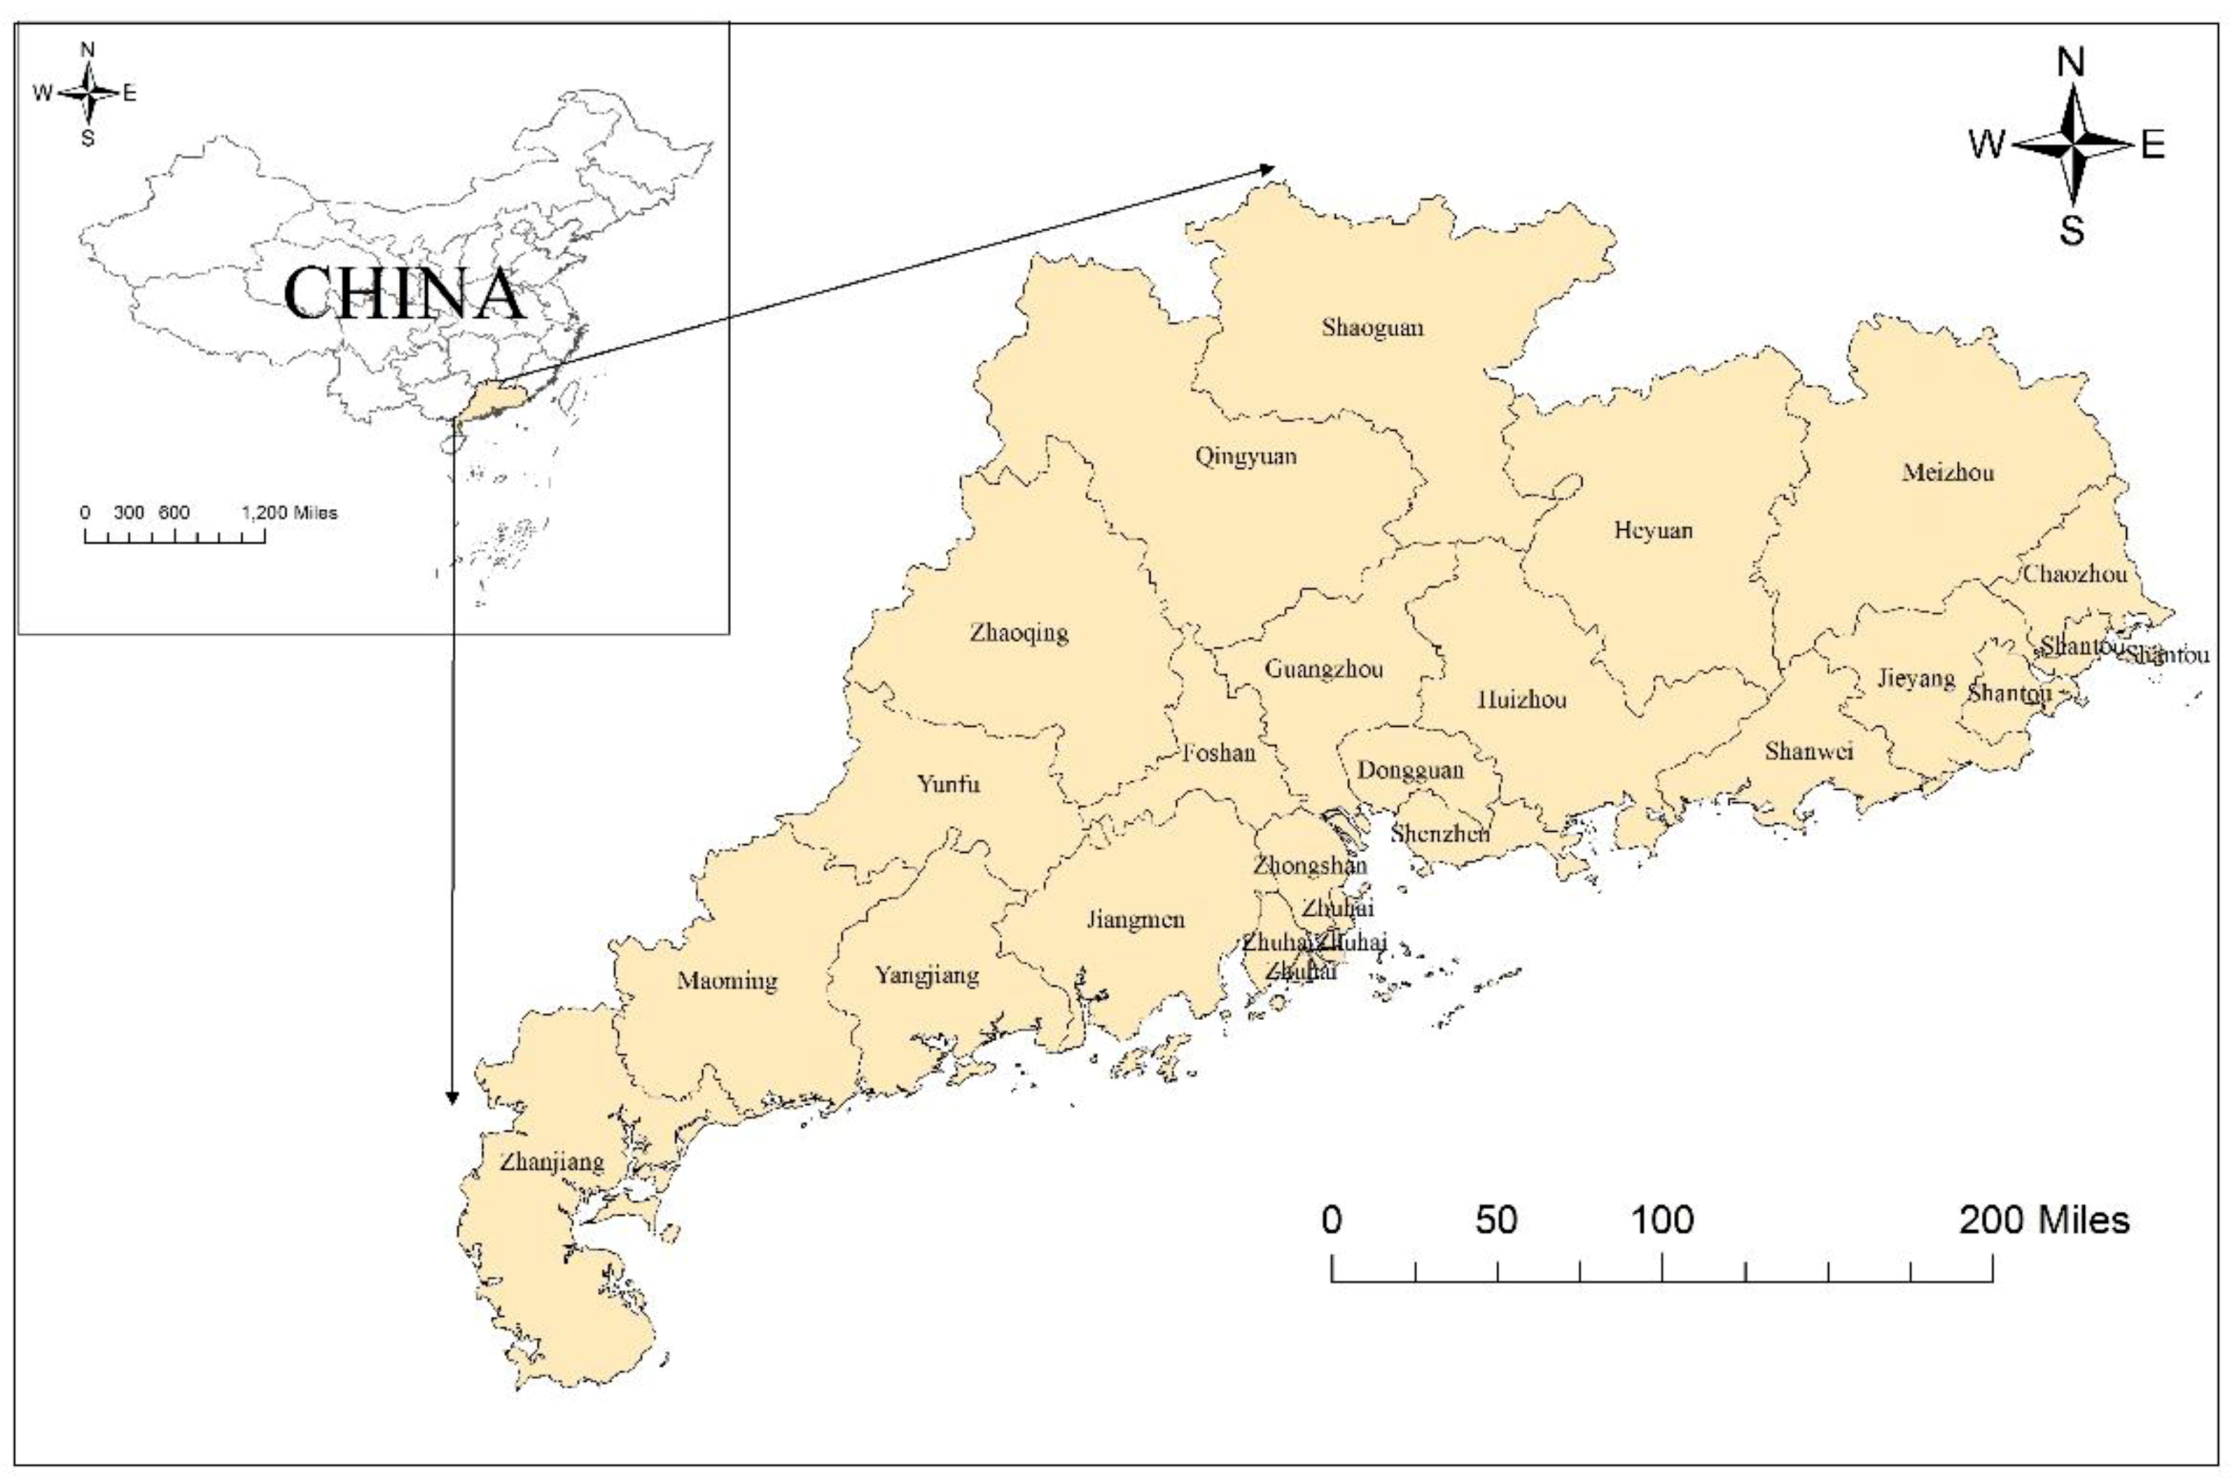
2.1. Study Area

Guangdong Province, one of China’s first low-carbon pilot provinces, is located in the southeastern part of the country (109°39′~117°19′ E and 20°13′~25°31′ N) facing the South China Sea (
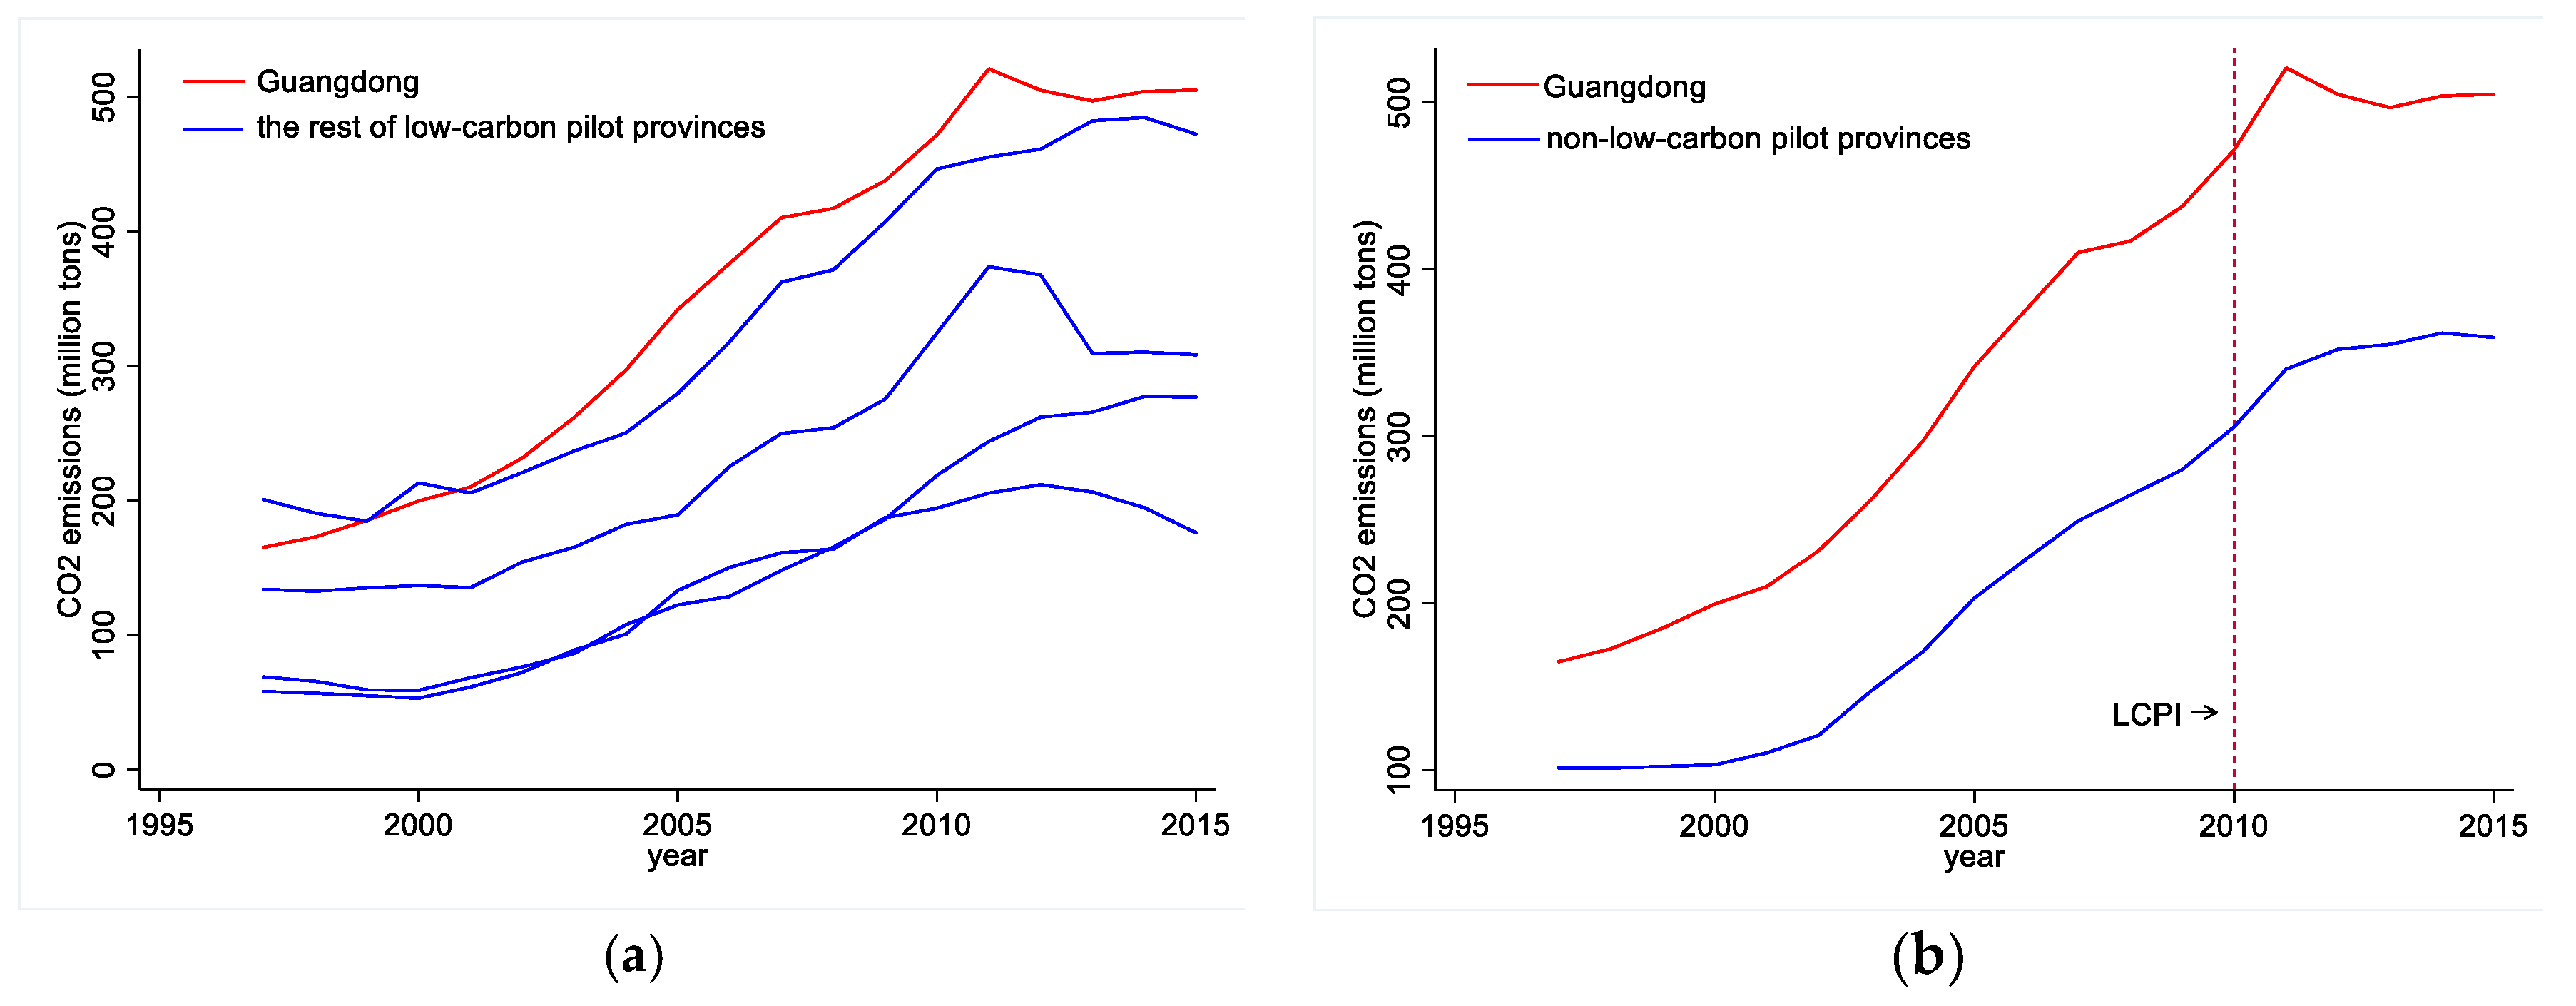
Figure 1). The Guangdong provincial administrative area includes 21 cities with a total population of 117 million, thereby making this area the most populated province in China. Since 1989, Guangdong’s GDP has ranked first in the country, thereby turning Guangdong into China’s largest economic province. In 2017, the total GDP of Guangdong amounted to 89,705.23 billion yuan or 10.8% of China’s total GDP. The high amount of economic aggregates and total population also hugely contribute to the carbon emissions of this province. In fact, Guangdong’s annual CO2 emissions are higher than those of the other four low-carbon pilot provinces since 2001 (Figure 2a).

2.2. Policy Background

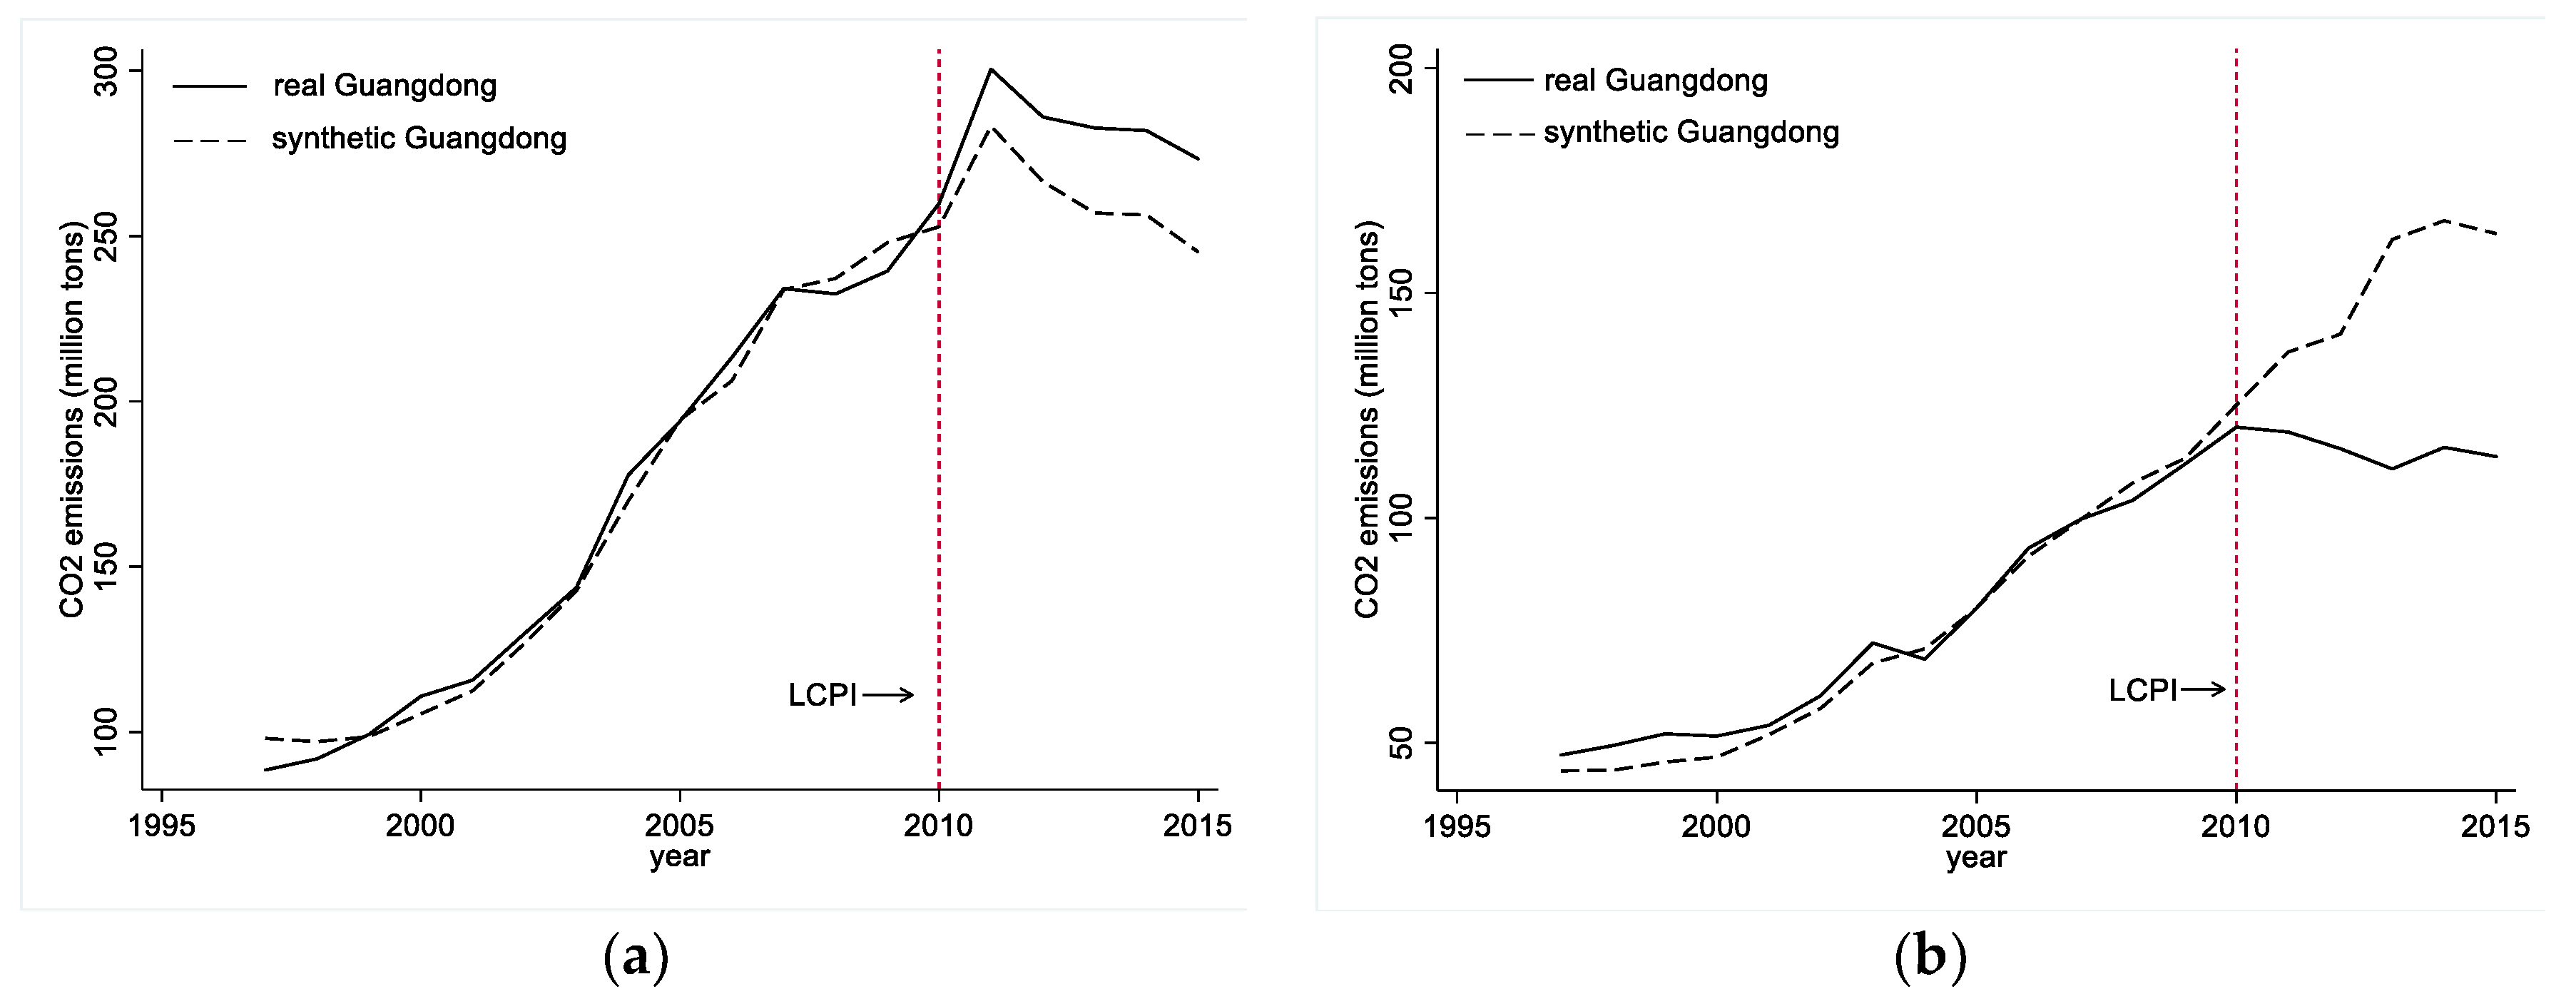
The main sources of carbon emissions in Guangdong are its energy production and manufacturing industries, which altogether account for 80.4% of the province’s total emissions (Figure 3). The Guangdong government divided its implementation of LCPI into four periods, namely, the start-up period (August 2010–December 2010), the initial period (2011), the crucial period (2012–2013) and the deepening period (2014–2015), all of which aimed to reduce the CO2 emissions of the province by 35% in 2015 from its 2005 level. To achieve this goal, Guangdong focuses on the optimization of its energy structure and the development of its low-carbon industry.
To optimize an energy structure, the production of thermal power, nuclear power, and wind power must be promoted, the utilization of solar energy must be enhanced, biomass energy needs to be developed in moderation, a new type of rural energy must be developed according to the local conditions and other emerging energy sources, such as geothermal energy, tidal energy, and hydrogen energy, need to be cultivated. In addition, the government advocates that enterprises should pay attention to their energy conservation and improve their energy efficiency in their production processes. To create a low-carbon industry, the development of advanced manufacturing (e.g., nuclear power equipment, wind power equipment, automobile manufacturing, petrochemicals, shipbuilding and marine engineering equipment manufacturing) and strategic emerging manufacturing (e.g., semiconductor lighting, new energy vehicles, solar photovoltaic energy, energy conservation, and environmental protection) must be accelerated, whilst the development of modern service industries (e.g., finance, logistics, information services, technology services, outsourcing services, headquarters economies, business exhibitions, cultural creativity, and tourism) needs to be optimized. A circular economy must also be developed, clean production processes and technologies need to be promoted, waste generation from sources must be reduced and waste recycling must be encouraged.
In addition, Guangdong has also implemented some innovative policies. In institutional reform, the Guangdong Provincial Leading Group for Climate Change and Energy Conservation and Emission Reduction was established and directly led by the governor. Meanwhile, the low-carbon targets was incorporated into the performance evaluation system of government officials. In market mechanism, Guangdong pioneered the development of an emissions trading scheme (ETS), which could allow carbon emissions allowances to be traded. Unlike other areas in China, which use the free allocation of permits to reduce the financial burden on enterprises, Guangdong adopted a tougher approach by requiring compliance enterprises to buy allowances through auction. For example, the compliance enterprises in the iron and steel industry could receive a 97% quota for free only if they purchase 3% of allowances. The government also set a high reserve price of RMB 60/ton for mandatory auction. This allocation approach is superior to free allocation because it contributes to the identification of the proper price for carbon emissions, as well as raising money for the provincial low-carbon development fund [29].
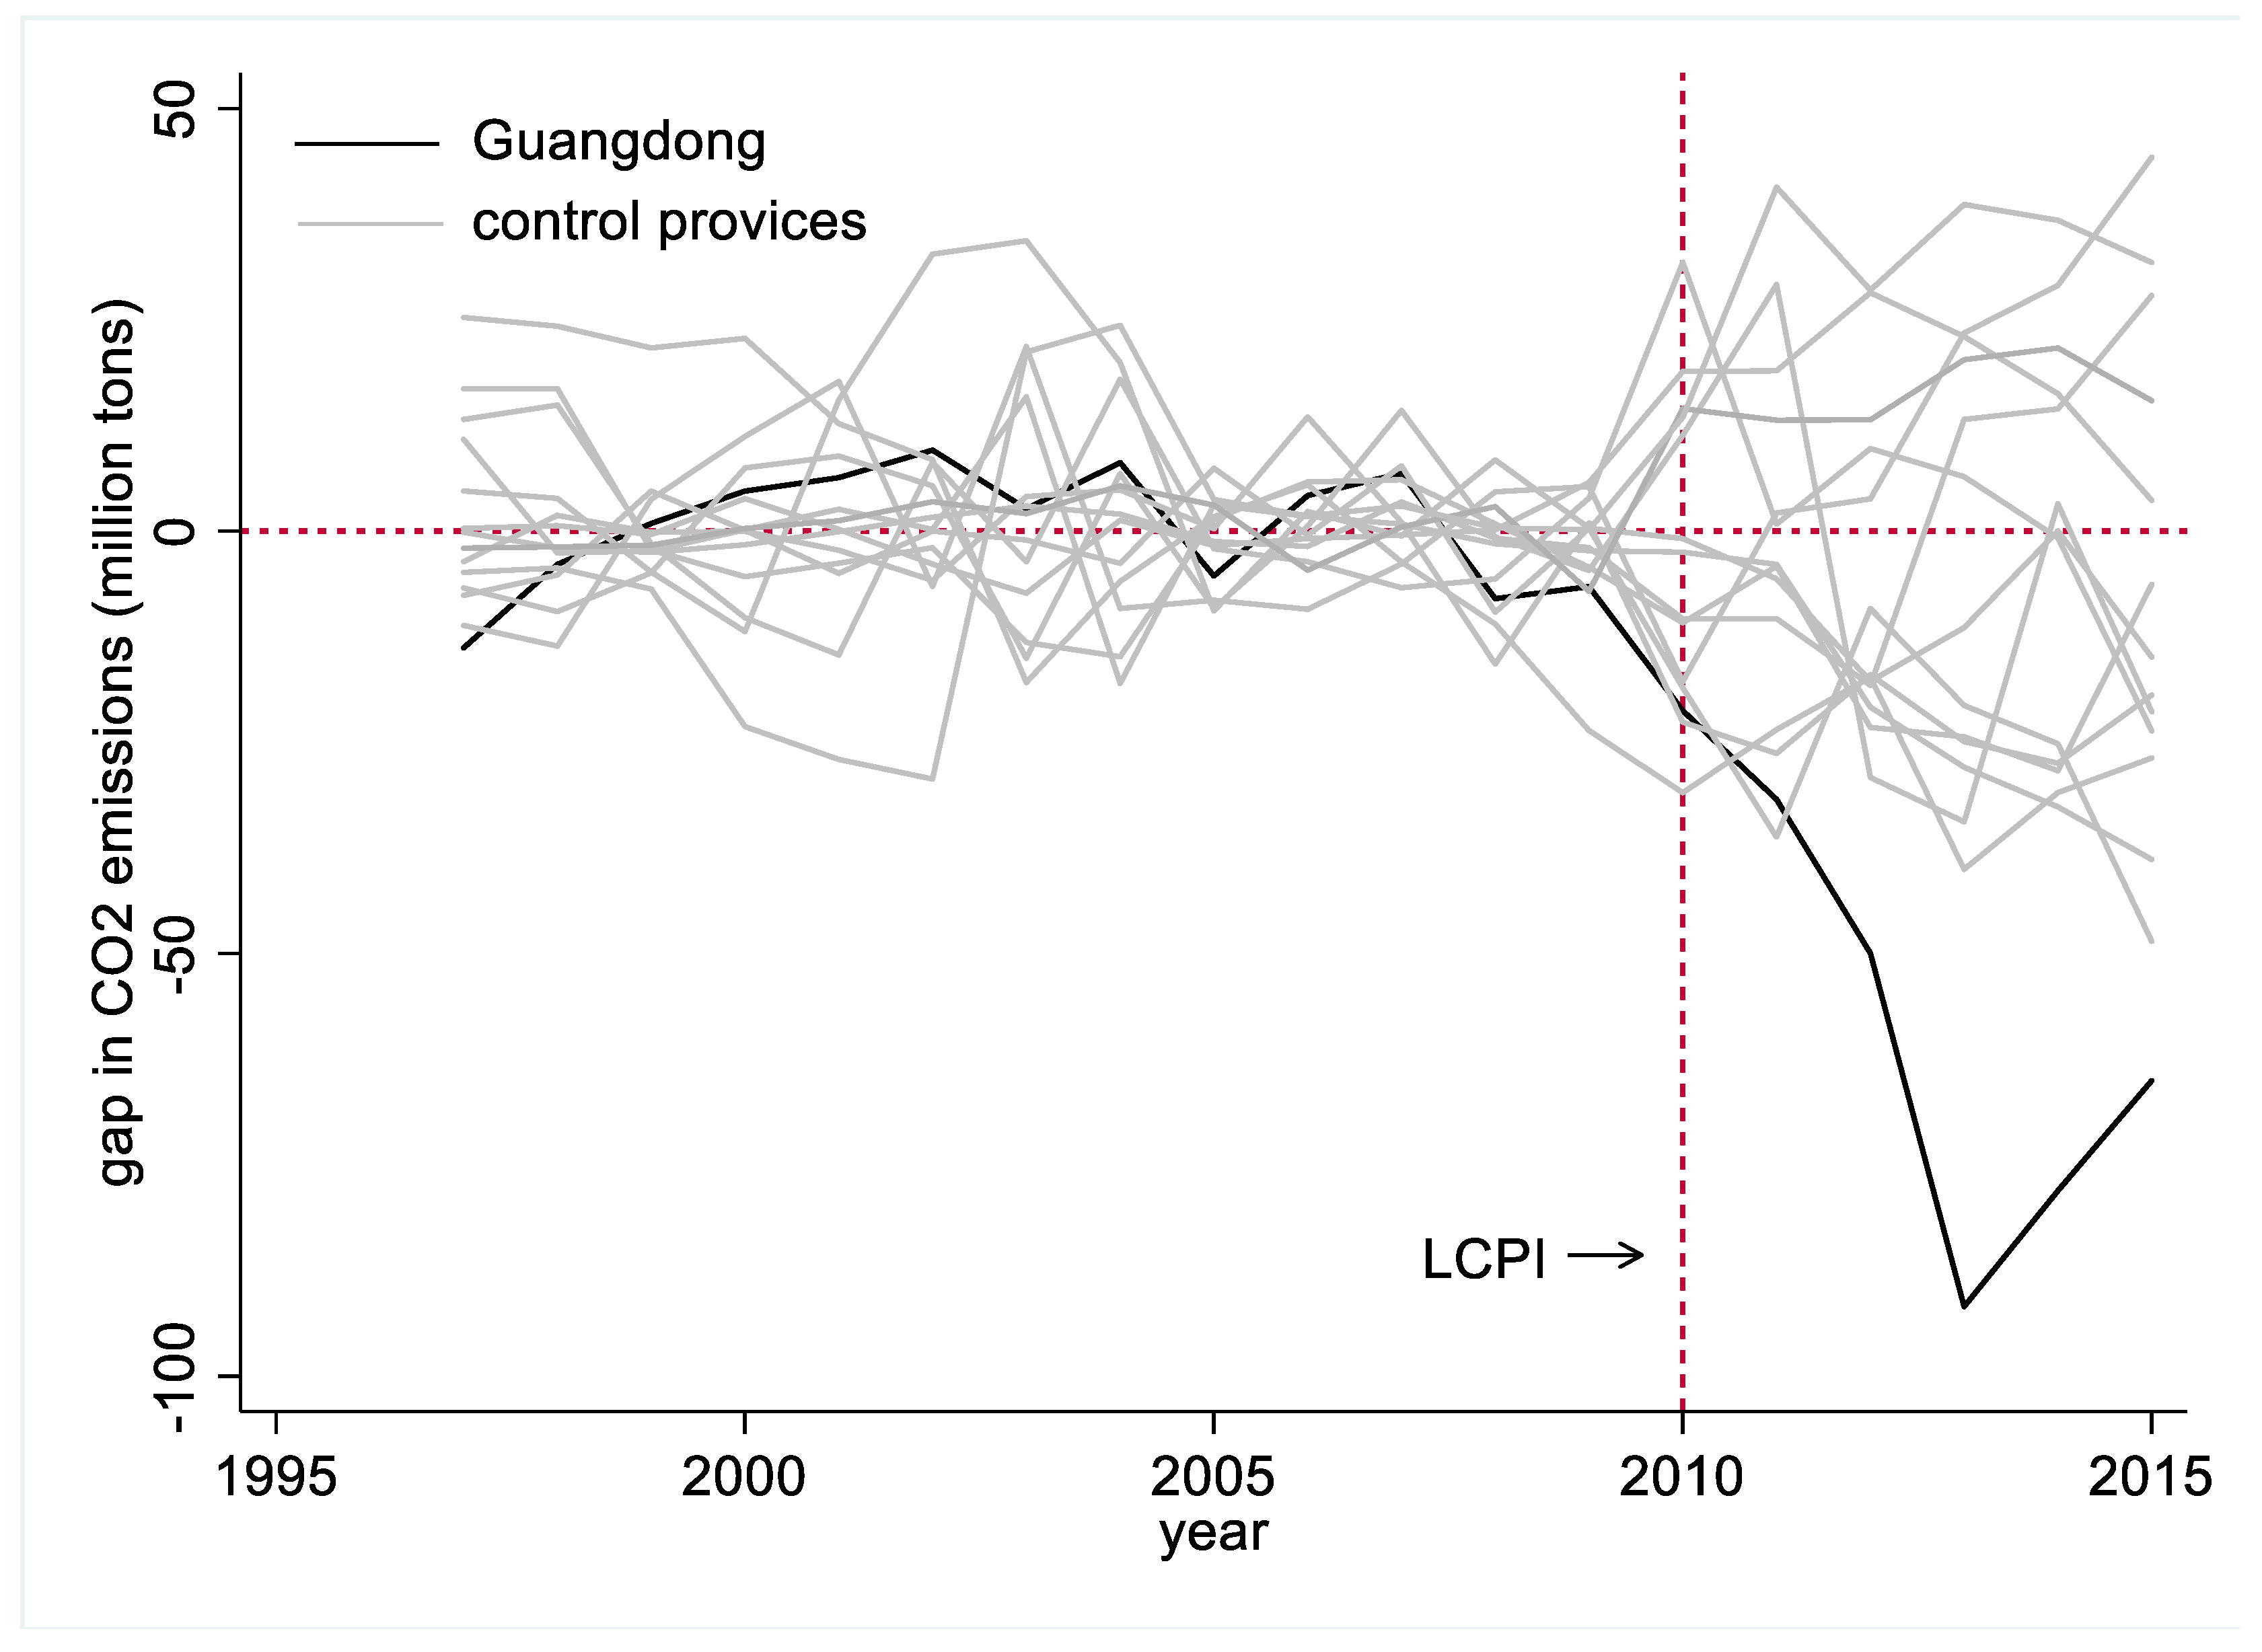
Figure 2b plots the trends in the annual CO2 emissions of Guangdong and the other provinces that are not covered by LCPI. As can be seen in this figure, before the implementation of LCPI, the trends in the annual CO2 emissions of Guangdong and the other provinces were all showing a continuous growth. These trends began to diverge in 2011 when Guangdong’s annual CO2 emissions peaked and began to decline whereas those of the other provinces continued to increase. To evaluate the impact of LCPI on the carbon emissions of Guangdong, the following question needs to be addressed: If the LCPI was not implemented in 2010, how will Guangdong’s carbon emissions evolve? This counterfactual can be estimated by using the synthetic control method.

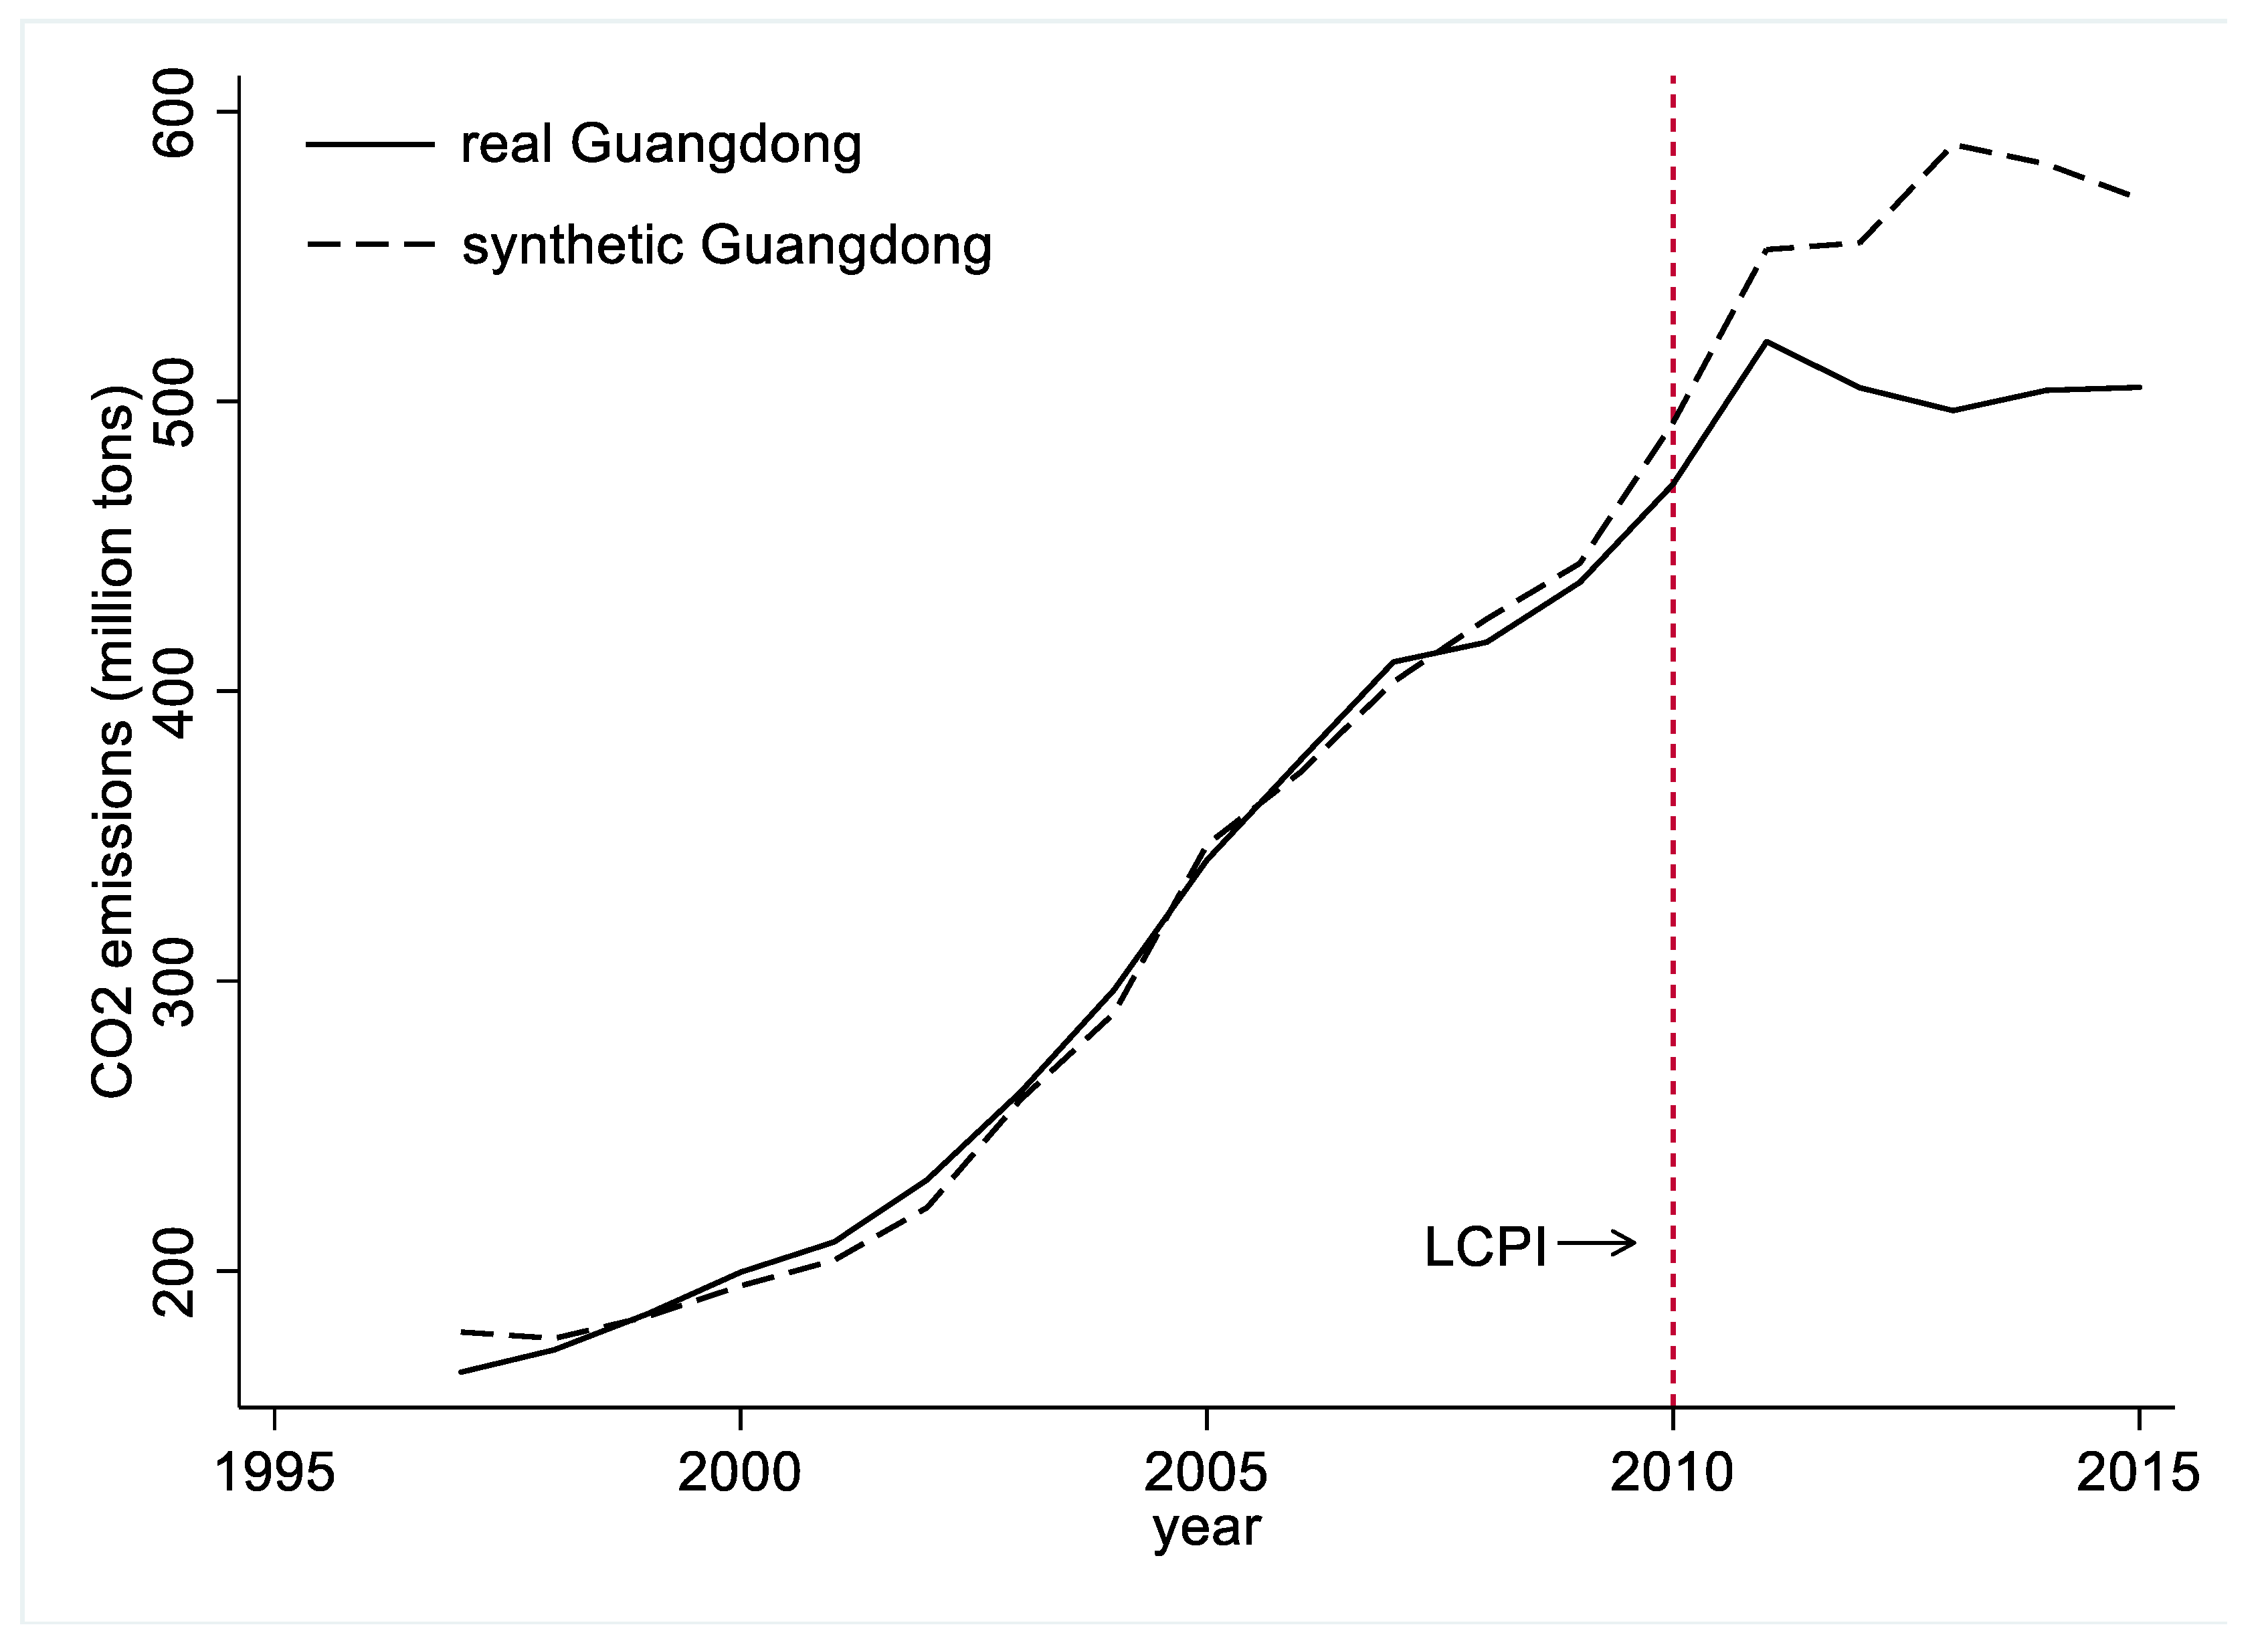
2.3. Synthetic Control Method

The thinking of synthetic control method is to use Guangdong as the treatment group, find the appropriate weight through the predicted variables, and weight the average of the provinces where the LCPI has not been implemented. Then we synthesize a virtual Guangdong that has not implemented the LCPI and use it as a comparison group, and make the characteristics of the predicted variables in synthetic Guangdong and real Guangdong before the LCPI implementation as similar as possible. Finally, the difference of carbon emissions between real Guangdong and synthetic Guangdong after the LCPI implementation can be compared.
Suppose that we observe the carbon emissions of J+1 provinces for T years, and only the first province, that is Guangdong, implemented LCPI, hence the J remaining regions can be the control group. Suppose that T0 is the year of the LCPI implementation, Y i t N is the carbon emissions that could be observed for province i at time t in the absence of the LCPI, and Y i t I is the carbon emissions that could be observed for province i at time t if province i is exposed to the implementation of the LCPI in periods T0+1 to T. Let Y i t be the actual carbon emissions that would be observed for province i at time t. So α i t = Y i t I Y i t N is the effect of the implementation of LCPI for province i at time t, α 1 t = Y 1 t I Y 1 t N is the effect of LCPI on carbon emissions in Guangdong. Because all provinces’ carbon emissions are not affected by LCPI before T0, when t T 0 , Y i t I = Y i t N ; when T 0 < t T , Y i t I = Y i t N + α i t . We introduce the dummy variable D i t . The observed actual carbon emissions for province i at time t is Y i t = Y i t N + D i t α i t , when t T 0 , α 1 t = 0; when t > T 0 , α 1 t = Y 1 t I Y 1 t N = Y 1 t Y 1 t N , Y 1 t is the actual carbon emissions of Guangdong that can be observed after the implementation of the LCPI. We can estimate α 1 t by estimating Y 1 t N . Suppose that:
Y i t N = δ t + θ t Z i + λ t μ i + ε i t
where δ t is an unknown common factor, Z i are observed covariates which not affected by the LCPI, θ t are unknown parameters, λ t are unobserved common factors, μ i are unknown factor loadings, and ε i t are error terms. Suppose that a weights vector W to estimate Y i t N , W = ( w 2 , w 3 , , w J + 1 ) , w j 0 , w 2 + + w J + 1 = 1 . The carbon emissions for each synthetic control indexed by W is
j = 2 J + 1 w j Y j t N = δ t + θ t j = 2 J + 1 w j Z J + λ t j = 2 J + 1 w j μ j + j = 2 J + 1 w j ε j t
Suppose that there are ( w 2 * , , w J + 1 * ) such that
j = 2 J + 1 w j * Y j 1 = Y 11 , j = 2 J + 1 w j * Y j 2 = Y 12 , , j = 2 J + 1 w j * Y j T 0 = Y 1 T 0   and   j = 2 J + 1 w j * Z j = Z 1
If t T 0 λ t λ t is nonsingular, then
Y i t N j = 2 J + 1 w j * Y j t = j = 2 J + 1 w j * s = 1 T 0 λ t ( n = 1 T 0 λ n λ n ) 1 λ s ( ε j s ε 1 s ) j = 2 J + 1 w j * ( ε j s ε 1 s )
Abadie proved that, the mean of the right-hand side of Equation (4) will be close to zero under standard conditions, hence we can use α ^ 1 t = Y 1 t j = 2 J + 1 w j * Y j t for t { T 0 + 1 , , T } as an estimator of α 1 t .

2.4. Variables and Data

The annual CO2 emissions at the provincial level were used as the outcome variable and were collected from CEADs. Following Wang (2010), several variables were used as predictors of carbon emissions, including economic size, economic structure, economic level, population size, energy intensity, length of transport routes, and number of vehicles [30]. The details of these variables are shown in Table 1.
The synthetic control method was used to create a synthetic version of Guangdong that mirrors the values of the predictors of the real Guangdong before the LCPI implementation. Not all the other provinces (excluding Guangdong) were placed in the control group. Firstly, Tibet, Xinjiang, and Taiwan were eliminated from the sample because of missing data. Secondly, Liaoning, Hubei, Yunnan, and Shaanxi were eliminated as they also implemented LCPI in 2010. Thirdly, Hainan was eliminated given that this province was named as a low-carbon pilot province in 2012. Fourthly, Zhejiang was eliminated because LCPI includes not only provinces but also cities. The annual CO2 emissions of Hangzhou, Ningbo, and Wenzhou, which are included amongst China’s low-carbon pilot cities, are more than half of that of Zhejiang Province. Therefore, although not a low-carbon pilot province, Zhejiang is also greatly affected by LCPI.
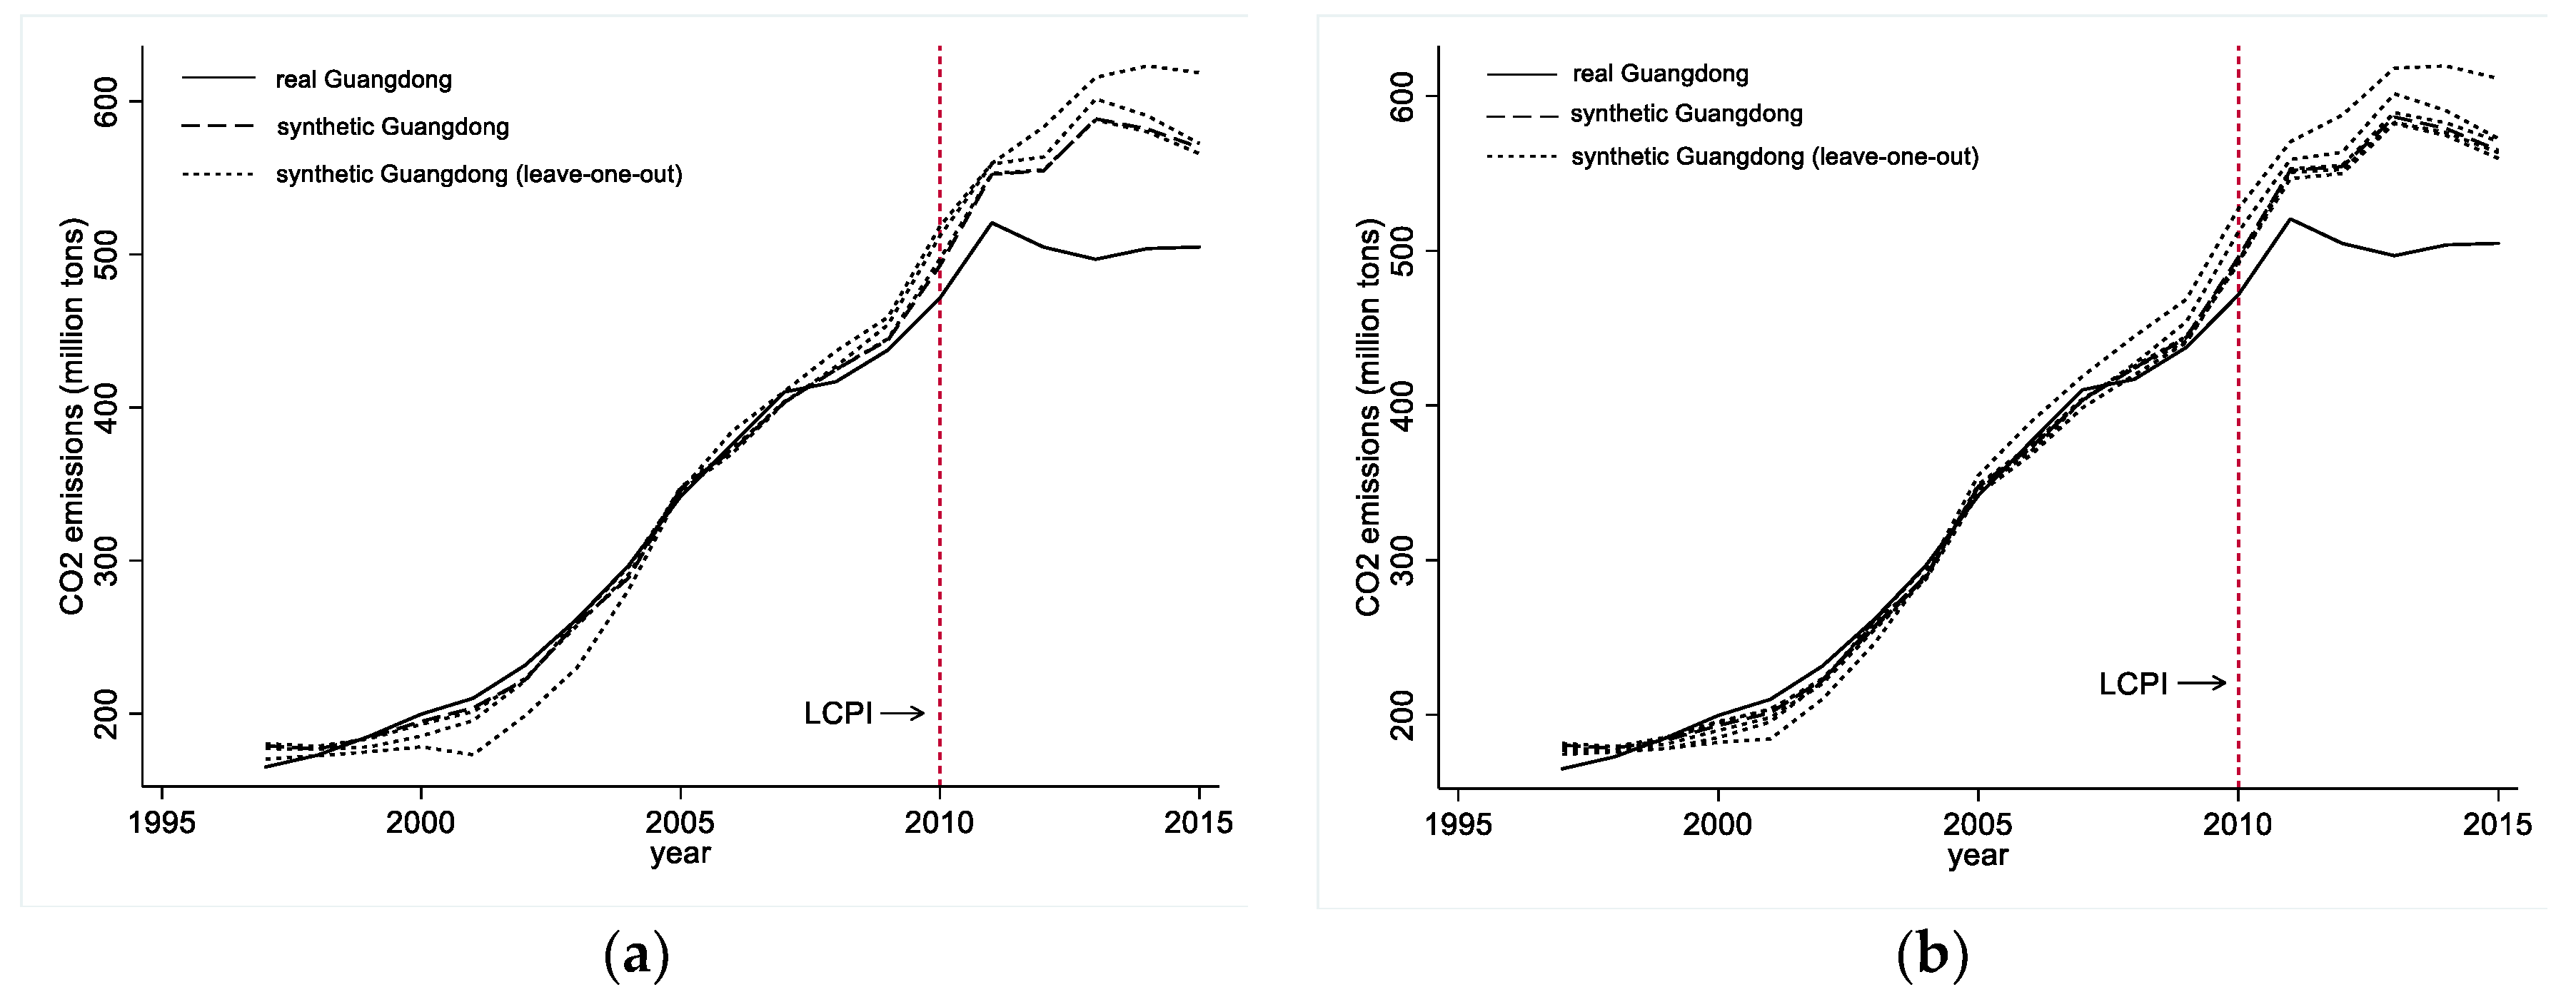
After creating a synthetic Guangdong, the effect of LCPI on carbon emissions was estimated as the difference in the annual CO2 emissions levels of the real and synthetic Guangdong in the years following the implementation of LCPI. Placebo studies and robustness tests were then performed to confirm the accuracy and robustness of the estimations.

3. Results

3.1. Real and Synthetic Guangdong

3.1.1. Total Effect

The Synth package for STATA provided by Abadie was used for the operation. Table 2 shows the weights of each province in the control group for synthesizing a virtual Guangdong. The results in Table 2 reveal that the carbon emissions trends in Guangdong before the implementation of LCPI are best copied by a combination of Hebei, Heilongjiang and Anhui. All other provinces in the control group were assigned zero W-weights.
Table 3 compares the pre-treatment characteristics of real Guangdong with those of synthetic Guangdong as well as the average values of the 18 provinces in the control group. Based on the computed average, the other provinces were deemed unsuitable for the control group. Meanwhile, the carbon emission prediction factors of synthetic Guangdong were very similar to those of real Guangdong.
Figure 4 presents the CO2 emissions of the real and synthetic Guangdong from 1997 to 2015. Synthetic Guangdong tracks the changing trajectory of annual CO2 emissions in real Guangdong very closely for the entire pre-LCPI period, thereby suggesting that synthetic Guangdong provides a sensible approximation of the annual CO2 emissions in real Guangdong between 2010 and 2015 before the implementation of LCPI.
The effect of LCPI on the carbon emissions of Guangdong was estimated as the difference between the annual CO2 emissions of the real and synthetic version after the implementation of the policy. As shown in Figure 4, after the implementation of LCPI, the two lines began to diverge. Whilst the CO2 emissions of synthetic Guangdong continued to grow steadily, those of real Guangdong began to shift after reaching its peak in 2011 and then declined for the first time. This figure suggests that the implementation of LCPI has a negative effect on Guangdong’s carbon emissions. Table 4 shows the yearly gaps in the CO2 emissions of the real and synthetic Guangdong, which can reflect the yearly estimated impacts of LCPI. The gap in the annual CO2 emissions of real and synthetic Guangdong was maintained between 4 mt and 8 mt in the five years before the implementation of LCPI. However, after the implementation of this policy in 2010, this gap instantly expanded to 21.2 mt and increased year by year until reaching its maximum in 2013 (91.8 mt). These trends suggest that LCPI had a significant effect on carbon emissions, with the carbon emissions of Guangdong decreasing by approximately 10% during the entire 2010–2015 period with an average annual reduction of approximately 56 mt.

3.1.2. Effects on Different Sources

Chapter 2 identifies energy production and manufacturing industries as the main sources of carbon emissions in Guangdong and suggests that LCPI mainly focuses on these two aspects. Therefore, what is the effect of LCPI on these two main sources of carbon emissions?
Figure 5 shows the results obtained by the synthetic control method, with Figure 5a showing the impact of LCPI on carbon emissions from energy production and Figure 5b showing the impact of LCPI on carbon emissions from manufacturing industries. These figures suggest that if Guangdong did not implement LCPI in 2010, the development trend of CO2 emissions from energy production in synthetic Guangdong would become similar to those in real Guangdong, that is, the CO2 emissions began to decline after reaching the peak in 2011. However, the role of LCPI in reducing carbon emissions from manufacturing industries in Guangdong is very obvious. After the implementation of this policy, the two lines began to diverge noticeably. Whilst the CO2 emissions from the manufacturing industries of synthetic Guangdong continued to grow steadily, those of real Guangdong began to shift before declining. In this case, LCPI mainly affected the carbon emissions from the manufacturing industries of Guangdong yet had minimal effects on the carbon emissions from energy production.

3.2. Placebo Studies

Placebo studies were performed to verify whether the difference in the carbon emissions of real and synthetic Guangdong is indeed caused by the implementation of LCPI instead of other factors, that is, whether the empirical estimates are statistically significant. In these studies, Guangdong was transferred to the control group and a province from the existing control group was assumed to have implemented LCPI in 2010 instead of Guangdong. The synthetic control method was then employed to construct a synthetic version of the selected province and to estimate the effects of LCPI. All provinces in the control group were iteratively tested, and then the carbon emission differences generated in the placebo studies were compared with those obtained from the empirical analysis. If the differences in carbon emissions from Guangdong in the empirical analysis are much larger than those obtained in the placebo studies, then the difference in carbon emissions between real and synthetic Guangdong is driven by the implementation of LCPI, that is, the results of the empirical analysis are credible.
If the synthetic province has a large RMSPE (root-mean-square prediction error) before the implementation of LCPI, that is, the real carbon emission situation of this province before the LCPI implementation cannot be easily tracked, then the differences in the carbon emissions of the real and synthetic provinces post-LCPI are inferred to be caused by factors other than LCPI. Therefore, these provinces were eliminated in the placebo studies. Following Abadie (2015), those provinces whose pre-LCPI RMSPE was more than three times larger than that of Guangdong were excluded from the placebo studies. These provinces included Hebei, Inner Mongolia, Jiangsu, Shandong, and Qinghai [31].
The results of the placebo studies are presented in Figure 6, where the black line denotes the differences estimated for Guangdong and the grey line denoting the gap in annual CO2 emissions between the provinces in the control group and their respective synthetic versions. The estimated gap in the carbon emissions of Guangdong from 2010 to 2015 was unusually large compared with those of the provinces in the control group. Given that the placebo studies included 14 provinces, the probability of the estimation result was computed as 1/14 = 0.071, which is statistically significant.

3.3. Robustness Test

A robustness test was also performed based on an iterative approach, including the iterations of regions and the iterations of predictors. In the iterations of regions, a version of Guangdong was iteratively reconstructed, and each province that received a positive weight to the synthetic Guangdong, including Hebei (0.630), Heilongjiang (0.255), and Anhui (0.115), was deleted. This test aims to check whether the impact of LCPI on carbon emissions is influenced by weights and whether the results will differ when a province is removed from the control group. In the iterations of predictors, a version of Guangdong was iteratively reconstructed and a predictor was deleted at each iteration. This test aims to check whether the results will differ when a predictor is removed.
Figure 7 presents the trajectory of the annual CO2 emissions of real Guangdong (solid line), synthetic Guangdong (long dashed line) and leave-one-out estimates (short dashed lines). Regardless of which iterative method was employed, the above figure shows that after removing the province with the positive weight from the control group or removing a predictor from the variable group, the CO2 emissions of synthetic Guangdong (leave-one-out) remained much higher than those of real Guangdong, thereby suggesting that the results for the effects of LCPI on reducing the carbon emissions of Guangdong do not vary across the provinces in the control group or the changes in the predictors. In sum, the results of the previous analysis are fairly robust.

4. Discussion

As the world’s top energy consumer and carbon emitter, China’s carbon emissions policies, including LCPI, have important impacts on global climate change. Accurately assessing the effectiveness of these policies has important policy implications for China and the world in their pursuit to address global warming. This article selected Guangdong Province as the study area given that this province has the largest economic scale, population size and carbon emissions amongst China’s low-carbon pilot provinces. The synthetic control method was applied to determine whether the implementation of LCPI reduced the carbon emissions of Guangdong. For the entire 2010–2015 period, the carbon emissions of Guangdong were reduced by approximately 10% as a result of the implementation of LCPI in July 2010. This policy had the greatest impact on the carbon emissions of manufacturing industries but had little impact on carbon emissions from energy production. Meanwhile, the placebo studies and robustness test confirmed that the findings are fairly robust.
This work differs from the previous literature in three ways. Firstly, to make the results closer to objective facts, instead of estimating carbon emissions, more uniform and authoritative carbon emissions data at the provincial level were collected from CEADs. Data-driven procedures instead of subjective selection were also employed to construct suitable comparison groups based on the synthetic control method. Secondly, the impact of low-carbon pilots on carbon emissions from different sources in Guangdong, including energy production and manufacturing industries, was analyzed. Thirdly, the findings of this work reveal that the impact of LCPI on China’s regional carbon emissions does not increase every year. The impact of this policy on Guangdong’s carbon emissions reached its maximum in 2013, after which Guangdong’s carbon emissions began to rise and the impact of low-carbon pilots began to decline.
These results also offer several policy implications. Firstly, policy support and low-carbon action are necessary for reducing regional carbon emissions. Given that carbon is mainly produced via the consumption of fossil energy, a low-carbon development model characterized by low energy consumption, low pollution and low emissions must be developed to fundamentally solve the problem of global warming. The transformation of this model is inseparable from the power of the government, especially for China, which has a high concentration of administrative power.
Secondly, low-carbon policies must be constantly adjusted during their implementation. These policies must not be static and must keep pace with the times. The government must adjust the content of its low-carbon policies based on feedback in order to continuously optimize such policies and ensure their contributions to reducing regional carbon emissions.
Thirdly, the successful low-carbon action experiences in low-carbon pilot areas are worth learning and promoting in other regions. The significance of LCPI lies not only in its goal to achieve a quantitative emission reduction but also in its exploration of low-carbon development models through pilots, its search for effective and sustainable emission reduction methods and the accumulation of relevant experiences that can be popularized on a larger scale. Since the implementation of LCPI, the low-carbon pilot areas have accumulated many useful experiences in low-carbon development through practice. For example, Guangdong explored a low-carbon development model with low-carbon industry and low-carbon technologies as the core, low-carbon energy as the support and low-carbon energy, low-carbon transportation, low-carbon buildings and low-carbon lifestyle as the base. A series of auxiliary systems, including a total carbon emission control system, inclusive low-carbon system and carbon emissions trading system, was also implemented in the province to reduce its carbon emissions. Guangdong also launched the ‘nine plus two’ carbon cooperation mechanism in the Pan-Pearl River Delta region to transform itself into the first low-carbon pilot province in China. These practices can greatly help the other regions of China in establishing a low-carbon economy.
Social scientists are always looking for ways to accurately evaluate the effectiveness of policies. This paper uses a quantitative analysis model, namely, the synthetic control method, to evaluate the impact of low-carbon pilot initiatives on regional carbon emissions as well as builds its comparison groups through data drivers instead of subjective selection to enhance the objectivity and accuracy of the estimations. However, the synthetic control method has several limitations. For instance, when constructing a synthetic object, all objects in the control group must have a positive weight and sum of 1. Therefore, the restrictions on weights must be relaxed and negative weights must be incorporated in future attempts to improve such method. In addition, LCPI has been implemented for nearly nine years, and future studies may present a summarization of experiences and popularize such policy to achieve a comprehensive low-carbon development.

Author Contributions

Conceptualization, X.Y. and M.S.; data collection, X.Y. and D.W.; analyzed data, X.Y. and D.W.; writing—review and editing, X.Y., D.W. and B.T.I.

Funding

This research was funded by the National Social Science Fund of China, grant number (No. 16ZDA050), the National Natural Science Foundation of China (No. 71874092).

Conflicts of Interest

The authors declare no conflict of interest.

References

  1. Anthes, R.A.; Corell, R.W.; Holland, G.; Hurrell, J.W.; MacCracken, M.C.; Trenberth, K.E. Hurricanes and global warming—Potential linkages and consequences. Bull. Am. Meteorol. Soc. 2006, 87, 623–628. [Google Scholar] [CrossRef]
  2. Hughes, T.P.; Kerry, J.T.; Baird, A.H.; Connolly, S.R.; Dietzel, A.; Eakin, C.M.; Heron, S.F.; Hoey, A.S.; Hoogenboom, M.O.; Liu, G.; et al. Global warming transforms coral reef assemblages. Nature 2018, 556, 492. [Google Scholar] [CrossRef] [PubMed]
  3. Raper, S.C.B.; Braithwaite, R.J. Low sea level rise projections from mountain glaciers and icecaps under global warming. Nature 2006, 439, 311–313. [Google Scholar] [CrossRef] [PubMed]
  4. Li, Y.; Xie, Z.; Qin, Y.; Xia, H.; Zheng, Z.; Zhang, L.; Pan, Z.; Liu, Z. Drought Under Global Warming and Climate Change: An Empirical Study of the Loess Plateau. Sustainability 2019, 11, 1281. [Google Scholar] [CrossRef]
  5. Matthews, H.D.; Gillett, N.P.; Stott, P.A.; Zickfeld, K. The proportionality of global warming to cumulative carbon emissions. Nature 2009, 459, 829. [Google Scholar] [CrossRef] [PubMed]
  6. Allen, M.R.; Frame, D.J.; Huntingford, C.; Jones, C.D.; Lowe, J.A.; Meinshausen, M.; Meinshausen, N. Warming caused by cumulative carbon emissions towards the trillionth tonne. Nature 2009, 458, 1163–1166. [Google Scholar] [CrossRef] [PubMed]
  7. Lashof, D.A.; Ahuja, D.R. Relative contributions of greenhouse gas emissions to global warming. Nature 1990, 344, 529–531. [Google Scholar] [CrossRef]
  8. Knight, K.W.; Schor, J.B. Economic Growth and Climate Change: A Cross-National Analysis of Territorial and Consumption-Based Carbon Emissions in High-Income Countries. Sustainability 2014, 6, 3722–3731. [Google Scholar] [CrossRef] [Green Version]
  9. Hamers, L. Global Carbon Dioxide Emissions Will Hit a Record High in 2018. Available online: https://www.sciencenews.org/article/global-carbon-dioxide-emissions-will-hit-record-high-2018 (accessed on 5 March 2019).
  10. Le Quéré, C.; Andrew, R.M.; Friedlingstein, P.; Sitch, S.; Hauck, J.; Pongratz, J.; Pickers, P.A.; Korsbakken, J.I.; Peters, G.P.; Canadell, J.G.; et al. Global Carbon Budget 2018. Earth Syst. Sci. Data 2018, 10, 2141–2194. [Google Scholar] [Green Version]
  11. Shan, Y.L.; Guan, D.B.; Zheng, H.R.; Ou, J.M.; Li, Y.; Meng, J.; Mi, Z.F.; Liu, Z.; Zhang, Q. Data Descriptor: China CO2 emission accounts 1997–2015. Sci. Data 2018, 5, 170201. [Google Scholar] [CrossRef]
  12. NBS. China Statistical Yearbook; China Statistics Press: Beijing, China, 2018.
  13. Fankhauser, S.; Kennedy, D.; Skea, J. Building a low-carbon economy: The inaugural report of the UK Committee on Climate Change. Glob. Environ. Chang. Part B Environ. Hazards 2009, 8, 201–208. [Google Scholar] [CrossRef]
  14. Chen, W.Y.; Yin, X.; Zhang, H.J. Towards low carbon development in China: A comparison of national and global models. Clim. Chang. 2016, 136, 95–108. [Google Scholar] [CrossRef]
  15. Winkler, H.; Marquand, A. Changing development paths: From an energy-intensive to low-carbon economy in South Africa. Clim. Dev. 2009, 1, 47–65. [Google Scholar] [CrossRef]
  16. Schwanen, T. The Bumpy Road toward Low-Energy Urban Mobility: Case Studies from Two UK Cities. Sustainability 2015, 7, 7086–7111. [Google Scholar] [CrossRef] [Green Version]
  17. NDRC. Notice on ISSUANCE Medium and Long-Term Special Plan for Energy Conservation. Available online: http://www.ndrc.gov.cn/fzgggz/hjbh/jnjs/200507/t20050711_45823.html (accessed on 18 February 2019).
  18. State Council of China. Notice on the Issuance of China’s National Climate Change Program. Available online: http://www.gov.cn/gongbao/content/2007/content_678918.htm (accessed on 25 December 2018).
  19. State Council of China. China’s Policies and Actions for Addressing Climate Change. Available online: http://www.ccchina.gov.cn/WebSite/CCChina/UpFile/File419.pdf (accessed on 25 December 2018).
  20. State Council of China. China to Cut 40 to 45% GDP Unit Carbon by 2020. Available online: http://www.chinadaily.com.cn/china/2009-11/26/content_9058731.htm (accessed on 25 December 2018).
  21. National People’s Congress. The Twelfth Five-Year Plan on National Economy and Social Development. Available online: http://news.sina.com.cn/c/2011-03-17/055622129864.shtml (accessed on 10 November 2018).
  22. Chu, G.D.; Gao, Z.Y. Empirical analysis of the effect of in low-carbon-city pilots. Co-Oper. Econ. Sci. 2017, 20, 4–7. [Google Scholar]
  23. Deng, L.L.; Zhan, J. Does two low carbon pilot policy promote the performance of carbon emissions reduction in pilot cities—Based on difference in difference method. Syst. Eng. 2017, 35, 68–73. [Google Scholar]
  24. Dai, R.; Chao, J.H. The effect of China’s first low-carbon pilot: DID estimation of five cities and eight provinces. Sci. Technol. Manag. Res. 2015, 35, 56–61. [Google Scholar]
  25. Lu, X.W. Study on the effectiveness of the low carbon policy: Evidence from the synthetic control methods. Soft Sci. 2017, 31, 98–101, 109. [Google Scholar]
  26. Zhao, S.; Chen, R.; Jiang, Z.D. Empirical analysis of the low-carbon pilot policies’ impact on agricultural carbon emissions based on DID model. Ecol. Econ. 2018, 34, 22–28. [Google Scholar]
  27. Shan, Y.L.; Liu, J.H.; Liu, Z.; Xu, X.W.H.; Shao, S.; Wang, P.; Guan, D.B. New provincial CO2 emission inventories in China based on apparent energy consumption data and updated emission factors. Appl. Energy 2016, 184, 742–750. [Google Scholar] [CrossRef]
  28. Abadie, A.; Diamond, A.; Hainmueller, J. Synthetic Control Methods for Comparative Case Studies: Estimating the Effect of California’s Tobacco Control Program. J. Am. Stat. Assoc. 2010, 105, 493–505. [Google Scholar] [CrossRef]
  29. Lo, K.; Li, H.; Chen, K. Climate experimentation and the limits of top-down control: Local variation of climate pilots in China. J. Environ. Plan. Manag. 2019, 1–18. [Google Scholar] [CrossRef]
  30. Wang, F.; Wu, L.H.; Yang, C. Driving factors for growth of carbon dioxide emissions during economic development in China. Econ. Res. J. 2010, 45, 123–136. [Google Scholar]
  31. Abadie, A.; Diamond, A.; Hainmueller, J. Comparative Politics and the Synthetic Control Method. Am J. Polit. Sci. 2015, 59, 495–510. [Google Scholar] [CrossRef]
Figure 1. Location of Guangdong Province and its cities.
Sustainability 11 03979 g001
Figure 2. Comparison of annual CO2 emissions between Guangdong and other provinces. (a) Comparison of annual CO2 emissions between Guangdong and the rest of low-carbon pilot provinces, and (b) comparison of annual CO2 emissions between Guangdong and non-low-carbon pilot provinces.
Sustainability 11 03979 g002
Figure 3. Source of carbon emissions in Guangdong Province.
Sustainability 11 03979 g003
Figure 4. Trends in annual CO2 emissions: Real vs. synthetic Guangdong.
Sustainability 11 03979 g004
Figure 5. Trends in annual CO2 emissions from different sources: Real vs. synthetic Guangdong. (a) Annual CO2 emissions from energy production, and (b) annual CO2 emissions from manufacturing industries.
Sustainability 11 03979 g005
Figure 6. Annual CO2 emissions gaps in Guangdong and placebo gaps in the 19 control provinces (excluding those provinces with a pre-low-carbon pilot initiative (LCPI) RMSPE that is three times larger than that of Guangdong).
Sustainability 11 03979 g006
Figure 7. Leave-one-out distribution of the synthetic control for Guangdong. (a) Results based on the iterations of regions, and (b) results based on the iterations of predictors.
Sustainability 11 03979 g007
Table 1. Predictors of carbon emissions.
PredictorIndexAbbreviationData Source
Economic sizeGDPGDPChina Statistical Yearbook
Economic structureSecondary industry output/GDPESChina Statistical Yearbook
Economic levelPer capita GDPPGDPChina Statistical Yearbook
Population sizeTotal populationPOPChina Statistical Yearbook
Energy intensityEnergy consumptionECChina Energy Statistics Yearbook
Length of transport routesTotal mileage of roads and railwaysTDChina Transportation Yearbook
Number of vehiclesNumber of civil carsVNChina Transportation Yearbook
Table 2. Province weights in synthetic Guangdong.
ProvinceWeightProvinceWeight
Hebei0.630Shandong0
Shanxi0Henan0
Inner Mongolia0Hunan0
Jilin0Guangxi0
Heilongjiang0.255Sichuan0
Jiangsu0Guizhou0
Anhui0.115Gansu0
Fujian0Qinghai0
Jiangxi0Ningxia0
Table 3. Mean values of carbon emission predictors.
VariablesReal GuangdongSynthetic GuangdongAverage of 18 Control Provinces
LnGDP9.7079.7708.153
ES51.1451.0146.87
LnPGDP9.8539.3059.125
LnPOP9.0738.6818.235
LnEC9.5239.3568.687
LnTD11.73711.38611.109
LnVN14.81614.02813.281
CE-2000199.6193.1105.3
CE-2005341.8347.7205.9
CE-2009437.6444.0283.7
Table 4. Annual CO2 emissions between 2005 and 2015: Real vs. synthetic Guangdong (mt).
YearReal GuangdongSynthetic GuangdongGap
2005341.8347.1−5.3
2006376.2372.04.2
2007410.1403.36.8
2008416.9424.9–8.0
2009437.6444.2−6.6
2010471.5492.7−21.2
2011520.6552.4−31.8
2012504.7554.7−50
2013496.8588.6−91.8
2014503.8581.9−78.1
2015504.8569.9−65

