Article

Contextualization of Archaeological Information Using Augmented Photospheres, Viewed with Head-Mounted Displays

1
ARTEHIS, UMR 6298 CNRS, Université de Bourgogne Franche-Comté, 21000 Dijon, France
2
Biogéosciences, UMR CNRS EPHE 6282, Université Bourgogne Franche-Comté, 21000 Dijon, France
3
EPHE, PSL University, 75014 Paris, France
4
Musée d’Anthropologie Préhistorique de Monaco, MC 98000, Monaco
5
Archéologies Sciences de l’Antiquité, UMR 7041 CNRS Université de Paris 1, 92023 Nanterre, France
6
Department of Archaeology, University of Hradec Králové, 50003 Hradec Králové, Czech Republic
7
Khakassian Research Institute of Language, Literature and History, 655017 Abakan, Russia
8
UFR SVTE, Université de Bourgogne Franche-Comté, 21000 Dijon, France
*
Author to whom correspondence should be addressed.
Sustainability 2019, 11(14), 3894; https://doi.org/10.3390/su11143894
Submission received: 19 May 2019 / Revised: 25 June 2019 / Accepted: 8 July 2019 / Published: 17 July 2019
(This article belongs to the Special Issue Computational Approaches to the Sustainability of Cultural Heritage)

Abstract

:
Photospheres, or 360° photos, offer valuable opportunities for perceiving space, especially when viewed through head-mounted displays designed for virtual reality. Here, we propose to take advantage of this potential for archaeology and cultural heritage, and to extend it by augmenting the images with existing documentation, such as 2D maps or 3D models, resulting from research studies. Photospheres are generally produced in the form of distorted equirectangular projections, neither georeferenced nor oriented, so that any registration of external documentation is far from straightforward. The present paper seeks to fill this gap by providing simple practical solutions, based on rigid and non-rigid transformations. Immersive virtual environments augmented by research materials can be very useful to contextualize archaeological discoveries, and to test research hypotheses, especially when the team is back at the laboratory. Colleagues and the general public can also be transported to the site, almost physically, generating an authentic sense of presence, which greatly facilitates the contextualization of the archaeological information gathered. This is especially true with head-mounted displays, but the resulting images can also be inspected using applications designed for the web, or viewers for smartphones, tablets and computers.

1. Introduction

In archaeology, as well as in other scientific fields where information derived from the environment is of primary importance, the physical presence of researchers at the site under investigation is often beneficial for the quality of interpretations. Knowledge of the environmental context (e.g., topography, vegetation cover, presence of anthropogenic structures, geomorphological or geological peculiarities, etc.) beyond the zone studied generally contributes to better understanding of the processes and potential interactions that have presided over the development of the site. Archaeologists therefore seek to describe context, far beyond the restricted geographical extent of excavated areas. Despite these attempts, without physical presence at the site, it is often difficult to apprehend space (by fixing references, and estimating scales, distances, and volumes), since spatial perception is closely related to personal sensory experience [1]. For example, Henri Poincaré stated that locating an object in space is simply figuring out the physical movements that would be necessary to reach it [2]. Even the best photographs, which incorporate scale, can only convey some of the relationships that exist between objects and/or structures, because perceived distances and angles cannot be fully described by a single perspective [3]. The field of view covered by photographs is limited by the focal length of the lens, and the world is generally rendered at eye level (i.e. from one to two meters above the ground). Geographical information systems (GIS) are efficient for the manipulation and analysis of spatial information layers [4], but generally fail when attempting to render any physical sensation of space. Innovative solutions can nowadays be found in the field of virtual reality (VR). The concept of virtual archaeology was first proposed by Paul Reilly in 1990 [5], when he originally referred to the use of three-dimensional models of buildings and artefacts for documentation purposes. The considerable advancements in the field of computer graphics during the past few decades have led to the development of virtual tours staging archaeological information in virtual worlds. These tours are often based on web viewers, where 360° photos (also known as spherical panoramas or photospheres) are used for navigation, while trigger buttons provide access to specific archaeological information in 2D (plans, etc.) or 3D form [6,7,8,9,10]. Three-dimensional models may also be rendered in interactive virtual 3D scenes, enhancing the feeling of presence [11], or for research purposes, such as testing hypotheses [12]. The interest of such virtual tours, integrating informational modeling, is obvious for heritage preservation [13]. Virtual environments can thus be created, providing documentation, interpretation, and information about the conservation state of the archaeological remains [6]. Interestingly, virtual tours also convey valuable information for education [14,15]. As suggested by Barcelo [16], scientific visualization should no longer be restricted to “presentation” techniques, but should also include explanatory tools. Incorporating archaeological documentation directly into the 360° scene (and separately as often the case) is expected to reinforce the feeling of immersion, more particularly when tours are experienced via wide field-of-view, immersive, head-mounted displays (HMDs) [17,18]. Such devices provide a better sense of scale and depth than any printed document or image displayed with standard monitors and projectors [19], even though absolute egocentric distances may be slightly underestimated by HMDs, compared to the real world [1]. Given an interpupillary distance of about 6 cm, we are not able to apprehend a 3D scene solely by stereoscopic vision for objects further away than 10–20 m [20]. To estimate depth and scale, our brain therefore uses the presence of familiar objects, assumed to be of normal size, interprets the possible overlay of object contours, and the distribution of highlights and shadows, and analyzes linear perspectives [21]. Therefore, a full 3D rendering (i.e., the production of two different, shifted images, one for each eye) is not always necessary, and simple 2D photospheres may suffice to apprehend space. The ability to augment, on demand, 2D representation as a photosphere of an archaeological site with pertinent information (e.g., maps, 3D models, virtual reconstruction, etc.) would be advantageous for research purposes, for disseminating discoveries to a broader audience, and even to promote tourism. For scenes modelled entirely in 3D, registering any additional 3D models is relatively easy, using specialized game engines, such as Unity, Blender, or others [22,23], because 3D coordinates on which new documents must be attached are available. After registration, the scene can then be rendered using a virtual 360° camera. Projecting the same documents on 2D photospheres may be much more problematic. Photospheres acquired from the air or from the ground are neither georeferenced nor oriented, nor do they contain information about depth. Equirectangular projection also suffers from polar deformation (e.g., North and South Poles are stretched over the entire width of the image, at the top and bottom edges, respectively). Accurate registration of objects close to polar regions may be far from straightforward, as these regions appear highly distorted. Some authors therefore simply place the 3D model inside a rendered virtual scene, and then manually translate, rotate, and scale-up, to reach the appropriate alignment [24]. When integrating 2D documents produced by orthoprojection, severe visual mismatches with the photosphere may occur due to parallax issues. In such cases, there is no chance that good results will be achieved manually, even after many attempts. To the best of our knowledge, there is no simple procedure available nowadays for accurate registration of 2D or 3D archaeological information on equirectangular projections, whether in game engines, or in packages or libraries of the main programming languages. The aim of this study is therefore to propose practical workflows to overcome these drawbacks, with data from the archaeological sites of Loropéni (Burkina Faso) and Tsatsiin Ereg (Mongolia).

2. Materials and Methods

2.1. Study Sites

The photospheres and archaeological information presented here were acquired from two archaeological sites. The first is the Loropéni ruins, in Burkina Faso, probably dating from the fifteenth century [25], and listed as a World Heritage site by UNESCO since 2009 [26,27]. This imposing enclosure, with laterite stone walls up to 6 m high, built to protect buildings, courtyards, and alleys, covers about 1 ha, and is surrounded by wooded savanna. The second site, at Tsatsiin Ereg, Mongolia, is composed of large burial structures, with decorated stelae belonging to the Khereksuur and Deer Stone cultures [28]. These stelae were raised at the end of the second to early first millennium BC. Standing about 0.5–5 m tall, these megaliths were hand-carved with graceful symbols, including stylized deer [29].

2.2. Photosphere Assembly

The ground-based spherical panoramas were acquired using a Roundabout-NP Deluxe II 5R panoramic tripod head (Roundabout-NP, Rosenheim, Deutschland), to which was attached a DSLR Nikon D800 (Nikon Corporation, Tokyo, Japan), equipped with a NIKKOR 24 mm prime lens (Nikkor, Tokyo, Japan); see Supplementary Materials, Text S1 for more details about principles of equirectangular projection. The use of a panoramic head allows the nodal point of the lens to be maintained on the rotation axis, avoiding stitching failure, in particular for the nearest objects. Two sets of 12 pictures, using a horizontal rotation of 30° between pictures, were taken at +30° and −30° from the horizontal plane. Two additional pictures were acquired, one for nadir and one for zenith. For aerial views, a Phantom 3 PRO from DJI was used, in combination with the Litchi application for Android. This combination allows the seamless automatic acquisition of a set of pictures, covering slightly more than the entire southern hemisphere. Three rows of 13 pictures with different inclinations were necessary for appropriate coverage and overlapping. The images were stitched together with Autopano Giga Pro 4, Kolor/Gopro (Kolor, Francin, France), a software program also used to produce the final equirectangular images, limited here to 6000 × 3000 pixels. The northern hemisphere, depicting the sky, which cannot be captured by drone, contained no archaeological information. It was therefore manually completed for natural rendering. For ground acquisition, the tripod visible at the nadir was simply patched with a logo.

2.3. Programming

The code snippets allowing the registration of archaeological information were written, for images, in Python 3.6, with the help of the opencv, numpy, png, and matplotlib libraries, and a set of functions written for the CellTool software [30]. For 3D models, the script used the R language [31] in combination with the Morpho, mesheR, rgl, Rvcg, and png packages. Codes are provided as Supplementary Materials (Codes S1 and S2).

3. Method Implementation

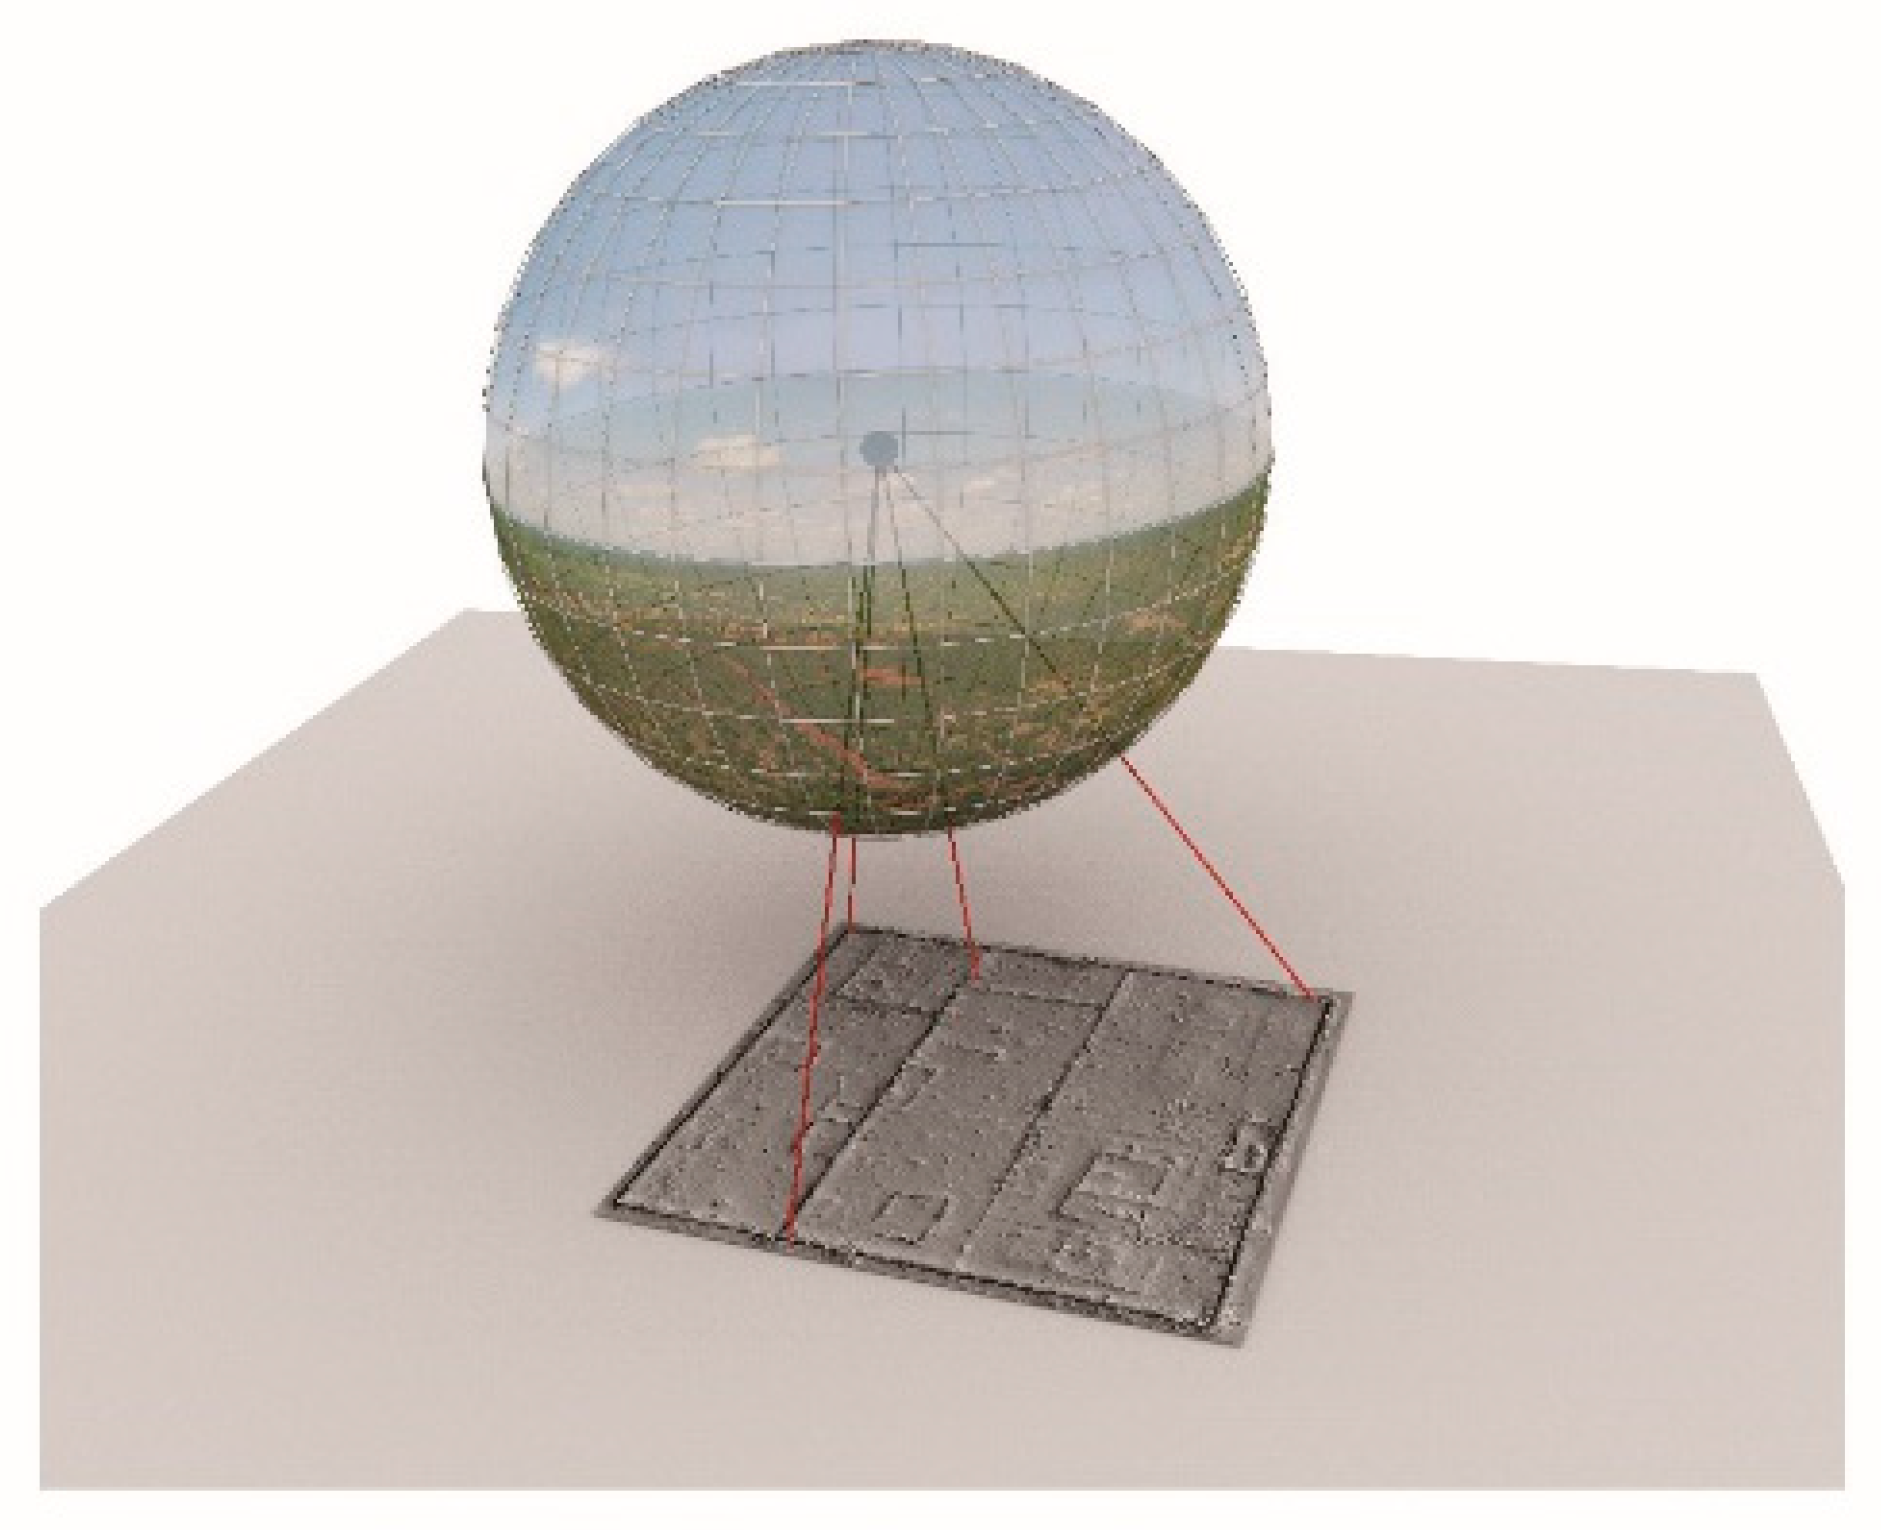
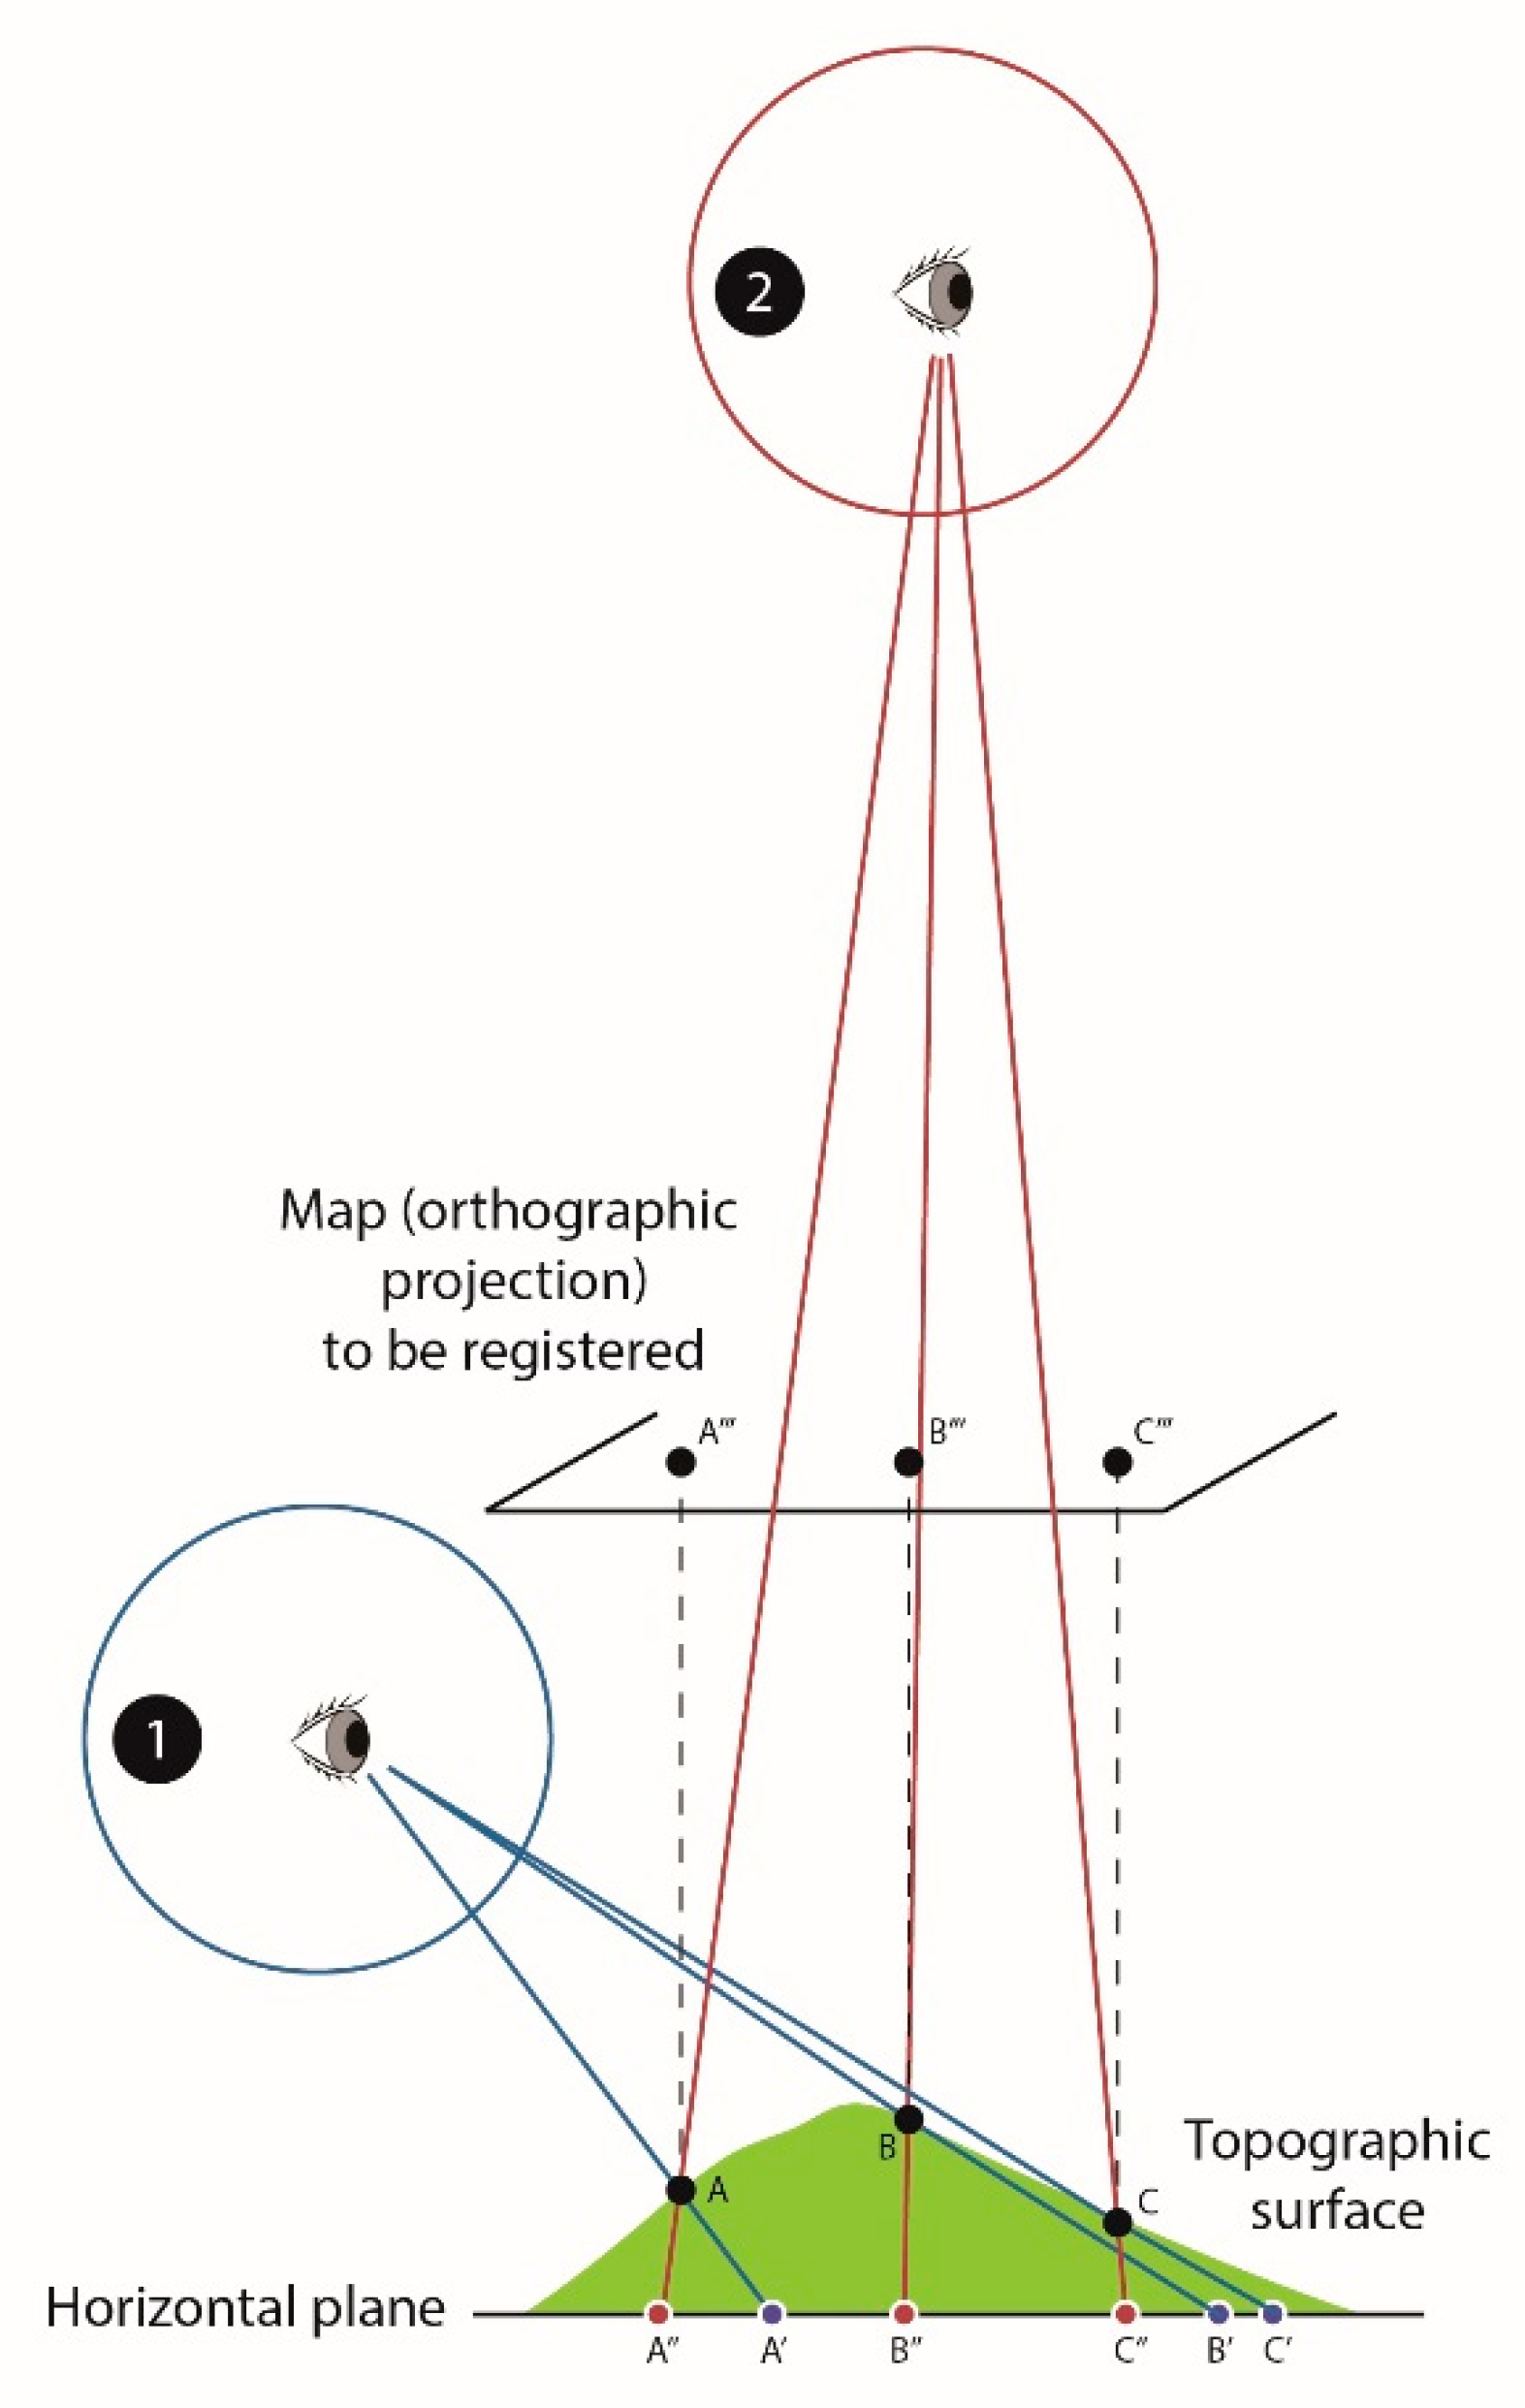
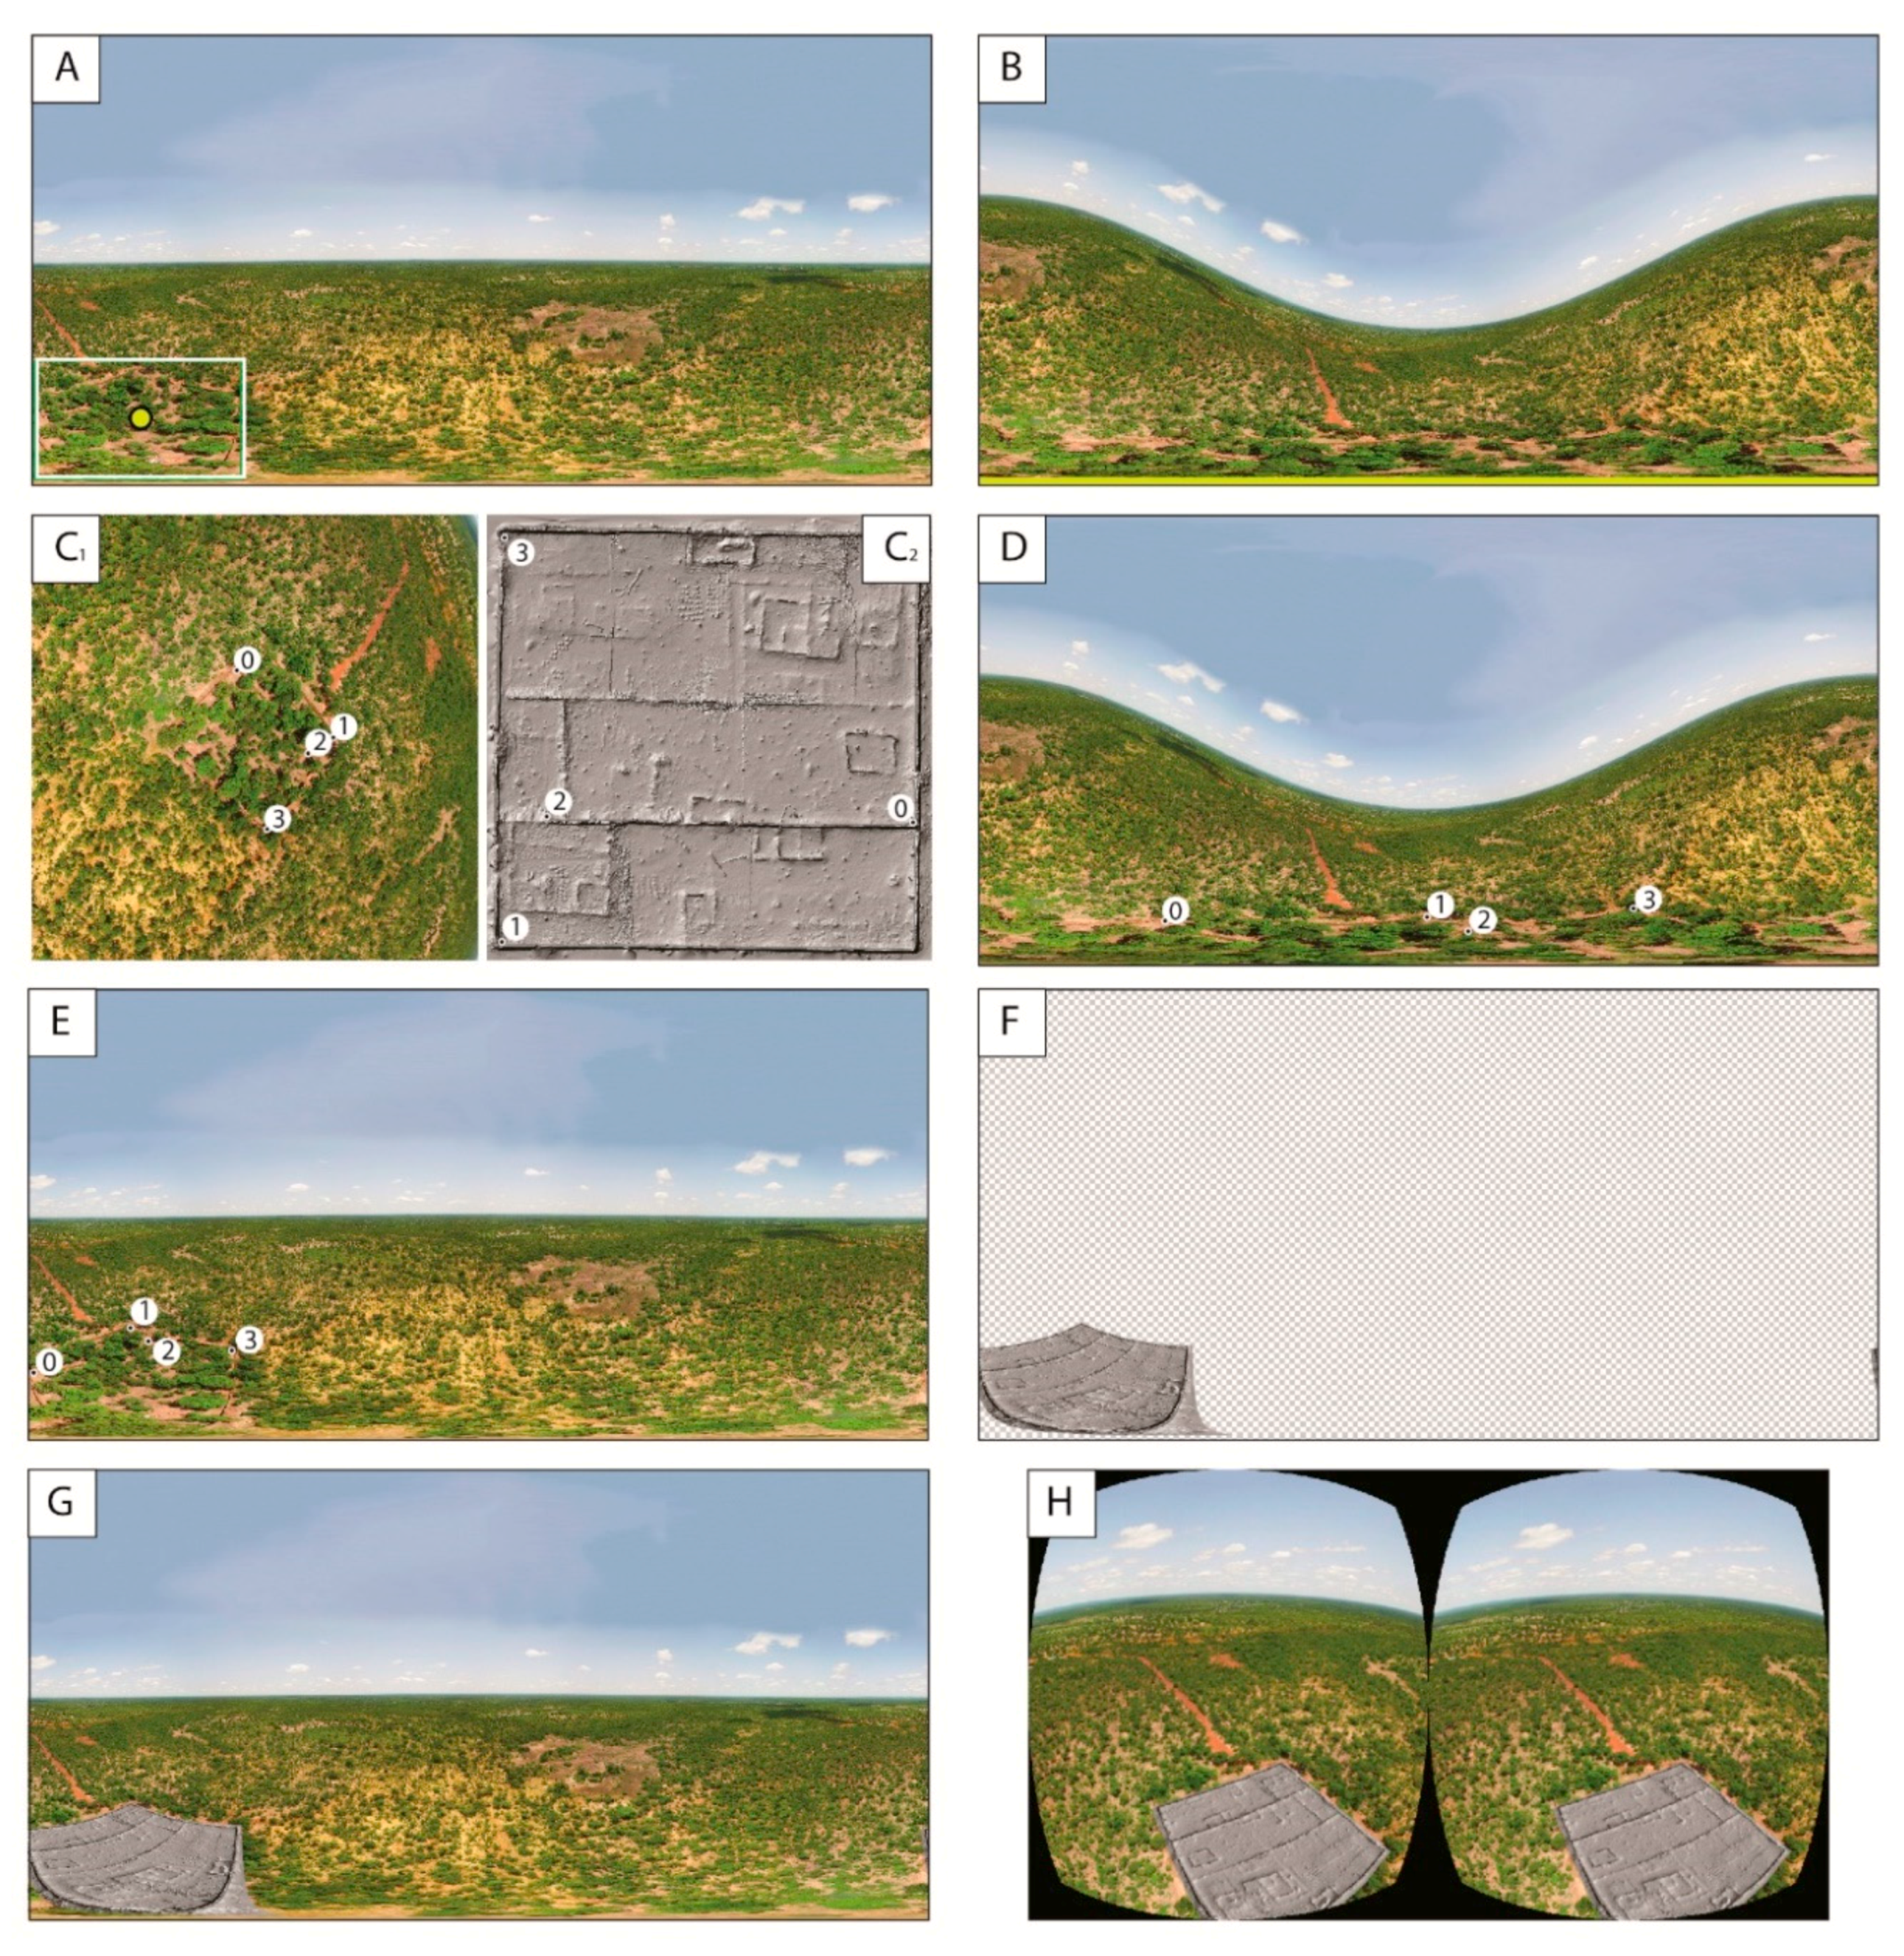
3.1. Registration of Planar Documentation on Approximately Horizontal Surfaces

With aerial photospheres taken at a sufficient elevation above the ground, there is a good chance that an archaeological structure located close to the South Pole can be considered to be approximately horizontal. This approximation means that its projection from the position where the viewer stands, on any horizontal plane situated below the viewer, produces an image of the structure possessing the same shape as the orthographic map to be registered (Figure 1). In this case, registration can easily be accomplished by Procrustes transformation, using the sum of errors between input and target landmark coordinates as a goodness-of-fit criterion [32,33,34]. Expressed more formally, let P and Q be two configurations of n points on input and target images. The aim is to find a rigid-body transformation T so that:
m i n T || P T Q ||
with T a matrix corresponding to translation, orthogonal rotation, and uniform scaling (see [29] for details of optimization methods).
Once registered, the image can be projected onto the sphere, and then transformed by equirectangular projection. The problem is how to select with precision at least three (preferentially more) unambiguous and not collinear landmarks on the equirectangular image, given that the area of interest lies in the distorted part of the southern hemisphere with aerial photospheres. For this step, the sphere is first rotated to make the region of interest coincide with the South Pole. The southern hemisphere is then stereographically projected from the North Pole (0, 0, 1) onto a plane below the sphere, here tangent at the South Pole (0, 0, −1) [35]. Such a projection is not recommended for mapping large parts of the southern hemisphere due to the high distortion appearing close to the equator, but it performs well close to the South Pole [36], where the site of interest lies. Archaeological structures become clearly visible and landmarks can be precisely positioned. Note that the workflow would have been simplified if the first stereographic projection used to define the landmark’s position had been performed directly from the center of the sphere, instead of from the North Pole. Tests nonetheless proved that, for large structures, a projection from the sphere center produces more distortion, increasing further from the nadir, and making landmark positioning more difficult. The example presented here uses an aerial view of Loropéni, on which is projected a high-resolution hill-shaded digital elevation model (DEM), produced by photogrammetry from more than 4000 pictures taken at eye level (Figure 2).
The workflow is summarized below:
  • Determine the coordinates of the center of the area of interest on the equirectangular image (Figure 2A).
  • Rotate the sphere in order to place the center of interest at the South Pole (Figure 2B).
  • Project the area surrounding the South Pole stereographically on a tangent plane, using the North Pole as reference (Figure 2C1).
  • Position a set of landmarks manually on the document to be registered (input) and on the stereographic projection (target) (Figure 2C1,C2).
  • Back-project the target landmarks onto the unit sphere (North Pole as reference) (Figure 2D).
  • Rotate the landmarks together with the unit sphere to return to the sphere’s original position (Figure 2E).
  • Project the landmarks on a plane tangent to the South Pole, taking the center of the unit sphere as reference.
  • Calculate the rotation matrix, scaling factor, and translation vector, from input to target coordinates by rigid Procrustes registration (cf. Equation (1)).
  • Position the transformed input image in the tangent plane coordinate system.
  • Back-project the registered image onto the unit sphere (sphere center as reference).
  • Perform an equirectangular projection of the image to be registered (Figure 2F), and add as background the original image (Figure 2G).
  • The final image is ready to be seen in HMD (Figure 2H).
The registered image perfectly fits the archaeological structures (Figure 2G,H; see also in Supplementary Material, Figures S1 and S2 for the original and augmented jpeg images), strengthening the feeling of immersion for the viewer, particularly when the augmented image is viewed with the HMD. Note that any other map could be projected following the same procedure.

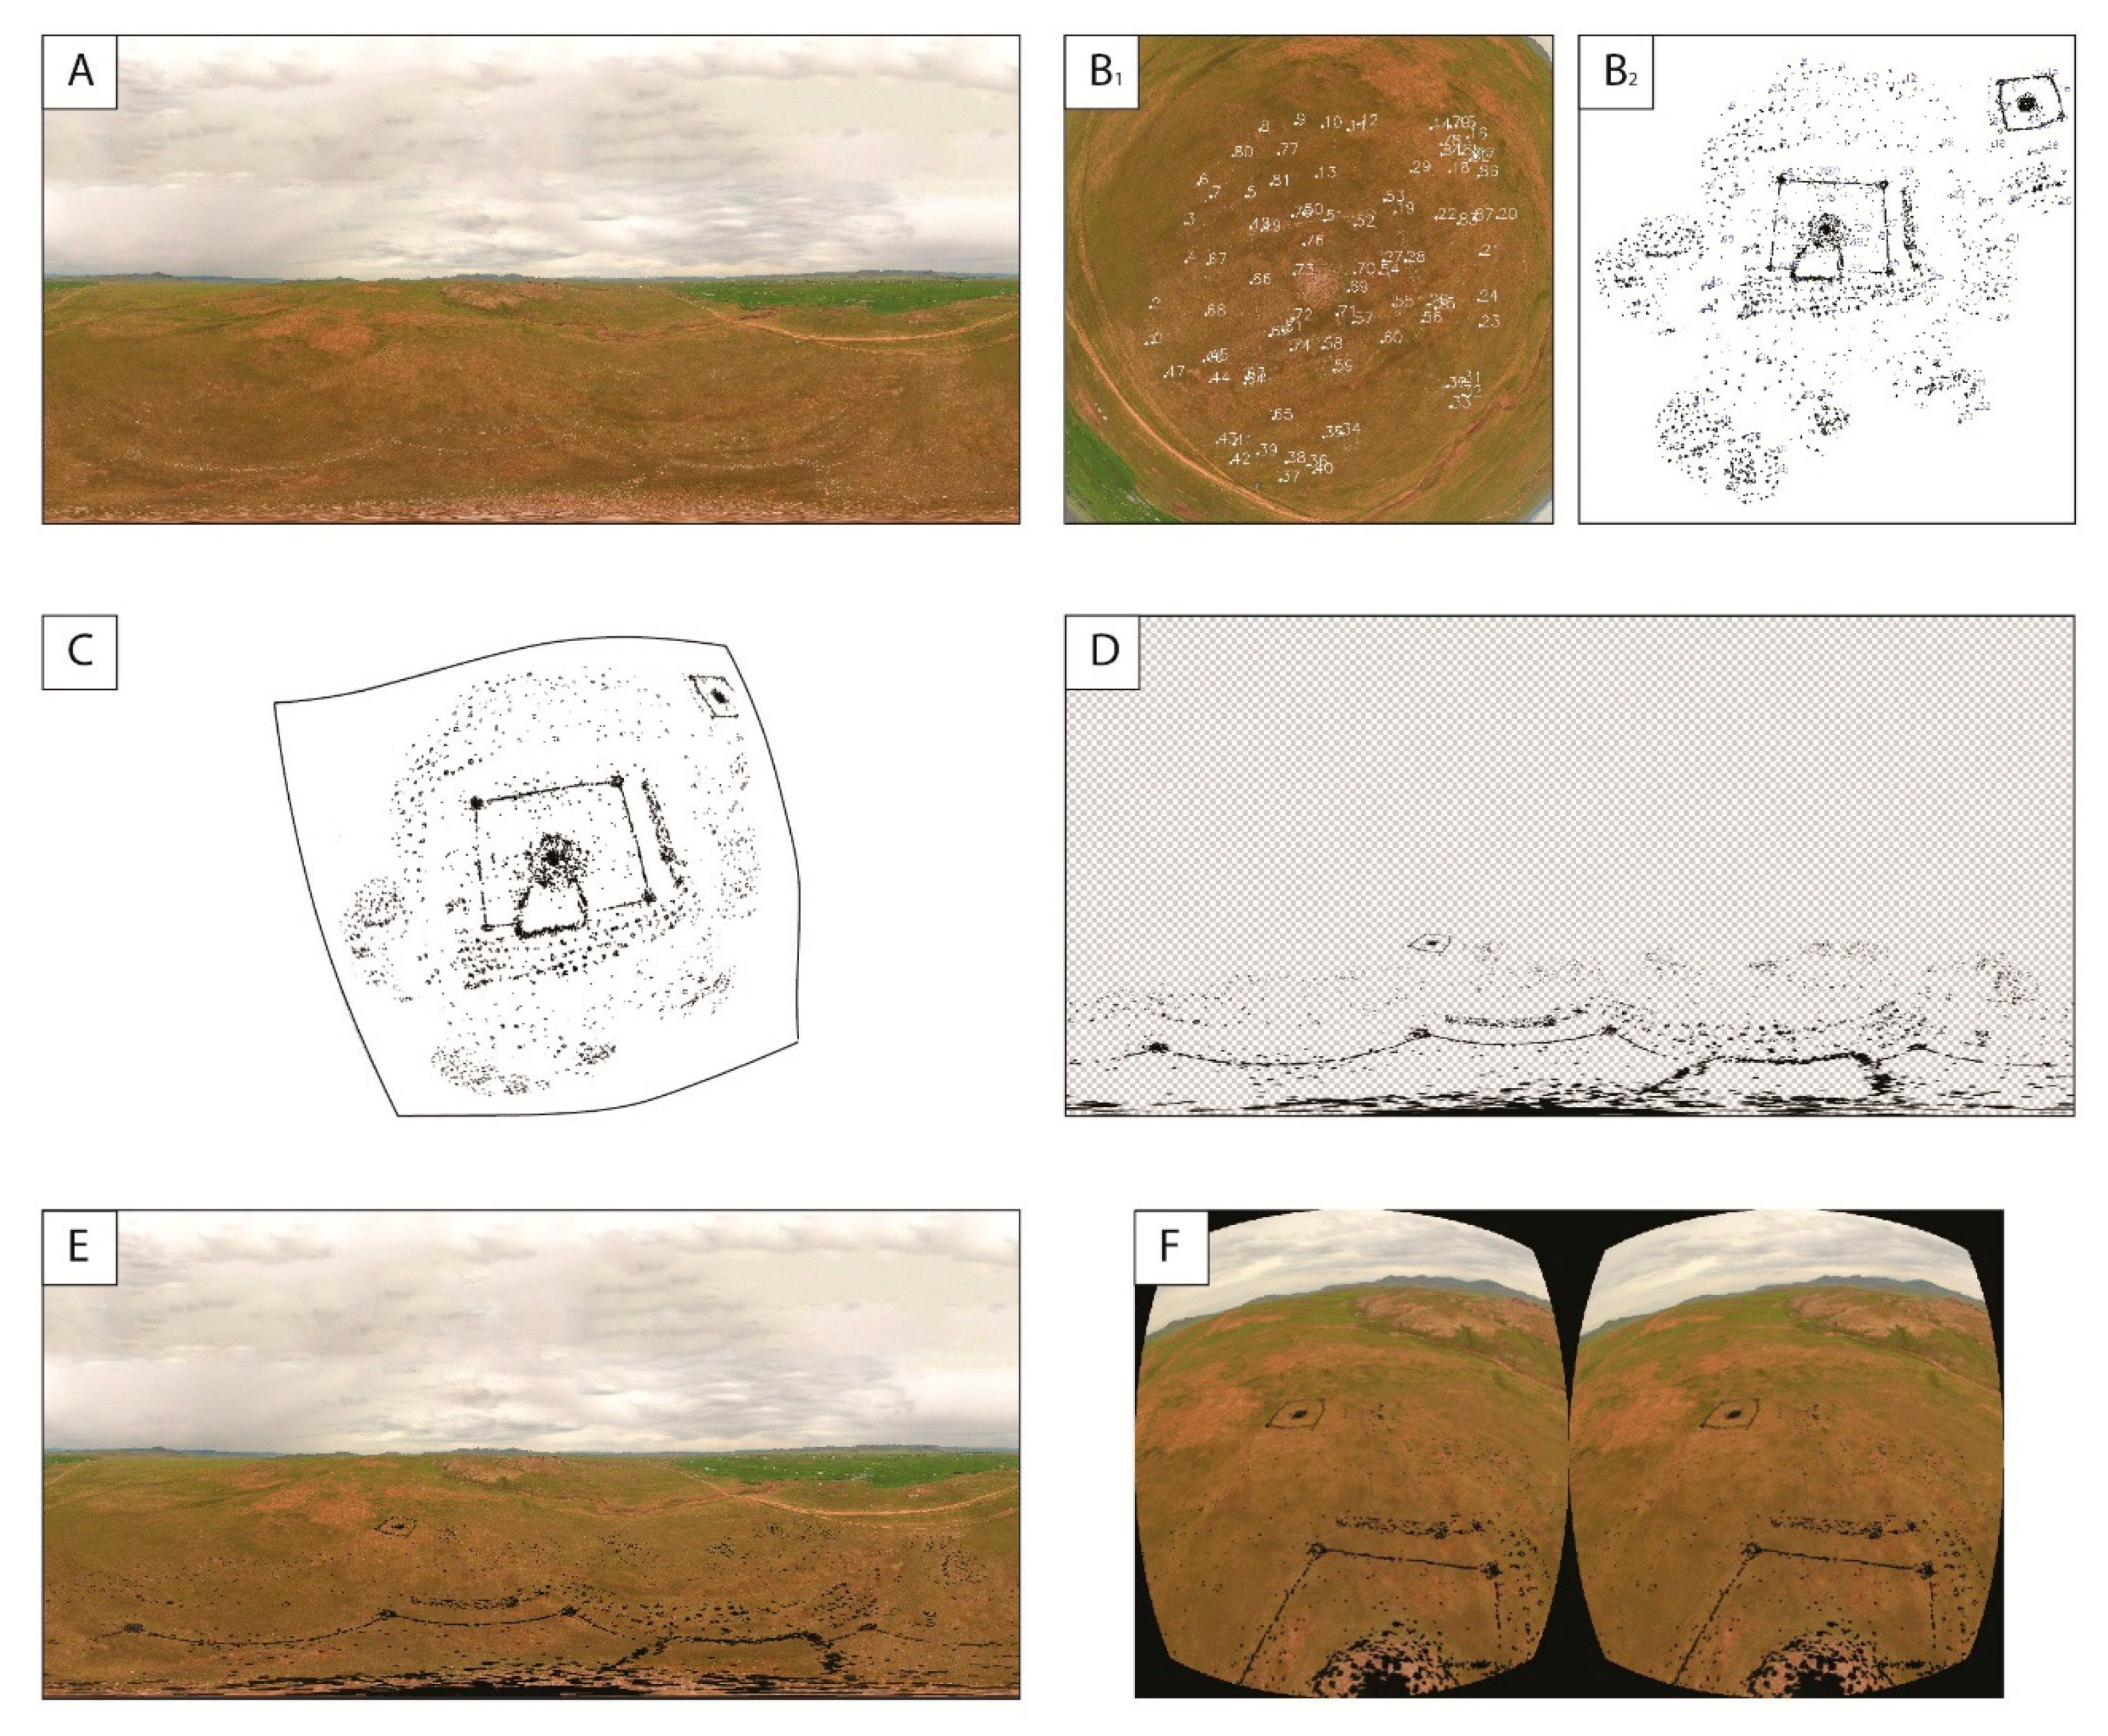
3.2. Registration of Planar Documentation on Irregular Surfaces

It is also quite common for the topographical surface to be irregular, or for the viewpoint not to be elevated enough to consider this surface as reasonably horizontal. Figure 3 illustrates the problems related to parallax when points of interest are located on an irregular surface. Let A’, B’, C’ be the apparent position on the horizontal plane of points A, B, C from viewpoint 1, and A’’, B’’, C’’ from viewpoint 2, while A’’’, B’’’, C’’’ are the orthographic projection of A, B, C (e.g., a map of the area). The distances between points of interests A’, B’, C’ and A’’, B’’, C’’ projected onto the plane are no longer proportionate to their counterparts, A’’’, B’’’, C’’’, on the map to be registered (cf. Figure 3). This is especially true from viewpoint 1: B’ appears much closer to C’ than to A’, while B’’’ is approximately in mid-position between A’’’ and C’’’. Note that from viewpoint 2, the ratios of distances between points are in greater conformity with those observed on the map, because of the approximately zenithal position of viewpoint 2, and its high elevation in relation to variations in relief. In such circumstances, especially for the scene observed from viewpoint 1, any rigid registration of the map is not recommended, because serious mismatches are expected if the map is registered using the Procrustes procedure described above. Practical solutions can rather be found in non-rigid techniques, such as thin plate splines (TPS), a method popularized by image morphing. This technique is based on surface interpolation, using a curve-smoothing spline function over scattered control points. As constraints, the input surface is deformed using minimal bending, and all landmark pairs belonging to both input and target must coincide [37]. Warping with TPS requires more point placements than Procrustes registration, because deformation may produce some mismatches, especially close to the edges (if not well constrained by several control points). In practice, the proposed workflow is comparable to the one described above, except that TPS warping is applied in place of Procrustes registration, and that the stereographic projection from the center of the sphere is unnecessary, since TPS accounts for all deformation. The example provided here concerns the burial structures of Tsatsiin Ereg. An orthomosaic was produced from aerial images over a 16 ha area, very rich in funeral monuments made of dry stones. A supervised machine-learning algorithm was applied to delineate the stones automatically on the basis of RGB channels, texture parameters, and elevation (more details about the procedure will be provided in [38]). The aim is to project this information onto the photosphere, to make the structures more visible for the spectator.
A total of 87 control points were therefore placed on both input and target images. The workflow is as follows:
  • Determine the center of the area of interest on the equirectangular image.
  • Rotate the unit sphere in order to place the center of interest at the South Pole (Figure 4B).
  • Project the area surrounding the South Pole stereographically onto a tangent plane, using the North Pole as reference (Figure 4B1).
  • Place a set of control points manually on the stereographic projection (target), and on the document to be registered (input) (Figure 4B1,B2).
  • Perform TPS deformation of the input image (Figure 4C)
  • Project the deformed input image onto the unit sphere.
  • Rotate the sphere to return it to its original position.
  • Perform equirectangular projection (Figure 4D), and add the original image as background (Figure 4E).
  • The final image is ready to be seen in HMD (Figure 4F).
As expected, the image resulting from TPS deformation appears to fit the archaeological structures well, except perhaps close to the edges (Figure 4E; see also in Supplementary Material, Figures S3 and S4 for the original and augmented jpeg images). The results are much more accurate than those obtained by Procrustes (not shown here), because the topography of the surface on which the monument lies is somewhat irregular.

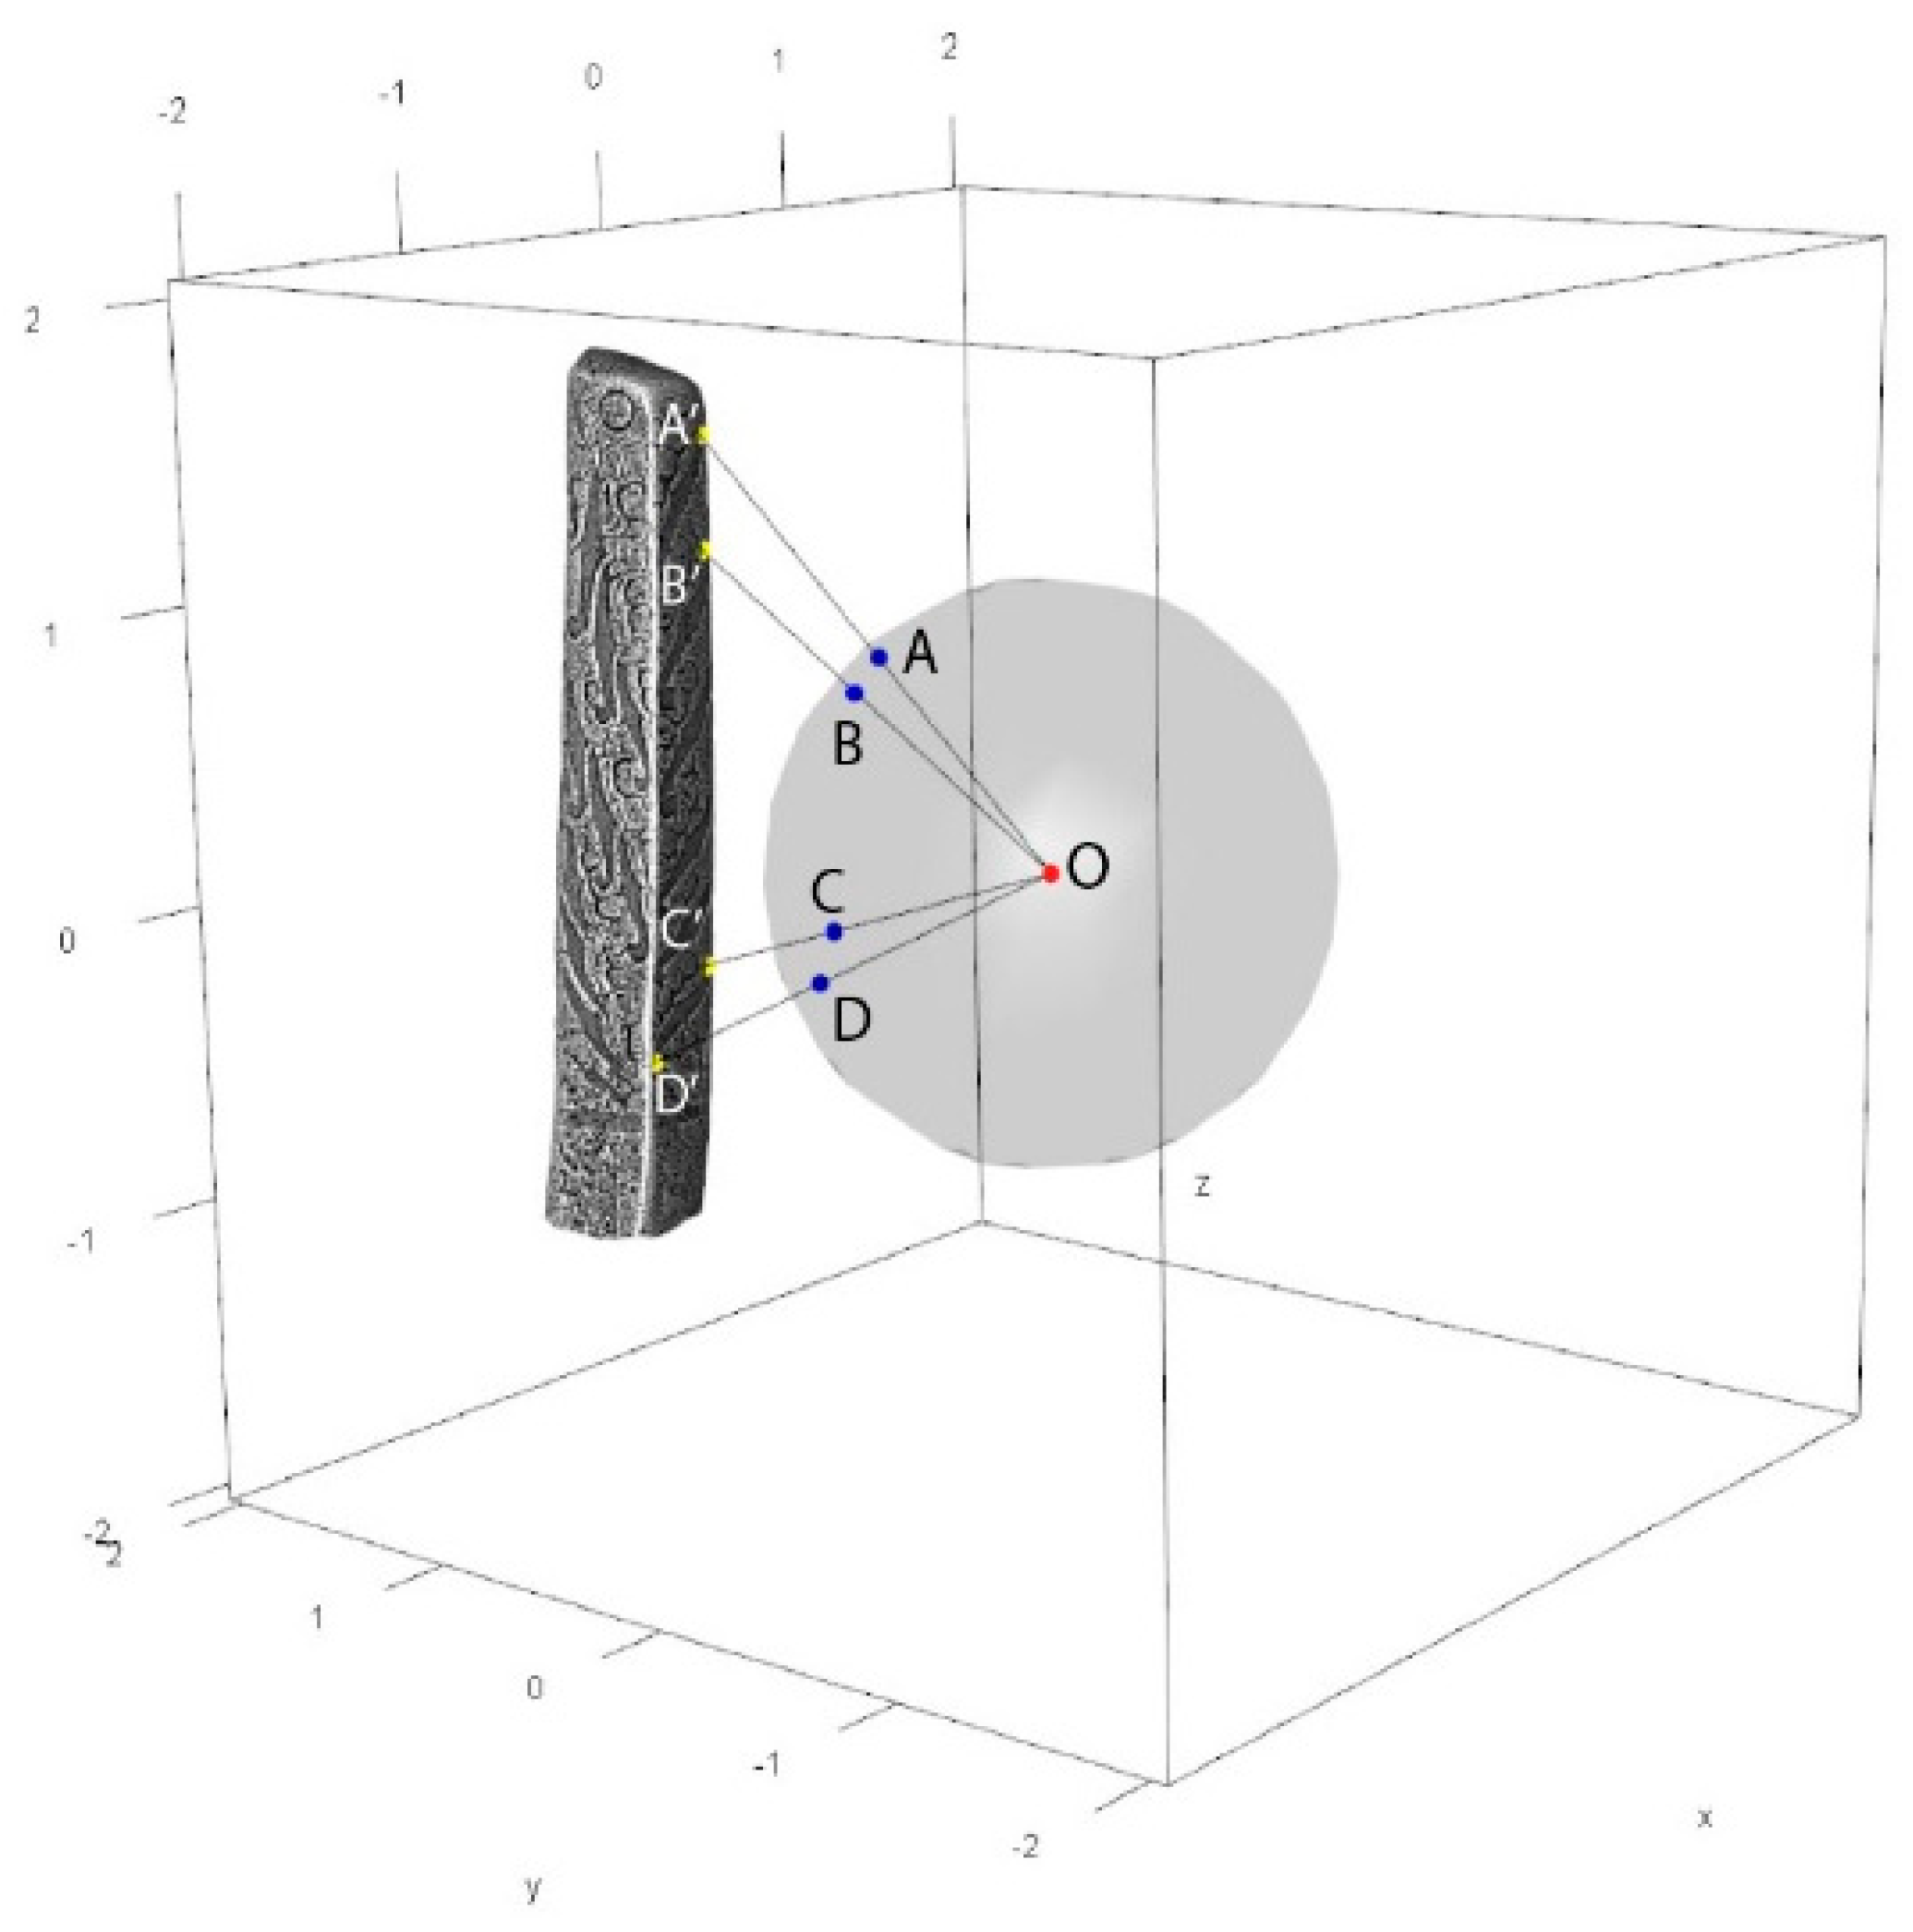
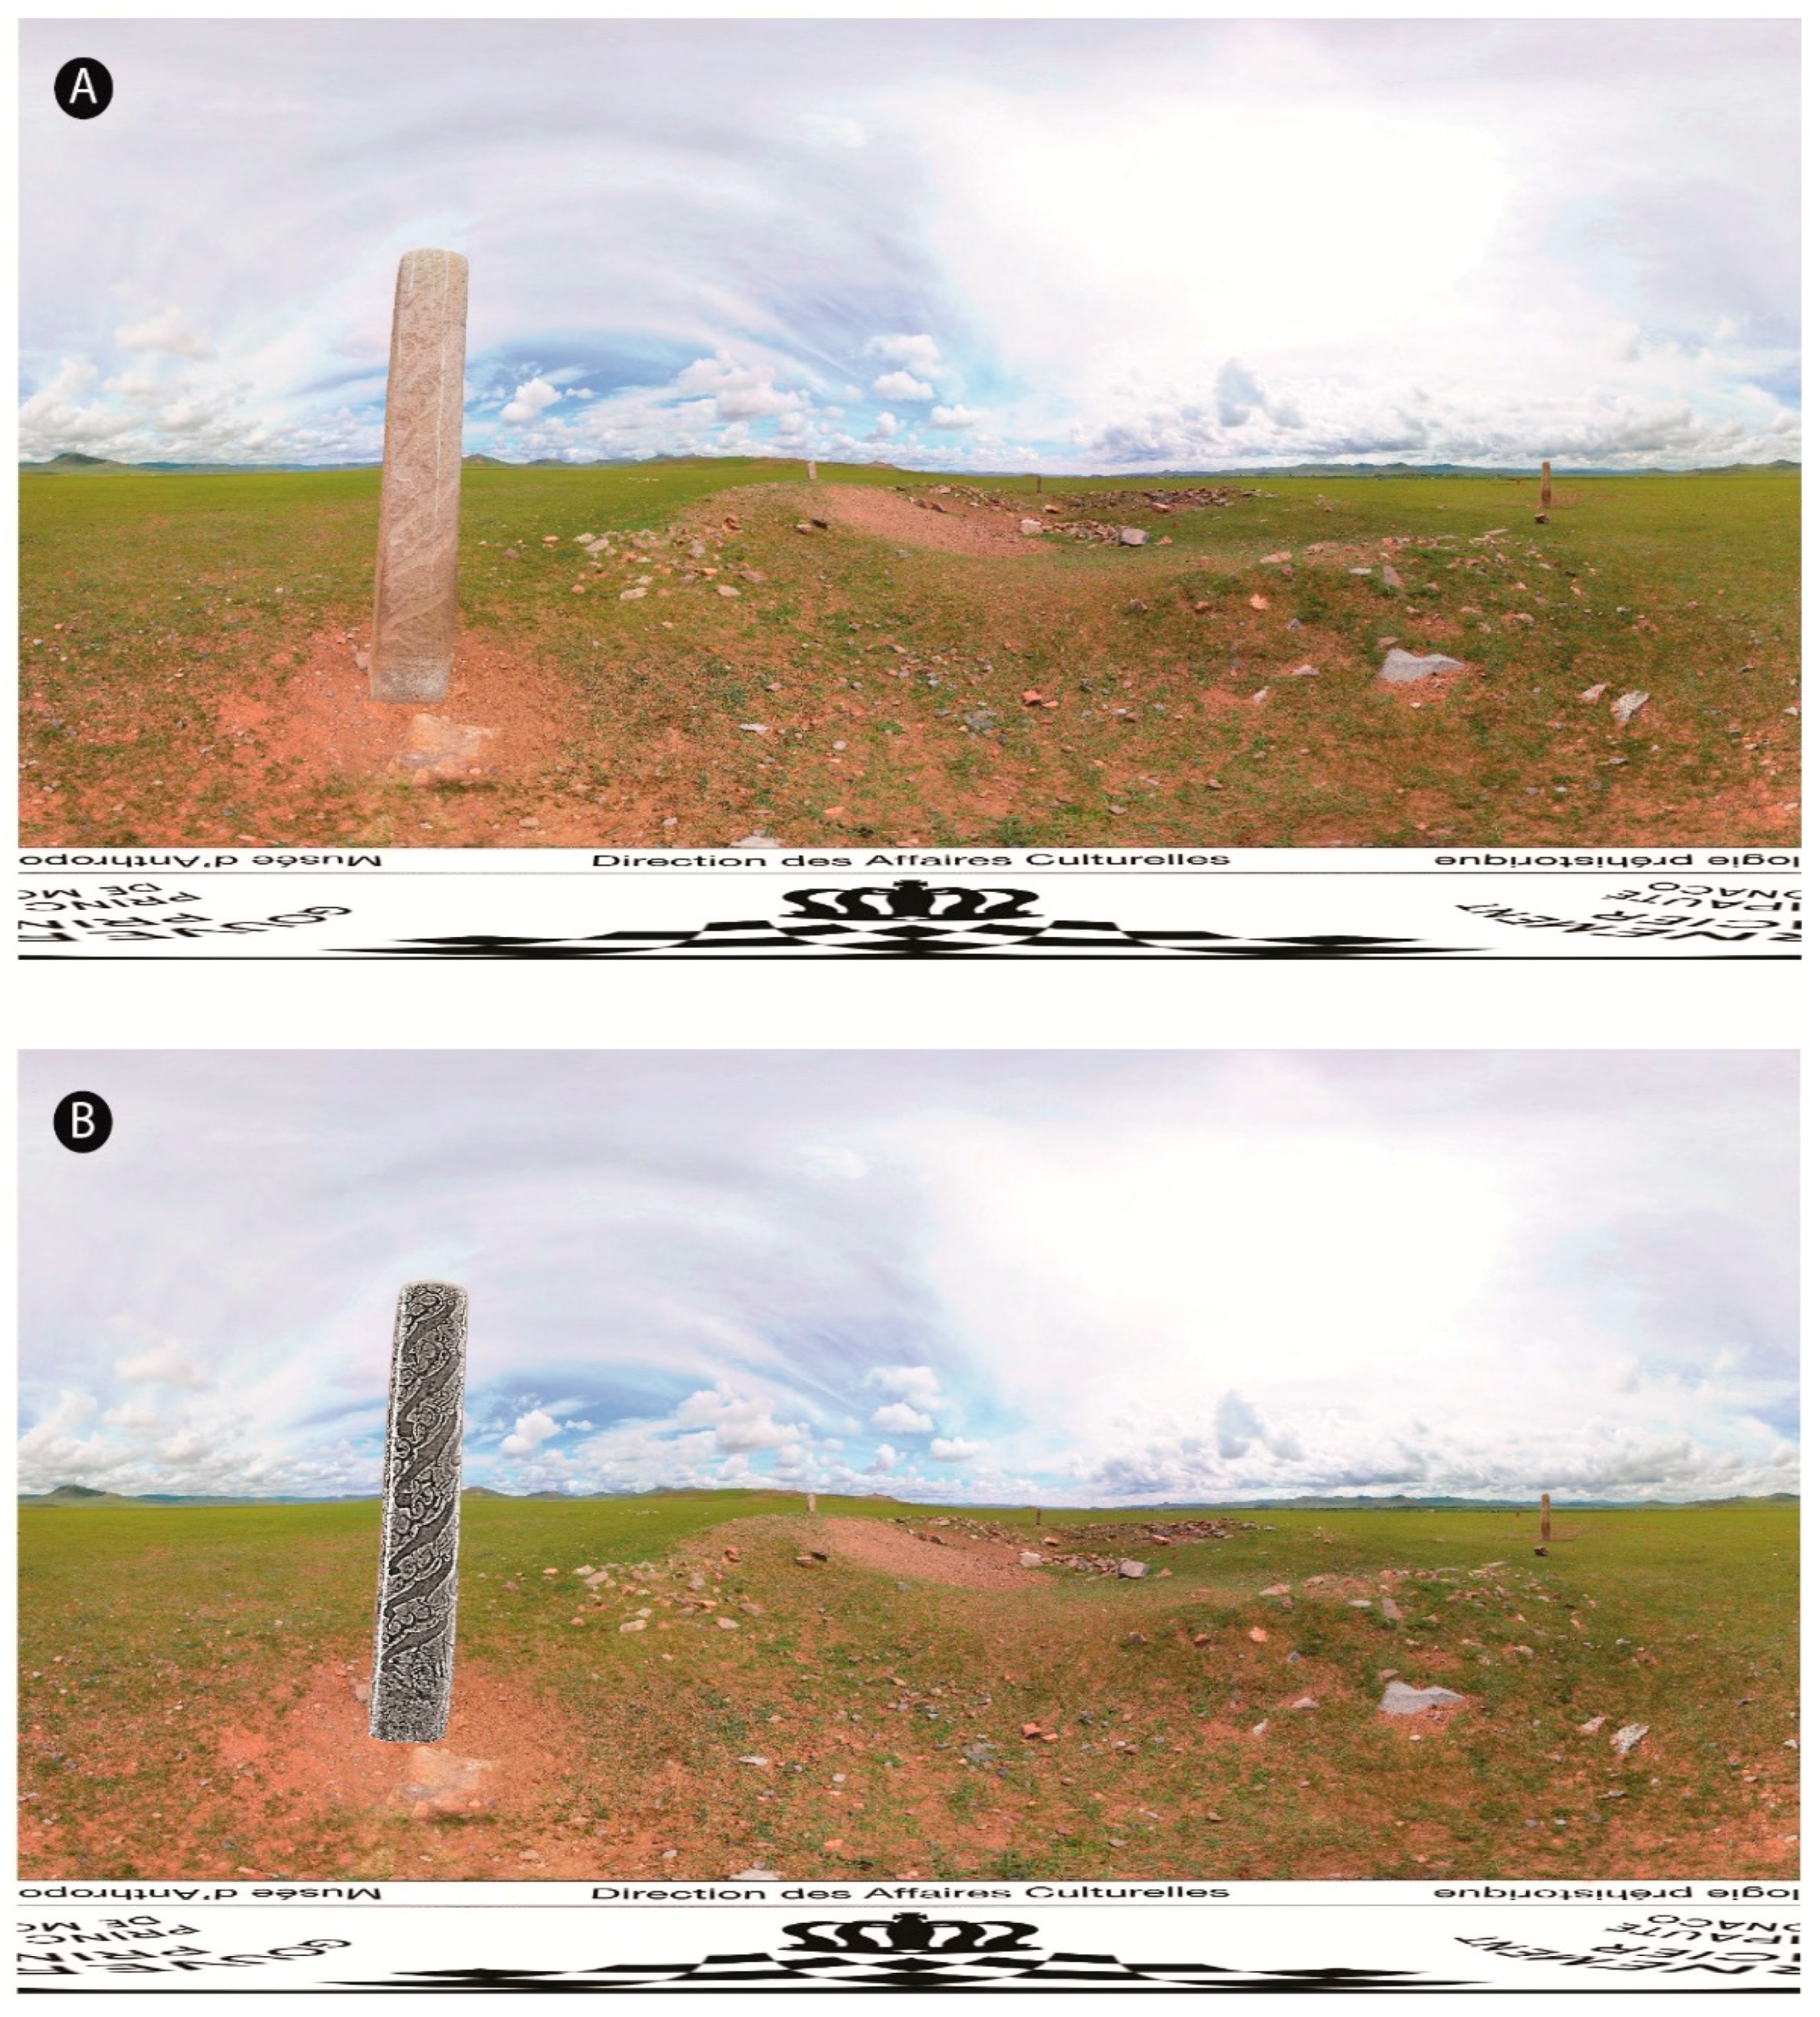
3.3. Registration of 3D Models on the Photosphere

Advances in acquiring 3D models and the treatment of their geometry have also been adapted for archaeological and cultural heritage purposes [39,40,41,42,43]. Such information might also efficiently augment photospheres. The alignment of the 3D model can easily be achieved by first positioning two sets of landmarks on both the equirectangular image and the 3D model (Figure 5).
The optimal position of the 3D model is obtained by minimizing the sum of squared distances, di, between landmarks placed on the models and the lines linking their corresponding counterparts on the photosphere to the sphere center:
min a , b , c , φ , θ , ρ d i 2 ,
with
d i = || O P i × O P i || || O P i || ,
where O is the center of the sphere; Pi and P’i the landmarks on the photosphere and their counterparts on the 3D model; a, b, c the translation parameters; and φ, θ, ρ the rotation parameters around the three axes. Note that the size is fixed. The visible parts of the 3D model are then projected onto the sphere and transformed by equirectangular projection. The funeral stela #22 from Tsatsiin Ereg, decorated with symbols including many deer, is used to illustrate the projection capabilities of 3D models on photospheres (Figure 6A). The carved parts of the rock are not clearly visible to the naked eye in the original image, but they become clearer after applying an algorithm of ambient occlusion, which darkens the areas with difficult access to light (for an application in archaeology, see [44]). The aim here is to project this artificial texture obtained from the 3D model onto the photosphere. The complete projection workflow is summarized below:
  • Place a set of landmarks manually on the 3D model and on the equirectangular image (if possible, otherwise use appropriate rotation and projection, as described above).
  • Translate and rotate the 3D model to minimize the cost function (Equation (2)).
  • Determine the part of the 3D model visible from the sphere center.
  • Project the color of visible vertices onto the unit sphere (sphere center as reference).
  • Perform an equirectangular projection of the sphere (Figure 6B).
The augmentation of the photosphere is undoubtedly effective for better understanding of the monument, especially for apprehending the spatial organization of symbols at the surface of the stela (Figure 6A,B; see also in Supplementary Material, Figures S5 and S6 for the original and augmented jpeg images). Note that several photospheres could have been captured to cover the other sides of the stela, allowing visitors to change their point of view, while maintaining their perception of environmental scale and space.

4. Concluding Remarks

Simple procedures are provided to project different types of materials onto 2D photospheres, whether plane (maps, orthomosaics, etc.) or 3D meshes. To the best of our knowledge, although common mathematical tools based on Procrustes registration, thin plate splines, and simple optimization are involved, such implementations were not available in popular game engines, or in packages and libraries of the main programming languages. The final equirectangular images can be used as supplementary layers over the original photospheres, and incorporated into virtual archaeological tours [45,46], or rendered individually by dedicated web viewers, or stand-alone VR browsers for Windows, Mac, and Linux, and for tablets and smartphones based on Android or iOS (Photo Sphere Viewer, Panorama Viewer, Insta360 Player, PhotoSphere Viewer). The HMDs should; however, be privileged for better immersion, almost real-life experiences, greatly enhancing spatial perception. An Android application, build using Unity and designed for Google Daydream HDMs and compatible smartphones, is provided as Supplementary Material (see Supplementary Materials). It displays the three examples described in this paper, including interaction, and presents photospheres with and without augmentation. Note that it could easily be ported to other popular systems, such as Samsung Gear VR (Facebook technologies LCC, Irvine, USA), Oculus GO (Facebook technologies LCC, Irvine, USA), Google Cardboard (Google LCC, Mountain View, USA), etc. In most virtual tours, photospheres are simply used for navigating, and the documentation is presented separately, using trigger buttons, so that the feeling of immersion, or at least of contextualization, is broken. By contrast, augmented versions of photospheres maintain this feeling, especially with HDMs. The general public can be transported to the site almost physically, with a real sense of being there, which greatly enhances the contextualization of archaeological information. Augmented photospheres may facilitate interpretations by research teams, especially for remote sites, where repeated access on demand may be impossible, due to cost, schedules, seasonal constraints, etc. In rescue archaeology, this new medium could be very valuable to preserve a visual record of interpreted remains, after their destruction. Augmented photospheres are therefore expected to be beneficial for the sustainability of archaeological information, including documentation, visualization, and interpretation, and more generally for scientific mediation. They may also be an asset for tourism and for education, by improving learning performance. Although the entire 3D modeling of a site offers extended capability, such as to build a virtual world, and to allow physical walking through it via a virtual camera, implementation in the field and later in the laboratory is complex, costly, time-consuming, and demanding in terms of storage and computing resources [6]. The acquisition of 2D photospheres does not suffer from these handicaps, as it takes only a few minutes in the field and is inexpensive. Considering the numerous advantages already mentioned above, archaeological use of photospheres should be encouraged, especially when they are augmented by the abundant documentation produced by research, all the more in that the proposed workflow can easily be reproduced for almost every archaeological site.

Supplementary Materials

The following are available online at https://www.mdpi.com/2071-1050/11/14/3894/s1, Text S1: Principles of equirectangular projection, Figure S1: Original photosphere of the Loropéni ruins, Figure S2: Augmented photosphere of the Loropéni ruins, Figure S3: Original photosphere of an archaeological complex at Tsatsiin Ereg, Figure S4: Augmented photosphere of an archaeological complex at Tsatsiin Ereg, Figure S5: Original photosphere of the #22 stela at Tsatsiin Ereg, Figure S6: Augmented photosphere of the #22 stela at Tsatsiin Ereg. Code S1: Python scripts for Procrustes and TPS registrations. Code S2: R script for 3D model registration. Application S1: application with the three examples provided for Google Daydream (Google LCC, Mountain View, USA).

Author Contributions

Conceptualization: F.M., J.M., R.G., T.R. and J.W.; methodology: F.M., N.N., J.W., T.R. and Y.E.; funding: J.M., R.G. and F.M.; acquisition: J.W., J.M., T.R. and F.M.; all the authors contributed to the manuscript.

Funding

This research was funded by the Joint Mission Mongolia–Monaco, Lobi-or-fort (MEAE), and the project ROSAS (uB-FC and RNMSH).

Acknowledgments

We are grateful to the anonymous reviewers whose judicious comments have improved the manuscript.

Conflicts of Interest

The authors declare no conflicts of interest.

References

  1. Creem-Regehr, S.H.; Stefanucci, J.K.; Thompson, W.B. Perceiving absolute scale in virtual environments: How theory and application have mutually informed the role of body-based perception. Psychol. Learn. Motiv. 2015, 62, 195–224. [Google Scholar]
  2. Berthoz, A. Fondements cognitifs de la perception de l’espace. In Proceedings of the 1st International Congress on Ambiances, Grenoble, France, 10–12 September 2008; pp. 121–132. [Google Scholar]
  3. Erkelens, C.J. Perspective space as a model for distance and size perception. i-Perception 2017, 8, 1–20. [Google Scholar] [CrossRef] [PubMed]
  4. Connolly, J.; Lake, M. Geographical Information Systems in Archaeology; Cambridge University Press: Cambridge, UK, 2006; 358p. [Google Scholar]
  5. Reilly, P. Towards a Virtual Archaeology. In Computer Applications in Archaeology 1990; Bar International, Series; Lockyear, K., Rahtz, S., Eds.; BAR Publishing: Oxford, UK, 1991; Volume 565, pp. 133–139. [Google Scholar]
  6. Napolitano, R.K.; Scherer, G.; Glisic, B. Virtual tours and informational modeling for conservation of cultural heritage sites. J. Cult. Herit. 2018, 29, 123–129. [Google Scholar] [CrossRef]
  7. Koehl, M.; Brigand, N. Combination of virtual tours 3D model and digital data in a 3D archaeological knowledge and information system. Int. Arch. Photogramm. Remote Sens. Spat. Inf. Sci. 2012, 39, 439–444. [Google Scholar] [CrossRef]
  8. Castagnetti, C.; Giannini, M.; Rivola, R. Image-based virtual tours and 3D modeling of past and current ages for the enhancement of archaeological parks: The Visualversilia 3D project. Int. Arch. Photogramm. Remote Sens. Spat. Inf. Sci. 2017, XLII-5/W1, 639–645. [Google Scholar] [CrossRef]
  9. Fiorillo, F.; Fernández-Palacios, B.J.; Remondino, F.; Barba, S. 3D surveying and modelling of the archaeological area of Paestum, Italy. Virtual Archaeol. Rev. 2013, 4, 55–60. [Google Scholar] [CrossRef]
  10. Koeva, M.; Luleva, M.; Maldjanski, P. Integrating spherical panoramas and maps for visualization of cultural heritage objects using virtual reality technology. Sensors 2017, 17, 829. [Google Scholar] [CrossRef]
  11. Gonizzi Barsanti, S.; Caruso, G.; Micoli, L.L.; Covarrubias Rodriguez, M.; Guidi, G. 3D visualization of cultural heritage artefacts with virtual reality devices. Int. Arch. Photogramm. Remote Sens. Spat. Inf. Sci. 2015, XL-5/W7, 165–172. [Google Scholar] [CrossRef]
  12. Katsouri, I.; Tzanavari, A.; Herakleous, K.; Poullis, C. Visualizing and Assessing Hypotheses for Marine Archaeology in a VR CAVE Environment. J. Comput. Cult. Herit. 2015, 8, 10. [Google Scholar] [CrossRef]
  13. Guttentag, D.A. Virtual reality: Applications and implications for tourism. Tour. Manag. 2010, 31, 637–651. [Google Scholar] [CrossRef]
  14. Roussou, M. Virtual Heritage: From the Research Lab to the Broad Public. In Virtual Archaeology, Proceedings of the VAST Euroconference, Arezzo, Italy, 24–25 November 2000; Bar International Series; Niccolucci, F., Ed.; BAR Publishing: Oxford, UK, 2002; Volume 1075, pp. 93–100. [Google Scholar]
  15. Christofi, M.; Kyrlitsias, C.; Michael-Grigoriou, D.; Anastasiadou, Z.; Michaelidou, M. A Tour in the Archaeological Site of Choirokoitia Using Virtual Reality: A Learning Performance and Interest Generation Assessment. In Advances in Digital Cultural Heritage; Lecture Notes in Computer Science; Ioannides, M., Martins, J., Žarnić, R., Lim, V., Eds.; Springer: Berlin/Heidelberg, Germany, 2018; Volume 10754, pp. 208–217. [Google Scholar]
  16. Barceló, J.A. Virtual Reality for Archaeological Explanation: Beyond ‘picturesque’ reconstruction. Archeologia e Calcolatori 2001, 12, 221–244. [Google Scholar]
  17. Mihelj, M.; Novak, D.; Beguš, S. Virtual Reality Technology and Applications; Series: Intelligent Systems, Control and Automation: Science and Engineering 68; Springer: Berlin/Heidelberg, Germany, 2014; 231p. [Google Scholar]
  18. Linowes, J. Unity Virtual Reality Projects: Learn Virtual Reality by Developing more than 10 Engaging Projects with Unity 2018, 2nd ed.; Packt Publishing: Birmingham, UK, 2018; 492p. [Google Scholar]
  19. Ruddle, R.A.; Payne, S.J.; Jones, D.M. Navigating large-scale virtual environments: What differences occur between helmet-mounted and desk-top displays? Presence 1999, 8, 157–168. [Google Scholar] [CrossRef]
  20. Renner, R.S.; Velichkovsky, B.M.; Helmert, J.R. The perception of egocentric distances in virtual environments—A review. ACM Comput. Surv. 2013, 46. [Google Scholar] [CrossRef]
  21. Ronfard, R.; Taubin, G. Image and Geometry Processing for 3-D Cinematography (Geometry and Computing); Springer: Berlin/Heidelberg, Germany, 2010; 305p. [Google Scholar]
  22. Michiels, N.; Jorissen, L.; Put, J.; Philippe, B. Interactive augmented omnidirectional video with realistic lighting. In Augmented and Virtual Reality; Lecture Notes in Computer Science; De Paolis, L., Mongelli, A., Eds.; Springer: Cham, Switzerland, 2014; Volume 8853. [Google Scholar]
  23. Fernández-Palacios, B.J.; Morabito, D.; Remondino, F. Access to complex reality-based 3D models using virtual reality solutions. J. Cult. Herit. 2017, 23, 40–48. [Google Scholar] [CrossRef]
  24. Gheisari, M.; Sabzevar, M.F.; Chen, P.; Irizzary, J. Integrating BIM and panorama to create a semi-augmented-reality experience of a construction site. Int. J. Constr. Educ. Res. 2016, 12, 303–316. [Google Scholar] [CrossRef]
  25. Guillon, R.; Simporé, L. Les Forts du Pays Lobi et L’activité Aurifère au Sud-Ouest du Burkina Faso, 11e–18e Siècles: Origine, Rôle Social et Réseau D’échange Associés Aux Ruines de Loropéni (Site UNESCO) Projet de Recherche Franco-Burkinabè; Ministère des Affaires Etrangères: Paris, France, 2018; p. 80. [Google Scholar]
  26. Simporé, L. The ruins of Loropeni, the first mankind worldwide patrimony Burkinabe site. J. Egyptol. Afr. Civiliz. 2011, 18–20, 255–279. [Google Scholar]
  27. Simporé, L.; Guillon, R.; Camerlynck, C.; Farma, H.; Kouassi, S.K.; Monna, F.; Mégret, Q. The Pre-Colonial Enclosure of Loropéni (Southwestern Burkina Faso): Preliminary Results of the Lobi-Or-Fort Project’s Archaeological Excavation. In Proceedings of the SAFA 2016, Toulouse, France, 26 June–2 July 2016. [Google Scholar]
  28. Magail, J. Tsatsiin Ereg, site majeur du début du 1er millénaire en Mongolie. Bull. Mus. Anthrop. Prehist. Monaco 2008, 48, 107–120. [Google Scholar]
  29. Magail, J. Les stèles ornées de Mongolie dites « pierres à cerfs », de la fin de l’âge du Bronze. In Proceedings of the Actes du 3e Colloque de Saint-Pons-de-Thomières, Saint-Pons-de-Thomières, France, 16 September 2012; Direction Régionale des Affaires Culturelles Languedoc-Roussillon: Montpellier, France, 2015; pp. 89–101. [Google Scholar]
  30. Pincus, Z. CellTool: Command-Line Tools for Statistical Analysis of Shapes, Particularly Cell Shapes from Micrographs. 2014. Available online: https://github.com/zpincus/celltool/blob/master/celltool/numerics/image_warp.py (accessed on 10 July 2019).
  31. R Core Team. R: A Language and Environment for Statistical Computing; R Foundation for Statistical Computing: Vienna, Austria, 2019; Available online: https://www.R-project.org/ (accessed on 10 July 2019).
  32. Dryden, I.L.; Mardia, K.V. Statistical Shape Analysis; John Wiley & Sons: Chichester, NY, USA, 1998; 376p. [Google Scholar]
  33. Zelditch, L.; Swiderski, D.L.; Sheets, D. Geometric Morphometrics for Biologists: A Primer, 2nd ed.; Academic Press: Cambridge, MA, USA, 2012; 488p. [Google Scholar]
  34. Gower, J.C.; Dijksterhuis, D.B. Procrustes Problems; Oxford University Press: Oxford, UK, 2004; 248p. [Google Scholar]
  35. Coxeter, H.S.M. Introduction to Geometry, 2nd ed.; Wiley: New York, NY, USA, 1989; 492p. [Google Scholar]
  36. Lapaine, M.; Usery, E.L. Choosing a Map Projection; Springer: Berlin/Heidelberg, Germany, 2017; 360p. [Google Scholar]
  37. Bookstein, F.L. Principal warps: Thin plate splines and the decomposition of deformations. IEEE Trans. Pattern Anal. Mach. Intell. 1989, 11, 567–585. [Google Scholar] [CrossRef]
  38. Monna, F.; Magail, J.; Rolland, T.; Navarro, N.; Wilczek, J.; Gantulga, J.-O.; Esin, Y.; Granjon, L.; Chateau, C. Machine learning for rapid mapping of archaeological structures made of dry stones—Example of burial monuments from the Khirgisuurs culture, Mongolia. J. Cult. Herit. submitted.
  39. Pavlidis, G.; Koutsoudis, A.; Arnaoutoglou, F.; Tsioukas, V.; Chamzas, C. Methods for 3D digitization of cultural heritage. J. Cult. Herit. 2007, 8, 93–98. [Google Scholar] [CrossRef]
  40. Yastikli, N. Documentation of cultural heritage using digital photogrammetry and laser scanning. J. Cult. Herit. 2007, 8, 423–442. [Google Scholar] [CrossRef]
  41. Remondino, F.; Rizzi, A. Reality-based 3D documentation of natural and cultural heritage sites—Techniques, problems, and examples. Appl. Geomat. 2010, 2, 85–100. [Google Scholar] [CrossRef]
  42. Domingo, I.; Villaverde, V.; Lopez-Montalvo, E.; Lerma, J.L.; Cabrelles, M. Latest developments in rock art recording: Towards an integral documentation of Levantine rock art sites combining 2D and 3D recording techniques. J. Archaeol. Sci. 2013, 40, 1879–1889. [Google Scholar] [CrossRef]
  43. Monna, F.; Esin, Y.; Magail, J.; Granjon, L.; Navarro, N.; Wilczek, J.; Saligny, L.; Couette, S.; Dumontet, A.; Chateau, C. Documenting carved stones by 3D modelling—Example of Mongolian deer stones. J. Cult. Herit. 2018, 34, 116–128. [Google Scholar] [CrossRef]
  44. Rolland, T.; Monna, F.; Magail, J.; Esin, Y.; Navarro, N.; Wilczek, J.; Chateau, C. Documenting carved stones from 3D models. Part II—Ambient occlusion to reveal carved parts. J. Cult. Herit. In prep.
  45. Kiourt, C.; Koutsoudis, A.; Arnaoutoglou, F.; Petsa, G.; Markantonatou, S.; Pavlidis, G. A dynamic web-based 3D virtual museum framework based on open data. In Proceedings of the 2015 Digital Heritage, Granada, Spain, 28 September–2 October 2015; pp. 647–650. [Google Scholar]
  46. Barreau, J.B.; Gaugne, R.; Bernard, Y.; Le Cloirec, G.; Gouranton, V. Virtual reality tools for the West digital conservatory of archaeological heritage. In Proceedings of the VRIC 2014, Laval, France, 9–11 April 2014; ACM: New York, NY, USA, 2014; pp. 1–4. [Google Scholar]
Figure 1. Registration of planar archaeological information on the horizontal plane.
Sustainability 11 03894 g001
Figure 2. Workflow for registering planar documentation (horizontal structures). (A) Original equirectangular image with the center of interest marked (yellow dot); (B) the photosphere is rotated in order to place the center of interest at the South Pole; (C1) stereographic projection (target image) with four landmarks positioned (0–3); (C2) input image (here digital elevation model (DEM) acquired by photogrammetry from pictures taken from the ground, represented as shaded relief) with the four corresponding landmarks (0–3); (D) projection of the landmarks onto the photosphere; (E) rotation of the photosphere back to its original position, including landmarks; (F) projection onto the unit sphere of the registered input image, after Procrustes transformation and equirectangular projection; (G) incorporation of the deformed input image into the original photosphere; and (H) binocular rendering for head-mounted display (HMD).
Sustainability 11 03894 g002
Figure 3. Problems related to parallax when points of interest A, B, C, are located on an irregular surface. A’, B’, C’ and A’’, B’’, C’’ correspond to the projection of A, B, C on the horizontal plane from viewpoint 1 and viewpoint 2, respectively. The distance ratios between A’, B’, C’, or between A’’, B’’, C’’ are not proportionate to those between A’’’, B’’’, C’’’, corresponding to the orthographic projection of A, B, and C on the map to be registered.
Sustainability 11 03894 g003
Figure 4. Workflow for registering planar documentation on irregular surfaces. (A) Original equirectangular image with the center of interest at the South Pole; (B1) stereographic projection (target image) with 87 control points (0–86); (B2) input image (here an automatic delineation of stones forming the monument) with the 87 corresponding control points (0–86); (C) deformation of the input image by thin plate splines (TPS); (D) projection onto the unit sphere of the registered input image after TPS transformation, and equirectangular projection; (E) incorporation of the deformed input image into the original photosphere; and (F) binocular rendering for HMD.
Sustainability 11 03894 g004
Figure 5. Optimal position of the #22 stela showing landmarks on the model (A’, B’, C’, D’) and their counterparts on the photosphere (A, B, C, D), with O as the center of the sphere.
Sustainability 11 03894 g005
Figure 6. (A) Original equirectangular image displaying the S22 stela in the Tsatsiin Ereg landscape; (B) equirectangular image obtained after orientating the S22 stela, and projecting the parts visible after treatment by ambient occlusion.
Sustainability 11 03894 g006

