Article

Roadmapping to Enhance Local Food Supply: Case Study of a City-Region in Austria

1
Institute of Applied Production Sciences, Sustainable Food Management, FH JOANNEUM University of Applied Sciences, Eggenberger Allee 11, 8020 Graz, Austria
2
Institute of Systems Sciences, Innovation and Sustainability Research, University of Graz, Merangasse 18/1, 8010 Graz, Austria
*
Author to whom correspondence should be addressed.
Sustainability 2019, 11(14), 3876; https://doi.org/10.3390/su11143876
Submission received: 15 June 2019 / Revised: 11 July 2019 / Accepted: 12 July 2019 / Published: 17 July 2019
(This article belongs to the Special Issue Systems Approaches to Complex and Sustainable Food Systems)

Abstract

:
Due to the current challenges of climate change, population growth in urban settlements and resource depletion, agri-food researchers have put an increasing emphasis on the sustainability transitions of food systems. In this regard, there has been an increasing interest in the local food supply of cities and their surrounding regions, as local food is considered to be a contributing factor toward more sustainable, resilient and just urban food systems. Based on this background, a roadmapping process was conducted to assess the status quo and to identify measures to enhance the local food supply in the city-region of Graz in Austria. We conducted semi-structured interviews with 47 stakeholders, analysed textual materials and calculated food carrying capacities. The obtained data served as input for a series of three workshops, where measures were derived. Our results suggest that cooperation among agri-food stakeholders should be facilitated by local decision makers in order to promote food from regional sources within the target area. Furthermore, smart technologies can help to scale-up local food supply schemes, and to track down food stocks and flows more efficiently. Besides, food policy councils and open food labs can help to incubate food product innovations and to support partnerships among agri-food stakeholders, including local small-scale farmers. In the future, engagement and empowerment processes with local food stakeholders should be addressed to enable transformational processes. Roadmaps can help to initiate such processes.

1. Introduction

Agri-food researchers agree that urban food systems need to undergo a transition toward sustainability to equally tackle economic, social and ecological obstacles that are caused by a set of intersecting challenges, including climate change, population growth, ecosystem degradation, social inequalities, price volatilities, water scarcity and biodiversity loss [1]. Therefore, lately, increasing attention has been on assessing and planning more sustainable and resilient urban food systems [2,3,4]. In this respect, conceptual links between city planning and urban food system research have also been investigated under the “smart food city” framework [5].
From a consumer perspective, the data indicates that in Western countries consumers have been increasingly concerned about food-related social, ecological and economic problems [6]. In particular, short food supply chains (SFSC) gained momentum because they are promising to enhance food safety, social capital and local economies and to strengthen consumer-producer relations [7]. In this regard, the European Union has also put local food systems on their agri-political agenda (e.g., see [6,8]).
“Sustainable consumers” have altered their demands in favour of local and regional agricultural products due to growing consumers’ mistrust in the globalized agri-food system. This provided incentives for producers to establish alternative forms of local food supply schemes such as box schemes, community supported agricultures, direct marketing and farmer markets [9]. Hence, consumption shifts from “food from nowhere” (i.e., food from mainstream food supply chains) to “food from here” (i.e., food from alternative food supply chains) [10] were favoured by the re-creation of forms of relational proximity between consumers and producers, especially in urban regions [11]. Indeed, there is a rich potential for urban regions in Europe to increase the local food supply [12].
Furthermore, to address food-related challenges, several cities in Anglo-American countries have introduced food policies. Cities such as Toronto, London and New York started to integrate food topics into urban planning schemes [2,4]. In Europe, a growing number of cities have also indicated interests into the integration of food issues in urban political agendas. One reason for the rise of urban food policies is international declarations such as the Milan Urban Food Policy Pact, which promote local food systems in city governments [4].
While the early literature on local food supply has focused on the mere descriptions of food flows, more elaborated approaches and conceptual tools gained momentum over the previous years. Concepts such as alternative food networks, foodshed analysis and city-region food systems (CRFS) moved beyond the description and analysis of local food flows and focused on the interactions of local food resource flows with multiple actors of urban settlements, including consumers, representatives of political agencies and food activists [13]. CRFS focuses on relationships between cities and their surrounding areas and makes use of territorial approaches from rural studies, the concept of foodsheds, urban food governance literature and empirical observations of food policy initiatives [14].
Thus, research on urban food systems is increasingly concerned with assessing potentials for cities to “localize” their food supply through their surrounding areas [15,16]. However, approaches of how targeted measures can be put into place based on a stakeholder-driven process with local food actors are not described in the literature so far.
Based on this background, we present a case study that used a multi-stakeholder roadmapping approach to identify measures for enhancing the local food supply of a city-region in Austria. The research process was guided by the question of how a resource-efficient local food supply may be enhanced in the target area. To support our roadmapping process with data, we analyzed textual materials, including national and international reference projects on the local food supply in urban areas and conducted semi-structured interviews with multiple local agri-food stakeholders. Furthermore, we calculated territorial food-carrying capacities by means of food self-sufficiency rates (FSSR) for seven food items. Finally, a set of measures that were considered as promising to enhance the local food supply in the prospective years within the target area has been derived with and evaluated by local agri-food stakeholders.
The subsequent sections of this article are organized as follows: Section 2 continues with a description of the case study area and states the methodological approach and the research process. Section 3 presents the main results of the research process. Section 4 discusses the results by referring to the current agri-food literature and concludes the article.

2. Materials and Methods

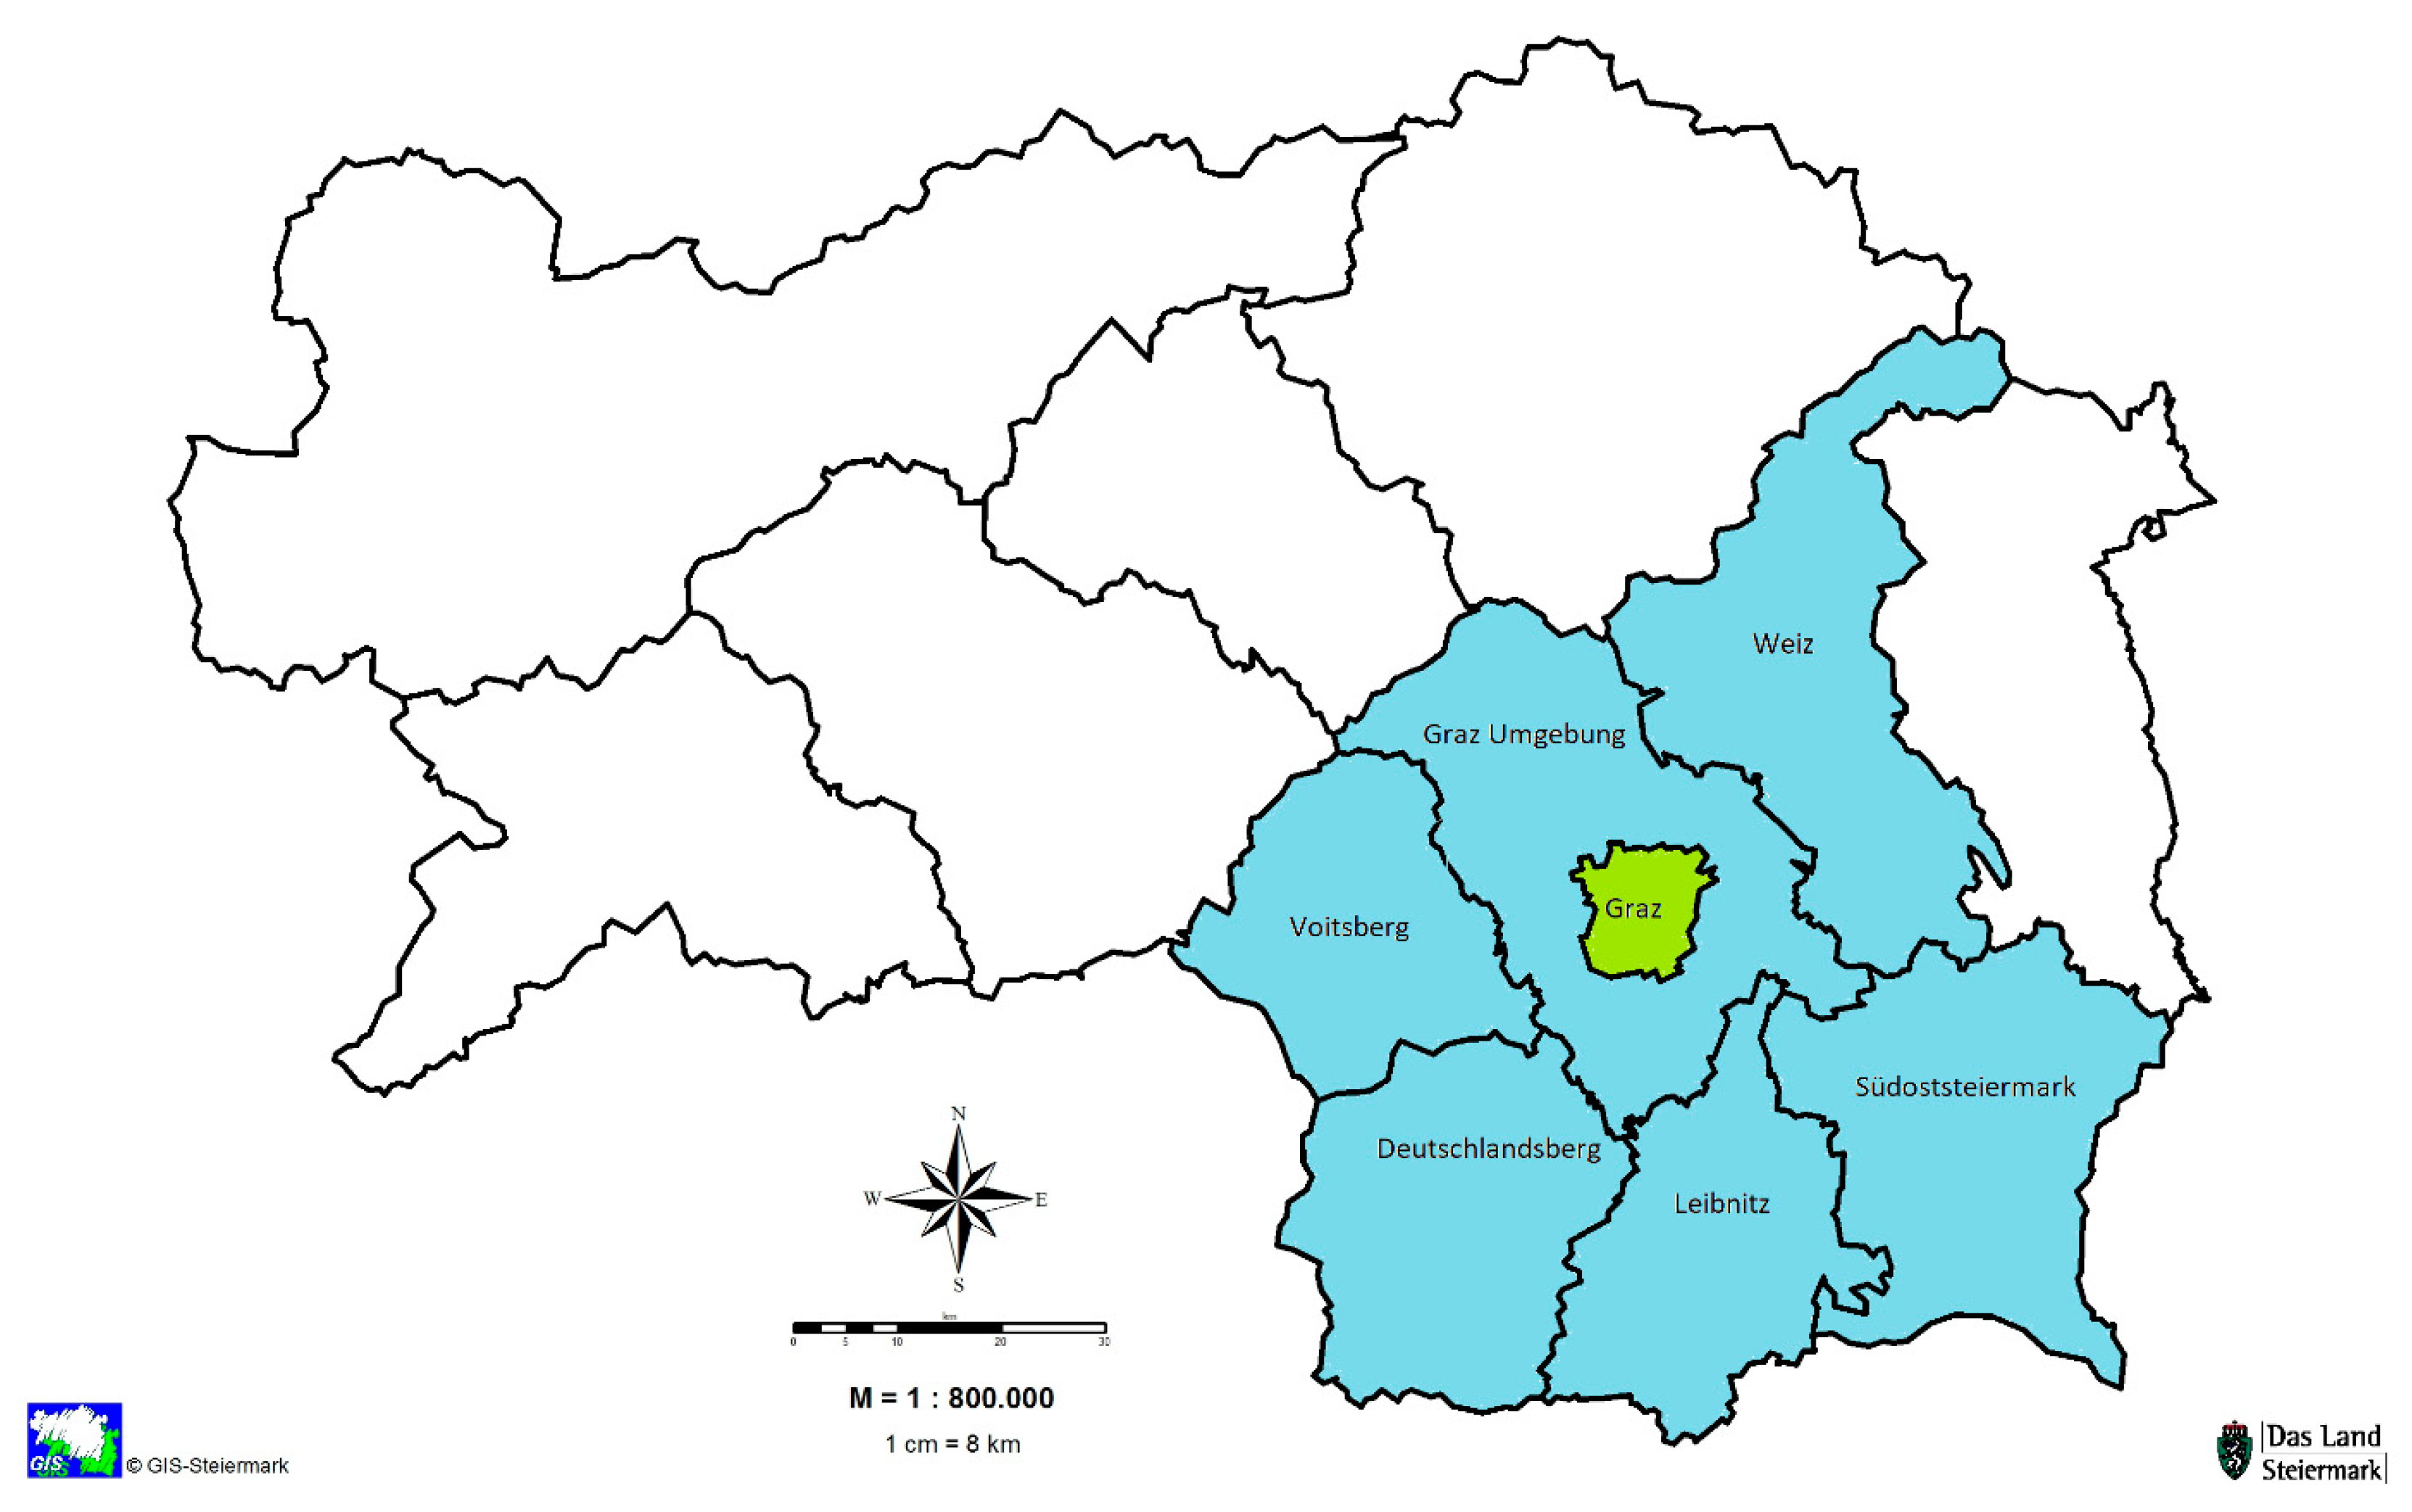
2.1. Case Study Area

The case study was situated in the Austrian federal state Styria. It involved the Styrian capital city Graz and its surrounding districts Graz Umgebung, Voitsberg, Deutschlandsberg, Leibnitz, Südoststeiermark and Weiz (Figure 1). The landscape of the target area is diverse, and includes hilly uplands (Deutschlandsberg), flatlands with urban and sub-urban characteristics (i.e., Basin of Graz) and rural, alpine and semi-alpine landscapes (Weiz, Graz-Umgebung, and Voitsberg). During summer, the climatic conditions are mild due to Mediterranean weather influences from the south and east. Therefore, maize is the dominant crop type in the southern parts of the target region.
Animal husbandry is an important feature within the target area, which is dominated by pig farming. In 2018, almost 40 percent of the Austrian pig meat production came from Styria. Besides, the area is known for its high-quality food production, including wine (Welschriesling, vitis vinifera L.), an intensive production of apples (including Arlet, Kronprinz Rudolf, Topaz, Jonagold, and Elstar) and “Styrian pumpkin seed oil Protected Geographical Indication” (Cucurbita pepo var. Styriaca L.).
The city of Graz is Austria’s second largest city with 282,292 inhabitants (January 2018). Currently, it is the fastest growing city in Austria due to rural-urban migration trends. If past population trends will continue, the population will increase by 50,000 people until 2030 [17]. In previous years, agriculture in Styria underwent notable structural changes. From 1999 to 2010, the number of farms dropped from 24,903 to 18,313. Besides, from 2003 to 2015 the agricultural land use declined from 490,150 to 372,655 hectares. In 2013, 60.7 percent of the farms were run as secondary occupations, and 78 percent of farm employees were family members. Besides, 68 percent of farm owners were older than 45 years. This indicates that, similar to other regions in Europe, the area will likely experience a loss of family-run small scale farms in the upcoming years [18]. Structural changes in the agricultural landscape combined with rural-urban migration trends call for effective measures to enable a sustainable urban food system.
Styria is referred as the “Green Heart” of Austria because 61.4 percent of its land is covered with forest. Consequently, forestry is the dominant farm type in the case study area (32% of all farms), followed by crop cultivation (21%), orcharding (including apples, pears, peaches, apricots and berries) (14%), permanent crops (12%), mixed agriculture including meat and milk production (10%), food refinement (10%), horticulture (1%) and other agricultural types such as community-supported agriculture (0.2%). In 2013, 196,630 hectares of land were devoted to agricultural land use within the case study area, which is subdivided into cropland (48%), permanent grassland (45%) and permanent crop land (7%).
Several strategies and actions have been implemented in the case study area to promote the local food supply. For instance, since 2008, 30 restaurants take part in the marketing strategy called “Genusshauptstadt”, which aims to increase the use of local products in local restaurants. Besides, umbrella marketing brands such as “Genuss Region Steiermark” and “Gutes vom Bauernhof” aim to raise the attention of consumers toward locally produced food products. The latter is a nation-wide direct marketing label, under which farmers can promote local food products. It guarantees consumers that branded products originate from and are processed by local farmers. In Austria, more than 1700 farmers are part of this direct marketing strategy, of which 578 are situated in the case study area. This indicates that direct marketing is an important income source for local farmers.

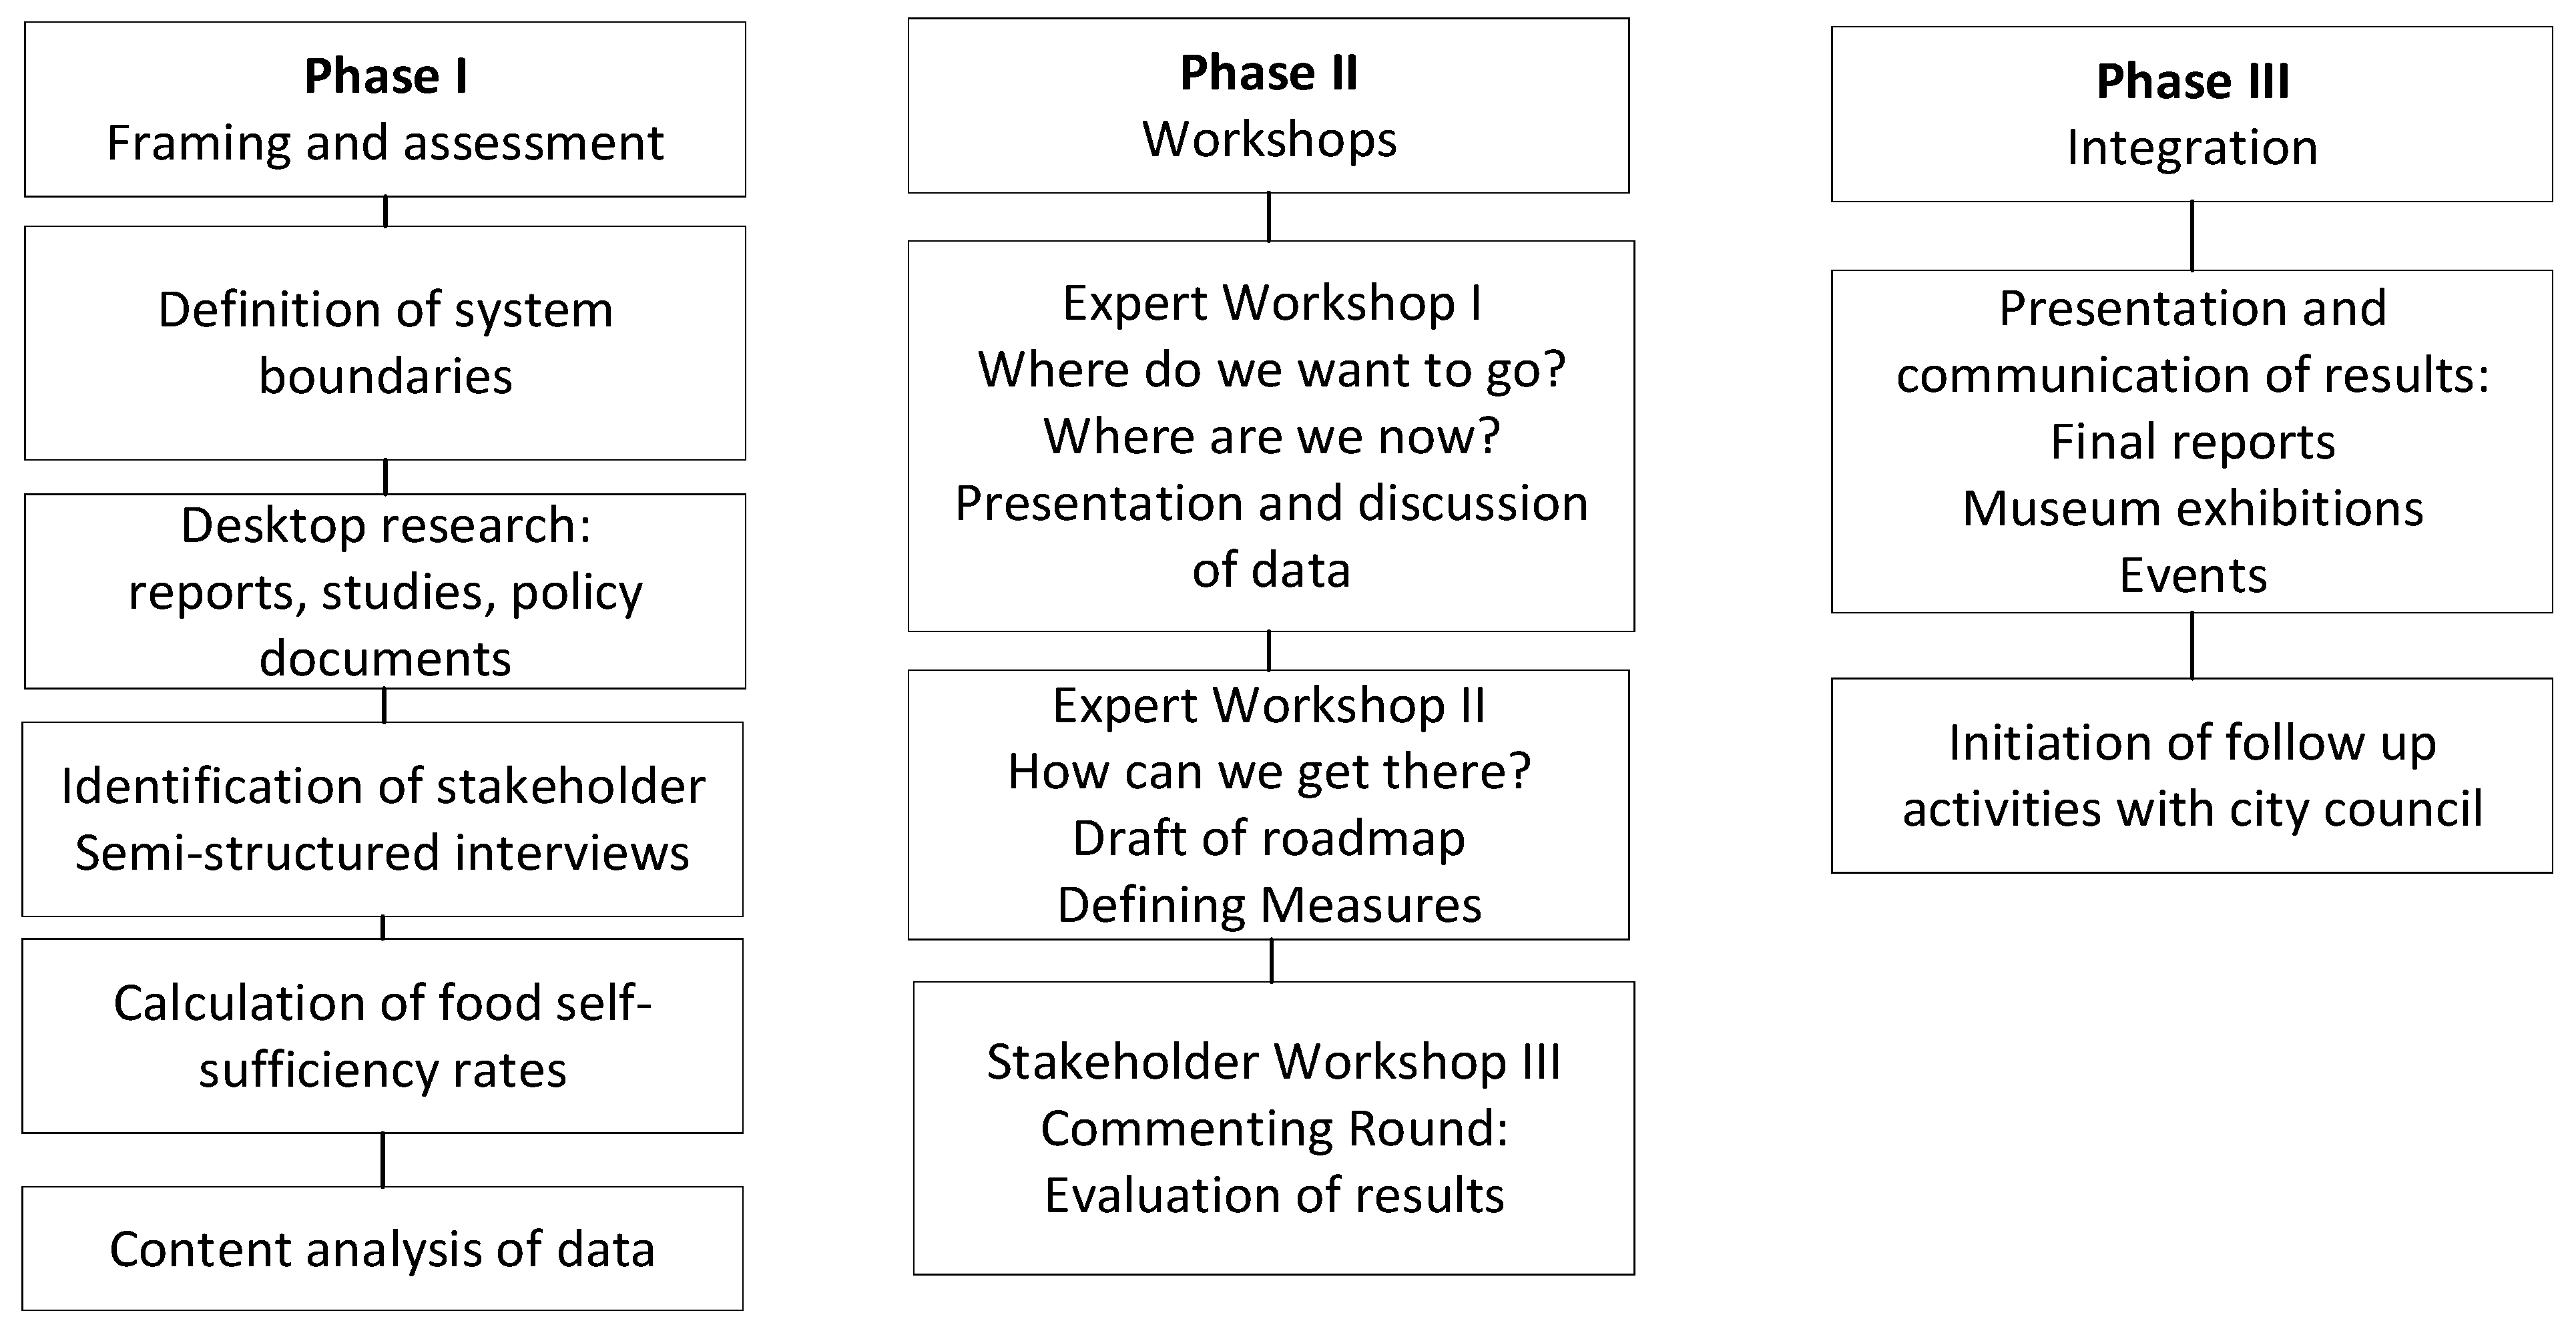
2.2. Method: Roadmapping

We based our methodologic approach on technology roadmapping (TRM). TRM is a flexible planning and assessment method that has been used to support strategic and long-term planning in organizational settings reaching from small-scale enterprises to large-scale government policy projects [19]. The origin of the approach can be traced back to the 1970s, when Motorola took up the approach from the automotive sector and used it to balance short and long-term issues of different disciplines within their company [20]. In general, Phaal et al. (2004) [21] distinguish two perspectives where TRM is applicable: (1) A single company’s perspective, where roadmapping allows the integration of technology developments with business planning and the assessment of the impact of technologies and market developments; (2) A multi-organizational perspective, where TRM is used to understand environmental landscapes, threats and opportunities for a specific group of stakeholders, a particular technology or a particular system (e.g., [22,23,24]). In the latter context, TRM has been used to map transitions of entire systems, including macro-ecological factors such as policy, infrastructural and regulatory developments [25]. Our TRM approach is centered in the latter domain, for we aimed to identify strategic measures that can contribute to a transition of an urban food system toward an enhanced local and resource-efficient food supply.
No commonly held definition of TRM exists [26]. Nevertheless, most roadmapping approaches have three stages in common. First, in the initiation stage the purpose and frame of the roadmap is defined. This includes the development of an understanding of the current situation and the identification, selection and integration of appropriate stakeholders and experts into the research process. Second, in the engagement stage workshops are used to synthesize the data into pathways and strategic measures. Third, the follow-up phase integrates the results of the process into current activities. Three questions lead a TRM process: (1) Where do we want to go? (2) Where are we now? and (3) How can we get there? [19,21,27]. Our roadmapping approach followed these basic steps and is shown with more details in Figure 2.
The first phase involved an assessment of the baseline conditions through the analysis of local food carrying capacities, semi-structured stakeholder interviews and documents. The obtained data represented the basis for a series of three workshops, where the roadmap was compiled, and measures were derived. During the third phase, we used the roadmap to communicate results of the process science to the public via museum exhibitions and multiplier events. In addition, we presented the roadmap and results of the research process to local authorities, which led to follow-up activities.

2.3. Materials: Roadmapping Framing

We considered three types of data to assess the status quo of the target food system: (I) the data from the assessment of textual materials, including project reports, best practice examples, national and international reference projects, and academic and government reports that focused on enhancing the local food supply in urban areas; (II) the data from semi-structured stakeholder interviews; and (III) the calculation of food self-sufficiency rates. The subsequent paragraphs will briefly describe the interviewing and content analysis approach. Furthermore, the calculated food self-sufficiency rates and interpretation for the food region will be stated.

2.3.1. Stakeholder Interviews and Textual Materials

We aimed to include agri-food stakeholders from diverse backgrounds in our research. Prior to the interviews, we defined nine stakeholder categories. The categories of (1) agricultural production, (2) food processing, (3) logistics and infrastructure, (4) distribution and marketing and (5) consumers referred to stakeholders as part of the agri-food chain. The categories of (6) environment and natural resources, (7) economics, (8) society and education, (9) science and (10) politics and administration were used to include perspectives of macro-environmental stakeholders into the process.
Based on these categories, a list of 174 stakeholders was gathered. It contained persons that occupied a key role in their respective category. We prioritized stakeholders that either had a multiplier role and/or were decisions makers. This allowed us to narrow down the list to 60 persons, who were contacted. Finally, 47 semi-structured interviews that took between 30 and 60 min have been conducted. Note that the goal of the interviews was not to achieve a statistically representative sample, but to gain a comprehensive picture about opinions, ideas and perception toward enhancing the local food supply within the target area. Table 1 states the stakeholder categories and the number of stakeholders interviewed per category. Note that the stakeholder category “Science” consisted of researchers with different backgrounds such as food technologies, resource management and sustainability sciences, and the stakeholder category “Agricultural Production” consisted of farmers that held different farm types.
Prior to the interviews, we developed an interview guideline that consisted of three parts. The first part involved questions about known initiatives and activities that have been established or have been planned to support the local food supply within the target area. The second part involved questions on the strengths and weaknesses of the current local food supply status. Finally, we asked stakeholders about factors that might hinder or facilitate the local food supply in upcoming years. In addition, we conducted a content analysis of national and international reference initiatives, projects, publications, and official policy documents. We included textual materials in the domain of agriculture, food, environment and planning at the federal and local levels that focused on local food supply provision.
We conducted a qualitative content analysis based on Mayring (2010) [28]. In a first step, we reduced the textual materials and semi-structured interview to 1061 paraphrases that were linked to improve the local food supply. In a second step, we categorized the paraphrases into five categories and 39 topics. The categories are: (1) cooperation of stakeholders, (2) acceptance of regional food, (3) availability of resources, (4) logistics and (5) political measures (see Appendix A).

2.3.2. Local Food Self-Sufficiency Rates

To increase the sustainability and resilience of food systems, knowledge about territorial food carrying capacities should exist [29]. Therefore, we calculated the food self-sufficiency rates for seven food items: (1) vegetables, (2) fruits, (3) wheat, (4) milk, (5) meat, (6) eggs and (7) fish. These food items were chosen because they represent basic food items of standard food pyramids (e.g., see [30]). We defined the city-region to be food self-sufficient when its total production suffices to meet its total consumption for the respective food item.
The data on the actual regional food production was available for milk. For the food items vegetables, fruits and crops, we multiplied the cultivated land area in hectares by the average annual yields in tons per hectare. The data on the average yields were obtained from the local Chamber of Agriculture and from the local agency of statistics [31]. When the data was missing or of poor quality, telephone interviews with experts were conducted.
To calculate the annual production of eggs, we took the number of lay-hens and multiplied it by the annual laying performance according to Hegelund et al. (2006) [32]. Note that Hegelund et al. (2006) [32] considered only organic and free-range lay-hens in Denmark in their study (i.e., lay-hens from cage systems were excluded). As lay-hens in cage systems make up only one percent of the total egg production in Austria, the laying performances used can be assumed to resemble the actual laying performances of lay-hens in Austria.
The total annual meat production was calculated by the total number of animals slaughtered in 2015 in kg multiplied by their edible shares according to Statistik Austria (2016) [33]. For fish, the data was only available at the national level. In 2015, the Austrian aquaculture had a total production of 3503 tons of fish meat, which is contrasted by an estimated national consumption for fish of about 63,000 tons or an annual per capita consumption of 7.25 kg of fish meat. To calculate the total regional food consumption, we took the average Austrian per capita consumption of the past 5 years (2011–2015) for each food item and multiplied it by the number of persons living in the area in 2015. The resulting production and consumption capacities are provided in Table 2.
The FSSR were calculated as the quotient of production divided by consumption (see Table 3 for the resulting FSSR). The FSSR for the year 2030 were extrapolated by applying the future projected number of the local population [17]. Note that in our calculations we assumed that the production and per capita consumption do not change over time. Besides, food exports, food imports and food waste along the food supply chain were not included in our calculations.

2.3.3. FSSR and Interpretation

We found that the city-region would be self-sufficient for the food items fruit (325%) and eggs (100%). An explanation of why the area has an exceptional high fruit SSR is that in the eastern part of the city-region (i.e., district Weiz), the climatic conditions are particularly suitable for the cultivation of apples. Approximately 80 percent of the total apple production in Austria originates from this district. In contrast to this, the SSR for vegetables (26%) and crop (38%) were comparably small. The reasons for this are topographical limitations within the case study area, i.e., hilly and semi-alpine landscapes that make the large-scale cultivations of vegetables less favourable. Besides, a significant share of land is used for the cultivation of crop for feedstuff (approx. 533,386 tons in 2015). The SSR for milk (59%) was smaller compared to the national FSSR rates (162%), since milk is traditionally produced in Austria in alpine regions. We assumed the FSSR for fish to be less than five percent, since only a few small-scale fish farms are registered in the target area.
In addition to these calculations, we were also interested in whether the FSSR change if the target population would follow national dietary recommendations. Therefore, we calculated the average annual per capita consumption based on the recommended daily food intake of the Austrian national food report and divided it by the current food reference production. The resulting FSSR are presented in Table 3 with an asterisk.
For crop, the FSSR would not significantly change, whereas the meat-SSR would increase from 45 percent to 151 percent and the egg-SSR from 100 percent to 151 percent. This did not come as a surprise because, according to the FAO, the Austrian daily caloric per capita intake is amongst the highest on the globe (approx. 3800 kcal), where animal-based food products make up a significant share of the total calories consumed. Interestingly, however, the same does not hold for the milk-SSR. In fact, our calculations revealed that the SSR would decrease from 59 percent to 40 percent. An explanation is that according to Elmadfa (2012) the Austrian population consumes less milk than recommended. Thus, if the regional population would follow the national dietary recommendations, the FSSR would drop from 59 percent to 40 percent, and the items vegetables’ and fruits’ FSSR would both decrease (vegetables from 26% to 17%, and fruit from 325% to 247%).
The calculation of the FSSR together with the assessment of the textual materials and interviews helped participants of the workshops to receive a rich picture and understanding of the status quo of the target region.

2.4. Workshops

Over the course of three days, three moderated expert workshops took place. We (i.e., the authors of the paper), together with five food experts, took part in these workshops. These meetings allowed participants to articulate their perceptions over the previously gathered data. During the first workshop, we presented a summary of the collected and assessed data. Based on the obtained data, the two questions “Where do we want to go?” (i.e., toward an enhanced local food supply within the case-study area) and “Where are we now?” were addressed (Figure 2). Factors for a transformation of the target system toward a more local food system were discussed. During the second workshop, the participants were split into two groups. Each group was asked to locate the 39 topics on the roadmap structure and to draw relations to other measures where applicable. Elements of design thinking and storytelling were used to articulate measures and to visualize potential roadmap pathways. Subsequently, participants of one group were asked to annotate the results of the other group. The second workshop ended with a prototype version of the roadmap. During the third workshop, 18 agri-food stakeholders were invited to evaluate the roadmap and its proposed measures. Feedback from the third workshop was incorporated into revisions for the final roadmap. The final roadmap consisted of five measures: (1) food dialogue, (2) market basket for local food, (3) farmer markets 2.0, (4) open food innovation labs and (5) food policy council.

3. Results

Our roadmapping approach resulted in a wide range of factors including economic incentives, social awareness, policy measures, educational approaches, and technological and socio-technological innovations that were perceived to be pivotal to transform the target food system from the current state to a more local and resource-efficient state. We summarized these factors in five topics, which will be presented in what follows.

3.1. Stakeholder Cooperation

During the stakeholder interviews a reoccurring topic was the lack of cooperation between the multiple stakeholders of the food system. This is illustrated by the following two examples. When chefs of communal kitchens were asked about reasons that prevent them from increasing the share of local food products on their menu, they stated that either farmers cannot provide sufficient quantities of the required products over extended time periods, or they cannot provide food in the required qualities (e.g., to fulfil hygienic standards; standards with respect to the size such as pre-cut salads; standards for cook-and-chill kitchen systems). In contrast to this, it was found either that farmers were unaware of these requirements or that they did not want to participate in cooperation schemes. They stated reservations such as a mistrust in collaboration schemes with other farmers or they perceived the dependency on single purchasers as being critical.
Furthermore, it was frequently mentioned that a common marketing strategy should exist to promote local food more efficiently to consumers. Currently, too many marketing approaches such as labels and platforms exist, which is a source of confusion for consumers as they rather wish to derive information from single sources. Consequently, local food marketing actors should work out a common marketing strategy for the city-region.
Based on this background, “food dialogue” was identified as a central measure. It is understood as a participatory instrument to facilitate the communication between multiple agri-food actors, including local food producers, distributers, retailers and consumers. Such dialogues bring together local food actors to address food supply topics at multiple scales. For instance, food dialogues can discuss innovative direct marketing strategies for small-scale farmers, or work out plans for unique food distribution schemes (e.g., farm-to-school concepts). These dialogues should be supported by local authorities (e.g., in terms of physical resources such as providing rooms and equipment) and be announced on platforms and local newspapers to encourage local citizens to participate. Thus, food dialogues can be approached as socio-economic, intellectual and political spaces. Such spaces are critical factors to support the establishments of sustainable food systems [38].

3.2. Urban Food Governance

During the interviews and workshops, a political will to transform the local food system was considered as a crucial component to strategically alter the food system in favour of a local and sustainable food supply. As a result, a food policy council (FPC) was proposed. FPCs are an democratic instrument to manage food issues at the local, state and regional levels by involving a wide range of private and public stakeholders [39]. They are usually constituted by a group of representatives from various domains, such as government officials, farmers, grocers, business people and members of NGOs [40].
Several domains have been stated where an FPC would be able to set measures to facilitate food localisation in the city-region. For instance, when confronted with the fact that in previous years the agricultural land use was declining in the city-region, it was noted that food should become an element in local spatial plans. In this context, an FPC would be able to counteract the loss of agricultural land by implementing measures such as a “food cadaster” that conserves land for food production. Another political measure an FPC can address is public food procurement strategies. For instance, in tendering processes, incentives to favour local food should be established. Considering that food purchasing and catering services make up a significant share of public procurement budgets [41], increasing the share of locally produced food products in hospitals, schools and companies can help to increase the sustainability of the national public sector procurements strategies.
A specific challenge that stakeholders identified was to increase the consumption of local food among all social classes. As such, it was critically noted that local food must be made more accessible to economically less privileged people. How this can be done is illustrated in the case of New York. The city has implemented a food stamp programme that allowed recipients of federal food benefits the practice of shopping at farmers’ markets [42]. Additionally, an FPC would also allow the city-region to link food topics with other city planning schemes such as smart city concepts.

3.3. Market Basket for Local Food

The calculation of the FSSR provided insights into theoretical local food carrying capacities. In this regard, during the workshops, it was discussed that strategically planning and managing a transition of the target food system toward more local and sustainable food practices would require the establishment of an instrument that elicits consumer-producer data and quantifies local food stocks and flows. Therefore, in reference to the market basket of consumer goods, a market basket for local food has been proposed. The basket consists of typical locally produced food products, and it monitors prices and quantities. Furthermore, to promote sustainable food consumption patterns, a reference basket should be defined in accordance with the recommendations of a healthy and environmentally friendly diet. This can help to link the health information of food pyramids with information about locally and seasonally available food products. In addition, during our research we found that empirical data on the actual share of local products consumed in the city-region do not exist. Moschitz et al. (2015) [43] have estimated that, for the city of Freiburg, Germany (i.e., a city with similar spatial extensions as Graz), local food makes up 12 to 23 percent of the total calories consumed in the region. A monitoring scheme such as the market basket can help to track down food stocks and flows more accurately within city-regions.

3.4. Scaling-Up Farmer Markets

Stakeholders perceived existing farmer markets as vital elements for the local food supply in the target city. At the same time, it was noted that traditional farmer market concepts should be scaled up to capture the increasing consumer demands and public interest into buying local food products. This would help to increase market access for small scale farmers. In this regard, a series of topics and measures have been named, which were summarized under the heading “farmer markets 2.0”. Here, 2.0 denotes the opinion of stakeholders that ICT and smart technologies, such as data-driven food distribution systems, can play an important role in the local food supply schemes of future cities. This is exemplified by the following examples.
First, farmer markets should be physically and economically scaled up in terms of logistics. Measures such as the installation of pick-up box systems allow consumers to buy local food regardless of the opening hours of farmer markets. These box schemes can be combined with web-based solutions so that consumers can order food from any place, and thus they add flexibility to the practice of buying local food. Furthermore, storerooms could be implemented by local municipalities so that farmers can store their products and reduce travel frequencies to the point of sale. In addition, smart transport systems for consumers to target the last mile problem could be considered. For instance, markets can be connected to soft mobility measures such as rentable cargo bikes. This can help cities to facilitate more ecologically sound modes of traffic.
Second, scaled-up farmer markets can operate in a similar way to food logistic hubs, where the food products of small-and medium sized farmers are pooled and delivered to communal kitchens, universities and wholesale markets. In North America, food-hub schemes have proven to be beneficial in promoting locality in cities and their hinterlands [44].
Besides, scaling-up was not only considered in terms of technological innovations, but also with reference to social-technological innovations as well. Additional physical infrastructure such as seminar rooms and shared kitchens concepts, where consumers can get in contact with farmers in other ways than buying food, were considered as enablers for more intimate consumer-producer interactions. In that way, farmer markets can operate as multifunctional socio-economic spaces, where unique food practices can emerge through the interaction of diverse stakeholders. To sum up, scaling up farmer markets was perceived as an opportunity to link the advantages of conventional and alternative food systems by making local food more accessible, enhancing economic profit and creating distinctive forms of interactions among food stakeholders.

3.5. Incubating Food Innovations

A dominant barrier to increasing the market access of small farms is the declining share of profits. As a consequence, agricultural abandonment has been named as a major challenge within the case study area. Therefore, stakeholders emphasized that supporting farmers in building economically more viable businesses is inevitable if one wants to counteract the loss of small- and medium-sized farms. The creation of innovative local food products would help to attract more consumers and, thus, contribute to the economic stability of their businesses. However, small farms often lack the economic resources and knowledge to experiment for novel food products. To address this challenge, “open food labs” that offer technologies, resources and knowledge, for instance to local farmers and start-ups, so that they can design, process and market unique local food products, have been proposed as a strategic measure. Open food labs can function as “protected spaces”, where entrepreneurs experiment for novel product innovations, while at the same time reducing financial risks. In these labs, farmers can collaborate with other food actors, including scientists, students and entrepreneurs, to engage in learning processes. The conditions for scaling-up food innovations can be created by establishing a network of actors such as farmers, food scientists and entrepreneurs who share the debate for new marketing approaches and who mutually learn from each other.

4. Discussion and Conclusions

We integrated perspectives of multiple agri-food stakeholders into the research process. The engagement of a broad range of stakeholders is crucial because it broadens the spectrum of issues that are addressed and supports a robustness of knowledge [45]. Besides, the data from textual materials and the calculation of local food carrying capacities served as inputs for a series of three workshops. We found that, under the current production and consumption patterns, the area is food self-sufficient for the food items fruit and eggs, and if people would follow dietary recommendations the area could be self-sufficient for meat as well. However, in our calculations we did not consider food exports, food waste along the food chain and agricultural inputs such as feed and fertilizers.
We found that a lack of cooperation between stakeholders was perceived as a significant barrier to enhance the local food supply. This is in line with the findings of Lutz et al. (2017) [46], who state that small-scale farmers often lack the time and knowledge to set up new cooperation with farmers, consumers or institutions. However, cooperation between these stakeholders can contribute significantly to an optimization of local farming and food supply systems through shared infrastructure and logistics. Respectively, we identified so-called “food dialogues” to mutually connect agri-food stakeholders and to facilitate the establishment of a local food cooperation.
Nevertheless, new forms of cooperation are likely to be insufficient when they are not embedded with the plans of local politics. In their research on local food initiatives in France, Bui et al. (2016) [47] have found that local food actors had a greater impact on the current agri-food system when their actions were linked to local authorities. To support the linking processes between public authorities and local food actors, food policy councils have been perceived as a vital element toward an enhanced local food supply. As Clayton et al. (2015) [39] note, partnerships between public authorities and local food actors can enhance actor networks, and incubate technological and organizational innovations along food value chains [48]. Consequently, FPC can support the linking of actions from the niche-level with the regime plans of local authorities in order to scale up.
The socio-demographic data of local farm holders in the case study area suggest that in the upcoming years the loss of small scale-family run farms will likely continue. To address this issue, incentives to support new market entrants and young farmers are promising because empirical observations suggest that new entrants tend to be more innovative in terms of farming types and marketing strategies and that young sole holders tend to operate economically more robust farms compared to their older counterparts [18]. Open food labs can be one way to support the entrepreneurial intentions of farmers and local food actors. As Meynard et al. (2017) [48] note, the development of niches outside the dominant socio-technical regime, where new forms of knowledge and novel partnerships amongst food actors can emerge, is a decisive factor in enabling sustainable transitions of agri-food systems. In this context, an open food lab can function as a “locus for innovation” to support experimenting for radical innovations [49,50].
When it comes down to a more sustainable and resource-efficient food distribution, data-driven food distribution and transportation systems can help city planners to quantify and manage food flows more efficiently. Furthermore, in reference to the smart city concept, we found that scaling up farmer markets in terms of smart and resource-efficient logistics can be a promising way of increasing farmers’ market access in the upcoming years within the case study area. In this regard, farmer markets can operate as regional food-hubs by bundling and distributing food resources from small-scale producers to larger-scale customers such as communal kitchens [44]. In North America, such food-hubs have been shown to be an effective alternative in order to reduce the negative externalities of conventional food chains and to increase food system sustainability [51]
The data on local food stocks and flows are sparsely available, and to address this problem a market basket for local food has been named. It is understood as a monitoring scheme to track down and manage local food flows and stocks. For instance, it can offer information for communal kitchens about the availability of local food products. Furthermore, it can help institutions such as the Chamber of Agriculture to manage food resources and make food statistics transparent. Besides, the market basket was understood as a way to promote healthy dietary patterns, and it should be defined in accordance with the recommendations for a sustainable and healthy diet (e.g., see [30]).
Follow-up activities constituted the third phase in our roadmapping approach. As Ahlqvist et al. (2010) [52] point out, a particular advantage of roadmaps is their visual emphasis, which allows to describe elements of future developments of a topic under investigation almost with a single glance. Therefore, the final roadmap was used to disseminate the results of the research to local authorities and to local citizens via public events such as a museum exhibition (the final roadmap can be found in Seebacher et al. (2018) [53]). In this regard, roadmaps can be considered as “knowledge umbrellas” to depict the strategies of a specific system and to engage and empower people [54].
Taking into consideration the nefarious sustainability problems in agriculture, such as climate change and environmental degradations [55], it will be crucial to propose well-grounded plans to enable sustainable transitions of agri-food systems [56]. Most importantly, as Blay-Palmer et al. (2018) [14] point out, future food systems need to increase access to food, generate decent jobs and income, increase the resilience of food chains, foster urban-rural linkages, promote the ecosystem and natural resources management, and support participatory governance to become more resilient and sustainable in the future. This article describes a case study that is a contribution in this regard.

Author Contributions

S.B. conceived the roadmapping design, elaborated the data and reviewed the manuscript, H.D. elaborated the data and wrote the manuscript, R.R. elaborated the data, conducted interviews and reviewed the manuscript, S.P. elaborated the data and reviewed the manuscript, U.S. conducted interviews, conceived the research design and reviewed the manuscript.

Funding

This research was funded by Klima- und Energiefonds, grant number K16SC0F237095. The APC was funded by state Styria, Austria, Abteilung 8 Gesundheit, Pflege und Wissenschaft, Referat für Wissenschaft und Forschung. please add.

Conflicts of Interest

The authors declare no conflict of interest. The funders had no role in the design of the study; in the collection, analyses, or interpretation of data; in the writing of the manuscript, or in the decision to publish the results.

Appendix A

Table A1. Five categories with 39 topics that resulted from the analysis of textual materials and semi-structured interviews.
CooperationAcceptanceAvailabilityLogisticsPolitics
Common local food identityPublic campaignsLand use strategy for local foodWeb-based solutionsEnhance farmers′ income
Support direct marketing of farmersCooking practices in schoolsSupport food processing and direct marketingUp-scaling of farmer marketsSubsidize healthy and sustainable nutrition
Food policy councilsBest practice farms Climate change adaptation strategiesEnhance local food logistics Financial incentives to buy local
Coordination centre for food policiesTransfer of knowledge between producer and consumersFood security in times of crisisMobility concepts for local foodChange rules for public procurement
Link producers with consumersTransparency of costsIncreasing demand for local food productsCoordinate local food supply for communal kitchensLink top down and bottom up approaches
Common food processing and marketing strategiesReduce meat consumptionReduce local food bottlenecks Support collaborations between farmers and larger customersReduces bureaucracy for small-scale farmers
Reduce reservations for cooperationIncrease local food consumption in all social classesMonitoring schemeFood hubs in districtsEmbed food in planning schemes
Support public participationPrice incentives
Create open food spacesFeasibility studies

References

  1. El Bilali, H. Transition heuristic frameworks in research on agro-food sustainability transitions. Environ. Dev. Sustain. 2018, 9, 332. [Google Scholar] [CrossRef]
  2. Morgan, K. Feeding the City: The Challenge of Urban Food Planning. Int. Plan. Stud. 2009, 14, 341–348. [Google Scholar] [CrossRef]
  3. Karg, H.; Drechsel, P.; Akoto-Danso, E.; Glaser, R.; Nyarko, G.; Buerkert, A. Foodsheds and City Region Food Systems in Two West African Cities. Sustainability 2016, 8, 1175. [Google Scholar] [CrossRef]
  4. Dubbeling, M.; Santini, G.; Renting, H.; Taguchi, M.; Lançon, L.; Zuluaga, J.; de Paoli, L.; Rodriguez, A.; Andino, V. Assessing and Planning Sustainable City Region Food Systems: Insights from Two Latin American Cities. Sustainability 2017, 9, 1455. [Google Scholar] [CrossRef]
  5. Maye, D. ‘Smart food city’: Conceptual relations between smart city planning, urban food systems and innovation theory. City Cult. Soc. 2018. [Google Scholar] [CrossRef]
  6. Kneafsey, M.; Eyden-Wood, T.; Bos, E.; Sutton, G.; Venn, L.; Schmutz, U.; Balázs, B.; Trenchard, L.; Blackett, M. Short Food Supply Chains and Local Food Systems in the EU. A State of Play of Their Socio-Economic Characteristics; Publications Office: Luxembourg, 2013; ISBN 978-92-79-29288-0. [Google Scholar]
  7. Edwards-Jones, G. Does eating local food reduce the environmental impact of food production and enhance consumer health? Proc. Nutr. Soc. 2010, 69, 582–591. [Google Scholar] [CrossRef] [Green Version]
  8. Dwarshuis-Van De Beek, L. Opinion of the Committee of the Regions on ‘Local Food Systems’ (Outlook Opinion). Available online: https://eur-lex.europa.eu/legal-content/EN/TXT/?uri=CELEX%3A52010AR0341 (accessed on 11 July 2019).
  9. Aubry, C.; Kebir, L. Shortening food supply chains: A means for maintaining agriculture close to urban areas? The case of the French metropolitan area of Paris. Food Policy 2013, 41, 85–93. [Google Scholar] [CrossRef]
  10. Schermer, M. From “Food from Nowhere” to “Food from Here:” changing producer–consumer relations in Austria. Agric. Hum. Values 2015, 32, 121–132. [Google Scholar] [CrossRef]
  11. Jarosz, L. The city in the country: Growing alternative food networks in Metropolitan areas. J. Rural Stud. 2008, 24, 231–244. [Google Scholar] [CrossRef]
  12. Pradhan, P.; Lüdeke, M.K.B.; Reusser, D.E.; Kropp, J.P. Food self-sufficiency across scales: How local can we go? Environ. Sci. Technol. 2014, 48, 9463–9470. [Google Scholar] [CrossRef]
  13. Blay-Palmer, A.; Landman, K.; Knezevic, I.; Hayhurst, R. Constructing resilient, transformative communities through sustainable “food hubs”. Local Environ. 2013, 18, 521–528. [Google Scholar] [CrossRef]
  14. Blay-Palmer, A.; Santini, G.; Dubbeling, M.; Renting, H.; Taguchi, M.; Giordano, T. Validating the City Region Food System Approach: Enacting Inclusive, Transformational City Region Food Systems. Sustainability 2018, 10, 1680. [Google Scholar] [CrossRef]
  15. Cardoso, A.S.; Domingos, T.; de Magalhães, M.R.d.; de Melo-Abreu, J.; Palma, J. Mapping the Lisbon Potential Foodshed in Ribatejo e Oeste: A Suitability and Yield Model for Assessing the Potential for Localized Food Production. Sustainability 2017, 9, 2003. [Google Scholar] [CrossRef]
  16. Peters, C.J.; Bills, N.L.; Lembo, A.J.; Wilkins, J.L.; Fick, G.W. Mapping potential foodsheds in New York State: A spatial model for evaluating the capacity to localize food production. Renew. Agric. Food Syst. 2009, 24, 72–84. [Google Scholar] [CrossRef]
  17. Steirische Statistiken. Regionale Bevölkerungsprognose Steiermark 2015/16-Bundesland, Bezirke und Gemeinden. Available online: http://www.landesentwicklung.steiermark.at/cms/dokumente/12658765_145230171/141e2d92/Publikation%205-2016-Internet.pdf (accessed on 16 July 2019).
  18. Zagata, L.; Sutherland, L.-A. Deconstructing the ‘young farmer problem in Europe’: Towards a research agenda. J. Rural Stud. 2015, 38, 39–51. [Google Scholar] [CrossRef]
  19. Möhrle, M.G.; Isenmann, R. Technologie-Roadmapping; Springer: Berlin/Heidelberg, Germany, 2008; ISBN 978-3-540-74754-3. [Google Scholar]
  20. Probert, D.; Radnor, M. Frontier Experiences from Industry-Academia Consortia. Res.-Technol. Manag. 2003, 46, 27–30. [Google Scholar] [CrossRef]
  21. Phaal, R.; Farrukh, C.J.P.; Probert, D.R. Technology roadmapping—A planning framework for evolution and revolution. Technol. Forecast. Soc. Chang. 2004, 71, 5–26. [Google Scholar] [CrossRef]
  22. Lee, S.K.; Mogi, G.; Kim, J.W. Energy technology roadmap for the next 10 years: The case of Korea. Energy Policy 2009, 37, 588–596. [Google Scholar] [CrossRef]
  23. Gallegos Rivero, A.R.; Daim, T. Technology roadmap: Cattle farming sustainability in Germany. J. Clean. Prod. 2017, 142, 4310–4326. [Google Scholar] [CrossRef]
  24. Amer, M.; Daim, T.U. Application of technology roadmaps for renewable energy sector. Technol. Forecast. Soc. Chang. 2010, 77, 1355–1370. [Google Scholar] [CrossRef]
  25. McDowall, W. Technology roadmaps for transition management: The case of hydrogen energy. Technol. Forecast. Soc. Chang. 2012, 79, 530–542. [Google Scholar] [CrossRef] [Green Version]
  26. Hussain, M.; Tapinos, E.; Knight, L. Scenario-driven roadmapping for technology foresight. Technol. Forecast. Soc. Chang. 2017, 124, 160–177. [Google Scholar] [CrossRef]
  27. Phaal, R.; Muller, G. An architectural framework for roadmapping: Towards visual strategy. Technol. Forecast. Soc. Chang. 2009, 76, 39–49. [Google Scholar] [CrossRef]
  28. Mayring, P. Qualitative Inhaltsanalyse. Grundlagen und Techniken, Neuausgabe; Beltz Verlagsgruppe: Weinheim, Germany, 2010; ISBN 9783407255334. [Google Scholar]
  29. Armendáriz, V.; Armenia, S.; Atzori, A. Systemic Analysis of Food Supply and Distribution Systems in City-Region Systems—An Examination of FAO’s Policy Guidelines towards Sustainable Agri-Food Systems. Agriculture 2016, 6, 65. [Google Scholar] [CrossRef]
  30. Fischer, C.G.; Garnett, T. Plates, Pyramids, and Planets. Developments in National Healthy and Sustainable Dietary Guidelines: A State of Play Assessment; Food and Agriculture Organization of the United Nations: Rome, Italy; The Food Climate Research Network, University of Oxford: Oxford, UK, 2016; ISBN 978-92-5-109222-4. Available online: http://www.fao.org/3/a-i5640e.pdf (accessed on 16 July 2019).
  31. Steirische Statistiken. Aktuelle Daten zur Land- und Forstwirtschaft. Available online: http://www.landesentwicklung.steiermark.at/cms/beitrag/12658776/142970621/ (accessed on 4 April 2019).
  32. Hegelund, L.; Sørensen, J.T.; Hermansen, J.E. Welfare and productivity of laying hens in commercial organic egg production systems in Denmark. NJAS Wagening. J. Life Sci. 2006, 54, 147–155. [Google Scholar] [CrossRef] [Green Version]
  33. Statistik Austria. Lebend- und Schlachtgewichte, Schlachtausbeute, Schlachtungen sowie Fleischanfall. Available online: https://www.ama.at/getattachment/c9170514-b892-46ff-9e27-f2fd74e0d9b9/220_schlachtgew_2005-2016.pdf (accessed on 3 April 2019).
  34. Statistik Austria. Versorgungsbilanzen für den pflanzlichen und tierischen Sektor. Available online: http://www.statistik.at/web_de/statistiken/wirtschaft/land_und_forstwirtschaft/preise_bilanzen/versorgungsbilanzen/index.html (accessed on 10 May 2019).
  35. BMNT. Die Aquakultur im Binnenland Österreich. Available online: https://www.bmnt.gv.at/land/produktion-maerkte/tierische-produktion/fischzucht-oe/aquakultur.html (accessed on 11 July 2019).
  36. Elmadfa, I. (Ed.) Österreichischer Ernährungsbericht 2012, 1st ed. Bundesministerium für Gesundheit: Wien, Austria, 2012; ISBN 978-3-901861-97-0.
  37. AMA. Jahresbericht Milch und Milchprodukte. Available online: https://www.ama.at/getattachment/4cefd11a-22ef-4481-9775-9a85b7da02a5/Jahresbericht_Milch_2015.pdf%20Abgerufen%20am%2022.07.2017 (accessed on 11 July 2019).
  38. Feenstra, G. Creating space for sustainable food systems: Lessons from the field. Agric. Hum. Values 2002, 19, 99–106. [Google Scholar] [CrossRef]
  39. Clayton, M.L.; Frattaroli, S.; Palmer, A.; Pollack, K.M. The role of partnerships in U.S. Food Policy Council policy activities. PLoS ONE 2015, 10, e0122870. [Google Scholar] [CrossRef]
  40. Harper, A.; Shattuck, A.; Holt-Giménez, E.; Lkon, A.; Lambrick, F. Food Policy Councils: Lessons Learned; Institute for Food and Development Policy: Oakland, CA, USA, 2009; Available online: https://www.farmlandinfo.org/sites/default/files/Food_Policy_Councils_1.pdf (accessed on 16 July 2019).
  41. Smith, J.; Andersson, G.; Gourlay, R.; Karner, S.; Mikkelsen, B.E.; Sonnino, R.; Barling, D. Balancing competing policy demands: The case of sustainable public sector food procurement. J. Clean. Prod. 2016, 112, 249–256. [Google Scholar] [CrossRef]
  42. Cohen, N.; Ilieva, R.T. Transitioning the food system: A strategic practice management approach for cities. Environ. Innov. Soc. Transit. 2015, 17, 199–217. [Google Scholar] [CrossRef]
  43. Moschitz, H.; Oehen, B.; Rossier, R. Anteil von Lebensmitteln regionalen Ursprungs am Gesamtverbrauch der Stadt Freiburg; Studie des Forschungsinstituts für biologischen Landbau (Fibl): Frick, Switzerland, 2015; Available online: https://www.freiburg.de/pb/site/Freiburg/get/params_E138525682/1045847/Regional-Konsum.pdf (accessed on 16 July 2019).
  44. Berti, G.; Mulligan, C. Competitiveness of Small Farms and Innovative Food Supply Chains: The Role of Food Hubs in Creating Sustainable Regional and Local Food Systems. Sustainability 2016, 8, 616. [Google Scholar] [CrossRef]
  45. Kunseler, E.-M.; Tuinstra, W.; Vasileiadou, E.; Petersen, A.C. The reflective futures practitioner: Balancing salience, credibility and legitimacy in generating foresight knowledge with stakeholders. Futures 2015, 66, 1–12. [Google Scholar] [CrossRef] [Green Version]
  46. Lutz, J.; Smetschka, B.; Nelson, G. Farmer Cooperation as a Means for Creating Local Food Systems—Potentials and Challenges. Sustainability 2017, 9, 925. [Google Scholar] [CrossRef]
  47. Bui, S.; Cardona, A.; Lamine, C.; Cerf, M. Sustainability transitions: Insights on processes of niche-regime interaction and regime reconfiguration in agri-food systems. J. Rural Stud. 2016, 48, 92–103. [Google Scholar] [CrossRef] [Green Version]
  48. Meynard, J.-M.; Jeuffroy, M.-H.; Le Bail, M.; Lefèvre, A.; Magrini, M.-B.; Michon, C. Designing coupled innovations for the sustainability transition of agrifood systems. Agric. Syst. 2017, 157, 330–339. [Google Scholar] [CrossRef]
  49. Morrissey, J.E.; Mirosa, M.; Abbott, M. Identifying Transition Capacity for Agri-food Regimes: Application of the Multi-level Perspective for Strategic Mapping. J. Environ. Policy Plan. 2014, 16, 281–301. [Google Scholar] [CrossRef]
  50. Lamine, C.; Renting, H.; Rossi, A.; Wiskerke, J.S.C.; Brunori, G. Agri-Food systems and territorial development: Innovations, new dynamics and changing governance mechanisms. In Farming Systems Research into the 21st Century: The New Dynamic; Darnhofer, I., Gibbon, D., Dedieu, B., Eds.; Springer: Dordrecht, The Netherlands, 2012; pp. 229–256. ISBN 978-94-007-4502-5. [Google Scholar]
  51. Cleveland, D.A.; Müller, N.M.; Tranovich, A.C.; Mazaroli, D.N.; Hinson, K. Local food hubs for alternative food systems: A case study from Santa Barbara County, California. J. Rural Stud. 2014, 35, 26–36. [Google Scholar] [CrossRef]
  52. Ahlqvist, T.; Bäck, A.; Heinonen, S.; Halonen, M. Road-mapping the societal transformation potential of social media. Foresight 2010, 12, 3–26. [Google Scholar] [CrossRef]
  53. Seebacher, U.; Berner, S.; Pabst, S.; Rehorska, R. Smart Food Grid Graz 2030-30-30: Lebensmittelnahversorgung für Graz und sein Umland. Projektendbericht der FH JOANNEUM Gesellschaft mbH. 2018. Available online: https://cdn.fh-joanneum.at/media/sites/1/2017/05/BLUE_GLOBE_REPORT_Smart-Food-Grid-Graz_v1.0.pdf (accessed on 10 May 2019).
  54. Ahlqvist, T.; Valovirta, V.; Loikkanen, T. Innovation policy roadmapping as a systemic instrument for forward-looking policy design. Technol. Forecast. Soc. Chang. 2012, 39, 178–190. [Google Scholar] [CrossRef]
  55. Bouma, J.; van Altvorst, A.C.; Eweg, R.; Smeets, P.J.A.M.; van Latesteijn, H.C. The Role of Knowledge When Studying Innovation and the Associated Wicked Sustainability Problems in Agriculture/B978-0-12-386473-4. Adv. Agron. 2011, 113, 293–323. [Google Scholar]
  56. Morgan, K. Nourishing the city: The rise of the urban food question in the Global North. Urban Stud. 2015, 52, 1379–1394. [Google Scholar] [CrossRef]
Figure 1. Case study area: City of Graz with its surrounding districts Graz Umgebung, Voitsberg, Deutschlandsberg, Leibnitz, Südoststeiermark and Weiz.
Sustainability 11 03876 g001
Figure 2. Three phases constituted the roadmapping approach.
Sustainability 11 03876 g002
Table 1. Stakeholder categories and number of stakeholders per category. N = 47.
Stakeholder CategoryNumber of Stakeholders
Politics and Administration6
Science10
Society and Education4
Economics3
Environment and Natural Resources2
Consumers6
Distribution and Marketing4
Logistics and Infrastructure2
Food Processing3
Agricultural Production7
Table 2. The calculated production and consumption in tons for the respective food item for the year 2015. Vegetables include legume; Fruits include apples, pears, peaches, apricots and berries; Crops include bread grain and potatoes; Milk includes milk products butter, cheese and cream; Meat includes pig, cattle and chicken. The production quantities for vegetables, fruits and crops were calculated by multiplying the cultivated land by the average yields per hectare. The consumption quantities have been calculated by multiplying the average Austrian per capita consumption by the number of persons living in the area. Eggs were calculated by multiplying the number of lay hens by the average laying performances. We assumed an average weight of 60 g per egg. Due to missing data, the production quantities for fish could not be calculated. The recommended consumption was calculated by multiplying the recommended per capita consumption per food item by the number of persons living in the case study area. The recommended consumption represents the total amount of food consumed if people would follow the national dietary recommendations.
Food ItemsProduction (t)Consumption (t)Recommended Consumption (t)
Vegetables23,56489,535137,704
Fruits195,57660,09579,140
Crops43,640113,819115,113
Milk150,874257,600375,556
Meat23,32051,05915,417
Eggs11,17511,1277400
Fish59136149
Source: The data for average yields was derived from Steirische Statistiken (2017) [31] and Statistik Austria (2018) [34]. The data for fish production was derived from BMNT (2019) [35]. The data for the recommended consumption was derived from Elmadfa (2012) [36]. The data for milk was derived from AMA (2016) [37].
Table 3. The FSSR for the respective food item for the years 2015 and 2030. The FSSR were calculated as the quotient of production divided by consumption from Table 2. The two columns with an asterisk represent the FSSR under the assumption that people would follow dietary recommendations. For fish, FSSR under five percent were assumed because the Austrian aquaculture had an output of 3503 tons fish in 2015, which is contrasted by an estimated consumption of 63,000 tons of fish in Austria [35].
Food Item20152015 *20302030 *
Vegetables26%17%23%16%
Fruit325%247%303%230%
Crop38%38%37%35%
Milk59%40%54%37%
Meat45%151%42%141%
Eggs100%151%93%140%
Fish<5%<5%<5%<5%

