Article

Anaerobic Digestion of Food Waste with Unconventional Co-Substrates for Stable Biogas Production at High Organic Loading Rates

1
The Water Center, University of Pennsylvania, Philadelphia, PA 19147, USA
2
Golisano Institute for Sustainability, Rochester Institute of Technology, Rochester, NY 14623, USA
*
Author to whom correspondence should be addressed.
Sustainability 2019, 11(14), 3875; https://doi.org/10.3390/su11143875
Submission received: 23 June 2019 / Revised: 9 July 2019 / Accepted: 9 July 2019 / Published: 16 July 2019
(This article belongs to the Special Issue Sustainable Methods for Food Waste Valorization)

Abstract

:
Anaerobic digestion (AD) is widely considered a more sustainable food waste management method than conventional technologies, such as landfilling and incineration. To improve economic performance while maintaining AD system stability at commercial scale, food waste is often co-digested with animal manure, but there is increasing interest in food waste-only digestion. We investigated the stability of anaerobic digestion with mixed cafeteria food waste (CFW) as the main substrate, combined in a semi-continuous mode with acid whey, waste bread, waste energy drinks, and soiled paper napkins as co-substrates. During digestion of CFW without any co-substrates, the maximum specific methane yield (SMY) was 363 mL gVS−1d−1 at organic loading rate (OLR) of 2.8 gVSL−1d−1, and reactor failure occurred at OLR of 3.5 gVSL−1d−1. Co-substrates of acid whey, waste energy drinks, and waste bread resulted in maximum SMY of 455, 453, and 479 mL gVS−1d−1, respectively, and it was possible to achieve stable digestion at OLR as high as 4.4 gVSL−1d−1. These results offer a potential approach to high organic loading rate digestion of food waste without using animal manure. Process optimization for the use of unconventional co-substrates may help enable deployment of anaerobic digesters for food waste management in urban and institutional applications and enable increased diversion of food waste from landfills in heavily populated regions.

1. Introduction

Residential, institutional, and industrial sectors generate large volumes of food waste throughout the year. Though some fraction is productively utilized, most of the generated food waste is landfilled. In the United States, a few regions have moved towards legislation that bans sending food waste to landfills, and it is expected that this practice will decline as it is the most inefficient use of the material and does not adequately utilize its embodied energy and water content. Anaerobic digestion is currently the most efficient commercial-scale use of food waste, as the end products are nutrient-rich digestate and biofuel that can be converted to electrical or thermal energy. Food waste not only provides an inexpensive substrate for anaerobic digestion but also significantly improves biogas production relative to systems that convert manure or sewage sludge alone [1]. However, a relatively small fraction of anaerobic digester plants worldwide co-digest food waste with manure, sewage sludge, or lignocellulosic biomass. Most digesters in the US are farm-based and digest dairy manure and agricultural residues. While food waste is co-digested in small amounts with manure, there is a need for major developments in achieving food waste-only digestion to accommodate increasing rates of landfill diversion. There are certain challenges associated with food waste-only digestion because, without any co-substrates, process instability can result from insufficient trace elements that regulate enzyme reactions. Therefore, the conventional practice has been to digest food waste, at a relatively low fraction, with primary substrates of animal manure or sewage sludge. Use of co-substrates in anaerobic digestion of food waste helps to maintain process stability, either by balancing the carbon-to-nitrogen ratio or by providing trace minerals and buffering action. Table 1 provides a sample of the literature exploring various co-substrates used in food waste digestion. The majority of the studies have used animal manure and sludge as the co-substrates, except for a few studies, which involved rice straw [2], fats, organic fraction of the municipal solid waste [3], and fats, oils, and grease (FOG; [4]). It is essential to explore newer co-substrates as food waste generation continues to rise, and existing digesters that co-digest food waste with manure cannot handle all the additional waste generated.
There are two classes of methane-forming bacteria: acetoclastic and hydrogenotrophic methanogens [5]. Food waste is rich in nitrogen, generally attributed to the presence of proteins. Therefore, food waste digestion often leads to ammonia formation, which is toxic to acetoclastic methanogens [6]. While hydrogenotrophic methanogens continue to produce methane, food waste lacks certain trace elements that lead to the accumulation of volatile fatty acids. Therefore, ammonia formation and volatile acid accumulation are the major process challenges in food waste digestion that can be addressed by ammonia stripping or trace element supplementation. There are several efforts at laboratory and pilot scale for in situ removal of ammonia using side-stream gas stripping [7], gas mixing [8], ultrasonication [9], microwave irradiation [10], and other physical and chemical methods [11]. Trace element and mineral supplementation has also been proposed by various researchers and organizations as an alternative approach to achieving a stable process ([6,12,13,14]). A recent review study on the stability issues in food waste digestion recommended a need for intensive process monitoring and microbial management to address instability issues associated with food waste digestion [15]. In another review focusing on anaerobic digestion of food waste, none of the research studies reviewed used a secondary food waste stream as a co-substrate in food scrap digestion [16].
Anaerobic digestion (AD) is a viable method for the conversion of food waste and other organic materials into methane-rich biogas. However, when applied at high organic loading rates, using only food waste as feedstock can lead to an unstable process. The methods recommended in the previous studies mentioned above, such as ammonia stripping and trace element supplementation, have been proven effective in achieving process stability, but they add significantly to process cost by requiring additional infrastructure or chemicals. The present study evaluated non-manure based co-digestion of mixed cafeteria food waste (CFW) without the addition of any trace nutrients or recovery methods. The co-digestion of CFW with other food sector waste materials, including acid whey (AW), waste energy drinks (ED), wasted bread (WB), and paper napkins (PN), was studied to evaluate stability issues in food waste digestion. In addition, the digestion of CFW without using any co-substrate and cow manure as a co-substrate were studied as controls. This research focused on understanding the process stability issues with food waste digestion through analysis of various parameters and improving the process using non-manure-based co-substrates. Supplementing CFW regularly with other food sector wastes with consistent composition was thought to improve process stability during CFW digestion. The safe range of operating parameters is also recommended based on the results obtained in this study. Use of unconventional co-substrates offers a potential advantage in situations where it is not practical to haul digestate long distances for field spreading, for example, decentralized digesters at universities, hospitals, or food processing plants. Facilitating “food waste only” systems is also important in diverting a higher volume of food waste from landfills.

2. Materials and Methods

The term “reactor” is used to denote the experimental setup used in this study, whereas the term “digester” is used in a real-world sense to emphasize the practical importance of this research.” Cafeteria food waste” refers to mixed pre- and post-consumer waste from the university dining halls and “food waste” is a generic term that relates to both CFW and food processing waste. The term “food waste-only digestion” is used to emphasize the importance of unconventional (non-manure) substrates originating from the food sector to produce energy using anaerobic digestion. The co-digestion mixes used in each reactor are listed in Table 2.

2.1. Food Waste and Co-Substrate Characterization

The substrates utilized in this study were analyzed for physical and chemical characteristics. Physical parameters measured in our laboratory included pH, total solids (TS), and volatile solids (VS). A third-party laboratory analyzed the samples for all the other parameters listed in Table 3, Table 4 and Table 5. The pH of the substrates was recorded using a Seven Compact pH meter (Mettler Toledo, Columbus, OH, USA). The TS and VS were analyzed according to standard Environmental Protection Agency (EPA) method 1684 [23]. The chemical oxygen demand (COD) was examined for each substrate using a standard COD analyzer (Hach DR 3900, Loveland, CO, USA; Method 8000).

2.2. Inoculum and Substrates

The inoculum used in the experiments was obtained as effluent from a running digester that co-digests industrial food waste with cow manure. As the effluent contains certain unused nutrients, it is necessary to pre-incubate the inoculum under anaerobic conditions to minimize the amount of biogas produced by these available nutrients during the experiment. The pre-incubation stage helps to deplete the residual biodegradable organic material in the effluent. The effluent was incubated for 7 days at 37 °C to obtain a degassed inoculum. After the pre-incubation step, the inoculum was analyzed for TS, VS, and pH. The primary substrate used in this study was mixed cafeteria food waste (CFW) obtained from one of the university dining halls and contained approximately 50% by weight of both pre- and post-consumer wastes. Table S1 shows the fraction of principal components in CFW. The mixed CFW was weighed and ground using a blender (Vitamix) to a particle size sufficiently small to pass through a 2 mm sieve. The co-substrates studied in this work were acid whey (AW), waste energy drinks (ED), waste bread (WB), paper napkins (PN), and cow manure (CM). Acid whey was obtained from a local cheese manufacturer and stored in several small vials at 4 °C to avoid repeated thawing. A local digester provided the energy drink cartons; this digester co-digests large volume of caffeinated drinks with cow manure and vegetable waste. The packaged food and drinks contribute to a significant amount of the food sector waste processed by digesters in upstate New York. Week-old store-bought white bread was used to simulate the waste bread. The bread was cut into small pieces and dried at 75 °C for 6 h and powdered for long-term storage. Paper napkins used in this study were unsoiled Tork H1 white paper towels. Paper towels were milled to 2–4 mm particle size before using in experiments. Cow manure was obtained from a local farm-based digester and stored in several small containers in the refrigerator. Vegetable waste (VW), in an independent experiment (Supplementary Information), was prepared by grinding only pre-consumer vegetable waste from the cafeteria.

2.3. Reactor Start-Up

A total of 6 reactors were used in this study, each with 2.2 L total volume and 1.8 L working volume. Six reactors were used in a standard configuration as provided by Bioprocess Control (Lund, Sweden), and connected to the Automated Methane Potential Test System (AMPTSII). The AMPTSII system continuously measures biomethane production and is designed to work in a semi-continuous mode, with manual feeding at discrete time intervals. During the start-up, the reactors were filled with 1.8 L of pre-incubated inoculum. The reactors were then purged with nitrogen gas to create anaerobic conditions before start-up. All the reactor outlets were connected to the AMPTSII detector system. A gas sampling T-valve with a self-closing septum was connected between each reactor outlet and detector to obtain biogas samples for daily compositional analysis. The volume of biogas withdrawn for sample analysis was not included in the calculation of total daily biogas production. A 30-day hydraulic retention time (HRT) was maintained for all experiments, and the influent and effluent flow rates were adjusted manually at 60 mL d−1. All the reactors were incubated at 37 ± 2 °C in a water bath incubator. The digester contents were mixed using a built-in stirrer shaft rotating at 160 rpm with 10 s ‘ON’ and 50 s ‘OFF’ cycles. During the first 14 days of the start-up phase, all the reactors were fed with CFW at an organic loading rate (OLR) of 0.5 gVSL−1d−1. On the 15th day, the OLR was increased to 1.4 gVSL−1d−1 and maintained at this level until 45 days had elapsed. The experiments conducted to test the effect of OLR started after the 45-day start-up phase. The HRT was kept constant throughout the experiment period. As the feeding and the effluent withdrawal were carried out manually, exact volumes of the feed and effluent were recorded. The reactor working volumes were accordingly calculated on a daily basis, to account for any error in feeding and withdrawal of reactor contents.

2.4. Semi-Continuous Anaerobic Digestion Experiments

The OLR ranged from 1.4 gVSL−1d−1 to 5.5 gVSL−1d−1 after the start-up phase described above. In the first reactor (R1), the ground CFW was diluted with tap water to attain the required OLR. The pH and mineral composition of tap water were not accounted for in calculating the feed composition. In the second reactor (R2) containing CFW:AW mix, acid whey was used instead of water; however, VS content of AW was adjusted for calculating OLR. The third reactor (R3) contained a mixture of CFW and energy drink (ED). As the ED contains negligible VS, it was directly used to dilute the CFW to the required OLR instead of water. The substrates and co-substrates used in each reactor are summarized in Table 2. The CFW-to-co-substrate ratios for WB (R4), PN (R5), and CM (R6) were chosen based on a pre-optimization study, conducted soon after the start-up phase. In this pre-optimization work, all the reactors were maintained at 1.4 gVSL−1d−1, and different combinations of test mixtures were studied for biogas production for 15 days. Based on these results, CFW co-digestion with 10 ± 2% WB, 70% CM, and 5–8% PN by weight were selected to investigate the further effect of increasing OLR; see Table S2 in Supplementary Materials. The reactors were fed every 24 h according to the experimental design presented in Table S3. These experiments continued for approximately 100 days, including the time required for recovery of the CFW-only reactor after failure. Slight variations in daily HRTs due to sample preparation error are reported in Table S4 of the Supplementary Materials.

3. Results

Some of the parameters of interest for growth and product formation are pH, volatile fatty acid (VFA) concentration, alkalinity, VFA-to-alkalinity ratio, dissolved ammonium concentration, daily biogas production, daily methane, carbon dioxide and hydrogen sulfide composition of biogas, and specific methane yield. These parameters were measured on a regular basis and discussed in this section.

3.1. Food Waste Characteristics

Although different CFW samples were obtained from the same source, considerable variation in the properties was observed, as indicated in Table 3. The pH of the mixed CFW used in this study only affected the reactor pH by 0.2 to 0.3 units immediately after feeding. However, the variation can be significant when digesting in a large-scale digester with continuous feeding cycles. As methanogens are very sensitive to changing environments, it is necessary to maintain a balance between substrates and co-substrates. Therefore, if the main feedstock for biogas production does not possess homogeneous composition, a co-substrate with consistent properties must always be used. Various physical and chemical properties of CFW and other co-substrates are summarized in Table 4; Table 5. The digestate characteristics were determined only at OLR of 2.8 gVSL−1d−1 and provided in Table S5 in the Supplementary Materials.

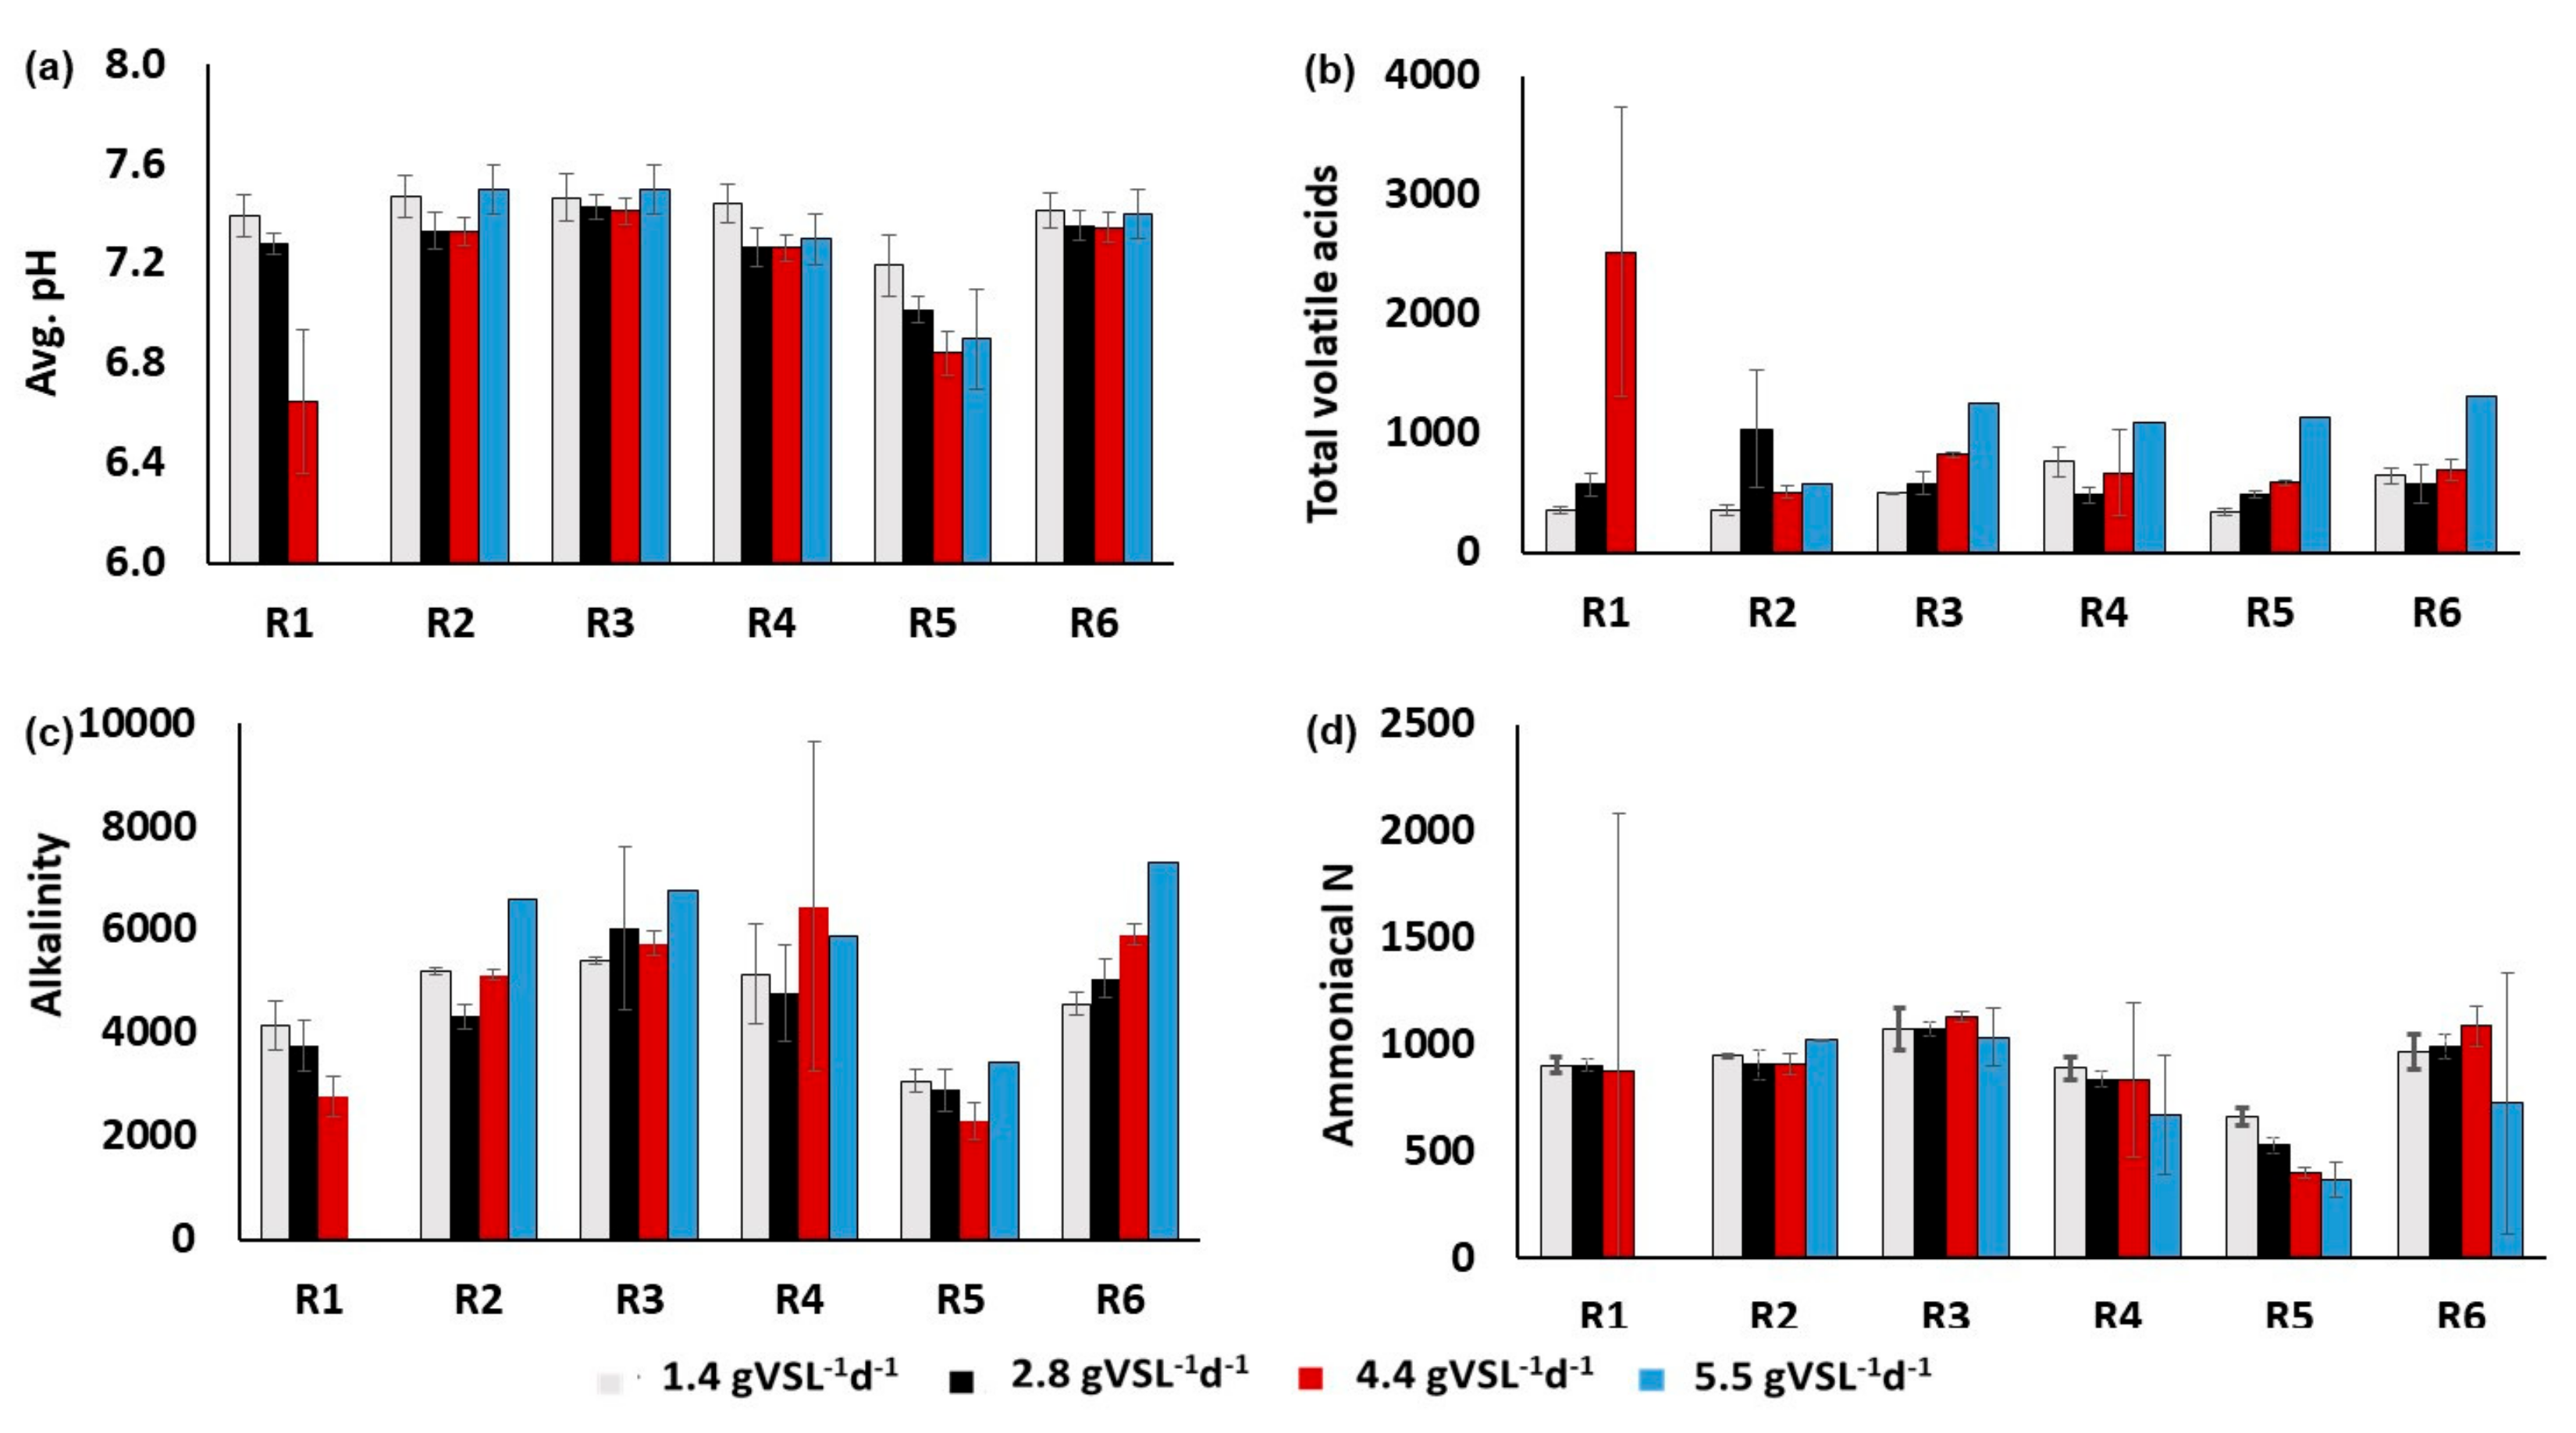
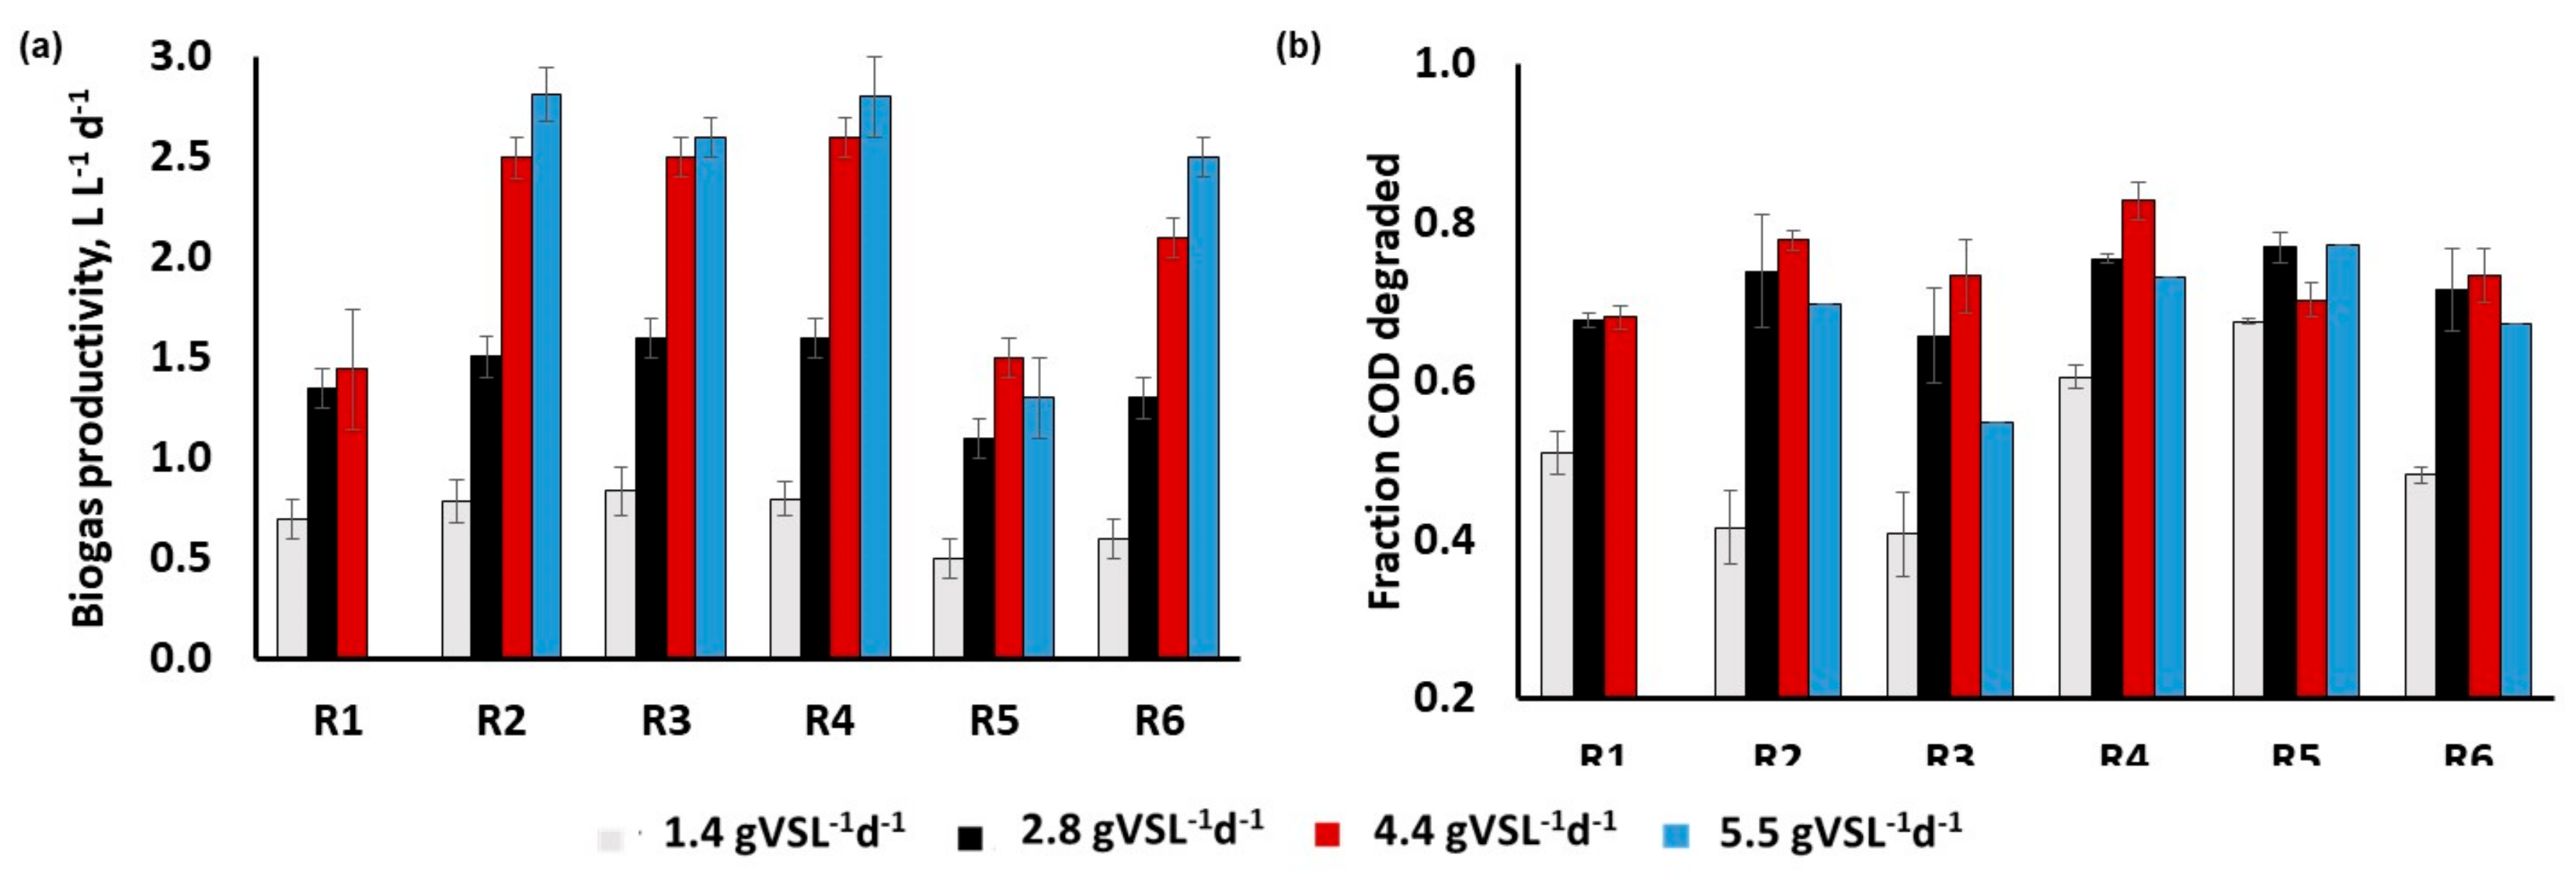
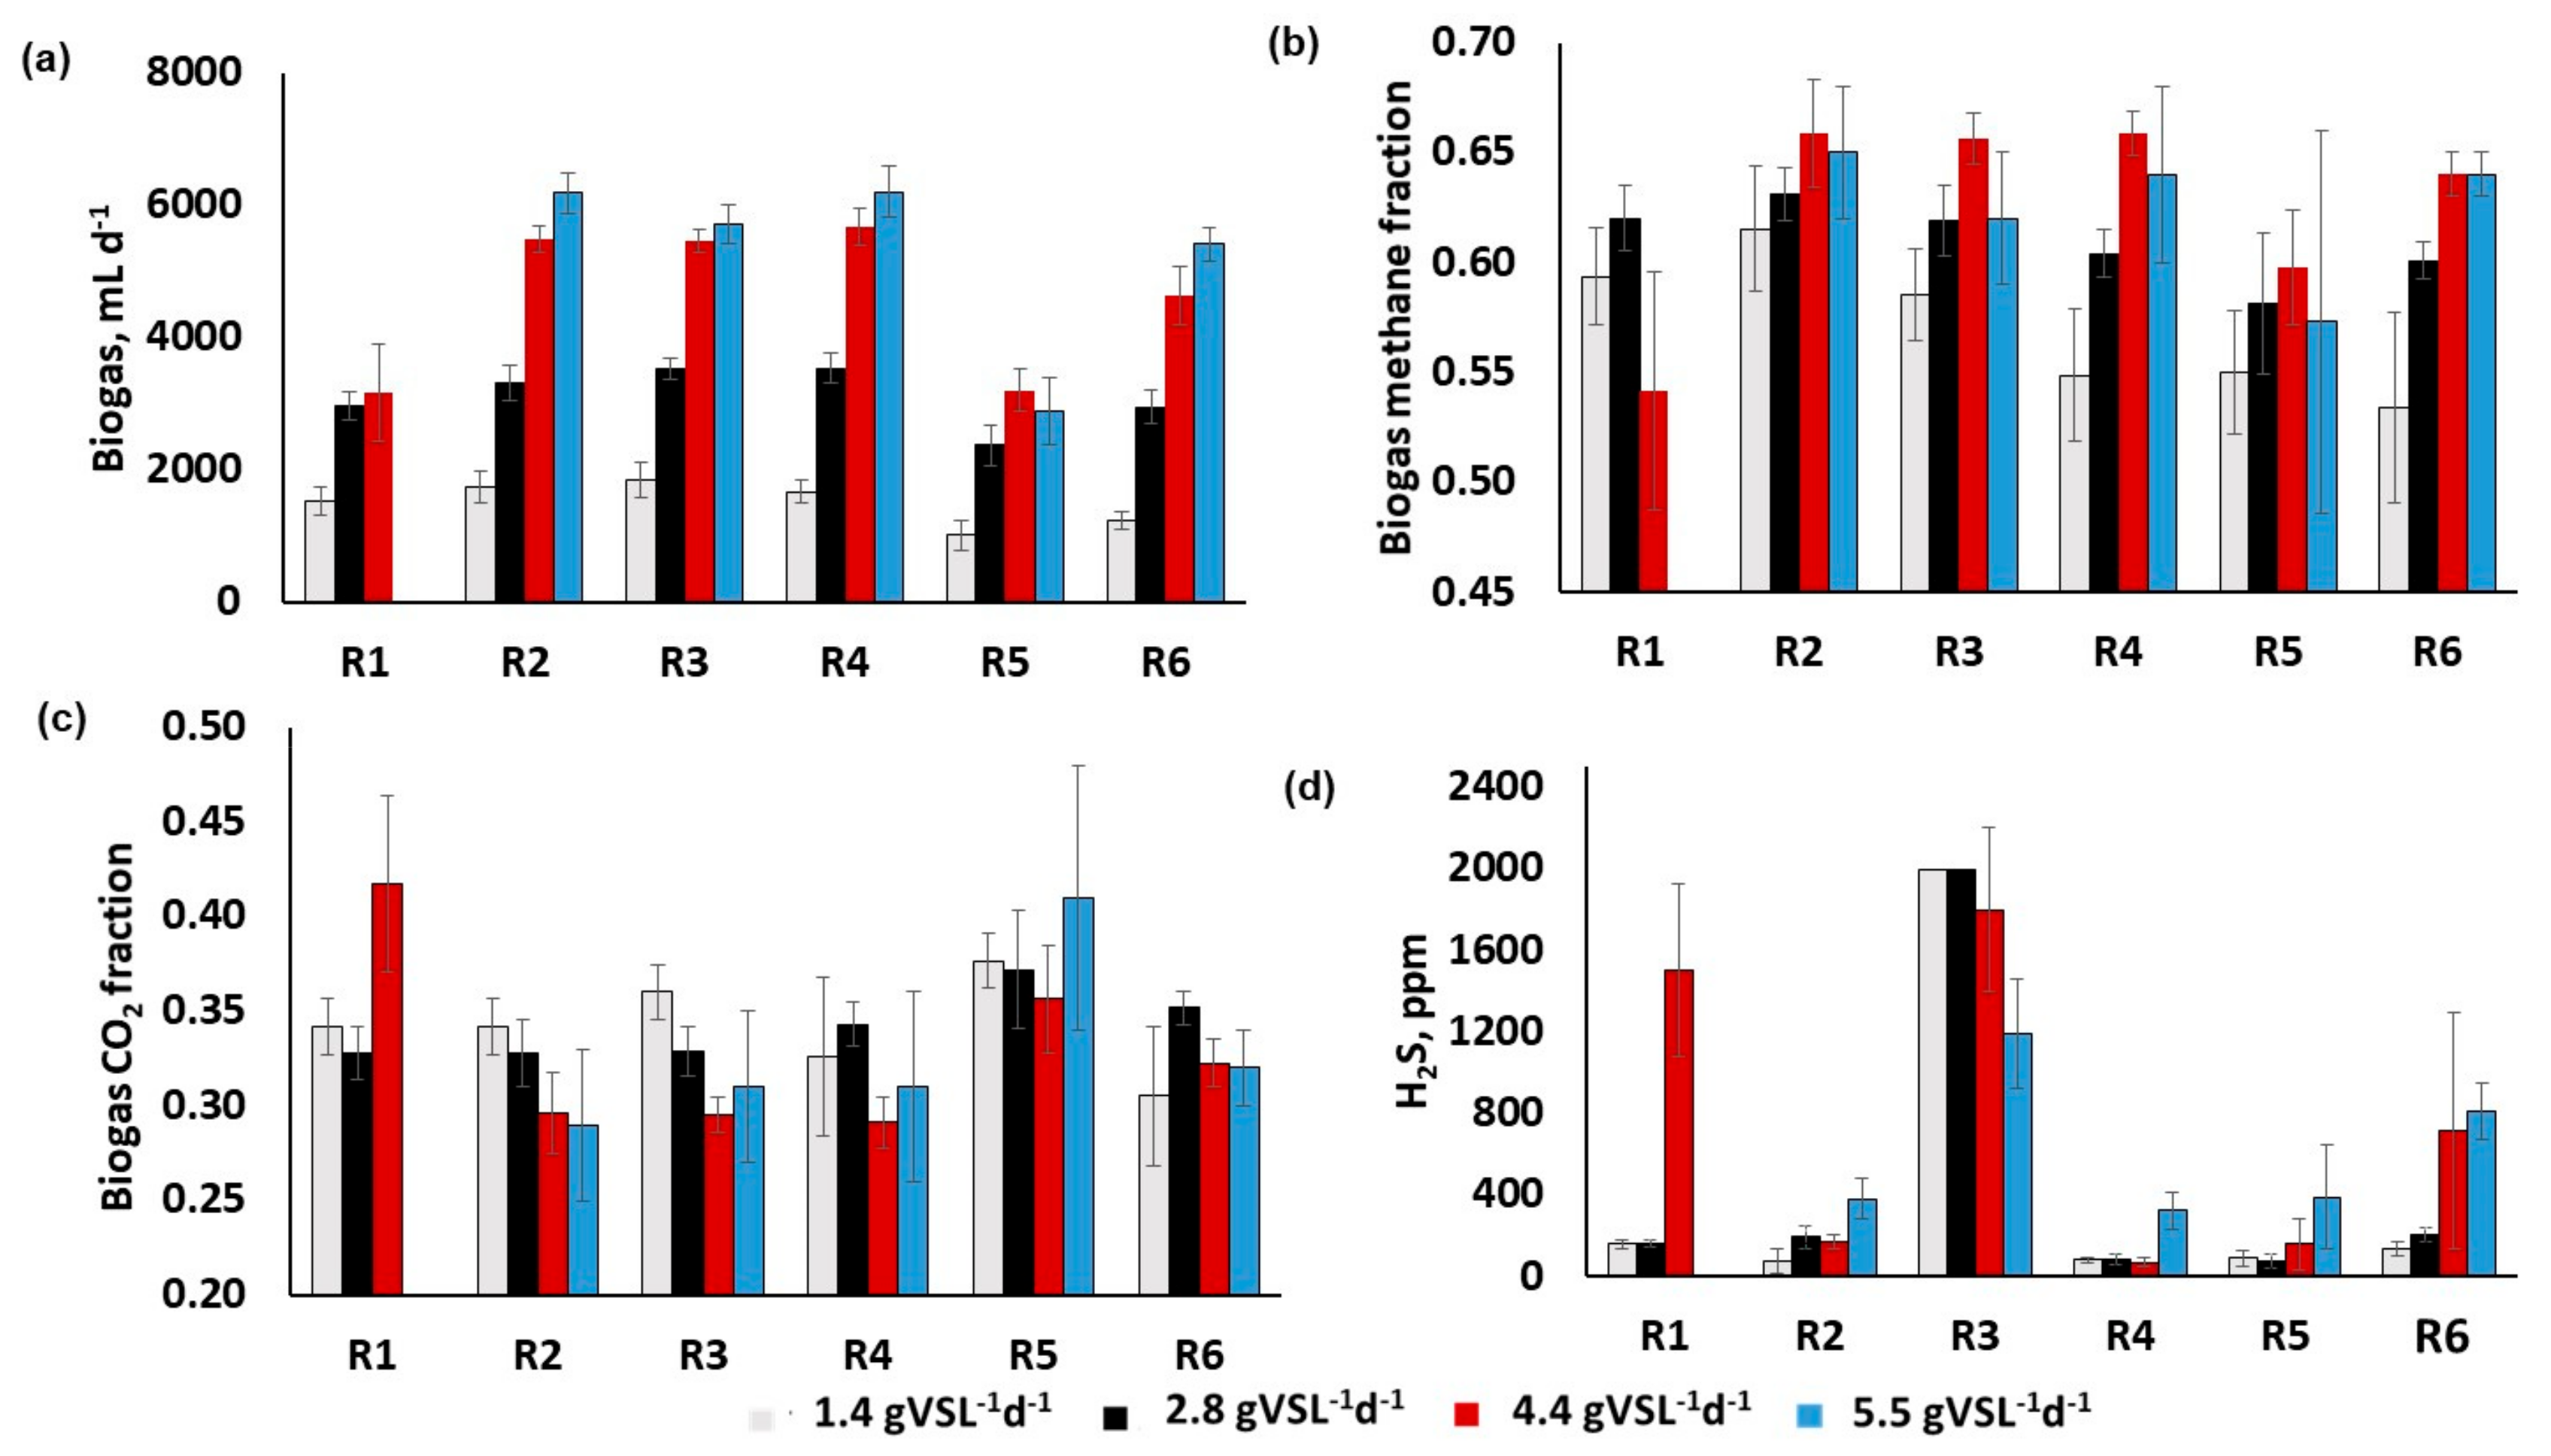
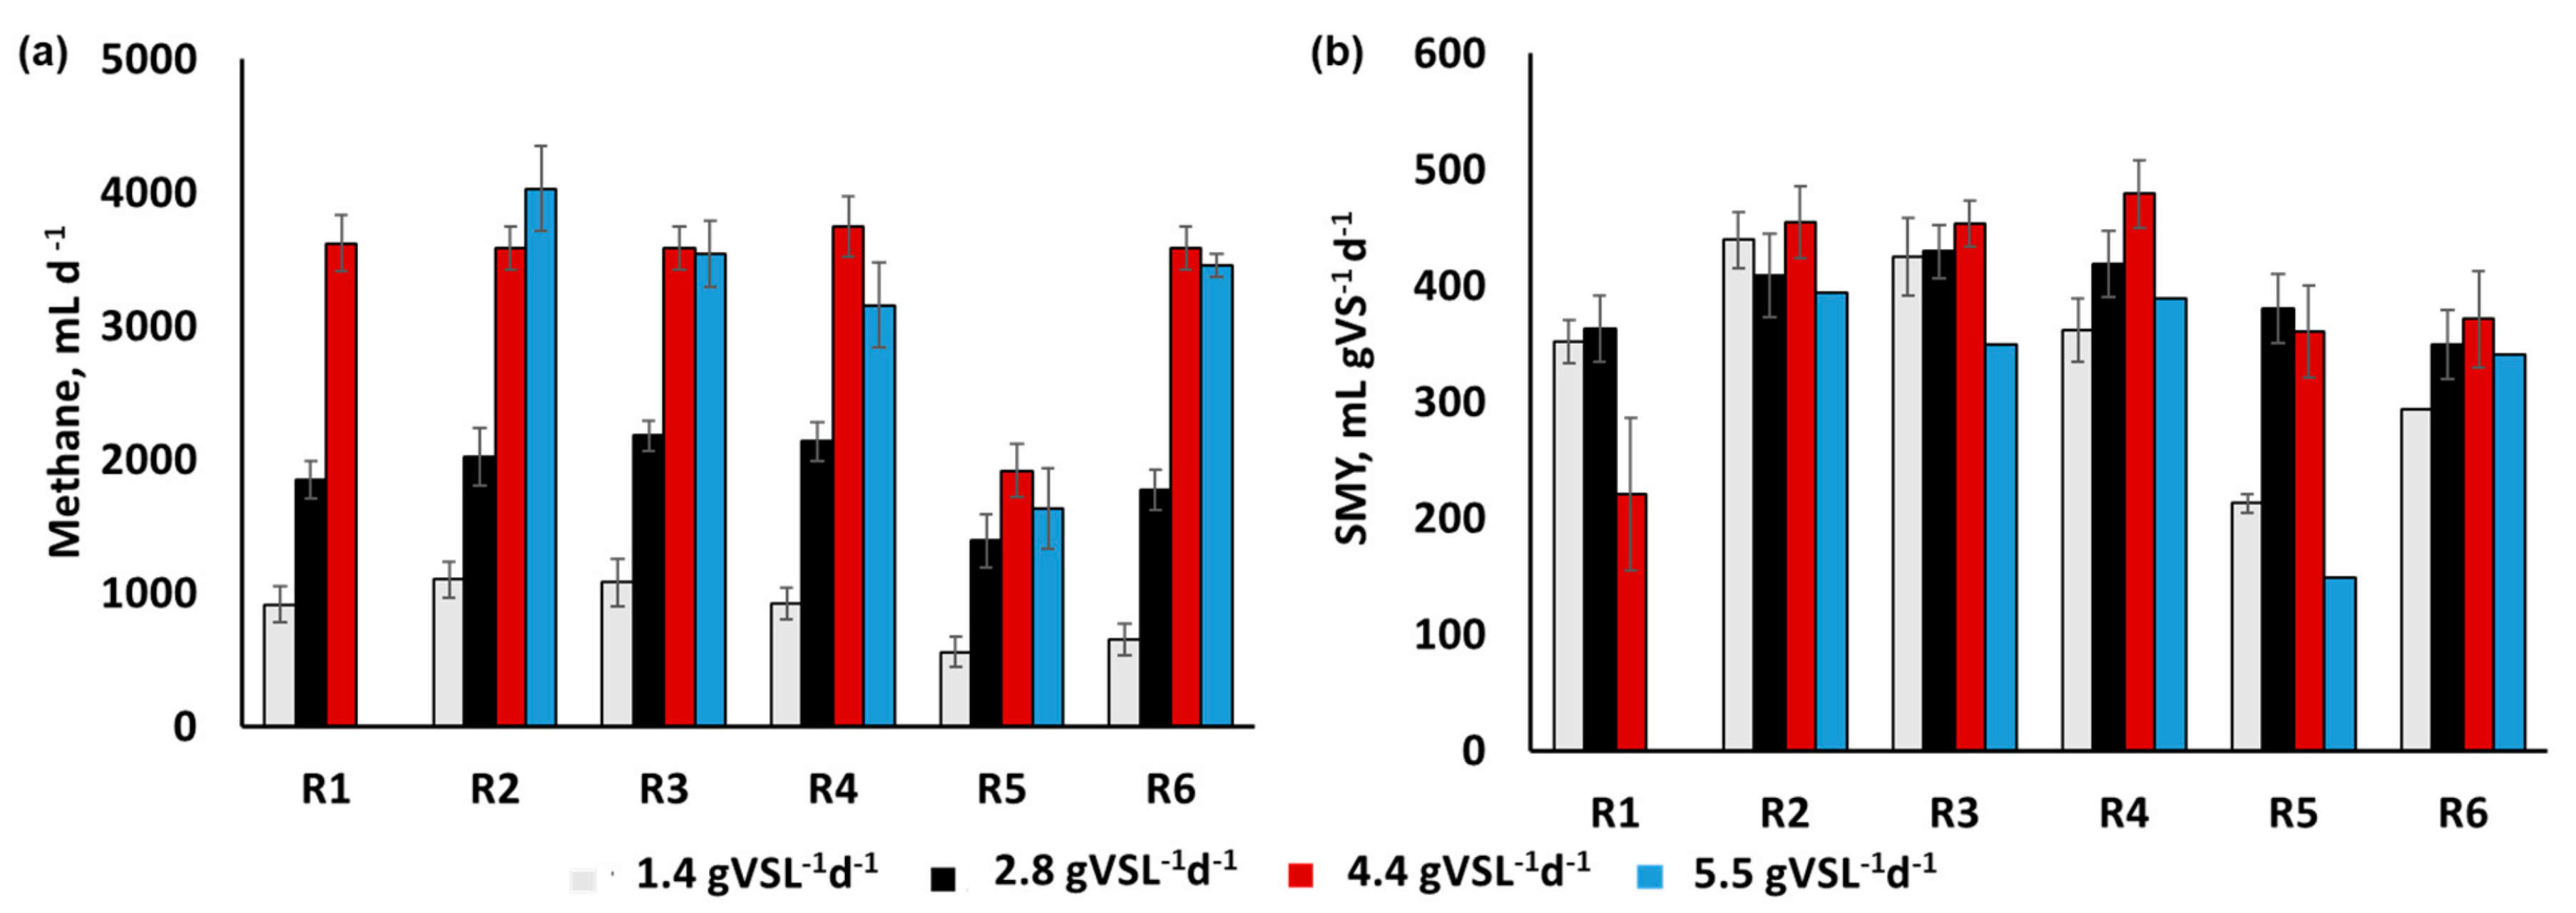
3.2. Process Monitoring

Figure 1a shows the average pH of each reactor at different OLRs. In R1, the daily pH dropped to 6.2 on the seventh day from an initial pH of 7.3 at OLR of 4.4 gVSL−1d−1. The pH drop caused reactor failure and led to an excessive CO2 fraction in the produced biogas. The reactors with acid whey (AW), waste bread (WB), energy drink (ED), and cow manure (CM) as co-substrates maintained the daily pH between 7.3 and 7.5 throughout the experimental duration. There were no major issues with process stability with these co-substrates. With paper napkins as the co-substrate (R5), the reactor pH varied between 6.8 and 7.3 at different OLRs. However, pH variation was minimal at each OLR, indicating a steady process. If the pH drops below 6.8, it is advised to reduce the OLR as lower pH values correspond to VFA accumulation and imply the reactor is undersized for a given OLR. Analyzed at discrete time intervals, the pH of all the digesters reduced by 0.2 to 0.3 units immediately after feeding, and recovered within 2 h.
At OLR of 4.4 gVSL−1d−1, R1 reached a total VFA concentration of 3375 mg (CH3COOH) L−1 on the 7th day, where the reactor produced less than half of the daily methane, leading to reactor failure. Therefore, the OLR of the CFW reactor was reduced to 3.5 gVSL−1d−1 for further experiments after an initial pH adjustment; however, a high average VFA concentration of 2288 mg (CH3COOH) L−1 at this OLR indicated reactor overload. Therefore, it is recommended to keep the OLR between 1.4 and 2.8 gVSL−1d−1 to anaerobically digest the CFW without any co-substrates. The other reactors (R2—R6) maintained an acceptable VFA concentration at 4.4 gVSL−1d−1, ranging between 508 and 818 mg (CH3COOH) L−1. When the OLR was increased further to 5.5 gVSL−1d−1, only R2 had a VFA concentration lower than 600 gVSL−1d−1, whereas all the other reactors had VFAs ranging between 1087 and 1307 mg (CH3COOH) L−1. These results (Figure 1b) indicate that acid whey may be a viable non-manure substrate to co-digest CFW at high OLR where it is not convenient to haul manure, for example, in institutional applications, such as hospitals and universities.
The average alkalinity levels of each reactor are shown in Figure 1c for different OLRs. When R1 failed to produce methane at higher OLR, it had an alkalinity of 2488 mg CaCO3 L−1. At lower OLRs, the alkalinity ranged between 3700 and 4200 mg CaCO3 L−1, which is lower than that observed in manure digesters; however, there were no observed instability issues. For other digesters with food waste co-substrates, the alkalinity levels ranged between 4324 and 7307 mg CaCO3 L−1. At alkalinity levels above 6500 mg CaCO3 L−1, the reactors did not perform well concerning methane production even though there was no observed reactor failure. The average variation in alkalinity is shown in Figure 1c. Methane production did not increase significantly in R2 and R3 and reduced in R4, R5, and R6. It is important to maintain an acceptable VFA to alkalinity ratio (V/A) during digester operation, with municipal digesters typically operating at a V/A ratio below 0.3 (Aquafix, https://teamaquafix.com/anaerobic-digester-upset-troubleshooting/). The CFW reactor had a V/A of one when it failed. In R4 and R5, the methane production rate was reduced when V/A reached a value of 0.3. The other reactors R2, R3, and R6 always maintained an acceptable V/A. Average ammoniacal nitrogen (NH3-N) concentration throughout the experimental duration varied from 368 to 1132 mg L−1 in all the reactors, as shown in Figure 1d. Ammoniacal nitrogen levels did not change significantly in any reactor, even at higher OLRs, and remained relatively stable throughout the experimental period. In a review article [24], it was reported that a broad range of ammoniacal nitrogen concentrations is inhibitory, ranging from 1700 mg L−1 to 15,000 mg L−1. Methanogens can acclimate to increasing ammonia concentration with time. Therefore, it was difficult to recommend a safe operating zone for ammonia during biogas production.
The average daily biogas production rate and methane, carbon dioxide, and hydrogen sulfide composition of biogas are shown in Figure 2a–d. In R1, the average methane level reached a high of 62% at 2.8 gVSL−1d−1 but was reduced to 44% at 4.4 gVSL−1d−1, indicating a need to stop feeding and let the reactor stabilize for several days to attain a normal methane production level. In R2, the methane level reached as high as 71% at 4.4 gVSL−1d−1 with a daily average of 66%, and this reactor maintained greater than 62% average methane concentration throughout the measurement period. With energy drink (ED) as co-substrate in R3, the biogas contained a high concentration of H2S, even though it showed higher methane levels of 60 to 66%. With ED as co-substrate, the H2S concentration was greater than 2000 ppm for the first two OLRs and reduced to 1194 ppm at 5.5 gVSL−1d−1. The average daily H2S concentrations ranged from 78 to 83 ppm for R2, 82 to 326 ppm for R4, 91 to 391 for R5, and 139 to 810 ppm for R6 within the safe operating OLR region. The H2S levels of R2, R4, and R5 were significantly lower than R6.
Figure 3a shows the average methane production rate, and Figure 3b depicts the specific methane yields (SMYs) of different reactors at each given OLR. In CFW digestion without any co-substrates, observed SMY was 352 ± 46 mL gVS−1d−1 at 1.4 gVSL−1d−1 and 363±28 mL gVS−1d−1 at 2.8 gVSL−1d−1 with all the other process parameters within the acceptable range. Therefore, if CFW has to be digested alone, it is recommended to keep the OLR below 2.8 gVSL−1d−1, preferably between 1.5 and 2.0 gVSL−1d−1. However, it was possible to digest food waste at high OLRs using the previously identified unconventional co-substrates. For example, with paper napkins as the co-substrate (R5), a maximum SMY of 381 ± 30 mL gVS−1d−1 was observed at 2.8 gVSL−1d−1. The reactors R2, R3, R4, and R6 showed maximum SMYs of 455 ± 31, 453 ± 20, 479 ± 29, and 372 ± 41 mL gVS−1d−1, respectively, at OLR of 4.4 gVSL−1d−1 with all other process parameters within acceptable ranges. Acid whey, energy drinks, and waste bread were the most efficient co-substrates with higher methane yield and lower VFA levels. The SMYs of all the reactors reduced significantly at 5.5 gVSL−1d−1 compared to lower OLRs, indicating reactor overload. A higher SMY from all the co-digestion mixtures compared to CFW indicated a synergistic relationship between CFW and co-substrates. Reactors R2, R3, and R4 showed a higher observed SMY compared to R6, where cow manure was the co-substrate.
Biogas productivity is an indicator of process stability and must be monitored on a regular basis. Reactors R2, R3, and R4 showed increasing productivities with increasing OLR up to 4.4 gVSL−1d−1 (Figure 4a), and productivity either reduced or remained the same at a loading of 5.5 gVSL−1d−1 for all reactors except R2 and R6. No further increase in productivity indicates the onset of reactor overload and implies that the OLR should be reduced to maintain stable operation. The productivity in R1 did not increase further after an OLR of 2.8 gVSL−1d−1, and the productivity decreased in R5 at the highest OLR tested. Therefore, it is suggested that OLRs be kept below 4.4 gVSL−1d−1 when acid whey, bread, and energy drinks are used as co-substrates with CFW, below 2.8 gVSL−1d−1 when co-digesting CFW with cow manure and paper napkins, and between 1.4 and 2.0 when digesting CFW alone. The degradability or percent degradation signifies waste management efficiency because it is directly proportional to the amount of food waste converted into biogas. All the reactors had a lower biodegradability at the highest OLR, as indicated in Figure 4b. A significant improvement in biodegradation from 1.4 to 2.8 gVSL−1d−1 was observed in all the reactors. However, at 4.4 gVSL−1d−1, only R2, R3, and R4 had higher COD removal. The COD removal reduced in all the reactors at 5.5 gVSL−1d−1 except for R5.

4. Discussion

Anaerobic digestion involves a synergistic metabolism between different classes of microbes: hydrolyzing bacteria, acetogens, acidogens, and methanogens. These microbial communities differ significantly in their morphology, optimum conditions for growth and product formation, and sensitivity to changing microenvironments. Therefore, it is necessary to monitor different process parameters to maintain a healthy balance between microbial populations and achieve a steady process.
The nutrient composition of the substrates directly affects microbial growth and biogas production. The pH of the substrate supports faster acclimatization of the microbial population to changing environments and solubilizes certain nutrients for easy uptake by microbes. Maximum biogas production was observed when the pH of the food waste was 7.0, with a significant reduction in biogas production at pH of 5.0 and 9.0 under batch conditions [25]. The carbohydrates, lipids, and proteins contribute to maintaining a healthy carbon-to-nitrogen ratio (C/N). Proteins act as a nitrogen source upon degradation into ammonia. A high level of proteins in the substrate, for example, from meat products, corresponds to lower C/N and leads to process instabilities by producing excessive ammonia.
The daily pH of the anaerobic digester is known to impact digester performance by affecting the mass transfer rate. In a substrate containing a high concentration of ammoniacal nitrogen, pH affects the ratio of free ammonia (NH3) to the ionized form of ammonia (NH4+) [24]. As the pH increases, ammonia toxicity increases due to the increase in free ammonia. Methanogens are susceptible to higher concentrations of ammonia and, therefore, they consume VFAs at a slower rate. Slower VFA consumption leads to their accumulation and creates a low pH environment in the digester. Therefore, if acetogens outnumber the methanogens, pH will drop, which can inhibit methanogens, and ultimately lead to digester failure. A balanced metabolism of acetogens and methanogens helps in maintaining the pH of a digester within the optimum range. A pH of 6.8–7.5 for a healthy population of methanogens [26] has been suggested in earlier literature studies for manure and co-digestion. Even though pH cannot be a single parameter that determines digester stability, for food waste-only digestion, it is recommended to maintain a pH of 7.2–7.8 based on the observations in this study. The pH drop was observed to be much faster below a level of 7.2 in food waste digestion.
Though pH is not an early indicator of process instability, it is important to maintain a constant digester pH and, hence, VFA levels at all times. Maintaining lower concentrations of VFAs helps both in attaining higher methane production and better waste conversion efficiency. Because of the inhibitory effects of volatile fatty acids, it is required to monitor the VFA concentration in the digester on a regular basis. Consistently elevated levels of VFAs indicate digester overload and can ultimately lead to digester failure. Researchers have studied different strategies to decrease the negative effect of VFAs, including co-digestion, the addition of certain metal ions like Ca2+ [27], and reagents that increase alkalinity [28]. Another approach suggests that a discontinuous feeding profile can avoid VFA accumulation in the digester [29]. While the existing literature is ambiguous on acceptable levels of VFA, a total VFA concentration of below 800 mg (CH3COOH) L−1 at all times would be recommended in this study to maintain optimum digester operation. In the event that VFA levels rise above the recommended value, the temperature of the reactor must be reduced by 3–5 °C, the feeding must be stopped (or OLR appropriately reduced) for a few days until the pH becomes normal, or the pH should be adjusted to 7.2 with a base additive, such as sodium hydroxide.
Alkalinity levels lower than the optimum indicate VFA accumulation and can be maintained by using an appropriate co-substrate that has the natural buffering ability or by using external agents like calcium carbonate or sodium bicarbonate. The use of waste materials like egg shells and lime mud from pulp and paper processing has been proposed for maintaining digester alkalinity [28]. In a manure-only digester maintained at pH = 7.4, normal alkalinity levels were observed to be 5500 mg CaCO3L−1 to maintain stable operation [30]. As manure-only digesters are known to run stably for a long time, this value can also serve as a basis for average required alkalinity levels in food waste-only digestion. Alkalinity also affects the digestate characteristics by changing the phosphorus (struvite) removal efficiency [31].
Ammoniacal nitrogen refers to the nitrogen from free ammonia (NH3), and ammonium ions (NH4+) in the digester are the end products of protein, amino acid, and urea degradation. Ammoniacal nitrogen levels did not change significantly in any reactor, even at higher OLRs, and remained relatively stable throughout the experimental period. In a review article by Chen et al. [24], it was reported that ammoniacal nitrogen concentrations are inhibitory in the range of 1700 to 15,000 mg L−1. Methanogens have a capability to acclimatize to increasing ammonia concentration with time. Therefore, it was difficult to recommend a safe operating zone for ammonia during biogas production in the current experimental campaign. Free ammonia is known to affect methanogenic activity by inhibiting the methane-producing enzymes or by diffusing into the microbial cells, causing proton imbalance or potassium deficiency [32]. Liu et al. [31] observed that NH4+-N concentration of 1000 mg L−1 or higher was inhibitory in anaerobic digestion of municipal solid waste leachate using an expanded granular sludge anaerobic reactor [33]. These authors also achieved a higher COD removal efficiency by maintaining the NH4+-N concentrations below 500 mg L−1. A lower concentration of NH4+ or free ammonia is beneficial to anaerobic digestion, as these compounds serve as a nitrogen source for microbes. Inhibition effects of ammoniacal nitrogen depend on the type of substrate, the presence of other metal ions [34], and process conditions like temperature and pH.
Biogas production is by far the most important parameter to monitor in anaerobic digestion. Measuring the biogas production daily helps to identify any stability issues arising during the process. Biogas contains two main components, methane and carbon dioxide, with small amounts of hydrogen sulfide (H2S), ammonia, nitrogen, and hydrogen. In a well-controlled digester, the methane percentage of biogas varies between 55% and 65%. In a continuously fed digester at steady-state, daily biogas composition should remain constant over time. Methane content below 55%, or CO2 content above 35–40%, indicates VFA accumulation and inhibition in the activity of methanogens. Methane, which is a result of volatile solids destruction, is the final product of the anaerobic digestion pathway, suggesting that higher methane production indicates better waste processing efficiency of the digester.
In addition to methane, it is necessary to monitor the H2S concentration of biogas. Though sulfides help in maintaining the alkalinity similar to ammonia, higher sulfide concentrations are toxic to methanogenic bacteria. Also, higher H2S concentration in biogas demands additional infrastructure for purification before its use. The higher H2S levels with an energy drink as the co-substrate may be attributed to the presence of taurine. Taurine, or 2-aminoethanesulfonic acid, acts as a source of sulfur for anaerobic bacteria. These microbes dissimilate taurine to produce sulfite, which is a nutrient source. The microbes then carry out sulfite respiration through sulfate reductase enzyme, and sulfides are excreted out of the cells [35]. Sulfide, excreted as hydrogen sulfide gas, makes a major component of biogas. The energy drink also contains caffeine, which is a well-known stimulant of biogas production [36]. Therefore, it is important to characterize the feedstocks for the presence of specific substrates that may cause unusual problems even after being stimulatory to biogas production. In the current work, daily average biogas production was higher with acid whey and waste bread compared to cow manure as a co-substrate. Therefore, acid whey and waste bread can make better co-substrates than cow manure for CFW digestion.
Specific methane yield is the volume of the methane produced per gram of volatile solids added per day. The SMY relates to the extent of biodegradability of each substrate. Babaee and Shayegan [21] investigated the effect of OLR on vegetable waste digestion in a scale reactor operating at steady-state. They suggested an OLR of 1.4 gVSL−1d−1 as the design criterion, with a SMY of 250 mL gVS−1 d−1. This paper also recommended an OLR of 1.4 gVSL−1d−1 for vegetable waste digested in semi-continuous mode, as elevated VFA concentration was observed at higher OLR. Vegetable waste had a SMY of 198 ± 48 mL gVS−1d−1 when mixed continuously, and 350 ± 90 mL gVS−1d−1 with intermittent mixing in an independent experiment (not included in the graphs; see Supplementary Materials Table S6). Specific methane yield is dependent on waste composition and process conditions. An OLR limit of 1.5 gVSL−1d−1 was suggested in a previous study for mixed food waste digestion without any co-substrates, yielding a SMY of 371 mL gVS−1d−1 [37]. Food waste digestion at considerably high OLR of up to 5.6 gVSL−1d−1 was achieved using special strategies like thermophilic digestion [37] and lipid removal [38].

5. Conclusions

Use of unconventional co-substrates helped enhance anaerobic digestion of food waste at high organic loading rates. These co-substrates generally resulted in increased daily methane production, higher methane fraction in biogas, improved waste degradation, and process stability. Pure CFW digestion is challenging at higher organic loading rates, and process instabilities are often observed; however, it is possible to digest CFW if OLR is consistently kept lower. Our results show that, during pure CFW digestion, a high level of volatile acid accumulation occurs, indicating poor degradation. Digesting CFW at low OLRs will need a considerably larger volume of the digester than conventional substrates for the same OLR, increasing the upfront capital cost.
In summary, it may not be practical to build “food waste only” digesters to enable higher OLR. This study showed that, when CFW is mixed with widely available wastes like acid whey, caffeinated energy drinks, waste bread, paper napkins, and conventional co-substrates, such as cow manure, the digestion process can be stabilized and lead to higher biogas yield and biodegradability. In addition, co-digesting food waste with bread, acid whey, and paper napkins has been shown to reduce hydrogen sulfide emissions and ammoniacal nitrogen in the digester. Because of the synergistic effect offered by the co-substrates, the primary feedstock (i.e., CFW or mixed food waste) is utilized more efficiently, leading to increased biodegradability. It is, therefore, recommended that CFW be co-digested with more homogenous substrates that do not frequently change in their composition to achieve a long-term steady-state process. Co-digestion has a beneficial impact in reducing the design volumes of reactors, making provisions for treating large amounts of food waste. It is important to note that commercial-scale digesters may process more than two food sector waste materials at the same time, in which case, the interaction between these wastes may vary. Because the reported experiments were carried out in semi-continuous mode with once daily feeding, at higher organic loading rates, there is a possibility of nutrient shock soon after the feeding, which could have affected some of the measured parameters like total volatile acids. Such an effect may be less likely in a continuous digester with multiple feeding cycles per day. The substrates used in this work are generated in large amounts in New York State, but the use of other potential co-substrates like waste cooking oil, grease trap waste, and fruit and vegetable processing wastewater need further evaluation. Co-digestion would be expected to have beneficial impacts on reducing digester volume and water footprint of anaerobic digestion processes while increasing food waste management throughput and renewable electricity production. The co-substrates suggested through this study may help in the deployment of decentralized digesters in settings where it is not practical to haul manure, for example, in institutional or commercial installations, such as hospitals, universities, or large grocery stores.

Supplementary Materials

The following are available online at https://www.mdpi.com/2071-1050/11/14/3875/s1, Figure S1: Sample kinetics of cafeteria food waste (CFW) digestion, Table S1: Components of mixed cafeteria food waste (CFW), Table S2: Optimization to choose the ratio of CFW to co-substrates, Table S3: Experimental design for feeding CFW and co-substrates at different OLRs, Table S4: Observed hydraulic retention times at different OLRs, Table S5: Digestate characteristics at OLR = 2.8 gVSL−1d−1, Table S6: Process monitoring during digestion of mixed cafeteria food waste (CFW) and vegetable waste (VW) with continuous mixing.

Author Contributions

All the experiments were designed and performed by S.H. with guidance from T.T., and both authors contributed to preparing this manuscript.

Funding

Provided by the New York State Pollution Prevention Institute (NYSP2I) through a grant from the NYS Department of Environmental Conservation, which also provided a Graduate Research Assistantship for S. Hegde. Any opinions, findings, conclusions, or recommendations expressed are those of the authors and do not necessarily reflect the views of the Department of Environmental Conservation.

Conflicts of Interest

The authors declare no conflict of interest. The sponsors had no role in the design, execution, interpretation, or writing of the study.

References

  1. Ebner, J.H.; Labatut, R.A.; Lodge, J.S.; Williamson, A.A.; Trabold, T.A. Anaerobic co-digestion of commercial food waste and dairy manure: Characterizing biochemical parameters and synergistic effects. Waste Manag. 2016, 52, 286–294. [Google Scholar] [CrossRef] [PubMed]
  2. Pei, Z.; Liu, J.; Shi, F.; Wang, S.; Gao, Y.; Zhang, D. High-solid Anaerobic Co-digestion of Food Waste and Rice Straw for Biogas Production. J. Northeast. Agric. Univ. 2014, 21, 61–66. [Google Scholar] [CrossRef]
  3. Stan, C.; Collaguazo, G.; Streche, C.; Apostol, T.; Cocarta, D.M. Pilot-scale anaerobic co-digestion of the OFMSW: Improving biogas production and startup. Sustainability 2018, 10, 1939. [Google Scholar] [CrossRef]
  4. Martín-González, L.; Colturato, L.F.; Font, X.; Vicent, T. Anaerobic co-digestion of the organic fraction of municipal solid waste with FOG waste from a sewage treatment plant: Recovering a wasted methane potential and enhancing the biogas yield. Waste Manag. 2010, 30, 1854–1859. [Google Scholar] [CrossRef] [PubMed] [Green Version]
  5. Kotsyurbenko, O.R.; Chin, K.-J.; Glagolev, M.V.; Stubner, S.; Simankova, M.V.; Nozhevnikova, A.N.; Conrad, R. Acetoclastic and hydrogenotrophic methane production and methanogenic populations in an acidic West-Siberian peat bog. Environ. Microbiol. 2004, 6, 1159–1173. [Google Scholar] [CrossRef] [PubMed]
  6. WRAP. Operators Briefing Note. Defra Research Project, U.K. 2012. Available online: http://www.wrap.org.uk/sites/files/wrap/Operators%20Briefing%20Note.pdf (accessed on 12 November 2016).
  7. Serna-Maza, A.; Heaven, S.; Banks, C.J. Ammonia removal in food waste anaerobic digestion using a side-stream stripping process. Bioresour. Technol. 2014, 152, 307–315. [Google Scholar] [CrossRef] [PubMed]
  8. Serna-Maza, A.; Heaven, S.; Banks, C.J. In situ biogas stripping of ammonia from a digester using a gas mixing system. Environ. Technol. 2017, 38, 3216–3224. [Google Scholar] [CrossRef]
  9. Cho, S.-K.; Lee, M.-K.; Kim, D.-H.; Yun, Y.-M.; Jung, K.-W.; Shin, H.-S.; Oh, S.E. Enhanced anaerobic digestion of livestock waste by ultrasonication: A tool for ammonia removal and solubilization. Korean J. Chem. Eng. 2014, 31, 619–623. [Google Scholar] [CrossRef]
  10. Lin, L.; Yuan, S.; Chen, J.; Xu, Z.; Lu, X. Removal of ammonia nitrogen in wastewater by microwave radiation. J. Hazard. Mater. 2009, 161, 1063–1068. [Google Scholar] [CrossRef]
  11. Krakat, N.; Demirel, B.; Anjum, R.; Dietz, D. Methods of ammonia removal in anaerobic digestion: A review. Water Sci. Technol. 2017, 76, 1925–1938. [Google Scholar] [CrossRef]
  12. Ariunbaatar, J.; Esposito, G.; Yeh, D.H.; Lens, P.N.L. Enhanced Anaerobic Digestion of Food Waste by Supplementing Trace Elements: Role of Selenium (VI) and Iron (II). Front. Environ. Sci. 2016, 4, 8. [Google Scholar] [CrossRef]
  13. Facchin, V.; Cavinato, C.; Fatonea, F.; Pavan, P.; Bolzonell, D. Effect of trace element supplementation on the mesophilic anaerobic digestion of foodwaste in batch trials: The influence of inoculum origin. Biochem. Eng. J. 2013, 70, 71–77. [Google Scholar] [CrossRef]
  14. Banks, C.J.; Zhang, Y.; Jiang, Y.; Heaven, S. Trace element requirements for stable food waste digestion at elevated ammonia concentrations. Bioresour. Technol. 2012, 104, 127–135. [Google Scholar] [CrossRef] [PubMed] [Green Version]
  15. Li, L.; Peng, X.; Wang, X.; Wu, D. Anaerobic digestion of food waste: A review focusing on process stability. Bioresour. Technol. 2018, 248, 20–28. [Google Scholar] [CrossRef] [PubMed]
  16. Xu, F.; Li, Y.; Ge, X.; Yang, L.; Li, Y. Anaerobic digestion of food waste—Challenges and opportunities. Bioresour. Technol. 2018, 247, 1047–1058. [Google Scholar] [CrossRef]
  17. Wang, X.; Lu, X.; Li, F.; Yang, G.; Banks, C.; Humphreys, P. Effects of Temperature and Carbon-Nitrogen (C/N) Ratio on the Performance of Anaerobic Co-Digestion of Dairy Manure, Chicken Manure and Rice Straw: Focusing on Ammonia Inhibition. PLoS ONE 2014, 9, e97265. [Google Scholar] [CrossRef]
  18. Zhang, Y.; Banks, C.J.; Heaven, S. Co-digestion of source segregated domestic food waste to improve process stability. Bioresour. Technol. 2012, 114, 168–178. [Google Scholar] [CrossRef] [Green Version]
  19. Nayono, S.E.; Gallert, C.; Winter, J. Co-digestion of press water and food waste in a biowaste digester for improvement of biogas production. Bioresour. Technol. 2010, 101, 6987–6993. [Google Scholar] [CrossRef]
  20. Prabhu, S.M.; Mutnuri, S. Anaerobic co-digestion of sewage sludge and food waste. Waste Manag. Res. 2016, 34, 307–315. [Google Scholar] [CrossRef]
  21. Babaee, A.; Shayegan, J. Effect of Organic Loading Rates (OLR) on Production of Methane from Anaerobic Digestion of Vegetables Waste. In World Renewable Energy Congress—Sweden; Linköping University Electronic Press: Linköping, Sweden, 2011; pp. 411–417. [Google Scholar] [CrossRef] [Green Version]
  22. Zahan, Z.; Othman, M.Z.; Rajendram, W. Anaerobic Codigestion of Municipal Wastewater Treatment Plant Sludge with Food Waste: A Case Study. BioMed Res. Int. 2016, 2016, 1–13. [Google Scholar] [CrossRef] [Green Version]
  23. EPA. METHOD 1684: Total, Fixed, and Volatile Solids in Water, Solids, and Biosolids; Environmental Protection Agency: Columbia, WA, USA, 2001.
  24. Chen, Y.; Cheng, J.J.; Creamer, K.S. Inhibition of anaerobic digestion process: A review. Bioresour. Technol. 2008, 99, 4044–4064. [Google Scholar] [CrossRef] [PubMed]
  25. Jayaraj, S.; Deepanraj, B.V.S. Study on the effect of ph on biogas production from food waste by anaerobic digestion. In Proceedings of the 9th Annual Green Energy Conference, Tianjin, China, 25–28 May 2014. [Google Scholar]
  26. Shah, A.A.; Nawaz, A.; Kanwal, L.; Hasan, F.; Khan, S.; Badshah, M. Degradation of poly(ε-caprolactone) by a thermophilic bacterium Ralstonia sp. Strain MRL-TL isolated from hot spring. Int. Biodeterior. Biodegrad. 2015, 98, 35–42. [Google Scholar] [CrossRef]
  27. Kumar, D.; Singh, V. Dry-grind processing using amylase corn and superior yeast to reduce the exogenous enzyme requirements in bioethanol production. Biotechnol. Biofuels 2016, 9, 228. [Google Scholar] [CrossRef] [PubMed]
  28. Zhang, J.; Wang, Q.; Zheng, P.; Wang, Y. Anaerobic digestion of food waste stabilized by lime mud from papermaking process. Bioresour. Technol. 2014, 170, 270–277. [Google Scholar] [CrossRef] [PubMed]
  29. Cavaleiro, A.J.; Pereira, M.A.; Alves, M. Enhancement of methane production from long chain fatty acid based effluents. Bioresour. Technol. 2008, 99, 4086–4095. [Google Scholar] [CrossRef] [PubMed] [Green Version]
  30. Labatut, R.A.; Gooch, C.A. Monitoring of Anaerobic Digestion Process to Optimize Performance and Prevent System Failure. Proc Got Manure? Enhancing Environ. Econ. Sustain. 2012, 1, 209–225. Available online: https://ecommons.cornell.edu/handle/1813/36531 (accessed on 30 January 2017).
  31. Liu, X.; Xiang, L.; Song, Y.; Qian, F.; Meng, X. The effects and mechanism of alkalinity on the phosphate recovery from anaerobic digester effluent using dolomite lime. Environ. Earth Sci. 2015, 73, 5067–5073. [Google Scholar] [CrossRef]
  32. Gallert, C.; Bauer, S.; Winter, J. Effect of ammonia on the anaerobic degradation of protein by a mesophilic and thermophilic biowaste population. Appl. Microbiol. Biotechnol. 1998, 50, 495–501. [Google Scholar] [CrossRef]
  33. Liu, A.; Ren, F.; Lin, W.Y.; Wang, J.Y. A review of municipal solid waste environmental standards with a focus on incinerator residues. Int. J. Sustain. Built Environ. 2015, 4, 165–188. [Google Scholar] [CrossRef] [Green Version]
  34. Zhang, A.Y.; Sun, Z.; Leung, C.C.J.; Han, W.; Lau, K.Y.; Li, M.; Lin, C.S.K. Valorisation of bakery waste for succinic acid production. Green Chem. 2013, 15, 690. [Google Scholar] [CrossRef]
  35. Cook, A.M.; Denger, K. Metabolism of taurine in microorganisms: A primer in molecular biodiversity? Adv. Exp. Med. Biol. 2006, 583, 3–13. [Google Scholar] [CrossRef]
  36. Prabhudessai, V.; Ganguly, A.; Mutnuri, S. Effect of caffeine and saponin on anaerobic digestion of food waste. Ann. Microbiol. 2009, 59, 643–648. [Google Scholar] [CrossRef]
  37. Liu, C.; Wang, W.; Anwar, N.; Ma, Z.; Liu, G.; Zhang, R. Effect of organic loading rate on anaerobic digestion of food waste under mesophilic and thermophilic conditions. Energy Fuels 2017, 31, 2976–2984. [Google Scholar] [CrossRef]
  38. Li, D.; Sun, Y.; Guo, Y.; Yuan, Z.; Wang, Y.; Zhen, F. Continuous anaerobic digestion of food waste and design of digester with lipid removal. Environ. Technol. 2013, 34, 2135–2143. [Google Scholar] [CrossRef] [PubMed]
Figure 1. Average observed values of (a) pH; (b) total volatile acids [mgCH3COOH L−1]; (c) alkalinity [mg CaCO3 L−1]; (d) ammoniacal nitrogen [mg NH3-N L−1]. Co-substrates: R1—none; R2—AW (acid whey); R3—ED (energy drinks); R4—WB (wasted bread); R5—PN (paper napkins); R6—CM (cow manure).
Sustainability 11 03875 g001
Figure 2. Biogas properties: (a) average daily biogas production rate; (b) methane fraction; (c) CO2 fraction; (d) H2S concentration [ppm]. Co-substrates: R1—none; R2—AW (acid whey); R3—ED (energy drinks); R4—WB (wasted bread); R5—PN (paper napkins); R6—CM (cow manure). For R3, the H2S concentration reached a detection limit of 2000 ppm of the instrument.
Sustainability 11 03875 g002
Figure 3. (a) Daily average methane production rate [mL d−1]; (b) Specific methane yield (SMY) [mL gVS−1d−1]. Co-substrates: R1—none; R2—AW (acid whey); R3—ED (energy drinks); R4—WB (wasted bread); R5—PN (paper napkins); R6—CM (cow manure).
Sustainability 11 03875 g003
Figure 4. Parameters indicative of process efficiency: (a) biogas productivity expressed as the volume of biogas produced per unit volume of the reactor per day; (b) average fractional COD (chemical oxygen demand) degradation at each OLR (organic loading rate). Co-substrates: R1—none; R2—AW (acid whey); R3—ED (energy drinks); R4—WB (wasted bread); R5—PN (paper napkins); R6—CM (cow manure).
Sustainability 11 03875 g004
Table 1. Literature studies of food waste digestion with various co-substrates (NR: not reported; NA: not applicable).
Food Waste TypeCo-SubstrateReactor Volume
[L]
OLR
[gVSL−1d−1]
Operation ModeRatio
FW/Co-Sub
SMY
[mL gVS−1d−1]
HRT
[d]
Reference
Cafeteria food waste (CFW)Chicken manure (ChM)52.5Semi-continuous with only FW fed on day 1 and 2, ChM fed on day 3; the sequence repeatedNA50850[17]
CFWChM115Semi-continuous with once a day feeding and discharge2317NR[18]
De-fibered kitchen wasteBiowasteNR10.9Semi-continuous with two times a day feeding, five days a weekNR4207[19]
CFWSewage sludge51Batch0.549421[20]
CFWRice straw15Batch5392NR[2]
Vegetable wastenone751.4Semi-continuous with once a day feeding and dischargeNA25025[21]
Greasy food processing wasteMunicipal sludge0.52Semi-continuous with once a day feeding and discharge163320[22]
Organic fraction of MSWFats, oils, and grease54Semi-continuous with once a day feeding and discharge6.731816[4]
OLR: organic loading rate; FW: food waste; SMY: specific methane yield; HRT: hydraulic retention time.
Table 2. Co-substrates used in each reactor, with cafeteria food waste (CFW) as the primary substrate.
ReactorCo-SubstrateAbbreviation
R1None-
R2Acid wheyAW
R3Energy drinkED
R4Waste breadWB
R5Paper napkinsPN
R6Cow manureCM
Table 3. Characteristics of cafeteria food waste (CFW) estimated as an average of several samples from different batches. Standard deviations provided for n >2.
Characteristics of CFW
Physical and Chemical Properties, n = 6
pH4.2 ± 0.3
TS %23.8 ± 2.9
VS/TS %90.9 ± 2.4
VS %22.9 ± 1.2
COD g/L197 ± 42
Ash %1.8 ± 0.8
Calorific value, kJ/kg (n = 2) 23,098
Macronutrients, n = 4
Crude protein (CP) %13.3 ± 10
Available protein %13 ± 9.9
Soluble protein % of CP53 ± 4.2
Lignin %0.7 ± 0.9
Starch %10.5 ± 8.5
Simple Sugars %7.5 ± 4
Crude fat %13.4 ± 11
Minerals, n = 4
Calcium, ppm1225 ± 1014
Potassium, ppm5950 ± 4088
Magnesium, ppm425 ± 263
Phosphorous, ppm1900 ± 1449
Sodium, ppm4013 ± 2984
Iron, ppm23 ± 17
Zinc, ppm12.8 ± 8.4
Copper, ppm2.7 ± 1.5
Manganese, ppm6.5 ± 4.7
Molybdenum, ppmND
Sulfur, ppm1525 ± 1187
Chlorine ion, ppm7125 ± 5227
Elemental composition, n = 2
Carbon %52.4
Hydrogen %7.4
Nitrogen %3.3
Oxygen %30.6
ND: not detected. TS: total solids; VS: volatile solids; COD: chemical oxygen demand.
Table 4. Physical and chemical properties and elemental composition of co-substrates. Standard deviations provided for n >2.
Physical and Chemical Properties, n = 3AWEDWBPNCM
pH4.2 ± 0.23.3 ± 0NMNM6.8 ± 0.5
TS %2.9 ± 0.10.7 ± 0.195.6 ± 0.794.5 ± 3.510.3 ± 1.4
VS/TS %73.3 ± 0.280.2 ± 5.089.4 ± 2.986 ± 6.983.5 ± 0.8
VS %2.1 ± 0.10.6 ± 0.185.4 ± 2.381.4 ± 9.48.6 ± 1.2
COD g/L43 ± 4.011 ± 0.11167 ± 971176 ± 14297 ± 6.0
Ash %4.2 ± 0.20.2 ± 010.2 ± 2.813.1 ± 5.91.7 ± 0.3
Elemental composition (single measurements)
Carbon %1.50.545.244.854.8
Hydrogen %11.210.86.66.1NM
Nitrogen %0.50.52.20.33.6
Oxygen %NMNM42.647NM
Sulfur, ppm30100017003002600
Phosphorus, ppm87511854293000
NM: not measured. AW: acid whey; ED: energy drinks; WB: wasted bread; PN: paper napkins; CM: cow manure; TS: total solids; VS: volatile solids; COD: chemical oxygen demand.
Table 5. Composition of selected co-substrates.
Mineral Composition of Selected Co-Substrates
MineralsAWWBCM
Calcium, ppm1000 ± 28211002340
Potassium, ppm125 ± 3523002190
Magnesium, ppm100 ± 0400670
Sodium, ppm290 ± 857300395
Iron, ppmND76163
Zinc, ppm3.510188
Copper, ppmND272
Manganese, ppmND7205
Molybdenum, ppmNDND2.6
Chlorine ion, ppmNDND620
ND: not detected. AW: acid whey; WB: wasted bread; CM: cow manure.

