1. Introduction
Buildings account for approximately 40% of energy consumption and 36% of GHG emissions in the context of the EU [
1]. When analysing the stock of existing buildings, around 30% of the building stock is more than 50 years old [
2] and almost 75% is energy inefficient [
3,
4]. The implications of this energy inefficiency not only result in an energy and environmental cost, but also provoke other impacts, such as health problems due to the low levels of comfort within these buildings [
5]. It is then imperative to focus on upgrading an ageing building stock, whose current renovation rates are low, at ~1.2%. To achieve these targets, this rate should increase to 3% [
6].
On the other hand, the retrofitting market is quite fragmented, with multiple stakeholders with different and often conflicting interests. This is mirrored in the communication and information exchanges between them. This strong barrier is added to others, such as the lack of knowledge of some technologies among construction professionals, the varying ambition of performance requirements present within regulations, lack of awareness, and uncertainty as to the expected savings, which make investors reluctant to support the required upfront investment costs required to implement energy efficient retrofitting projects.
Thus, the whole retrofitting process must be improved to further exploit the potential of existing tools and implementing integrated processes, while reducing uncertainties and mitigating risks [
7]. Given the level of the challenge, business as usual is not an option. By addressing the previous challenges, it is possible to make efficient retrofitting an investable commodity and help unleash new services and business models.
Acknowledging the challenges above, there is a need for solutions that facilitate collaboration, information exchange, analysis and evaluation to support better energy efficient retrofitting projects. In this framework, the OptEEmAL project has developed a tool that aims at improving the design phase to deliver retrofitting projects with the energy efficiency as main axis. This tool has been designed to ease the process, reduce time and uncertainties and, therefore, result in reduced costs and increased confidence in the retrofitting process [
8].
OptEEmAL, as a tool to deliver these services, is based on the integration of 5 main pillars, and is conceived to provide a proper integration of these five concepts which allow providing the users with this holistic tool aimed at reducing time and costs in the design phase, and improving the whole process in terms of management, information flows, and quality of the design. These pillars can be summarised as:
Integration of a Building Information Modelling (BIM) [
9] approach to enhance the collaborative approach among stakeholders and improve the information flows within the design process.
Integration of an Integrated Project Delivery [
10] (IPD)-based retrofitting design approach, to facilitate communication flows, knowledge sharing and consensus among stakeholders.
Integration of a catalogue of Energy Conservation Measures (ECMs) considering scale of implementation and providing all needed data for the evaluation of the design alternatives.
Integration of a Multi-Criteria Decision Analysis (MCDA) [
11] approach for decision making integrating the interest of the stakeholders and making use of well-established indicators at different scales.
Integration of a semantic data model and data mapping processes to ensure interoperability among the platform components and consistency of communications.
Thus, through the integration of these elements, the OptEEmAL tool delivers an optimised (mathematically speaking) and integrated (i.e., holistic approach) design considering different dimensions (energy, environmental, economy, comfort, etc.). The compliance with regulations and inclusion of user-oriented expectations and constraints are taken into account through prioritisation criteria and targets/boundaries defined by the user. The different stakeholders’ interests are represented in OptEEmAL, since the Integrated Project Delivery is applied at all stages in the platform through the Graphical User Interfaces whose design is based on providing to these stakeholders the proper connections with the platform at such steps. Stakeholders are therefore the ones implementing the necessary targets, boundaries, barriers and prioritisation criteria which are used to define the problem within the platform. This is of the utmost importance, since the application of ECMs, generation of scenarios, and the optimisation process are affected by these choices.
This paper presents the activities carried out to design, develop and deploy this tool and focuses on the integration of the prioritisation criteria for evaluating the candidate retrofitting scenarios, showing its implementation within a case study that allows identifying the main impacts of the selection of different priorities for designing energy efficient retrofitting projects.
2. The OptEEmAL Tool
Bearing in mind the problems encountered in the design of retrofitting projects, OptEEmAL has developed a web-based tool which captures expert knowledge in order to automate some of the steps of the process for designing energy efficient retrofitting solutions, which leads to time and cost reduction [
12].
As reflected in
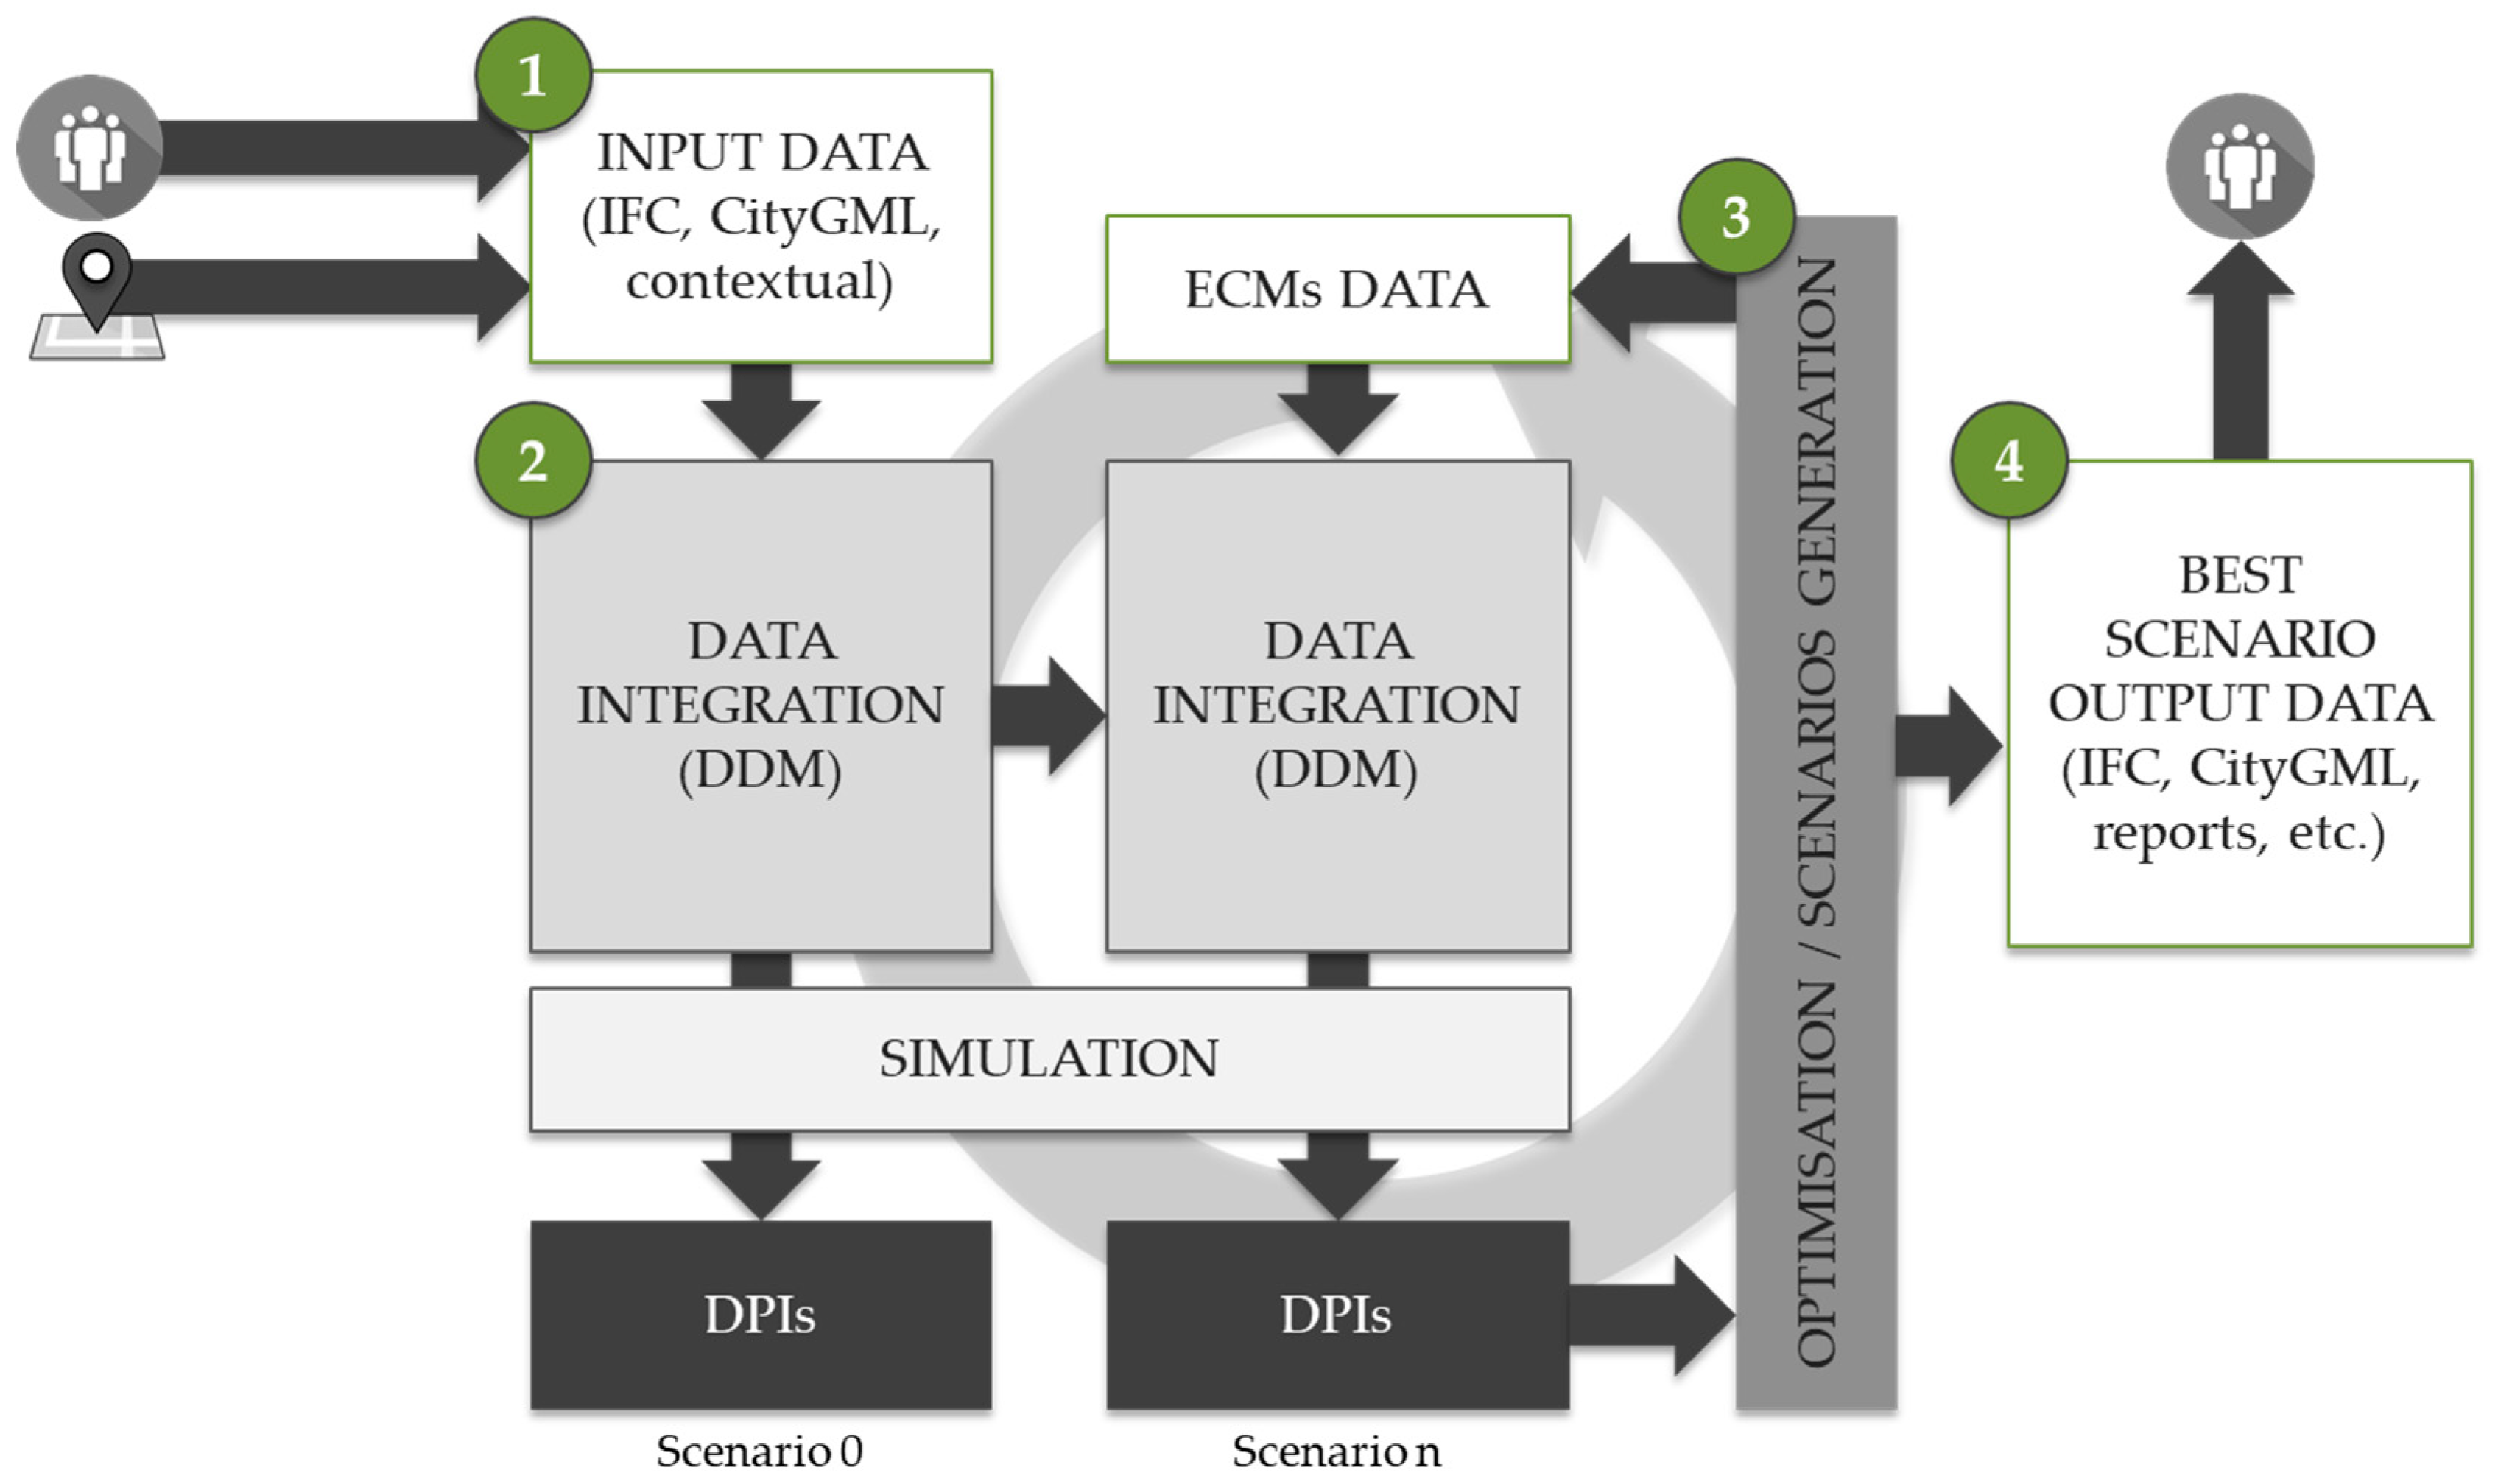
Figure 1, the OptEEmAL tool combines four processes into an integrated solution around an interoperability framework to ensure appropriate use and exploitation of data. These processes are:
(1). Data insertion. The tool has been designed to exploit different sources of data in order to generate the models that allow supporting the stakeholders during the decision-making and design process. Thus, the first step consists of data insertion by the users from various sources in order to feed and create the first instance of the data model. As input data, users are requested to upload Building Information Models of the buildings subject to retrofitting in IFC format [
13] and a District Information Model containing those buildings and those in the surroundings in CityGML format [
14], representing the geometry and properties of materials, zones and schedules into the tool. To appropriately elaborate the BIM and CityGML files, a set of guidelines has been produced that contains the main instructions to avoid errors and to insert the minimum data required by the OptEEmAL tool [
15,
16]. Considering the geo-reference inserted through the CityGML, the tool then retrieves data from existing data sources as Eurostat or climate data databases in order to complete the information with energy prices and weather conditions of the district location. This step also covers two core functionalities of the tool, which are the matching of the IFC and CityGML files, and the insertion of information about the building and district energy systems. All this information is then mapped onto the District Data Model (DDM), which, based on OWL technologies [
17], makes it possible to model all required data for the functionalities covered by the tool. To map this information, first an important process of data quality checking is implemented, which covers the validation of the files and information provided by the users and external data sources and ensures its quality for the purposes of OptEEmAL. This data checking evaluates geometry errors or data completion among others. A set of tools [
18] has been designed and implemented for this purpose.
(2). Data integration and baseline calculation. Once all data is uploaded and its correctness has been checked, the first instance of the DDM is then populated and used to generate a set of simulation data models to assess the current conditions of the district (the so-called baseline scenario). This baseline scenario is characterized by a set of District Performance Indicators (DPIs), which establish the performance of the group of buildings in the fields of energy, environmental, economic, comfort, social and urban aspects. The calculation of these DPIs is done through a set of simulation tools that have been integrated into OptEEmAL in order to calculate the indicators and then to post-process and aggregate them to compute the DPIs. In total, there are four tools that enable these calculations:
Energy Plus [
19] (to compute the energy demand related indicators); a tool specifically developed for OptEEmAL called the
HVAC tool [
20] (to compute the energy consumption related indicators); the
NEST tool [
21] (to compute the environmental indicators); and the
Economic and Social Indicators’ Calculation Tool [
22], developed to compute the indicators in these two fields. All these tools together form the Simulation toolbox of OptEEmAL, which uses as input data the information stored within the DDM and provide as outcome the DPIs computed and post-processed.
(3). Scenarios generation and optimisation process. Considering the results from the baseline, the third steps forms the core process of the tool, which provides a set of solutions to the problem formulated by the user, understanding such problem as a district to be retrofitted to improve its energy efficiency. In this step, a set of models and tools are executed to formulate a mathematical problem that allows optimising the DPIs according to a set of rules and for a set of candidate scenarios. These scenarios are generated as combinations of Energy Conservation Measures (ECMs), which are divided into passive, active, renewable and control technologies. These solutions are catalogued within a database that is completely interoperable with the DDM and which contains geometrical, energetic, economic, technical, and maintenance information of a set of 135 measures that can be incorporated into the elements of the buildings, replacing existing assets (e.g., replacing existing boilers) or being added to the originals (e.g., an external insulation to the walls). A component called
Optimiser is the one responsible for generating populations of candidate retrofitting scenarios as combinations of ECMs and following certain rules of incompatibility among them, and also only considering those measures that have been checked and approved by the users of the tool, to avoid proposing solutions not compatible with the users’ expectations. These scenarios, in the form of scenario vectors, are then mapped to generate as many instances of the DDM as there are scenario vectors in each iteration, and then, following the same steps as for calculating the baseline, they are transformed into simulation data models for computing and post-processing the same DPIs in the categories described above. This process is repeated until the stopping criteria are met. The optimisation aims at finding the best set of scenarios among the proposed populations evaluated in a cost-benefit function that integrates and aggregates the DPIs following a weighting scheme that represents the priorities of the users of the tool, as is explained in
Section 2.1. The stopping criteria are also set by the users in the form of targets of boundaries for certain DPIs (e.g., maximum investment, desired energy savings, or desired CO
2 emissions avoided).
(4). Outcomes export. Finally, the users are presented with a set of best retrofitting scenarios in a Pareto front [
23], allowing them to select the desired scenario or scenarios and exporting the outcomes produced by the tool in the form of reports for the baseline and selected scenario(s), list and detailed description of the ECMs considered by the scenario, and models of these ECMs that can then be visualised and used by other external tools.
All these four processes together allow for delivering more informed decisions and reducing time and costs of the design process, having also an impact on the subsequent stages of the process through elements as the use of BIM.
2.1. End-User Interaction and the Importance of the Prioritisation Criteria
The role of the users within the tool is an essential element, as one of its main objectives is to overcome the existing barrier of the fragmentation existing within current retrofitting processes. Based on the IPD approach [
24], OptEEmAL fosters the interaction and more efficient collaboration among stakeholders, which are represented in the tool as three main roles: project owner, project primer designer and project main constructor, enabling the registration of several users for the roles of prime designer and primer constructor. These three roles are entitled to cover specific steps of the design process and to provide inputs to them, such as the establishment of boundary conditions, targets, barriers, and, especially, the prioritisation criteria that drives the optimisation of the candidate retrofitting scenarios.
Therefore, the problem is formulated in order to find the set of scenarios that fulfil several requirements and that maximise or minimise certain indicators according to their relative importance for the stakeholders involved in each specific case. According to the principles of IPD, decisions should be made following consensus [
25]. The tool only allows the user registered as the owner to insert prioritisation criteria. However, this information is then shared with the remaining users registered as prime designers and prime constructors, who need to approve the relevance of the criteria inserted by the project owner.
2.2. Turning Subjective Information into a Mathematical Problem
As explained before, the OptEEmAL tool has been designed and developed in order to transform input data into a mathematical problem to support decision making and optimise the design of retrofitting projects. The importance of the criteria that forms the evaluation scheme of the tool is essential in order to ensure an appropriate generation and evaluation of candidate retrofitting alternatives, and therefore needs to be correctly formulated. As explained in [
26], there are several mechanisms to transform subjective information into weighting schemes that represent the importance of a set of indicators for a given problem. In this case, the pairwise comparison of the indicators is the one selected, which is a relatively unbiased method that applies one value of importance (from 1 to 9) to the indicators by pairs, therefore preferring one indicator over the other.
The intensity of importance is therefore represented by a scale of numbers, where 1 shows equal importance, 3: moderate importance, 5: strong importance, 7: very strong or demonstrated importance, and 9: extreme importance [
27].
3. Methodology
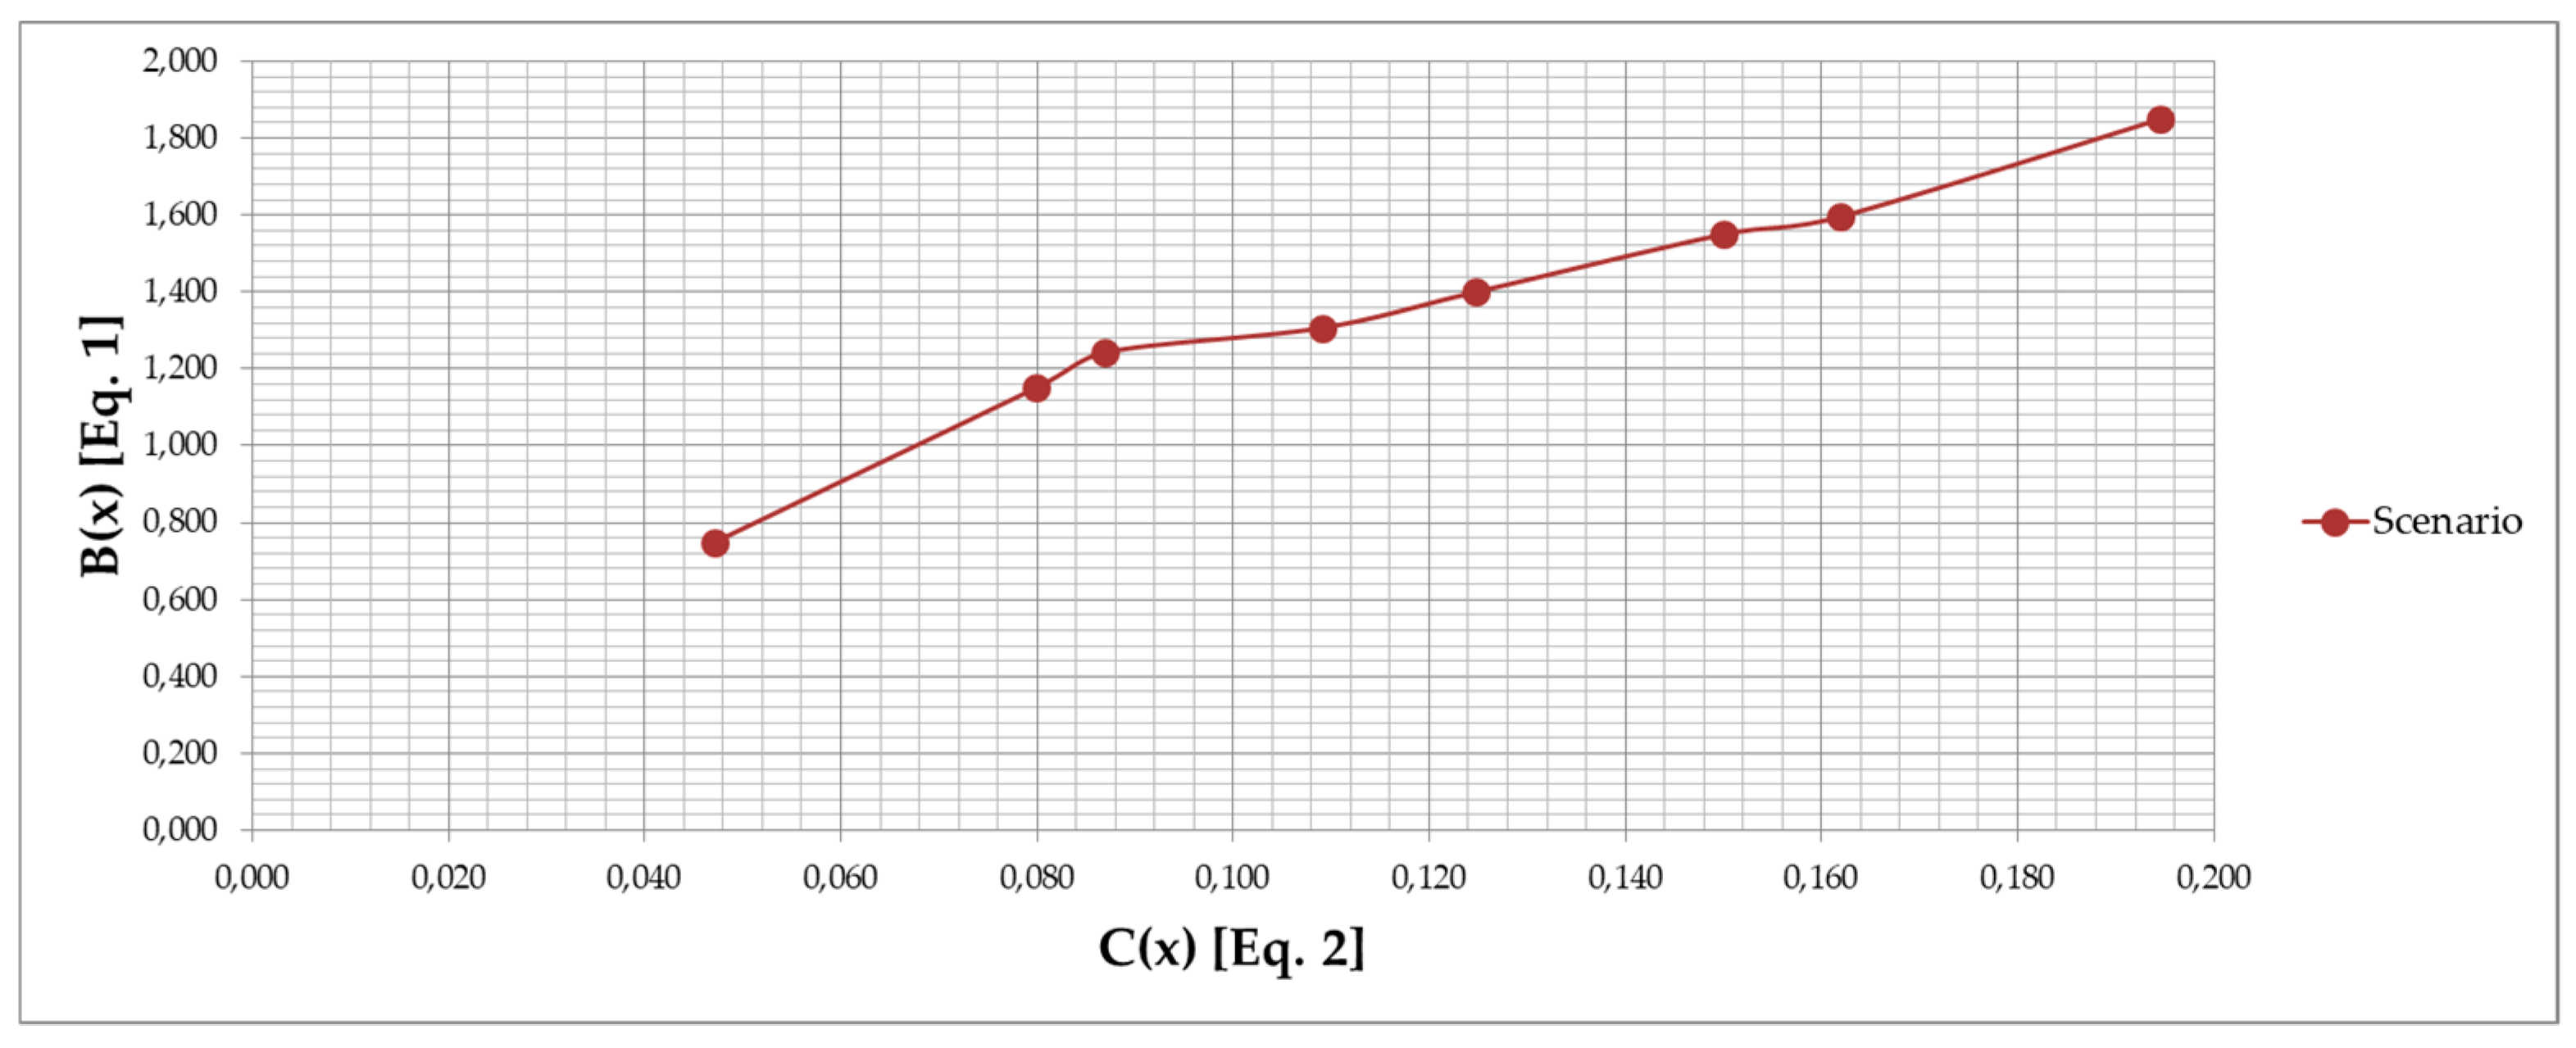
An optimization problem is one that aims to find a solution that maximises (or minimises) a function. In the case of OptEEmAL, the optimisation problem was defined as finding the best set of scenarios that maximise the benefits and minimise the costs represented as an aggregation of DPIs. Thus, it combines a bi-objective function optimisation, where benefit and costs are based on a weighted aggregation of a set of indicators calculated through the simulation tools that form the simulation toolbox.
The evaluation scheme of the tool was created using 42 indicators that characterise the performance of the district in the relevant fields of energy, comfort, environment, economic, social, urban and global. Based on this group of indicators, which form the evaluation scheme of the tool, 18 were selected to formulate the optimisation problem, belonging to the groups of energy, comfort, and environment and economic aspects. Then, they were categorised into benefits and costs, where benefits were all those indicators that result in an improvement of the district performance (e.g., energy savings or comfort improvement), while those that formed the cost function are not only related to economic aspects, but cover all fields that provoke a negative impact associated with the district performance (e.g., CO2 emissions).
Considering this approach, the cost and benefit functions have been built as explained in the following subsections, being this the basis for the evaluation and optimisation of candidate retrofitting scenarios within the tool.
3.1. Building the Cost-Benefit Functions
As depicted above, a cost-benefit function drives the OptEEmAL optimisation. These functions are formulated in the following manner:
where:
These functions therefore represent the performance of the district for every candidate scenario (x) and are those to be optimised in order to find the set of best scenarios according to the prioritisation criteria that has been inserted as weights to the indicators.
Therefore, the weighted sum of the normalised indicators for the fields referred in
Figure 2 makes it possible to calculate the cost and benefit for each scenario and to represent them into a graph where the Pareto front displays those that are considered optimal against the selected criteria.
The following
Table 1 shows the three groups of indicators which form the cost and benefit functions [
28]:
3.2. Generation of Weighting Schemes
Using the method of pairwise comparison of indicators as explained above, the weighting schemes are generated by transforming the relative importance of the criteria given by the users into values of weights. This is done through the calculation of the eigenvectors of the matrices generated formed with the values that compare the importance of the pairs of indicators, which are reciprocal [
29].
The OptEEmAL tool has implemented two methods to allow the users to select the priorities in order to guide the generation and evaluation of scenarios. In the first method, they can manually compare each pair of indicators through a graphic user interface that displays a set of sliders aimed at selecting the importance, as described in
Section 2.2.
After the comparison of the indicators, the results of the eigenvector are shown in the form of percentages of importance associated with each criterion. The second method provides a set of pre-loaded weighting schemes that have been externally formulated and loaded into the platform following the same method of pairwise comparison.
3.3. Configuration of Pre-Defined Weighting Schemes
Following the approach described above, the tool offers two methods to establish the weights of the prioritisation criteria. The first gives the stakeholders the possibility to carry out a process of pairwise for the groups of indicators defined in
Table 1, while the second offers pre-defined weighting schemes which include pre-calculated weights as stated above [
30]. Within the second option, a total of 7 pre-defined schemes are offered, where each is focused on a strategy to drive the design of the retrofitting project:
Scheme 1: Priority to achieve a nearly zero energy district. Gives greater importance to the indicators that reflect a very low energy demand, while covering the energy required with a significant contribution of renewable energy sources.
Scheme 2: Priority to achieve a carbon neutral district. The emphasis is on the aspects that reflect the carbon neutrality of the district, giving greater importance to CO2 reduction and increase of renewable energy share.
Scheme 3: Priority to energy generation through renewables. Gives higher importance to the generation of energy through RES, with equal importance to all sources, while the reduction of the energy demand is not as relevant as in Scheme 1.
Scheme 4: Priority to energy generation through renewables (solar thermal and photovoltaic). Similar to the previous scheme, it gives higher importance to RES generation, but, in this case, to the production through solar technologies, both thermal and photovoltaics.
Scheme 5: Priority to energy generation through a district heating network. The highest relevance is given to the generation of energy through a district heating network.
Scheme 6: Priority to environmental issues. The emission of CO2, the life cycle cost and the generation of energy through renewable sources are the indicators with highest relevance within this scheme.
Scheme 7: Priority to reduce operational energy costs. The main importance is given to the indicators that reflect the reduction of final energy consumption, net fossil energy consumed and the energy payback time.
The following
Table 2 shows the weights of the indicators of each group under the pre-configured scenarios within the OptEEmAL tool:
All these schemes are incorporated into the tool in order to allow the user to select one of them for the evaluation and optimisation of the candidate retrofitting scenarios.
4. Case Study: The Cuatro de Marzo District (Valladolid, Spain)
4.1. General Introduction
The
Cuatro de Marzo district is a residential neighbourhood located in the city of Valladolid, Spain. All the buildings were built between 1955 and 1960. The
Cuatro de Marzo district is a compact residential area of dwellings of medium-poor construction quality that are progressively ageing, and is demarcated between Pisuerga River and Paseo Zorrilla Avenue. This district has already been retrofitted under the R2CITIES project [
31,
32], and therefore data exist for both the pre- and post-retrofitting situations. This case has been used within OptEEmAL for validation purposes, in order to assess the accuracy and performance of the tool and also to evaluate the usability of the tool. In this paper, the focus is given to the assessment of the consideration of priorities in order to appropriately generate, evaluate and optimise candidate retrofitting scenarios. Thus, a set of simulations have been carried out using the pre-defined weighting schemes described above.
The district under study presented a situation of very low energy efficiency, accompanied by a low level of comfort conditions in some of the dwellings. These are equipped with individual energy systems (generally natural gas boilers) without any RES contribution and with high energy consumption values, resulting into high energy bills for the owners. The retrofitting project was designed to improve these conditions, focusing on improving the comfort conditions while reducing the energy consumption and integrating renewable sources [
33].
The aim of this study is however to evaluate the impact of selecting different prioritisation strategies and to assess how this leads to the proposal of different combination of energy conservation measures to improve the district and its buildings.
4.2. Buildings Under Study
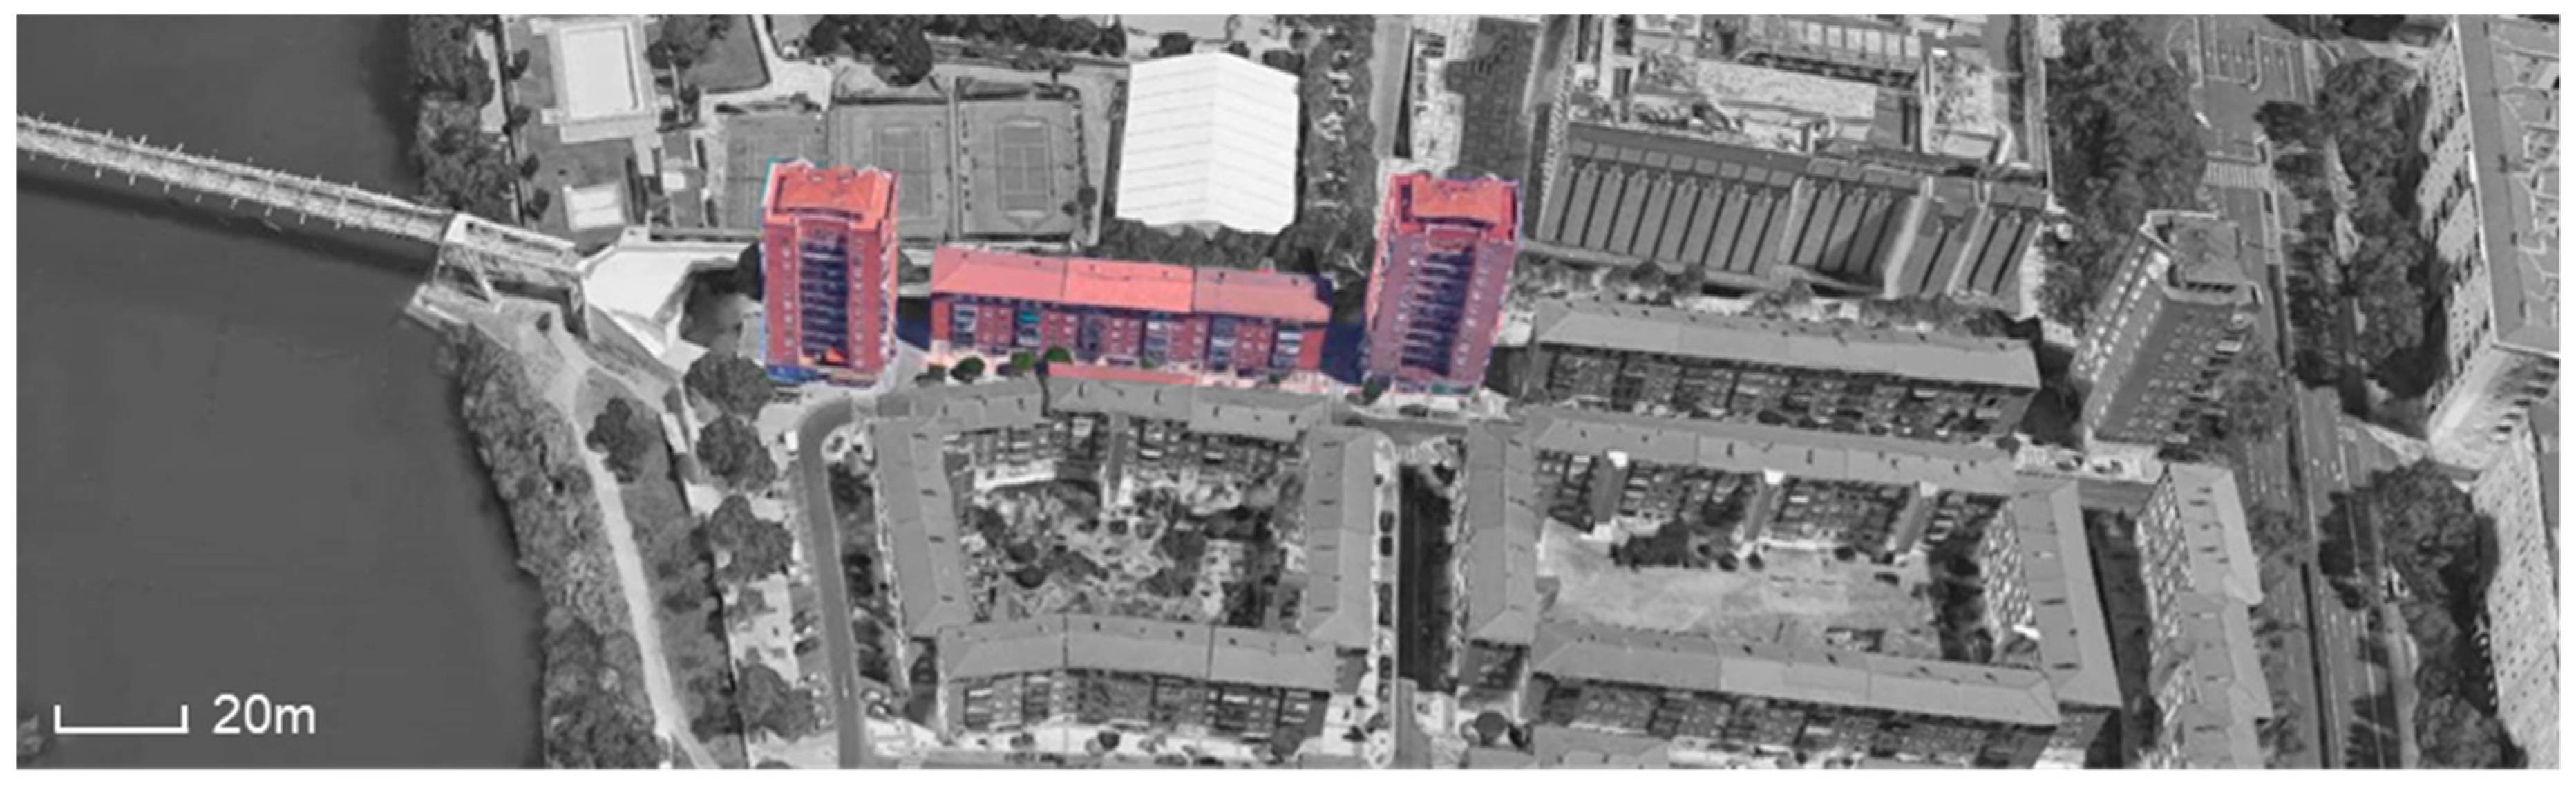
The total neighbourhood is composed of 190 buildings with a total of 1947 dwellings belonging to two main typologies: tower and block. For this case study, 5 buildings were selected, representing 2 towers and 3 blocks, including a total of 150 homes and 302 residents [
12].
All 5 buildings are exclusively dedicated to residential use. The selected buildings are those shown within
Figure 3, which are located on the North side of the neighbourhood.
4.3. Elaboration of Input Data
As explained in
Section 2, the first step is to elaborate the input data that is required by the tool. These data include the BIM models of all the buildings existing in the district, the CityGML model representing these buildings and those in the surroundings, and data related to the energy systems existing in the current conditions of the district. As mentioned in the methodology, the appropriate modelling of data is essential to ensure that the tool can perform the processes for integration and mapping. Thus, the BIM and CityGML (OGC Making location count., MA, USA) guidelines introduced before have been used in the modelling of the 4 BIM models that represent the 5 buildings (one for each block and one for the two towers) with the use of Autodesk Revit
TM (Autodesk, CA, USA) [
34], and the CityGML that represents the district, which has been modelled using CityEditor (
https://extensions.sketchup.com/sv/content/cityeditor-2) plugin [
35] for SketchUp (
https://www.sketchup.com/) [
36].
The BIM models are exported in IFC using an exporter for Autodesk Revit
TM, which has been created specifically for the OptEEmAL (
https://www.opteemal-project.eu/) tool in order to ensure that information about materials and schedules are correctly exported.
4.4. Configuration of the Problem: Insertion of Data and Use of the OptEEmAL Tool
After the input data has been generated as explained in the previous section, it is inserted into the tool in order to launch the design process. For this, the first step is the configuration of the problem within the tool through uploading the models and inserting the baseline information, while adding the existing boundary conditions, barriers, prioritization criteria, etc.
4.4.1. Uploading and Matching of BIM and CityGML Models
The first step within the tool is dedicated to uploading the IFC and CityGML models and to matching them through an interface that has been created for this purpose. Thus, after uploading one CityGML for the project, it is displayed within an interface that shows the CityGML footprint over a map displayed in Bing Maps
® (Microsoft Corporation Technology company, WA, USA) [
37] along with the list of IFC files uploaded. Once the files are uploaded, there is a process of quality and completeness checking that is launched through the use of internal tools that allow assessing that files are completed and that no geometry problems exist.
The user can then select the IFC files associated with the buildings in the CityGML footprint, which are then matched. A set of enrichment processes are then launched as, for example, to identify the main surfaces of the district that generate shadows in the buildings selected to be retrofitted through a tool developed for this aim called DNS [
38].
4.4.2. Baseline Energy Systems
Once the files are uploaded and matched, the next step considers the insertion of the baseline energy systems. This has been implemented in the tool through a dedicated questionnaire that allows the user to select the generation and distribution systems, as well as the terminal units. This is done through a catalogue of systems that are parametrised on the basis of the values inserted by the user.
For the case under evaluation, all dwellings are equipped with non-condensing individual boilers with 18kW of capacity based on natural gas. Their efficiency is 0.722 and the start and stopping time are unknown. For the selection of distribution systems, the users are shown with the list of zones as inserted in the IFC file, which are extracted from the file and displayed in a list with the possibility to select the units corresponding to each of them. In the case under study, all the zones are equipped with baseboard heating systems.
4.4.3. Targets, Boundaries and Barriers
The completion of data related to the buildings and their energy systems is then followed by the establishment of a set of targets, boundaries and barriers that allow completing the statement of the problem formulated within the tool. The targets and boundaries are mainly related to DPIs, while the barriers are related to the potential of implementation of certain ECMs.
For the case under study, a maximum investment of 950,000 € was set, while the desired payback period was established as 18 years, and the energy payback time as 35 years.
Regarding the questionnaire to establish the barriers related to ECMs, the case allows for internal and external insulation of walls, and modification of windows and roofs, while external insulation of roofs is not permitted. Renewable energy sources can be added, and both PV and solar thermal can be installed, while there is no available space to implement biomass boilers. Finally, an energy control system can be installed to optimise the performance of energy systems.
4.4.4. ECMs Proposed
After completing the questionnaire that allows the users of the tool to state a set of boundary conditions related to barriers, the tool displays a set of candidate ECMs to formulate the retrofitting scenarios. The users then need to review and check these proposed ECMs in order to discard or add measures, and they also have the possibility of editing certain parameters, such as costs related to the technology, its implementation or its maintenance. From the ECMs proposed for the case under study, those listed in
Table 3 were selected as candidate measures for the retrofitting scenarios.
4.4.5. Prioritisation Criteria
Three prioritisation schemes have been used for evaluating and optimising the candidate retrofitting scenarios according to the weights shown in
Table 2. These schemes are:
Scheme 1: Priority to achieve a nearly zero energy district.
Scheme 2: Priority to achieve a carbon neutral district.
Scheme 4: Priority to energy generation through renewables (photovoltaics and solar thermal).
These were the scenarios selected as they represented those that were most different from one another, while the one maximising the district heating production was not selected as this ECM was not considered by the stakeholders due to existing barriers to its implementation.
4.5. Launching the Optimisation and Visualising the Results
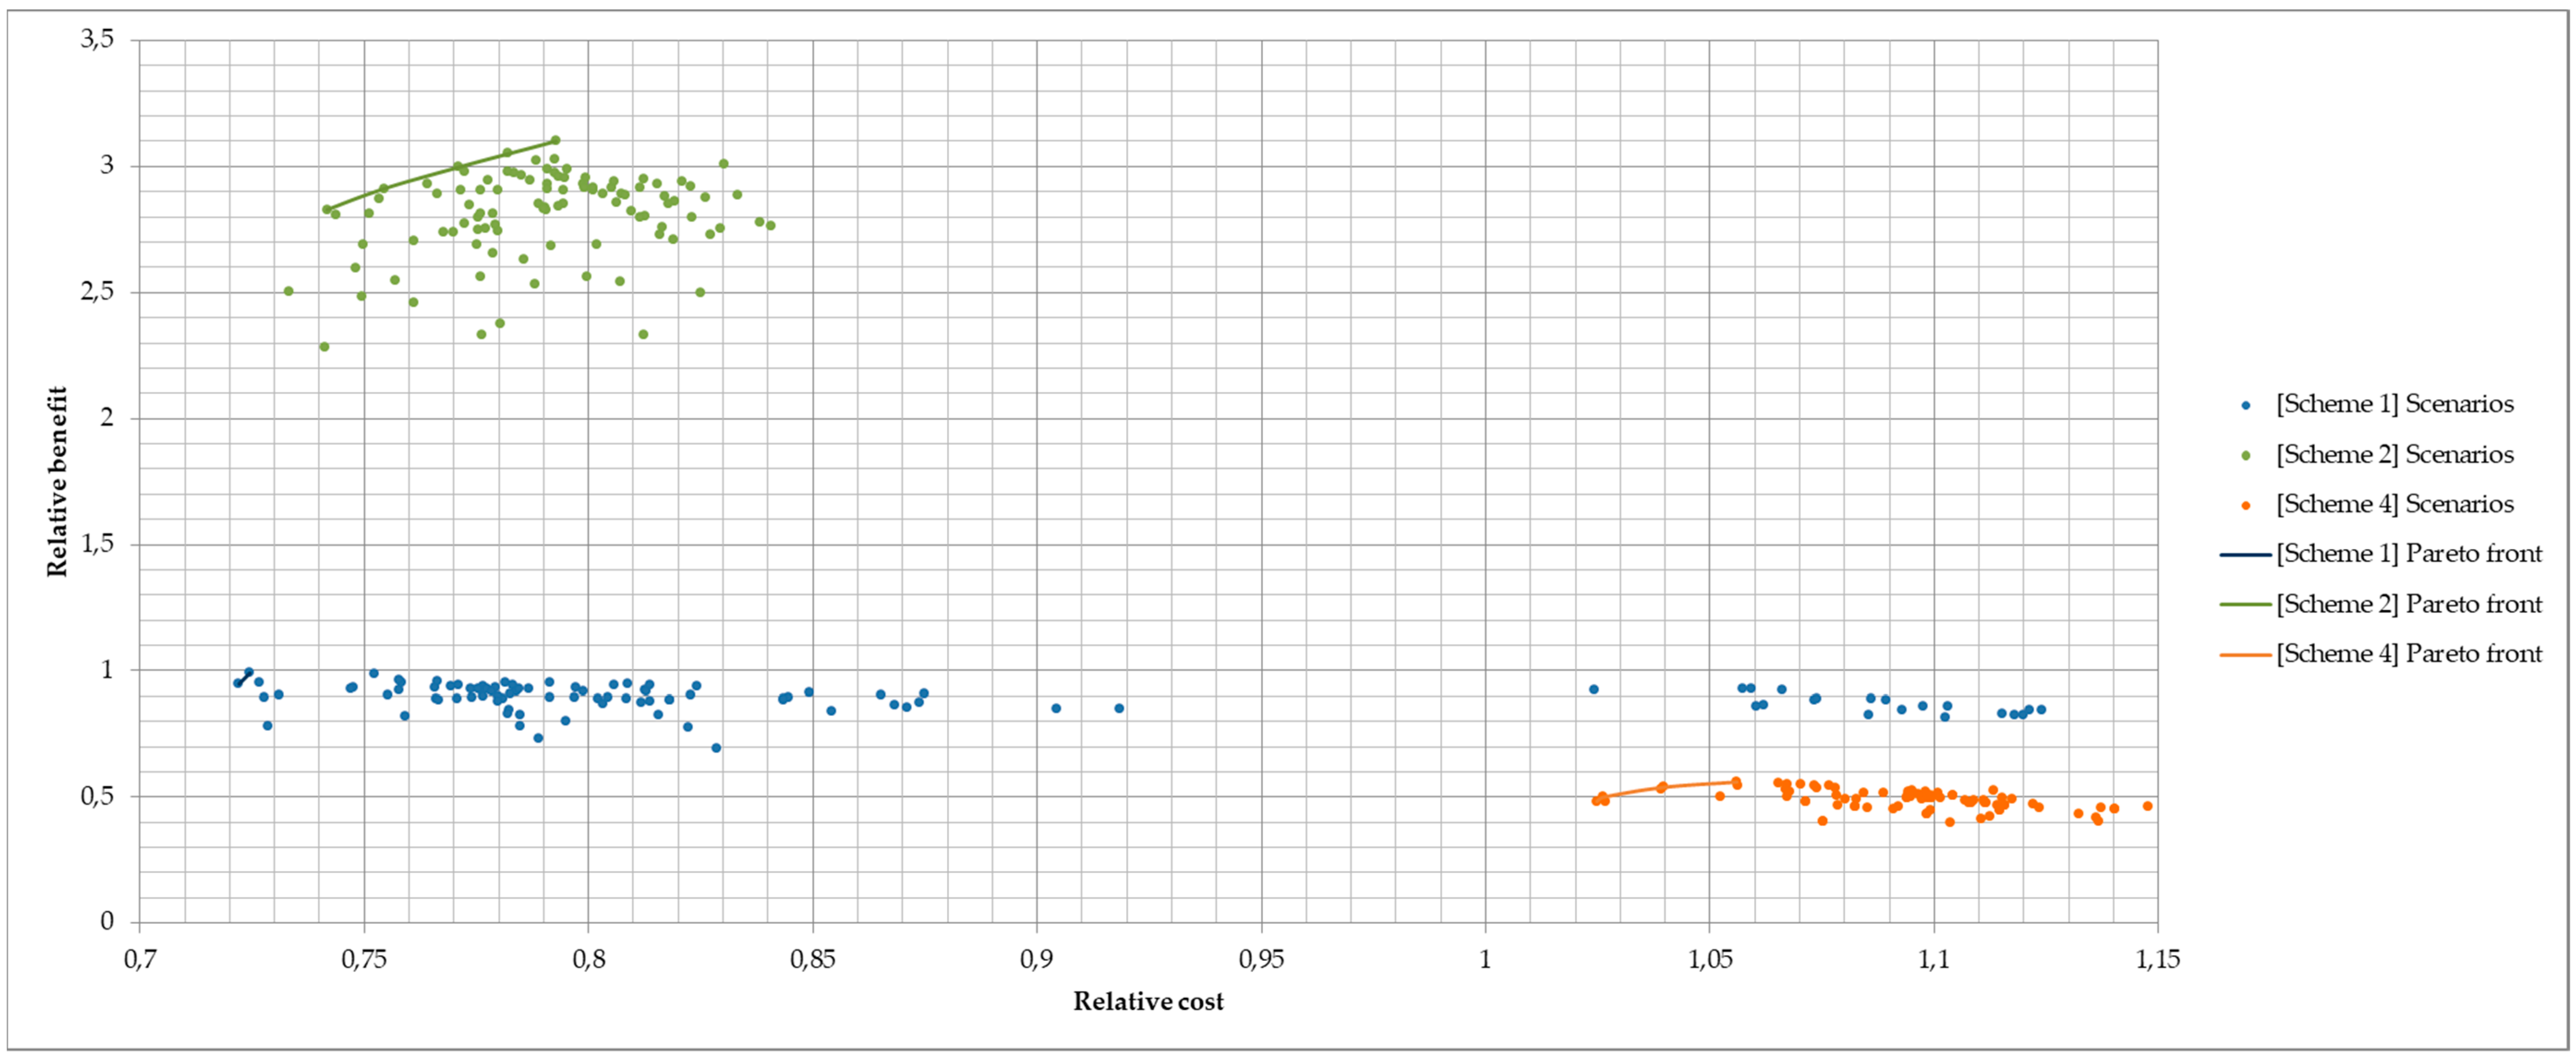
Once all the data is inserted, the tool allows launching the optimisation process and then it displays the Pareto front showing those optimal scenarios according to the boundary conditions and prioritisation criteria established by the user. For each of the prioritisation schemes, the optimisation process was launched for 10 iterations of 10 scenarios each, as shown in
Table 4.
5. Results
5.1. Baseline Conditions
The values for the indicators for the pre-retrofitting situation for the case under study are shown in the following
Table 5. Only the values of the indicators used for the optimisation are presented, while the values of the remaining indicators can be found in [
1].
5.2. Candidate Retrofitting Scenarios Proposed under Each Prioritisation Scheme
As a result of the optimisation process, a set of ECMs from those proposed as candidate measures are selected in order to generate the retrofitting scenarios.
Table 6,
Table 7 and
Table 8 show the ECMs proposed for each scenario under the three prioritisation schemes proposed.
5.3. Values of Benefit and Cost-Related Indicators under Each Prioritisation Scheme
Table 9 and
Figure 4 show the values of the indicators at district level for the main scenarios proposed under each prioritisation scheme of those selected for this experiment.
5.4. Validation of Results against Real Performance Data
To ensure the validity of the model proposed, a validation process using real data collected from the case study for the pre- and post-retrofitting situations has been carried out. The data used for the validation has been gathered from the energy bills for the pre-retrofitting situation and from monitoring systems for the post-retrofitting scenario.
From the various prioritisation schemes used to evaluate the candidate retrofitting scenarios, the first scheme (priority to achieve a nearly zero energy district) was the one selected, as it is the one closest to the approach considered when designing the retrofitting project for this district.
Table 10 shows the values of the indicators for the real retrofitting project implemented compared to the two scenarios proposed by the tool under the prioritisation scheme.
As it can be noticed from the results above, there are relevant discrepancies in some values, such as the Global Warming Potential (ENV01), the Primary Energy Consumption (ENV04) and the Energy Demand (ENE01). The Global Warming Potential is directly calculated from the Primary Energy Consumption, using the conversion factors established for the energy carriers in the district. The difference in the Primary Energy Consumption is derived from the fact that in the calculated values from the measured data, only the operational energy is considered, while for the simulated data with the tool, both the operational energy and embodied energy are considered. This also explains that the relative reduction of the indicator ENV04 is higher in the real project executed (60%) than in the simulated scenarios (31%), such as, in this case, the embodied energy of the materials required to implement the retrofitting scenario.
In the category of energy indicators, as stated above, there are deviations in the values for the thermal Energy Demand (ENE01) and Final Energy Consumption (ENE02). It should be noted that while for the real project both the energy demand and consumption show the values for the thermal energy, in the case of the tool the value of the consumption includes also the electricity consumption mainly for covering the lighting requirements (not including equipment). Bearing in mind these considerations, the difference between the values of the real project and the tool is around 20%, which, even if quite high, is still lower than the existing practices [
39].
With regards to the ECMs proposed by the tool and those implemented in the real retrofitting project,
Table 11 shows a comparison of these. From the two proposed scenarios by the evaluation procedure, the one showing higher relative benefit for a slightly higher relative cost (scenario 2) is the one selected for comparison purposes.
It should be noted that, while the same ECMs were applied to all of the buildings in the retrofitting project executed, the tool considers different ECMs for each of them, driving the optimisation problem from a district perspective where the objective is the optimisation of the set of buildings as a whole, instead of each individual building separately.
6. Discussion
In this study, the utilisation of multi-criteria decision-making techniques for optimising the design of energy efficient retrofitting projects has been shown. This was implemented through the deployment of weighting schemes based on comparing the relative importance of indicators by pairs, and which allow aggregating them into two indexes representing the benefits and costs, which then allows the implementation of a bi-objective optimisation. Three experiments were carried out to compare the results obtained through using three different weighting schemes.
These experiments were configured for the evaluation of 10 iterations with 10 scenarios each, therefore resulting in the evaluation of 100 scenarios for each scheme. Although this does not ensure convergence until the identification of the optimal scenarios, it allows the validation of the schemes through the comparison of those proposed as best from these populations.
As can be noticed in the representation of the Pareto fronts, the distribution of scenarios shows great differences among the three scenarios, even though the values of the indicators for some of them are quite similar. This is explained by the way in which the indicators were weighted and the importance given for them, resulting in values for relative cost ranging between 0.72 and 1.35, and for relative benefits between 0.35 and 3.15.
In terms of the scenarios obtained, for the first scheme (priority to achieve a nearly zero energy district) 2 scenarios are considered as best options, while the second scheme (priority to achieve a carbon neutral district) and the fourth scheme (priority to energy generation through renewables), 5 and 4 scenarios, respectively, were indicated as the best scenarios by the optimisation module. From the analysis of the indicators for these scenarios, the values of energy consumption for the achievement of carbon neutral district or prioritising the energy generation through renewables are greater, while for achieving a nearly zero energy district, the tool only proposes scenarios with a final energy consumption reduced to 83–86 kWh/m2a, and a coverage from RES of the 56–59%. Thus, for the other two schemes, scenarios with less contribution of RES for similar values of final energy consumption after the retrofitting were proposed.
Regarding the configuration of the scenarios, for almost all the candidate scenarios, passive ECMs were included for the façade, roof and openings, with a view to reducing the demand of the buildings before modifying the energy systems. Renewable energy sources were also proposed in all scenarios, combining PV and solar thermal according to the available surface within the buildings and aiming at optimising the energy balance of the whole district, therefore balancing production through RES among the buildings. However, regarding active systems, the tool proposes for most of the scenarios the modification of the existing systems in some of the buildings, and not in all them. The number of scenarios considered for the optimisation affects this selection, where a higher number of scenarios would lead to candidate alternatives with converged ECMs under the same building typology. Also, the optimisation at district level affects the selection of ECMs, where the targets to achieve and the evaluation consider the entire group of buildings as a unique energy entity. This may lead to proposals that can show unbalanced situations for certain individual buildings, but which offer the best results for the district under the boundary conditions that have been established.
When comparing the best scenarios proposed by the tool and the real implemented project, it can be concluded that they are in line with most of the strategies, although they exhibit some slight discrepancies. In the passive category, the measures proposed were: external façade insulation, roof insulation and change of windows. Meanwhile, for the windows category, the same ECM was proposed for the 5 buildings with better U-values than those implemented in reality (1.68 W/m2K against 2.7 W/m2K in the real project); in terms of roof and wall insulation, different thicknesses were proposed. This is a result of the number of scenarios evaluated, where a higher number of candidate alternatives would lead to obtaining the same or very similar ECMs for the same typologies.
In the category of RES, the tool proposes installing both PVs and solar thermal in different percentages depending on the building and the available surface. The executed project, however, included the installation of solar thermal in the buildings retrofitted as unique source. This is explained through the fact that in the project executed, the owners blocked the implementation of PVs; while in the tool, for evaluation purposes, these ECMs were allowed, aiming at the evaluation of the impacts of implementing different technologies for RES production.
For the active ECMs, the modification of boilers in the building blocks was proposed, while it was not proposed in the towers. In this case, the tool prioritised the integration of RES over changing all the active systems in the district.
Regarding the comparison of indicators, as can be seen from
Table 10, the values obtained through the platform are quite similar for the baseline, with some discrepancies due to the considerations for the calculation of the Global Warming Potential or Primary Energy Consumed from an environmental perspective. The deviations reflected for the Final Energy Consumption and Energy Demand are around a 20%, which is considered acceptable as the tool considers some fixed conditions as the occupation or set points, while the real consumption is highly dependent on modifications in these parameters.
For the evaluation of the candidate scenarios proposed, it can be noticed that values are in ranges similar to the one implemented in reality, with some discrepancies with respect to the same indicators mentioned above for the baseline. In the case of the final energy consumption, it can be noticed that it is slightly higher in the scenarios proposed by the tool than in the one implemented in reality. This fact is due to the differences in some of the ECMs proposed, with less reduction in the consumption, but higher contribution from RES.
Perhaps the most noticeable differences are with regard to the investments, which are significantly smaller for the candidate scenarios proposed by the tool than in the one implemented. This is explained through the fact that the tool proposes not changing all the boilers, as mentioned above, thus resulting in a minor investment for slightly lower savings in terms of final energy consumption but higher savings in terms of fuel energy consumed, which leads to shorter payback periods. The higher reduction of fuel energy consumed results from the integration of combined thermal and PV production, while in the project implemented only thermal energy was considered due to the restrictions established by the users. While the tool could have included these restrictions in order to avoid scenarios with PV as proposed technology, it was maintained in order to allow a richer generation of candidate retrofitting scenarios.
7. Conclusions and Future Research
This paper presented the development and implementation of a tool that integrates an evaluation procedure for the decision-making when designing energy efficient retrofitting projects. While business-as-usual considers only a reduced number of ECMs to be evaluated due to the time and knowledge required, this tool offers an automated way to generate and evaluate the candidate retrofitting alternatives. Also, this leads to reduction in errors when generating multiple models through the use of the common data model and implementation of the interoperability framework.
In this tool, an important role is played by the evaluation scheme and how it allows transforming subjective criteria into a mathematical problem in order to provide the best set of candidate scenarios to the stakeholders. This has been realised through the integration of MCDA and bi-objective evaluation into a unique evaluation method that calculates costs and benefits of each scenario where costs and benefits are an aggregation of indicators calculated at district scale.
The experiments carried out within this study have demonstrated the utilisation of this method in order to identify the best scenarios for a district characterised by a set of elements as the geometry, systems, targets, boundary conditions or priorities. Through the comparison of the simulated scenarios by the tool (both for the baseline and the optimal proposed retrofitting scenarios) with the real measured data in the buildings considered for the study it can be concluded that the tool and the evaluation method are suitable to effectively compare retrofitting scenarios and select those most suitable according to a set of boundary conditions established.
Therefore, as has been shown in this paper, the methodology deployed within this evaluation system supports stakeholders in decision-making when approaching energy efficient retrofitting projects. An important aspect of this method, and also of the complete tool, is that it is highly dependent on the input data provided by the users in terms of both the information that allows modelling the district, and also the configuration of the problem in terms of establishment of priorities, boundary conditions or targets.
As future work, this method should be further evaluated through different cases that will make it possible to improve the procedure for an increased number of buildings, ECMs and with different configurations of priorities (not only the pre-defined schemes, but also with schemes produced by the users of the tool).

 ,
, 


