Article

A Comparative Analysis of Fuzzy TOPSIS and Geographic Information Systems (GIS) for the Location Selection of Shopping Malls: A Case Study from Turkey

Department of Business Administration, Faculty of Economics and Administrative Sciences, Yildiz Technical University, 34210 Istanbul, Turkey
*
Author to whom correspondence should be addressed.
Sustainability 2019, 11(14), 3837; https://doi.org/10.3390/su11143837
Submission received: 15 May 2019 / Revised: 10 July 2019 / Accepted: 11 July 2019 / Published: 14 July 2019

Abstract

:
Multi-criteria decision-making (MCDM) techniques are increasingly being used for the problem of location selection, which directly affects the long-term success of a company. Besides these techniques, with the advantage of handling both spatial and non-spatial data, geographic information systems (GIS) also represent a useful method for selecting the appropriate location for different kinds of facilities and sites. In this respect, this study aims to compare the results of a MCDM technique, fuzzy technique for order preference by similarity to ideal solution (TOPSIS), and GIS for the location selection of shopping malls in Turkey. According to the results of both fuzzy TOPSIS and GIS, the Marmara region was determined as the best alternative for shopping malls in Turkey.

1. Introduction

Decision making is a process that involves scientific approaches in determining the options in overcoming negative issues that are experienced in the operation of any establishment and selecting the best among these options. The modern approach of running a business makes it indispensable to use scientific approaches that are improved and suitable for today’s conditions in the decision-making process. Making accurate decisions requires sufficient knowledge of the system where problems are experienced and, most importantly, requires developing a reliable mathematical model (algorithm) that represents the problem or problems well. The secret of corporate success today is considered to be the diversity of the scientific approaches that are used in decision-making processes. Moreover, rapid developments and competitive conditions also make it indispensable to act together when solving problems and as well as use modern technological processes.
In this context, location selection, which provides a methodological framework to identify the rules and criteria for the space deployment of production, trade and service activities, has been considered to be an important research theme and has attracted a growing attention of researchers from various scientific disciplines. Additionally, due to its significant and long-term effects on business risks, costs and revenues, location selection also represents one of the most important strategic business decisions [1,2,3,4]. The location selection process, which involves identification, analysis, evaluation and selection among alternatives, is influenced by many quantitative and qualitative criteria or factors such as investment costs, human resources, the availability of acquirement material, natural conditions, infrastructure conditions, proximity to the raw materials and market, market size and demand conditions, firm strategy and rivalry, related and supporting industries, etc. [3,4,5,6,7,8]. In this sense, it can be easily said that location selection represents a typical multi-criteria decision-making (MCDM) problem [3,4,5,9,10,11].
As an advanced and a widely used subdiscipline of operations research, MCDM basically represents a decision-making technique that can be used to evaluate a number of alternatives by taking into account multiple and usually conflicting criteria that may be quantitative or qualitative, and aims to provide support to the decision maker for making the choice between alternatives [9,12,13,14]. In this framework, MCDM can be defined as the process of evaluating alternatives for the purpose of selection or ranking via utilizing a number of qualitative and/or quantitative criteria that have different measurement units [15].
MCDM involves a set of techniques such as min-max, max-min, ELECTRE, PROMETHEE, TOPSIS, fuzzy TOPSIS, compromise programming, analytic hierarchy process (AHP), fuzzy AHP, data envelopment analysis, and goal programming, that can be used for comparing and prioritizing multiple alternatives and finally selecting the best-fit choice [16]. Among these techniques, for the solutions to location problems that contain vague and incomplete data and linguistic variables, fuzzy decision-making techniques have been attracting growing attention [12,17].
On the other hand, it should be stated that these techniques are not suitable for spatial data [18]. In this context, with the advantage of handling both spatial and non-spatial data, geographic information systems (GIS) have been applied for solving location problems [18,19,20]. GIS represent computer-based tools that can be used for maintaining, managing, integrating and analyzing spatial data from different sources. GIS allow us to store, edit, manipulate and analyze geographically referenced data to generate interpretive maps and related statistics relevant for decision making [11,14,21]. In this sense, one could say that although MCDM and GIS have developed independently, they actually support one another and their combination generates more useful and reliable information that makes it possible to reach accurate decisions, especially in the case of location selection [11,14,22].
Starting from this point of view, this study intends to compare the results of a MCDM method and GIS. More specifically, it is aimed to analyze the results of a fuzzy TOPSIS method and GIS that were applied to the problem of location selection for shopping malls in Turkey.
In Turkey, the first modern shopping mall opened in Istanbul in 1988 [23,24,25]. From that date, the number of shopping malls in Turkey has been increasing significantly [26,27]. According to a recent report, the number of shopping malls, which was 12 in 1995, reached 400 as of July 2017 [28]. The increase in population and income, the changing leisure and consumption patterns, the modernity provided by the shopping malls and macro-level changes in the political, economic and social environments of Turkey are seen as the main reasons for this significant increase in the number of shopping malls [25,26,29,30,31]. As stated by Tabak et al. [25], these developments are still continuing and creating a severe competition in the sector. In this framework, investigating the most suitable location for shopping centers represents a difficult task for investors in Turkey [30].
Furthermore, from the sustainable development perspective, the economic, environmental and social impacts of shopping malls’ locations on retail and urban systems have been well recognized especially in the urban planning literature [29,32,33]. The economic dimension of sustainable development simply indicates that the location of a shopping mall should make it possible to achieve and sustain high profitability in the long term. From a broader perspective, the shopping malls should also provide economic opportunities such as employment, chances to start up new businesses and an increase in trading volume as well as household income for the community that they serve [34,35]. With regard to the environmental aspect of sustainable development, the locations of shopping malls have a direct impact on the amount of carbon emissions and energy consumptions sourced from transportation. Additionally, out-of-town shopping malls in particular have increased traffic load and occupy a higher amount of green areas in recent years [32,35]. Therefore, the location of shopping malls should minimize these negative impacts. Finally, regarding the social dimension of sustainable development, out-of-town shopping malls isolate and exclude households without cars, the elderly and lower income households and have negative impacts on the vitality of traditional town centers and shopping streets; thus, the locations of shopping malls should also enhance social inclusion and social vitality in local shopping spaces [32,34,35]. In this framework, in the process of determining the optimal location for shopping malls, investors need to synchronize economic, environmental and social aspects to achieve the goals of sustainability [36].
The rest of the paper is structured as follows. The next section presents the related literature and theoretical framework. Section 3 describes the materials and methods. The results are discussed in Section 4 and, finally, Section 5 contains concluding remarks.

2. Literature Review

Retail site location has been considered to be one of the most important factors affecting the retailer’s success or failure for a number of reasons. First of all, the location of a store or a shopping center makes the products or services available to customers; thus, good locations are likely to attract large numbers of customers. Additionally, considering the rapid increase in the number of retail stores and shopping malls, with nearly identical product and service offerings, slight differences in location can have a substantial effect on sales performance and profitability. Finally, the disadvantages or problems of an initially wrong decision in retail store location are extremely difficult to overcome as the location decision represents a long-term, fixed investment which is immobile and unique [37,38,39].
Given the importance of the issue, retail location decision has become the subject matter of different disciplines such as marketing, urban sciences, economics, geography, applied mathematics and geomarketing and different retail location theories, models and procedures have been proposed. In this sense, it is possible to say that retail location theory is comprised of four broad theoretical areas that are central place theory, spatial interaction theory, land value theory and the principle of minimum differentiation [38,40,41,42,43,44,45].
Central place theory provides a powerful explanation of the spatial structure of retail facilities and considers the behavior of consumers and retail firms in a spatial market. In the framework of this theory, distance to the supply point and transportation costs are the most important factors. It is predicted that the longer distance from the supply point will reduce the demand for a good or a service since customers will choose the nearest retailer [38,42,46,47,48]. Land value theory, which is also known as bid rent theory, stems from Alonso’s seminal land use model and asserts that since the supply of land is fixed, the location of different activities will depend on competitive bidding for specific sites and, consequently, all urban sites are occupied by the activities that are capable of paying the highest rentals. In this sense, it can be argued that retailers intend to pay higher rents to gain more and higher profile customers and the higher the returns for a retailer, the higher the rent that the retailer is able to pay [41,42,49,50]. The principle of minimum differentiation theory proposes that closeness to rivals is more important than closeness to consumers. In this framework, it is suggested that a given number of retailers operating in the same sector will show a superior performance if they are clustered together [41,47,49].
Finally, spatial interaction theory discards the main assumption of the central place theory which argues that consumers will choose the nearest retailer and propounds that consumers place more importance on the attractiveness of alternative shopping areas than their distances [39,40,48]. Gravity models, which are based on Newton’s law of universal gravitation, have been widely used to represent spatial interactions in the field of retail location. The first gravity model was proposed by Reilly. In this model, by utilizing size and distance between consumer and facilities as the attractiveness variables, he measured the probability of consumer patronage at one facility in a two-facility competition. According to Reilly’s model, centers of higher attractiveness—often identified with size—draw customers from greater distances than less attractive ones. This model proposes that customers trade off the cost of travel with the attractiveness of alternative shopping opportunities and has been widely used to estimate the intermetropolitan trade areas of shopping centers and [11,39,44,51]. Huff contributed to the location theory by extending Reilly’s model to multifacility competition and using revealed preference approach to analyze retail store choice [39,51]. Huff argued that consumers choose competing shopping areas as the basis of their overall “utility”. He formulated the utility of a store as the function of its size and distance. In this framework, it is suggested that the utility of a facility is positively correlated to its size and negatively related to its distance [11,22,39,41,44,52]. Huff’s probabilistic model of retail gravitation has been considered as one of the most widely used models in retail location studies [53,54]. In the framework of spatial interaction theory, by including a set of other attractiveness variables along with size, Nakanishi and Cooper (1974) [55] extended Huff’s model and proposed the multiplicative competitive interaction (MCI) model. This model is considered as a more general form of Huff’s model and incorporates both subjective variables such as consumer evaluation of store image, store appearance, service quality, visibility and brand recognition and objective variables such as number of checkout counters, credit card services, number of sections and size [39,43,44,56]. As a result of Nakanishi and Cooper’s demonstration that the parameters of MCI models can be easily estimated by ordinary least square methods, these models have become one of the most popular models in the field of retail location selection [39,44].
Based on the theories and models discussed above, it can be easily said that retail location selection represents a decision-making problem with multiple criteria. In this sense, MCDM methods have also been applied to the location selection of shopping malls in the retail location literature. These studies mainly focus on identifying multiple criteria for shopping mall location selection [11,57,58]. For instance, Cheng et al. [57] presented the comparison of analytic network process (ANP) and analytic hierarchy process (AHP) for shopping mall location selection based on twenty-four criteria under seven categories. They concluded that ANP is a powerful tool to solve the decision problem if the decision model is substantially affected by interdependent relationships.
Zolfani et al. [58] proposed a hybrid MCDM model to evaluate potential alternatives for shopping mall location selection. Based on an extensive literature review and experts’ opinions, they selected seven main criteria such as total cost, population and economic characteristics, environmental consideration, potential continuous development and flexibility, accessibility and transportation, investor’s competency and attractiveness. In order to prioritize and calculate the relative importance of the criteria, a stepwise weight assessment ratio analysis (SWARA) was applied and potential location alternatives were evaluated using the weighted aggregated sum product assessment (WASPAS) method. The authors suggested that this integrated approach can also be utilized to solve other location selection problems. Önüt et al. [30] proposed a combined MCDM approach for selecting a suitable shopping center site in Istanbul. In this approach, the fuzzy AHP technique was applied to determine the weights of the criteria and fuzzy TOPSIS was used to rank the alternative locations. The results of the study indicate that the proposed approach provides a practical methodology to rank alternatives with respect to multiple conflicting criteria for the large-scale problems. In another empirical research, Yavuz and Deveci [59] employed two different MCDM methods, fuzzy TOPSIS and fuzzy VIKOR, to determine the most suitable location for the shopping center in another city of Turkey, Erzincan. They found that the results of the two techniques indicate a similar ranking of alternative locations.
The theories, models and procedures mentioned above focus on developing location models and place a special emphasis on geodemographic factors. In this sense, GIS have been increasingly used for the purpose of location selection [11,60]. Based on a review of advances in location science and the important contributions of GIS, Murray [61] introduced that GIS have supported location modelling in four main areas: input, visualization, problem solution and theory advancement. In the context of shopping mall location selection, Cheng et al. [19] presented the application of GIS by demonstrating an illustrative project to create features related to household incomes, demand points, etc., and to set queries to find solutions for four common location problems: minimum distance, maximum demands coverage, maximum incomes coverage, and optimal center. They concluded that multi-layer maps created by GIS software enable decision makers to reach more accurate solutions for problems.
More recently, ELSamen and Hiyasat [62] examined shopping mall location selection in the area of West Amman in Jordan by utilizing GIS tools. Their results indicate that the area under stay has an excessive number of shopping malls; thus, it suffers from excessive oversupply. In this sense, they recommended the area outside the borders of the studied area for new shopping mall establishments.
In the context of Turkey, Bayar [63] investigated suitable locations for shopping malls in Ankara based on retail sector and consumer behavior reports. Similarly, upon loading semantic (socio economic) data on geographical (spatial) data, Erdin Gundogdu performed a detailed analysis with GIS, in Istanbul [64] and on a geographical region basis in Turkey [65,66].
Based on the literature mentioned above, it can be easily said that both MCDM methods and GIS can provide proper solutions for shopping mall location problems. However, the results of fuzzy TOPSIS, a popular MCDM method, and GIS have never been compared, to the knowledge of the authors.

3. Materials and Methods

3.1. Fuzzy Logic

The complexity of the system on which decisions will be made sometimes increases, the meaning of the concepts that are used to define that system decreases, and there is a tendency towards uncertainty. The ambiguity and uncertainty of the concepts that are used to define an objective and a system represent “fuzziness.” The differences in the thought systems and perceptions of people may be shown as a source of “fuzziness.” In some cases, there may be ambiguities caused by under-maturation of human thoughts, uncertainties, or “fuzziness.” In these cases, decision-making data cannot be numerical values; instead, they are replaced by linguistic variables, and in this process, the conditions of Fuzzy Logic are applied.
The concept of fuzzy logic was introduced for the first time in 1965 by Lotfi A. Zadeh in the article named “Fuzzy Sets”, in the journal “Information and Control”. Zadeh stated that the more closely real-world problems are examined, the fuzzier the solution will be. This approach of Zadeh opened new horizons in science and technology. For representing uncertainty, Zadeh developed the Fuzzy Sets theory. Initially, the terms and concepts that represented general and specific uncertainty were randomly classified and known by the theory on sets with binary values. The fuzzy sets theory, instead of randomly classifying terms and concepts that represent uncertainty, assigned levels of certainty to them and facilitated their definition in the theory on sets with multiple values [67].
The term fuzzy refers to the case that the limits of any set of values are not defined well. For example, while it is very easy to categorize a person of 1.70 m height in the category of tall people in a process of classifying people based on their heights, it is difficult to justify categorizing or not categorizing a person of 1.60 m height in this category. The reason for this difficulty is that the criterion of height does not represent a precisely defined limit. In the classical set theory, an object is either a member or not a member of a set. That is, an object cannot partly be a member of a set. The proposal of the fuzzy sets theory in 1965 by Zadeh eliminated these problems. In this theory, each member is assigned a membership degree with the membership function. The degree of membership may take values in the closed interval of [0, 1] [67].

3.2. Fuzzy Decision Making

In many situations, the data on which the decision-making process is based might not be complete and reliable. In cases where decision makers have to make decisions with uncertain and ambiguous data (fuzzy data), they are supposed to include the fuzzy sets theory in the decision-making process.
Moreover, the application of fuzzy sets in decision-making problems that are encountered in real life provides more realistic solutions. The fundamental property of fuzzy decision making is to provide a more flexible structure to eliminate problems caused by an inability to access information [68]. Likewise, one of the advantages of the fuzzy approach in decision making is that the relative priorities of qualities are represented by fuzzy numbers rather than precise numbers [69].
Hence, the main area of work for fuzzy decision making is making decisions under uncertainty. This is because the researcher has linguistic values at hand instead of numerical values related to the criteria, alternatives and results.

3.3. Fuzzy Multi-Criteria Decision Making
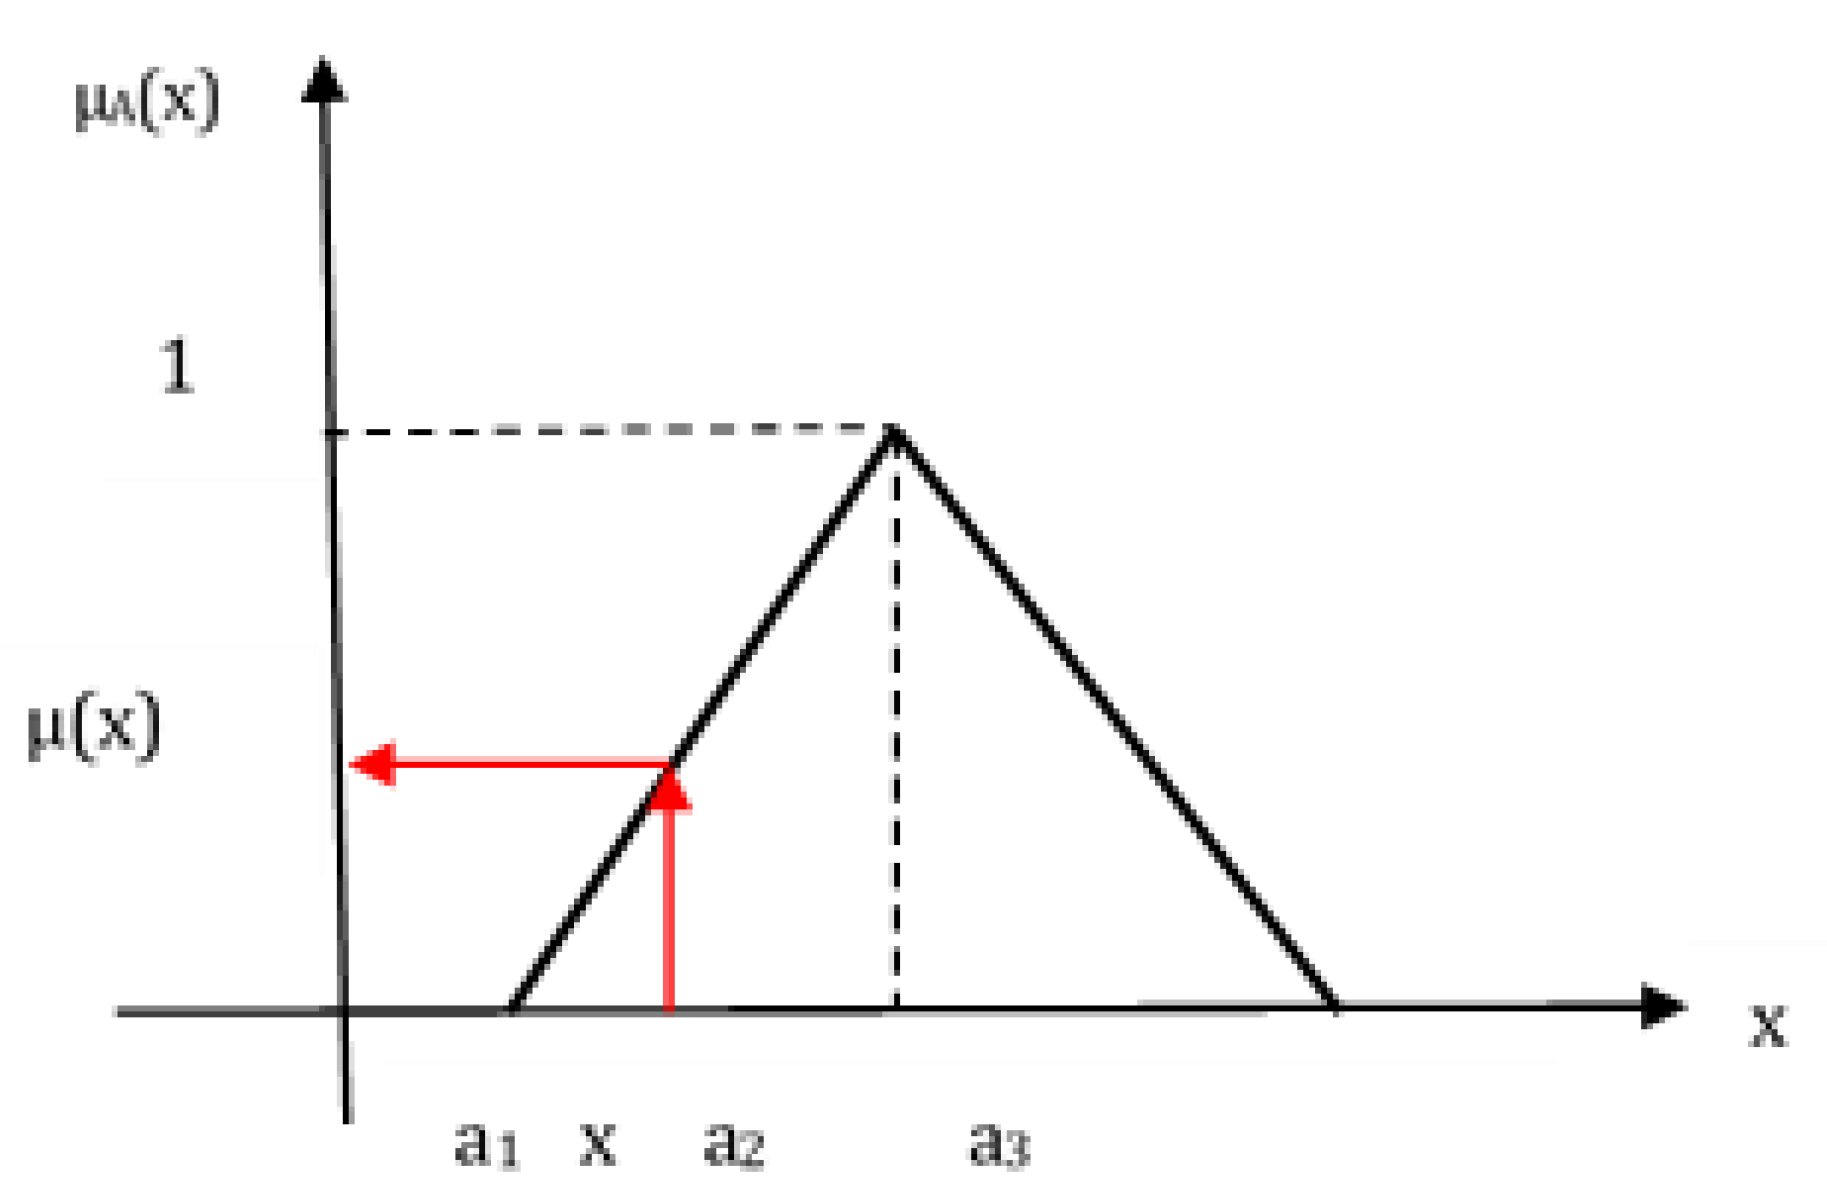
The fuzzy sets theory had significant contributions on multi-criteria decision making (MCDM), and decision analysis has become one of the most suitable fields for using this theory. By including fuzzy sets in the MCDM process, a great advancement was achieved in the field of MCDM, and fuzzy MCDM was developed. Although the classical MCDM methods assume that the weights and priorities of criteria are precisely known, they fall short in modelling problems that are encountered in reality. Fuzzy MCDM methods, in addition to allowing the use of linguistic variables in assessing criteria and alternatives, also provide effective results by quantifying uncertain data. Especially, in facility location problems, the conventional MCDM methods are considered as less effective in dealing with the vague nature of the linguistic assessment. In this sense, fuzzy MCDM methods have been attracting an increasing interest in the field of facility location [17].

3.4. Fuzzy Numbers

The term ‘fuzzy number’ is used to discuss uncertain numerical values such as “close to 10” or “about 7”. A fuzzy number is a fuzzy network quantity that is the generalized form of the real number r. Here, it is a measure of how far A(x) approaches r in value. In this case, A(r) would be equal to 1.
Fuzzy sets are defined by membership functions, and a membership function shown as μà (x) takes values in the closed interval of [0, 1].
If μà (x) = 0, the number x is not a member of the set;
If μà (x) = 1, the number x is a member of the set;
and in other cases, the presence of x in the set is defined as fuzzy.
As the value of μà (x) is closer to 1, the membership level of the element x in the set increases.
While there are different ways of expressing fuzzy numbers, generally triangular and trapezoidal fuzzy numbers are prevalently used.
For example, the triangular fuzzy number à is a special type of fuzzy number that is defined by three real numbers, and it is expressed as à = (a1, a2, a3) (Figure 1).
Among these parameters (a1, a2, a3), a1 represents the smallest possible value, a2 represents the most possible value, and a3 represents the largest possible value.
a1 and a3 are the lower limits of the fuzzy set interval, while a2 is the single number with full membership, and the membership function of such a triangular fuzzy number is defined as shown below.
μ A ( x ) = { 0 ,                         x < a 1 x a 1 a 2 a 1 ,     a 1 x a 2 a 3 x a 3 a 2 ,     a 2 x a 1 0 ,                         x > a 1

3.5. Fuzzy TOPSIS Method

The TOPSIS method is an MCDM method that is based on the main principle of the proximity of decision points to the ideal solution. The ideal solution is formed by the best accessible values of the criterion, while the negative ideal solution is formed by the worst values of the criterion. During the processes of alternative selection, the best alternative would be the one that is the closest to the ideal solution and the farthest from the negative ideal solution [70].
In the classical method of TOPSIS, the performance values and the weights of criteria consist of precise numbers. This is why it cannot account for uncertainty caused by human judgment in determining the weights and qualitative criteria. As the current practices with precise data in real-life situations fall short in terms of modelling, subjective qualities and the weights of these qualities are usually expressed with linguistic variables [71]. For this reason, researchers developed a TOPSIS method where uncertainty and ambiguity prevail (fuzziness), which uses linguistic variables instead of numerical data for decision making [72]. A decision-making process where multiple decision makers evaluate and rank alternatives in the case of uncertainty based on multiple criteria is defined as fuzzy TOPSIS. Several authors have proposed fuzzy TOPSIS methods. This study used the fuzzy TOPSIS method proposed by [73], where the fuzzy positive and negative solutions were taken as (1,1,1) and (0,0,0) respectively.
In recent years, many researchers have used the Fuzzy TOPSIS method for location selection problems. The determination of the best location for a wide range of places has been attempted, such as solar power plants [74], logistics centers [75,76,77], distribution centers [78,79], warehouses [80,81], facilities [82,83,84], hospitals [85], landfills [86], stations [87] and faculties [88]. The research shows that Fuzzy TOPSIS is a useful method to select the appropriate location for different kinds of facilities and sites.

4. Results

4.1. Solution to the Problem of Location Selection by the Fuzzy TOPSIS Method

While shopping malls have an increasing tendency to spread around the country, the issue of selecting their location remains prominent. Making decisions on selecting a location is a significant problem for MCDM. In this study, the solution to the problem in a setting involving uncertainty and ambiguity (fuzziness) was achieved by the fuzzy MCDM method of “Fuzzy TOPSIS”.
The flow diagram of the fuzzy TOPSIS method consists of the following steps:
  • Establishing a committee of decision makers,
  • Determining assessment criteria,
  • Determining linguistic variables,
  • Determining the total fuzzy weights of criteria (wi),
  • Forming the fuzzy decision matrix,
  • Forming the normalized fuzzy decision matrix,
  • Forming the weighted normalized fuzzy decision matrix,
  • Determining the values of A* and A՟,
  • Calculating the distance of each alternative from A* and A՟,
  • Calculating the closeness coefficient of each alternative (CCi), and
  • Ranking the alternatives based on their closeness coefficients.
These steps are briefly explained below:
Step 1: A committee consisting of three expert decision makers (D1, D2, D3) was formed for appropriate location selection.
Step 2: The official geographical regions of Turkey, which consist of the Mediterranean (A1), Southeastern Anatolia (A2), Eastern Anatolia (A3), Black Sea (A4), Central Anatolia (A5), Marmara (A6) and Aegean (A7) regions, were accepted as alternative locations for the location selection problem. At this step, the evaluation criteria are determined. As the determination of the criteria that will be used for evaluation of alternative locations has a direct impact on the accuracy and quality of the results, this step is crucial [89,90]. Depending on the type of the business and the problem on hand, facility location selection literature presents different approaches and techniques for identifying evaluation criteria. For instance, retail location problems may require considering a different set of criteria when compared to factory location problems [90]. In this sense, Zentes et al. [91] suggest that the analysis of the catchment area of a retailer represents a vital element in each phase of the retail location decision process. According to the authors, the catchment area represents the geographic zone that contains the customers of a specific site or region for a retailer and it determines the potential demand at a specific site and directly effects the sales and profitability of a retailer. In this framework, considering the studies carried out by Roig-Tierno et al. [22], Lin and Juan [6], Cagri et al. [90], Yavuz and Deveci [59], Cheng et al. [57], Önüt et al. [30], Zolfani et al. [58] and Kuo et al. [92] and the results of the interviews conducted with experts including urban planners, academicians and managers, six main criteria were determined for the shopping mall location selection in this study. These six criteria are regional development (C1), economy (C2), transportation (C3), population density (C4), tourism (C5) and socio-demographic characteristics (C6).
The regional development criterion includes the availability of human resources and natural resources, infrastructure, level of urbanization and potential of continuous development [6,22,43,57,58,59,90]. The economy criterion basically represents the total cost of initial investment and return on investment [30,57,92]. Transportation/accessibility refers to the availability of public transportation and proximity to the railways and major highways [30,57,58,90]. As pointed out by Dolega et al. [93], accessibility has a direct impact on the extent of retail catchment area. Population density is directly related to the sales potential of a shopping mall and the extent of its catchment area [94,95]. Furthermore, nowadays shopping has been considered as one of the important tourist activities as it constitutes an important portion of tourism expenditures [96]. Considering the fact that tourists expect better conditions for shopping, shopping malls represent an important determinant of tourism images of cities [97,98]. In this respect, the tourism potential was determined as another criterion for evaluating location alternatives. Socio-demographic characteristics include purchasing power, family structure, and spending patterns of the residents and social and cultural environment [22,43,58,59,90,92]. Simkin [99] and Simkin et al. [100] state that since the spending potential of the retailer’s catchment area population is one of the most important determinants of its financial performance, the socio-demographic characteristics of the catchment area should be taken into consideration in retail location selection.
Step 3: At this step, the appropriate linguistic variables for evaluating both criteria and alternatives are determined, and these linguistic variables can be expressed in positive triangular fuzzy numbers [4,101]. The linguistic variables that were used for evaluating the criteria and the triangular fuzzy numbers that corresponded to these linguistic variables are shown in Table 1, while the linguistic variables that were used in evaluating the alternatives and the triangular fuzzy numbers that corresponded to these linguistic variables are reported in Table 2 [73].
Step 4: After choosing the appropriate linguistic variables, decision makers determine the importance weights of the criteria as shown in Table 3 and evaluate the ratings of alternative locations with respect to each criterion. The ratings of seven alternatives under six criteria are presented in Table 4 [4,73].
At this step, the ratings of alternatives and weights of criteria are also aggregated. Assume that a decision committee has K decision makers, then the aggregated ratings of alternatives and weights of criteria can be calculated as follows, respectively:
x i j = 1 K [ x ˜ i j 1 +   x ˜ i j 2 + ... +   x ˜ i j K ]
w ˜ j = 1 K [ w ˜ j 1 +   w ˜ j 2 + ... +   w ˜ j K ]
where   x ˜ i j K and w ˜ j K are the rating and the importance weight of the Kth decision maker, respectively. Based on the equations above, the aggregated fuzzy weights of the criteria were calculated as in Table 5 [4,73,102,103].
Step 5: This step involves constructing the fuzzy decision matrix for ranking alternatives as in Table 6 [104,105].
Step 6: At this step, the raw data are normalized in order to make comparisons across criteria. The normalized fuzzy decision matrix is constructed as in Table 7 [4,105,106].
Step 7: After the normalized fuzzy decision matrix is constructed, since each criterion has a different importance, the weighted normalized fuzzy decision matrix should be constructed as in Table 8 [71,102].
Step 8: At this step, the fuzzy positive ideal solution (A*) and the fuzzy negative ideal solution (A՟) are determined as shown below by using the values on the weighted normalized fuzzy decision matrix.
A* = [(1,1,1),(1,1,1),(1,1,1),(1,1,1),(1,1,1),(1,1,1)]
A՟ = [(0,0,0),(0,0,0),(0,0,0),(0,0,0),(0,0,0),(0,0,0)]
Step 9: The distances of each location alternative from A* and A՟ with respect to each criterion are calculated as in Table 9 and Table 10 [4].
Step 10: Then, the closeness coefficient (CCi) of each location alternative is calculated in order to determine the ranking order of each alternative as shown in Table 11 [102].
Step 11: Finally, based on the closeness coefficients, the ranking order of the location alternatives can be determined. As shown in Table 9, based on the closeness coefficients (CCi), the ranking order of the location alternatives occurs as follows:
A6 ˃ A7 = A1 ˃ A5 ˃ A4 ˃ A3 ˃ A2
It is shown that the alternative A6 was the best option as it had the highest relative distance for facility location selection. Moreover, the closed interval of [0, 1] was divided into five equal sub-intervals for determining the existing assessment statuses of the alternatives based on their closeness coefficients, and linguistic variables were defined for all sub-intervals (Table 12) [102].
According to Table 11 and Table 12, A6, A1, A7 and A5 were found acceptable, A4 was found advisable with low risk, and A3 and A2 were found advisable with high risk.

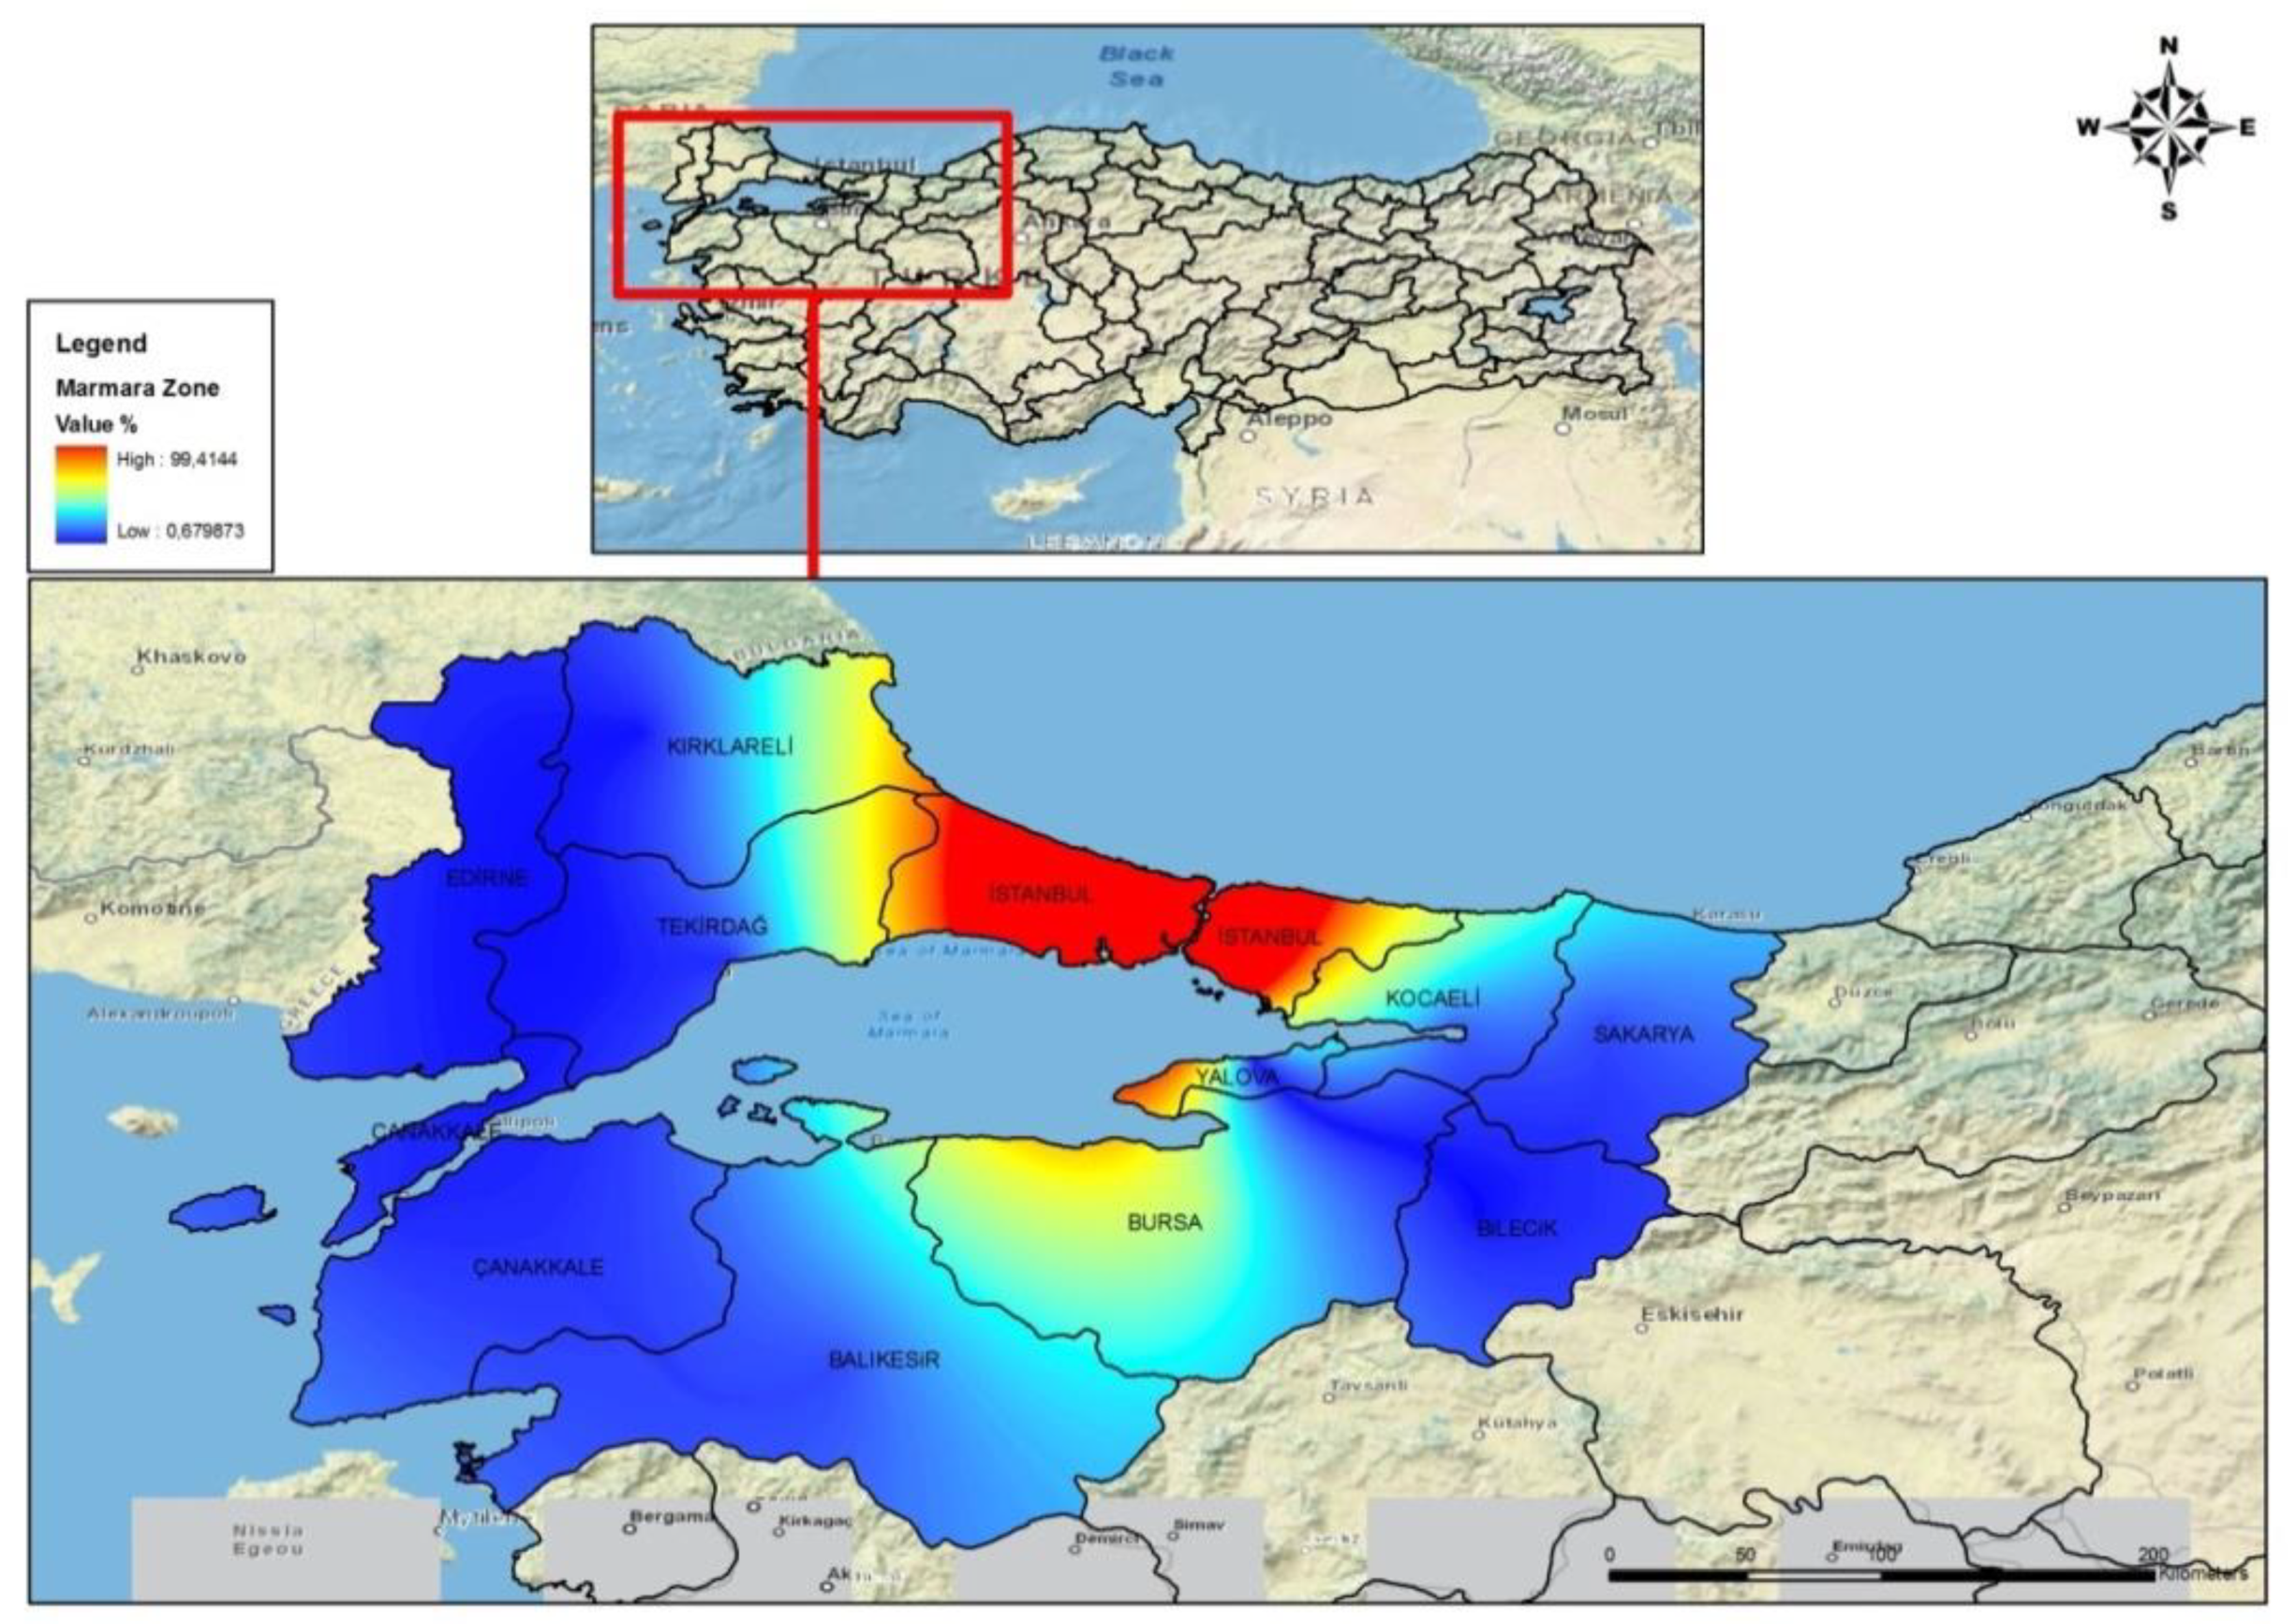
4.2. GIS-Based Location Selection

In recent years, GIS have been successfully used for location selection problems in many fields. For example, in the field of environment, GIS have been used to select solid waste disposal sites [107] and landfill sites [105,106,107,108,109,110]. Some researchers have used GIS in the field of energy to select locations such as wind farms [111,112,113,114,115], solar farms [116,117], hydropower plants [118] and facilities to convert forest biomass to biofuel [18]. GIS have also been used in business for retail site location selection [11,22], industrial site selection [119], shopping mall location selection [62,120] and supermarket location selection [121]. There are some GIS applications in the field of health services such as hospital location selection [122,123,124,125] and health care facility selection [126,127]. Besides these fields, GIS have been used for location selection for public services [128]. The research shows that GIS is a useful method to select appropriate location for different kinds of facilities and sites.
GIS are seen as a set of tools which are capable of acquiring both spatial and non-spatial data from various sources, converting data into useful formats, storing and managing data, manipulating the data for analysis, and finally generating the output required by a given user. The acquisition component refers to determining and gathering the data in a digitally accessible format for use in a GIS. The data storage and management component deals with efficient storage and retrieving data from the database. The manipulation component refers to the need for conversion, aggregation, overlay and interpolation. In this framework, the capability of performing an integrated analysis of spatial and non-spatial data represents the most distinguishing attribute of a GIS. There are lots of analytical operations available in GIS to develop useful information for a specific purpose. Finally, the data output component of GIS enables a range of geovisualization techniques and provides the data and/or information in the form of digital maps, graphics, figures, diagrams, etc. [61,129,130,131].
As mentioned earlier, GIS tools have been widely used in the field of retail location planning [61,132,133]. The main reason behind the popularity of GIS is the information needs of retailers with regard to the geographic, economic and social structure of their catchment areas. In this sense, GIS serve as a valuable tool for determining and analyzing the characteristics of the catchment area by incorporating spatial data such as streets, neighborhoods, mail codes, road numbers, buildings and non-spatial data such as the demographic and economic profiles of the consumers [134,135,136,137,138,139,140].
In this study, we aim to compare and analyze the results of the fuzzy TOPSIS method and the results of the two previous studies that applied GIS for the location selection problem of shopping malls in Turkey [65,66]. The methodology that was employed in these studies and results is summarized below.
The studies in question discussed the location selection problem for shopping malls in Turkey in general and by cities in Turkey based on GIS-based MCDM principles. In these studies, a database including the geographic characteristics (criteria) of cities such as latitude/longitude, surface areas, neighbor cities, high ways, distance to neighbor cities and socio-economic characteristics (criteria) such as population density, wealth (deposit-money/persons), number of shopping malls in each city, the number of shopping malls in neighbor cities, rented areas, rent prices, education, health, safety, culture-art, quality of life was created as a first step. After that, a digital map on which each geographic and socio-economic characteristic was located in different layers was produced. As pointed out by Cheng et al. [19], the multi-layer layer architecture of GIS enables one to perform complex analyses.
The data were analyzed by using the following modules in the structure of Arc-Map under the license of Arc-Info by ESRI:
  • Spatial Analyst
  • Spatial Statistics
  • Data Management
  • 3D Analyst
In evaluation, first of all, vector (polygon) databases showing city borders of Turkey and vector (spot) databases showing city centers were created. Subsequently, fields were created for changes to spot database and values of variables estimated for each city were entered into these fields. Finally, the scores for each city for the selection of an optimal shopping mall location were calculated by using the following formula, which was created based on experts’ views:
([Area] + [Population of the city] + (2 × [Population density]) + (4 × [Population in city center % ]) + (10 × [Wealth] + (8 × [Number of shopping centers] + (8 × [Rented Area]) + (7 × [Economy]) + [Education] + [Health] + [Safety] + [Urban_life] + [Culture_Art] + [Life_Quality])/14
The selection priority of optimal shopping center location was determined as relative percentages that were calculated based on the assumption that Istanbul is the city with the highest priority, which is 100. The relative percentages were interpolated statistically to the entire country based on cities (with the vector-raster conversion). In this study, the overall score for each geographical region is calculated as the sum of the scores of the cities determined by the studies explained above. The priorities of seven official geographical regions in Turkey based on their overall scores are presented in Table 13.
The results of the analyses of only the Marmara Region are also shown as an example (Figure 2).

4.3. Comparison of the Results of the Fuzzy TOPSIS and GIS-Based Analysis

The location selection problem is a very important problem for an investor and decision maker that has controversial outcomes. In decision-making processes, the database to be formed needs to consist of multidimensional and reliable data. As these data may be real numbers, they may also be linguistic variables in the case of uncertainty. In order to make a rational decision on this reliable database that is formed, the decision-making process should involve up-to-date scientific approaches and technological opportunities.
According to Table 14, which compares the results of “Fuzzy TOPSIS” method and the analysis results based on numerical data in the GIS environment, the results of both methods indicate that the Marmara region was ranked as the best option for shopping malls in Turkey. On the other hand, there are some similarities and differences in the remaining rankings obtained from fuzzy TOPSIS and GIS.

5. Conclusions

The main purpose of this study is to compare the results of the fuzzy TOPSIS method and GIS, which were applied to determine the best location for shopping malls in Turkey. The official geographical regions of Turkey (Mediterranean, Southeastern Anatolia, Eastern Anatolia, Black Sea, Central Anatolia, Marmara and Aegean) were accepted as alternative locations and in the process of the implementation of the fuzzy TOPSIS method, linguistic variables such as regional development, economy, transportation, population density, tourism and cultural structure were determined as the decision criteria. On the other hand, for the GIS process, which utilizes a geographical database that contains all administrative provincial boundaries, roads and all geographical information that is needed for Turkey in its entirety, semantic data including the numbers of shopping malls in every city, the numbers of shopping malls in neighboring cities, rent prices, quality of life, safety and population density were uploaded for city centers.
The results of both fuzzy TOPSIS and GIS show that Marmara Region is the most optimal location in the case of shopping malls in Turkey. One possible explanation for this result is that Marmara region is the most developed region of Turkey and has favorable conditions in terms of the criteria taken into consideration in the implementation of both fuzzy TOPSIS and GIS processes.
On the other hand, two methods generated different results with regard to the ranking order of the other six regions. There are some possible explanations for these controversy results. First of all, criteria and their importance weights that are used in TOPSIS methodology are determined based on the experts’ opinions. Hence, the results of TOPSIS method are affected by the subjective assessments of the individual decision makers. On the other hand, the spatial data utilized by GIS are precise and objective since they can be measured. Furthermore, GIS allow the use of more inclusive criteria as they can be integrated with other information systems [135].
As the solution to facility location problems requires multi-criteria, various MCDM methods have been applied to solve these problems. Among these methods, fuzzy TOPSIS has several advantages such as providing consistent results with criteria evaluation changes, simplified calculations and good computational efficiency, capability of handling uncertainty through linguistic variables. Furthermore, it also provides efficiency in dealing with tangible criteria and larger numbers of alternatives, a meaningful performance measurement for each alternative and a clear distinction between the alternatives [4,141,142,143,144,145]. Here, it should be also noted that this method suffers from several limitations. First, fuzzy TOPSIS is not suitable for solving hierarchical problems, since a hierarchical structure between the main criteria and sub-criteria is not taken into consideration by this method. Second, an efficient procedure is required to determine the relative importance of different criteria with respect to the objective [4,144,146].
As mentioned earlier, GIS tools have become very popular for retail location selection decisions among both academics and practitioners. The main advantages of GIS are their ability to integrate large quantities of spatial and non-spatial information; to generate and communicate results easily and rapidly by means of attractive and informative digital maps; and to evaluate more alternatives than manual systems [62,129,135,136]. Considering these advantages, Suárez-Vega et al. [11] state that GIS provide a broader vision with regard to the possible locations and powerful assistance to the decision makers and Cheng et al. [19] assert that GIS represent one of the most appropriate tools, especially for shopping mall location selection. However, the lack of analytical and modelling functions to incorporate forecasts, objectives, costs and benefits has been considered as the major weakness of the existing systems [129,136].
In conclusion, it was shown that the opportunities provided to the decision makers in the GIS environment had a significant share in solving location selection problems by the visualization, analysis and production of data in the “Numerical Geographical Database” of the geographical software platform. In this sense, a combination of MCDM techniques and GIS can provide an effective tool for facility location selection decisions.

Author Contributions

In this paper, contributions of authors are given as follows; “conceptualization, H.E.A.; methodology, C.E.; investigation, C.E.; data curation, C.E., writing—H.E.A. and C.E.; review and editing, H.E.A.

Funding

This research received no external funding

Conflicts of Interest

The authors declare no conflict of interest.

References

  1. Aćimović, S.; Mijušković, V. Key logistics location selection factors in retail business. Ekonomske Ideje i Praksa 2016, 22, 57–70. [Google Scholar]
  2. Făgărăşan, M.; Cristea, C. Logistics center location: Selection using multicriteria decision making. Ann. Oradea Univ. Fascicle Manag. Technol. Eng. 2015, 1, 157–162. [Google Scholar] [CrossRef]
  3. Yang, J.; Lee, H. An AHP decision model for facility location selection. Facilities 1997, 15, 241–254. [Google Scholar] [CrossRef]
  4. Ertuğrul, İ.; Karakaşoğlu, N. Comparison of fuzzy AHP and fuzzy TOPSIS methods for facility location selection. Int. J. Adv. Manuf. Technol. 2008, 39, 783–795. [Google Scholar] [CrossRef]
  5. Devi, K.; Yadav, S.P. A multicriteria intuitionistic fuzzy group decision making for plant location selection with ELECTRE method. Int. J. Adv. Manuf. Technol. 2013, 66, 1219–1229. [Google Scholar] [CrossRef]
  6. Lin, C.T.; Juan, P.J. Developing a hierarchy relation with an expert decision analysis process for selecting the optimal resort type for a Taiwanese international resort park. Expert Syst. Appl. 2009, 36, 1706–1719. [Google Scholar] [CrossRef]
  7. Wang, B.; Xiong, H.; Jiang, C. A multicriteria decision making approach based on fuzzy theory and credibility mechanism for logistics center location selection. Sci. World J. 2014, 2014, 347619. [Google Scholar] [CrossRef]
  8. Durmuş, A.; Turk, S.S. Factors influencing location selection of warehouses at the intra-urban level: Istanbul case. Eur. Plan. Stud. 2014, 22, 268–292. [Google Scholar] [CrossRef]
  9. Shukla, G.; Hota, H.S.; Sharma, A.S. Multicriteria decision making based solution to location selection for modern agri-warehouses. In Proceedings of the International Conference on Inventive Communication and Computational Technologies (ICICCT), Coimbatore, India, 10–11 March 2017; pp. 460–464. [Google Scholar]
  10. Chen, J.; Wang, J.; Baležentis, T.; Zagurskaitė, F.; Streimikiene, D.; Makutėnienė, D. Multicriteria approach towards the sustainable selection of a teahouse location with sensitivity analysis. Sustainability 2018, 10, 2926. [Google Scholar] [CrossRef]
  11. Suárez-Vega, R.; Santos-Peñate, D.R.; Dorta-González, P. Location models and GIS tools for retail site location. Appl. Geogr. 2012, 35, 12–22. [Google Scholar] [CrossRef]
  12. Kahraman, C.; Onar, S.C.; Oztaysi, B. Fuzzy multicriteria decision-making: A literature review. Int. J. Comput. Intell. Syst. 2015, 8, 637–666. [Google Scholar] [CrossRef]
  13. Karmaker, C.; Saha, M. Optimization of warehouse location through fuzzy multi-criteria decision making methods. Decis. Sci. Lett. 2015, 4, 315–334. [Google Scholar] [CrossRef]
  14. Sánchez-Lozano, J.M.; Teruel-Solano, J.; Soto-Elvira, P.L.; García-Cascales, M.S. Geographical Information Systems (GIS) and Multi-Criteria Decision Making (MCDM) methods for the evaluation of solar farms locations: Case study in south-eastern Spain. Renew. Sustain. Energy Rev. 2013, 24, 544–556. [Google Scholar] [CrossRef]
  15. Özcan, T.; Çelebi, N.; Esnaf, Ş. Comparative analysis of multi-criteria decision making methodologies and implementation of a warehouse location selection problem. Expert Syst. Appl. 2011, 38, 9773–9779. [Google Scholar] [CrossRef]
  16. Sener, U.; Gokalp, E.; Eren, P.E. ClouDSS: A decision support system for cloud service selection. In Proceedings of International Conference on the Economics of Grids, Clouds, Systems, and Services, Biarritz, France, 19–21 September 2017; Springer: Cham, Germany, 2018; pp. 249–261. [Google Scholar]
  17. Kahraman, C.; Ruan, D.; Doǧan, I. Fuzzy group decision-making for facility location selection. Inf. Sci. 2003, 157, 135–153. [Google Scholar] [CrossRef]
  18. Zhang, F.; Johnson, D.M.; Sutherland, J.W. A GIS-based method for identifying the optimal location for a facility to convert forest biomass to biofuel. Biomass Bioenergy 2011, 35, 3951–3961. [Google Scholar] [CrossRef]
  19. Cheng, E.W.; Li, H.; Yu, L. A GIS approach to shopping mall location selection. Build. Environ. 2007, 42, 884–892. [Google Scholar] [CrossRef]
  20. Li, H.; Kong, C.W.; Pang, Y.C.; Shi, W.Z.; Yu, L. Internet-based geographical information systems system for E-commerce application in construction material procurement. J. Const. Eng. Manag. 2003, 129, 689–697. [Google Scholar] [CrossRef]
  21. Barnett, A.P.; Okoruwa, A.A. Application of geographic information systems in site selection and location analysis. Appr. J. 1993, 61, 245. [Google Scholar]
  22. Roig-Tierno, N.; Baviera-Puig, A.; Buitrago-Vera, J.; Mas-Verdu, F. The retail site location decision process using GIS and the analytical hierarchy process. Appl. Geogr. 2013, 40, 191–198. [Google Scholar] [CrossRef]
  23. Arslan, T.V. A critical approach to shopping mall researches in Turkey: Interpretations, discussions and critics. Uludağ Univ. J. Fac. Eng. 2009, 14, 147–158. [Google Scholar]
  24. Ünlükara, T.; Berköz, L. Shopping centers’ selection criteria in Turkey: The case of Istanbul. Megaron. 2016, 11, 437–448. [Google Scholar]
  25. Tabak, B.I.; Özgen, Ö.; Aykol, B. High school girls’shopping mall experiences, perceptions and expectations: A qualitative study. Ege Acad. Rev. 2006, 6, 100–113. [Google Scholar]
  26. Afacan, Y. Achieving inclusion in public spaces: A shopping mall case study. In Designing Inclusive Systems; Springer: London, UK, 2012; pp. 58–92. [Google Scholar]
  27. Dogu, U.; Erkip, F. Spatial factors affecting wayfinding and orientation: A case study in a shopping mall. Environ. Behav. 2000, 32, 731–755. [Google Scholar] [CrossRef]
  28. EVA Real Estate Appraisal Consultancy. Available online: http://www.evagyd.com/haberler/eva-gayrimenkul-ve-akademetre-2017-2019-avm-arastirmasinin-sonuclarini-acikladi/460/ (accessed on 5 June 2019).
  29. Erkip, F.; Ozuduru, B.H. Retail development in Turkey: An account after two decades of shopping malls in the urban scene. Prog. Plan. 2015, 102, 1–33. [Google Scholar] [CrossRef]
  30. Önüt, S.; Efendigil, T.; Kara, S.S. A combined fuzzy MCDM approach for selecting shopping center site: An example from Istanbul, Turkey. Expert Syst. Appl. 2010, 37, 1973–1980. [Google Scholar] [CrossRef]
  31. Erkip, F. The shopping mall as an emergent public space in Turkey. Environ. Plan. A 2003, 35, 1073–1093. [Google Scholar] [CrossRef]
  32. Ozuduru, B.H.; Guldmann, J.M. Retail location and urban resilience: Towards a new framework for retail policy. S.A.P.I.EN. S. 2013, 6, 1620. [Google Scholar]
  33. Benali-Nouani, N.; Berezowska-Azzag, E. The holistic impact assessment of shopping centres: The case of Bab Ezzouar, Algeria. Int. J. Environ. Stud. 2014, 71, 270–291. [Google Scholar] [CrossRef]
  34. Goodman, R.; Coote, M. Sustainable Urban Form and the Shopping Centre: An investigation of activity centres in Melbourne’s growth areas. Urban Policy Res. 2007, 25, 39–61. [Google Scholar] [CrossRef]
  35. AlWaer, H.; Sibley, M.; Lewis, J. Factors and priorities for assessing sustainability of regional shopping centres in the UK. Archit. Sci. Rev. 2008, 51, 391–402. [Google Scholar] [CrossRef]
  36. Govindan, K.; Garg, K.; Gupta, S.; Jha, P.C. Effect of product recovery and sustainability enhancing indicators on the location selection of manufacturing facility. Ecol. Indicators. 2016, 67, 517–532. [Google Scholar] [CrossRef]
  37. Erbıyık, H.; Özcan, S.; Karaboğa, K. Retail store location selection problem with multiple analytical hierarchy process of decision making an application in Turkey. Procedia-Soc. Behav. Sci. 2012, 58, 1405–1414. [Google Scholar] [CrossRef]
  38. Vandell, K.; Carter, C. Retail store location and market analysis: A review of the research. J. Real Estate Lit. 1994, 2, 13–45. [Google Scholar]
  39. Craig, C.S. Models of the retail location process: A review. J. Retail. 1984, 60, 5–36. [Google Scholar]
  40. Brown, S. Retail location theory: Evolution and evaluation. Int. Rev. Retail. Distrib. Consum. Res. 1993, 3, 185–229. [Google Scholar] [CrossRef]
  41. Clarkson, R.M.; Clarke-Hill, C.M.; Robinson, T. UK supermarket location assessment. Int. J. Retail. Distrib. Manag. 1996, 24, 22–33. [Google Scholar] [CrossRef]
  42. Yıldız, N.; Tüysüz, F. A hybrid multi-criteria decision making approach for strategic retail location investment: Application to Turkish food retailing. Socio-Econ. Plan. Sci. In Press.
  43. Baviera-Puig, A.; Buitrago-Vera, J.; Escriba-Perez, C. Geomarketing models in supermarket location strategies. J. Bus. Econ. Manag. 2016, 17, 1205–1221. [Google Scholar] [CrossRef]
  44. Suárez-Vega, R.; Gutiérrez-Acuña, J.L.; Rodríguez-Díaz, M. Locating a supermarket using a locally calibrated Huff model. Int. J. Geogr. Inf. Sci. 2015, 29, 217–233. [Google Scholar] [CrossRef]
  45. Reigadinha, T.; Godinho, P.; Dias, J. Portuguese food retailers–Exploring three classic theories of retail location. J. Retail. Consum. Serv. 2017, 34, 102–116. [Google Scholar] [CrossRef]
  46. Kohsaka, H. A Spatial Search-Location Model of Retail Centers. Geogr. Anal. 1989, 21, 338–349. [Google Scholar] [CrossRef]
  47. Litz, R.A.; Rajaguru, G. Does small store location matter? A test of three classic theories of retail location. J. Small Bus. Entrep. 2008, 21, 477–492. [Google Scholar] [CrossRef]
  48. Carter, C.C.; Haloupek, W.J. Dispersion of stores of the same type in shopping malls: Theory and preliminary evidence. J. Prop. Res. 2002, 19, 291–311. [Google Scholar] [CrossRef]
  49. Prendergast, G.; Marr, N.; Jarratt, B. Retailers’ views of shopping centres: A comparison of tenants and non-tenants. Int. J. Retail. Distrib. Manag. 1998, 26, 162–171. [Google Scholar] [CrossRef]
  50. Ramesh, G.; Prasad, S.; Goyal, S. A pilot study of organised retail formats and their location strategy in Mumbai: A study covering western suburbs from Bandra to Borivali. J. Retail. Leis. Prop. 2011, 9, 476–492. [Google Scholar] [CrossRef]
  51. Wu, S.S.; Kuang, H.; Lo, S.M. Modeling Shopping Center Location Choice: Shopper Preference–Based Competitive Location Model. J. Urban Plan. Dev. 2018, 145, 04018047. [Google Scholar] [CrossRef]
  52. Lau, H.F.; Sin, L.Y.M.; Chan, K.K.C. Chinese cross-border shopping: An empirical study. J. Hosp. Tour. Res. 2005, 29, 110–133. [Google Scholar] [CrossRef]
  53. Wee, C.H.; Pearce, M.R. Retail gravitational models: A review with implications for further research. In Proceedings of the 1984 Academy of Marketing Science (AMS) Annual Conference, Niagara Falls, NY, USA, 9–12 May 1984; Springer: Cham, Germany; pp. 300–305.
  54. Wee, C.H.; Pearce, M.R. Patronage Behavior Toward Shopping Areas: A Proposed Model Based on Huff’s Model of Retail Gravitation. In NA—Advances in Consumer Research; Hirschman, E.C., Holbrook, M.B., Provo, U.T., Eds.; Association for Consumer Research: Duluth, MN, USA, 1985; Volume 12, pp. 592–597. [Google Scholar]
  55. Nakanishi, M.; Cooper, L.G. Parameter estimation for a multiplicative competitive interaction model—Least squares approach. J. Market. Res. 1974, 11, 303–311. [Google Scholar]
  56. Serra, D.; Colomé, R. Consumer choice and optimal locations models: Formulations and heuristics. Papers Reg. Sci. 2001, 80, 439–464. [Google Scholar] [CrossRef]
  57. Cheng, E.W.; Li, H.; Yu, L. The analytic network process (ANP) approach to location selection: A shopping mall illustration. Constr. Innov. 2005, 5, 83–97. [Google Scholar] [CrossRef]
  58. Zolfani, S.H.; Aghdaie, M.H.; Derakhti, A.; Zavadskas, E.K.; Varzandeh, M.H.M. Decision making on business issues with foresight perspective; an application of new hybrid MCDM model in shopping mall locating. Expert Syst. Appl. 2013, 40, 7111–7121. [Google Scholar] [CrossRef]
  59. Yavuz, S.; Deveci, M. Selection of Shopping Center Location with The Methods of Fuzzy VIKOR and Fuzzy TOPSIS and An Application. Ege Acad. Rev. 2014, 14, 463–479. [Google Scholar]
  60. Tayman, J.; Pol, L. Retail site selection and geographic information systems. J. Appl. Bus. Res. 1995, 11, 46. [Google Scholar] [CrossRef]
  61. Murray, A.T. Advances in location modeling: GIS linkages and contributions. J. Geogr. Syst. 2010, 12, 335–354. [Google Scholar] [CrossRef]
  62. ELSamen, A.A.A.; Hiyasat, R.I. Beyond the random location of shopping malls: A GIS perspective in Amman, Jordan. J. Retail. Cons. Serv. 2017, 34, 30–37. [Google Scholar] [CrossRef]
  63. Bayar, R. Location choice for shopping mall centers using GIS: Case study of Ankara. Coğrafi Bilimler Dergisi 2005, 3, 19–38. [Google Scholar]
  64. Gündogdu, C.E. Suitable Location Selection Optimization for Shopping Centres and Geographical Information System (GIS). China-USA Bus. Rev. 2011, 10, 711–718. [Google Scholar]
  65. Erdin Gündoğdu, C. GIS based site selection for shopping centers in Turkey. In Selected Concepts and Best Practice; Grzybowska, K., Ed.; Publishing House of Poznan University Technology: Poznan, Poland, 2012; pp. 331–344. [Google Scholar]
  66. Gundogdu, C.E. Determination of the most suitable sites for Shopping Centers in geographical regions with GIS. Res. Logistics Prod. 2013, 3, 109–122. [Google Scholar]
  67. Zadeh, L.A. Fuzzy sets. Inf. Control 1965, 8, 338–353. [Google Scholar] [CrossRef] [Green Version]
  68. Gu, X.; Zhu, Q. Fuzzy multi-attribute decision-making method based on eigenvector of fuzzy attribute evaluation space. Decis. Support. Syst. 2006, 41, 400–410. [Google Scholar] [CrossRef]
  69. Yang, T.; Hung, C.C. Multiple-attribute decision making methods for plant layout design problem. Robot. Comput. Integr. Manuf. 2007, 23, 126–137. [Google Scholar] [CrossRef]
  70. Tsaur, S.H.; Chang, T.Y.; Yen, C.H. The evaluation of airline service quality by fuzzy MCDM. Tour. Manag. 2002, 23, 107–115. [Google Scholar] [CrossRef]
  71. Yong, D. Plant location selection based on fuzzy TOPSIS. Int. J. Adv. Manuf. Technol. 2006, 28, 839–844. [Google Scholar] [CrossRef]
  72. Jahanshahloo, G.R.; Hosseinzadeh, L.F.; Izadikhah, M. Extension of the TOPSIS method for decision making problems with fuzzy data. Appl. Math. Comput. 2006, 181, 1544–1551. [Google Scholar] [CrossRef]
  73. Chen, C.T. Extensions of the TOPSIS for group decision-making under fuzzy environment. Fuzzy Sets Syst. 2000, 114, 1–9. [Google Scholar] [CrossRef]
  74. Kengpol, A.; Rontlaong, P.; Tuominen, M. A decision support system for selection of solar power plant locations by applying fuzzy AHP and TOPSIS: An Empirical Study. J. Softw. Eng. Appl. 2013, 6, 470. [Google Scholar] [CrossRef]
  75. Erkayman, B.; Gundogar, E.; Akkaya, G.; Ipek, M. A fuzzy TOPSIS approach for logistics center location selection. J. Bus. Case Stud. 2011, 7, 49–55. [Google Scholar] [CrossRef]
  76. Li, Y.; Liu, X.; Chen, Y. Selection of logistics center location using Axiomatic Fuzzy Set and TOPSIS methodology in logistics management. Expert Syst. Appl. 2011, 38, 7901–7908. [Google Scholar] [CrossRef]
  77. Rao, C.; Goh, M.; Zhao, Y.; Zheng, J. Location selection of city logistics centers under sustainability. Transport. Res. Part D Trans. Environ. 2015, 36, 29–44. [Google Scholar] [CrossRef]
  78. Awasthi, A.; Chauhan, S.S.; Goyal, S.K. A multi-criteria decision making approach for location planning for urban distribution centers under uncertainty. Math. Comp. Modell. 2011, 53, 98–109. [Google Scholar] [CrossRef]
  79. Kuo, M.S.; Liang, G.S. A novel hybrid decision-making model for selecting locations in a fuzzy environment. Math. Comp. Modell. 2011, 54, 88–104. [Google Scholar] [CrossRef]
  80. Ashrafzadeh, M.; Rafiei, F.M.; Isfahani, N.M.; Zare, Z. Application of fuzzy TOPSIS method for the selection of Warehouse Location: A Case Study. Interdiscip. J. Contemp. Res. Bus. 2012, 3, 655–671. [Google Scholar]
  81. Dey, B.; Bairagi, B.; Sarkar, B.; Sanyal, S.K. Warehouse location selection by fuzzy multi-criteria decision making methodologies based on subjective and objective criteria. Int. J. Manag. Sci. Eng. Manag. 2016, 11, 262–278. [Google Scholar] [CrossRef]
  82. Ertuğrul, İ. Fuzzy group decision making for the selection of facility location. Group Decis. Negot. 2011, 20, 725–740. [Google Scholar] [CrossRef]
  83. Safari, H.; Faghih, A.; Fathi, M.R. Fuzzy multi-criteria decision making method for facility location selection. Afr. J. Bus. Manag. 2012, 6, 206–212. [Google Scholar]
  84. Güzel, D.; Erdal, H. A comparative assesment of facility location problem via fuzzy TOPSIS and fuzzy VIKOR: A case study on security services. Int. J. Bus. Soc. Res. 2015, 5, 49–61. [Google Scholar]
  85. Senvar, O.; Otay, I.; Bolturk, E. Hospital site selection via hesitant fuzzy TOPSIS. IFAC-PapersOnLine. 2016, 49, 1140–1145. [Google Scholar] [CrossRef]
  86. Beskese, A.; Demir, H.H.; Ozcan, H.K.; Okten, H.E. Landfill site selection using fuzzy AHP and fuzzy TOPSIS: A case study for Istanbul. Environ. Earth Sci. 2015, 73, 3513–3521. [Google Scholar] [CrossRef]
  87. Guo, S.; Zhao, H. Optimal site selection of electric vehicle charging station by using fuzzy TOPSIS based on sustainability perspective. Appl. Energy 2015, 158, 390–402. [Google Scholar] [CrossRef]
  88. Suder, A.; Kahraman, C. Minimizing environmental risks using fuzzy TOPSIS: Location selection for the ITU Faculty of Management. Hum. Ecol. Risk Assess. Int. J. 2015, 21, 1326–1340. [Google Scholar] [CrossRef]
  89. Franco, C.; Bojesen, M.; Hougaard, J.L.; Nielsen, K. A fuzzy approach to a multiple criteria and Geographical Information System for decision support on suitable locations for biogas plants. Appl. Energy 2015, 140, 304–315. [Google Scholar] [CrossRef] [Green Version]
  90. Cagri, T.A.; Tuysuz, F.; Kahraman, C. A fuzzy multi-criteria decision analysis approach for retail location selection. Int. J. Inf. Technol. Decis. Mak. 2013, 12, 729–755. [Google Scholar] [CrossRef]
  91. Zentes, J.; Morschett, D.; Schramm-Klein, H. Store location–trading area analysis and site selection. In Strategic Retail Management; Gabler Verlag: Wiesbaden, Germany, 2011; pp. 203–225. [Google Scholar]
  92. Kuo, R.J.; Chi, S.C.; Kao, S.S. A decision support system for selecting convenience store location through integration of fuzzy AHP and artificial neural network. Comput. Ind. 2002, 47, 199–214. [Google Scholar] [CrossRef]
  93. Dolega, L.; Pavlis, M.; Singleton, A. Estimating attractiveness, hierarchy and catchment area extents for a national set of retail centre agglomerations. J. Retail. Consum. Serv. 2016, 28, 78–90. [Google Scholar] [CrossRef] [Green Version]
  94. Morrison, P.A.; Abrahamse, A.F. Applying demographic analysis to store site selection. Popul. Res. Policy Rev. 1996, 15, 479–489. [Google Scholar]
  95. Li, Y.; Liu, L. Assessing the impact of retail location on store performance: A comparison of Wal-Mart and Kmart stores in Cincinnati. Appl. Geogr. 2012, 32, 591–600. [Google Scholar] [CrossRef]
  96. Choi, M.J.; Heo, C.Y.; Law, R. Progress in shopping tourism. J. Travel Tour. Market. 2016, 33, 1–24. [Google Scholar] [CrossRef]
  97. Yurtseven, Ç. International tourism and economic development in Turkey: A vector approach. Afro Eurasian Stud. 2012, 1, 37–50. [Google Scholar]
  98. Timothy, D.J. Trends in tourism, shopping, and retailing. In A Companion to Tourism; Lew, A.A., Hall, C.M., Williams, A.M., Eds.; Blackwell Publishing: Hoboken, NJ, USA, 2014; pp. 378–388. [Google Scholar]
  99. Simkin, L.P. Evaluating a store location. Int. J. Retail. Distrib. Manag. 1990, 18, 33–39. [Google Scholar] [CrossRef]
  100. Simkin, L.; Doyle, P.; Saunders, J. Store location assessment. Prop. Manag. 1986, 4, 333–343. [Google Scholar] [CrossRef]
  101. Zhou, S.; Zhang, Y.; Bao, X. Methodology of location selection for biofuel refinery based on fuzzy TOPSIS. In Proceedings of the IEEE International Conference on Automation and Logistics (ICAL), Zhengzhou, China, 15–17 August 2012; pp. 431–436. [Google Scholar]
  102. Chen, C.T.; Lin, C.T.; Huang, S.F. A fuzzy approach for supplier evaluation and selection in supply chain management. Int. J. Prod. Econ. 2006, 102, 289–301. [Google Scholar] [CrossRef]
  103. Junior, F.R.L.; Osiro, L.; Carpinetti, L.C.R. A comparison between Fuzzy AHP and Fuzzy TOPSIS methods to supplier selection. Appl. Soft Comput. 2014, 21, 194–209. [Google Scholar] [CrossRef]
  104. Joshi, R.; Banwet, D.K.; Shankar, R. A Delphi-AHP-TOPSIS based benchmarking framework for performance improvement of a cold chain. Expert Syst. Appl. 2011, 38, 10170–10182. [Google Scholar] [CrossRef]
  105. Patil, S.K.; Kant, R. A fuzzy AHP-TOPSIS framework for ranking the solutions of Knowledge Management adoption in Supply Chain to overcome its barriers. Expert Syst. Appl. 2014, 41, 679–693. [Google Scholar] [CrossRef]
  106. Choudhary, D.; Shankar, R. An STEEP-fuzzy AHP-TOPSIS framework for evaluation and selection of thermal power plant location: A case study from India. Energy. 2012, 42, 510–521. [Google Scholar] [CrossRef]
  107. Şener, Ş.; Şener, E.; Nas, B.; Karagüzel, R. Combining AHP with GIS for landfill site selection: A case study in the Lake Beyşehir catchment area (Konya, Turkey). Waste Manag. 2010, 30, 2037–2046. [Google Scholar] [CrossRef]
  108. Nas, B.; Cay, T.; Iscan, F.; Berktay, A. Selection of MSW landfill site for Konya, Turkey using GIS and multi-criteria evaluation. Environ. Monit. Assess. 2010, 160, 491–500. [Google Scholar] [CrossRef]
  109. Şener, Ş.; Sener, E.; Karagüzel, R. Solid waste disposal site selection with GIS and AHP methodology: A case study in Senirkent–Uluborlu (Isparta) Basin, Turkey. Environ. Monit. Assess. 2011, 173, 533–554. [Google Scholar] [CrossRef]
  110. Vasiljević, T.Z.; Srdjević, Z.; Bajčetić, R.; Miloradov, M.V. GIS and the analytic hierarchy process for regional landfill site selection in transitional countries: A case study from Serbia. Environ. Manag. 2012, 49, 445–458. [Google Scholar] [CrossRef]
  111. Van Haaren, R.; Fthenakis, V. GIS-based wind farm site selection using spatial multi-criteria analysis (SMCA): Evaluating the case for New York State. Renew. Sustain. Energy Rev. 2011, 15, 3332–3340. [Google Scholar] [CrossRef]
  112. Atici, K.B.; Simsek, A.B.; Ulucan, A.; Tosun, M.U. A GIS-based Multiple Criteria Decision Analysis approach for wind power plant site selection. Util. Policy. 2015, 37, 86–96. [Google Scholar] [CrossRef]
  113. Latinopoulos, D.; Kechagia, K. A GIS-based multi-criteria evaluation for wind farm site selection. A regional scale application in Greece. Renew. Energy. 2015, 78, 550–560. [Google Scholar] [CrossRef]
  114. Noorollahi, Y.; Yousefi, H.; Mohammadi, M. Multi-criteria decision support system for wind farm site selection using GIS. Sustain. Energy Technol. Assess. 2016, 13, 38–50. [Google Scholar]
  115. Pamučar, D.; Gigović, L.; Bajić, Z.; Janošević, M. Location selection for wind farms using GIS multi-criteria hybrid model: An approach based on fuzzy and rough numbers. Sustainability 2017, 9, 1315. [Google Scholar] [CrossRef]
  116. Uyan, M. GIS-based solar farms site selection using analytic hierarchy process (AHP) in Karapinar region, Konya/Turkey. Renew. Sustain. Energy Rev. 2013, 28, 11–17. [Google Scholar] [CrossRef]
  117. Khan, G.; Rathi, S. (). Optimal site selection for solar PV power plant in an Indian state using Geographical Information System (GIS). Int. J. Emerg. Eng. Res. Technol. 2014, 2, 260–266. [Google Scholar]
  118. Yi, C.S.; Lee, J.H.; Shim, M.P. Site location analysis for small hydropower using geo-spatial information system. Renew. Energy 2010, 35, 852–861. [Google Scholar] [CrossRef]
  119. Rikalovic, A.; Cosic, I.; Lazarevic, D. GIS based multi-criteria analysis for industrial site selection. Procedia Eng. 2014, 69, 1054–1063. [Google Scholar] [CrossRef]
  120. Mohamad, M.Y.; Al Katheeri, F.; Salam, A. A GIS application for location selection and Customers’ preferences for shopping malls in al Ain City; UAE. Am. J. Geogr. Inf. Syst. 2015, 4, 76–86. [Google Scholar]
  121. Liu, T. Combining GIS and the Huff Model to Analyze Suitable Locations for a New Asian Supermarket in the Minneapolis and St. Paul, Minnesota USA. Papers Resour. Anal. 2012, 14, 7. [Google Scholar]
  122. Soltani, A.; Marandi, I.Z. Hospital site selection using two-stage fuzzy multi-criteria decision making process. J. Urban Environ. Eng. 2011, 5, 32–43. [Google Scholar] [CrossRef]
  123. Sharmin, N.; Neema, M.N. A GIS-based multi-criteria analysis to site appropriate locations of hospitals in Dhaka City. Hospital 2013, 8, 0–37. [Google Scholar]
  124. Eldemir, F.; Onden, I. Geographical information systems and multicriteria decisions integration approach for hospital location selection. Int. J. Inf. Technol. Decis. Mak. 2016, 15, 975–997. [Google Scholar] [CrossRef]
  125. Rahimi, F.; Goli, A.; Rezaee, R. Hospital location-allocation in Shiraz using Geographical Information System (GIS). Shiraz E-Med J. 2017, 18, e57572. [Google Scholar] [CrossRef]
  126. Ye, H.; Kim, H. Locating healthcare facilities using a network-based covering location problem. GeoJournal 2016, 81, 875–890. [Google Scholar] [CrossRef]
  127. Dell’Ovo, M.; Capolongo, S.; Oppio, A. Combining spatial analysis with MCDA for the siting of healthcare facilities. Land Use Policy 2018, 76, 634–644. [Google Scholar] [CrossRef]
  128. Mohammed, A.; Shalaby, A.; Miller, E.J. Development of P-TRANE: GIS-Based Model of Bus Transit Network Evolution. J. Urban Plan. Dev. 2013, 140, 04013004. [Google Scholar] [CrossRef]
  129. Fischer, M.M.; Nijkamp, P. Geographic information systems and spatial analysis. Ann. Reg. Sci. 1992, 26, 3–17. [Google Scholar] [CrossRef] [Green Version]
  130. Malczewski, J. Multiple criteria decision analysis and geographic information systems. In Trends in Multiple Criteria Decision Analysis; Springer: Boston, MA, USA, 2010; pp. 369–395. [Google Scholar]
  131. Congalton, R.G.; Green, K. The ABCs of GIS. J. For. 1992, 90, 13–20. [Google Scholar]
  132. Church, R.L. Geographical information systems and location science. Comput. Oper. Res. 2002, 2, 541–562. [Google Scholar] [CrossRef]
  133. Benoit, D.; Clarke, G.P. Assessing GIS for retail location planning. J. Retail. Consum. Serv. 1997, 4, 239–258. [Google Scholar] [CrossRef]
  134. Birkin, M.; Clarke, G. GIS, geodemographics, and spatial modeling in the UK financial service industry. J. Hous. Res. 1998, 9, 87–111. [Google Scholar]
  135. Clarke, I.; Rowley, J. A case for spatial decision-support systems in retail location planning. Int. J. Retail Distrib. Manag. 1995, 23, 4–10. [Google Scholar] [CrossRef]
  136. Mendes, A.B.; Themido, I.H. Multi-outlet retail site location assessment. Int. Trans. Oper. Res. 2004, 11, 1–18. [Google Scholar] [CrossRef] [Green Version]
  137. Ali, W.; Moulin, B. 2D-3D multiagent geosimulation with knowledge-based agents of customers’ shopping behavior in a shopping mall. In Proceedings of the International Conference on Spatial Information Theory, Ellicottville, NY, USA, 14–18 September 2005; Springer: Berlin/Heidelberg, Germany, 2005; pp. 445–458. [Google Scholar]
  138. Elliott-White, M.P.; Finn, M. Growing in sophistication: The application of geographical information systems in post-modern tourism marketing. J. Travel Tour. Market. 1997, 7, 65–84. [Google Scholar] [CrossRef]
  139. Brody, R. Geographic information systems: Business applications and data. J. Bus. Fin. Librariansh. 1999, 5, 3–18. [Google Scholar] [CrossRef]
  140. Chen, R.J. Geographic information systems (GIS) applications in retail tourism and teaching curriculum. J. Retail. Consum. Serv. 2007, 14, 289–295. [Google Scholar] [CrossRef]
  141. Selim, H.; Yunusoglu, M.G.; Yılmaz Balaman, Ş. A dynamic maintenance planning framework based on fuzzy TOPSIS and FMEA: Application in an international food company. Qual. Reliab. Eng. Int. 2016, 32, 795–804. [Google Scholar] [CrossRef]
  142. Yeh, C.H. A problem-based selection of multi-attribute decision-making methods. Int. Trans. Oper. Res. 2002, 9, 169–181. [Google Scholar] [CrossRef]
  143. Fayek, A.R.; Omar, M.N. A Fuzzy Topsis Method for Prioritized Aggregation in Multi-Criteria Decision Making Problems. J. Multi-Criteria Decis. Anal. 2016, 23, 242–256. [Google Scholar] [CrossRef]
  144. Chen, L.H.; Hung, C.C. An integrated fuzzy approach for the selection of outsourcing manufacturing partners in pharmaceutical R&D. Int. J. Product. Res. 2010, 48, 7483–7506. [Google Scholar]
  145. Badang, D.A.Q.; Sarip, C.F.; Tahud, A.P. Geographic Information System (GIS) and Multicriteria Decision Making (MCDM) for Optimal Selection of Hydropower Location in Rogongon, Iligan City. In Proceedings of the 2018 IEEE 10th International Conference on Humanoid, Nanotechnology, Information Technology, Communication and Control, Environment and Management (HNICEM), Baguio City, Philippines, 29 November–1 December 2018; pp. 1–5. [Google Scholar]
  146. Kahraman, C.; Büyüközkan, G.; Ateş, N.Y. A two phase multi-attribute decision-making approach for new product introduction. Inf. Sci. 2007, 177, 1567–1582. [Google Scholar] [CrossRef]
Figure 1. Triangular fuzzy number à = (a1, a2, a3).
Sustainability 11 03837 g001
Figure 2. Graphical representation of the Marmara region (2D).
Sustainability 11 03837 g002
Table 1. Linguistic variables used in evaluating the criteria and the corresponding triangular fuzzy numbers.
Linguistic VariablesTriangular Fuzzy Numbers
Very Low(VL)(0, 0, 0.1)
Low(L)(0, 0.1, 0.3)
Mid Low(ML)(0.1, 0.3, 0.5)
Medium(M)(0.3, 0.5, 0.7)
Mid High(MH)(0.5, 0.7, 0.9)
High(H)(0.7, 0.9, 1.0)
Very High(VH)(0.9, 1.0, 1.0)
Table 2. Linguistic variables used in evaluating the alternatives and the corresponding triangular fuzzy numbers.
Linguistic VariablesTriangular Fuzzy Numbers
Very Weak(VW)(0, 0, 1)
Weak(W)(0, 1, 3)
Mid Weak(MW)(1, 3, 5)
Medium(M)(3, 5, 7)
Medium Good(MG)(5, 7, 9)
Good(G)(7, 9, 10)
Very Good(VG)(9, 10, 10)
Table 3. Importance weights of criteria determined by decision makers.
CriteriaDecision Makers
D1D2D3
C1VHHVH
C2HVHH
C3MHMMH
C4HMHMH
C5MHMHMH
C6VHVHH
Table 4. Ratings of alternatives by decision makers under selected criteria.
CriteriaAlternativesDecision Makers
D1D2D3
C1A1GVGG
A2WMWÇW
A3MWWW
A4MMGMG
A5GGMG
A6VGVGVG
A7GGVG
C2A1GGG
A2WMWW
A3MWWW
A4MGMG
A5MGGG
A6VGGVG
A7GGG
C3A1GGG
A2MWM
A3MWWW
A4WMWMW
A5GMGG
A6VGGVG
A7GGG
C4A1GMGG
A2WWGMW
A3MWWW
A4MWMM
A5GGG
A6VGGVG
A7GGG
C5A1VGGVG
A2WMWW
A3WMM
A4MMGMG
A5MGGG
A6VGVGVG
A7VGGVG
C6A1GVGVG
A2MWWMW
A3WMM
A4MMGG
A5GGMG
A6VGGVG
A7GVGG
Table 5. Total fuzzy weights of criteria.
CriteriaWeights
C1 Regional Development(0.833,0.967,1.000)
C2 Economy(0.767,0.933,1.000)
C3 Transportation(0.433,0.633,0.833)
C4 Population Density(0.567,0.767,0.933)
C5 Tourism(0.433,0.633,0.833)
C6 Cultural Structure(0.833,0.967,1.000)
Table 6. Fuzzy decision matrix.
A1A2A3A4A5A6A7
C1(7.67,9.33,10.00)(0.33,1.33,3.00)(0.33,1.67,3.67)(4.33,6.33,8.33)(6.33,8.33,9.67)(9.00,10.00,10.00)(7.67,9.33,10.00)
C2(7.00,9.00,10.00)(0.33,1.67,3.67)(0.33,1.67,3.67)(5.00,7.00,8.67)(6.33,8.33,9.67)(8.33,9.67,10.00)(7.00,9.00,10.00)
C3(7.00,9.00,10.00)(2.00,3.67,5.67)(0.33,1.67,3.67)(0.67,2.33,4.33)(6.33,8.33,9.67)(8.33,9.67,10.00)(7.00,9.00,10.00)
C4(6.33,8.33,9.67)(0.67,2.33,4.33)(0.33,1.67,3.67)(3.67,5.67,7.67)(7.00,9.00,10.00)(8.33,9.67,10.00)(7.00,9.00,10.00)
C5(8.33,9.67,10.00)(0.33,1.67,3.67)(2.00,3.67,5.67)(4.33,6.33,8.33)(6.33,8.33,9.67)(9.00,10.00,10.00)(8.33,9.67,10.00)
C6(8.33,9.67,10.00)(0.67,2.33,4.33)(2.00,3.67,5.67)(5.00,7.00,8.67)(6.33,8.33,9.67)(8.33,9.67,10.00)(7.67,9.33,10.00)
Table 7. Normalized fuzzy decision matrix.
A1A2A3A4A5A6A7
C1(0.767,0.933,1.000)(0.033,0.133,0.300)(0.033,0.167,0.367)(0.433,0.633,0.833)(0.633,0.833,0.967)(0.900,1.000,1.000)(0.767,0.933,1.000)
C2(0.700,0.900,1.000)(0.033,0.167,0.367)(0.033,0.167,0.367)(0.500,0.700,0.867)(0.633,0.833,0.967)(0.833,0.967,1.000)(0.700,0.900,1.000)
C3(0.700,0.900,1.000)(0.200,0.367,0.567)(0.033,0.167,0.367)(0.067,0.233,0.433)(0.633,0.833,0.967)(0.833,0.967,1.000)(0.700,0.900,1.000)
C4(0.633,0.833,0.967)(0.067,0.233,0.433)(0.033,0.167,0.367)(0.367,0.567,0.767)(0.700,0.900,1.000)(0.833,0.967,1.000)(0.700,0.900,1.000)
C5(0.833,0.967,1.000)(0.033,0.167,0.367)(0.200,0.367,0.567)(0.433,0.633,0.833)(0.633,0.833,0.967)(0.900,1.000,1.000)(0.833,0.967,1.000)
C6(0.833,0.967,1.000)(0.067,0.233,0.433)(0.200,0.367,0.567)(0.500,0.700,0.867)(0.633,0.833,0.967)(0.833,0.967,1.000)(0.767,0.933,1.000)
Table 8. Weighted normalized fuzzy decision matrix.
A1A2A3A4A5A6A7
C1(0.639,0.902,1.000)(0.027,0.129,0.300)(0.027,0.161,0.367)(0361,0.612,0.833)(0.527,0.806,0.967)(0.750,0.967,1.000)(0.639,0.902,1.000)
C2(0.537,0.840,1.000)(0.025,0.156,0.367)(0.025,0.156,0.367)(0.384,0.653,0.867)(0.486,0.777,0.967)(0.639,0.902,1.000)(0.537,0.840,1.000)
C3(0.303,0.570,0.833)(0.087,0.232,0.472)(0.014,0.106,0.306)(0.029,0.147,0.361)(0.274,0.572,0.806)(0.361,0.612,0.833)(0.303,0.570,0.833)
C4(0.359,0.639,0.902)(0.038,0.179,0.404)(0.019,0.128,0.342)(0.208,0.435,0.716)(0.397,0.690,0.933)(0.472,0.742,0.933)(0.397,0.690,0.933)
C5(0.361,0.612,0.833)(0.014,0.106,0.306)(0.087,0.232,0.472)(0.187,0.401,0.694)(0.274,0.527,0.806)(0.309,0.633,0.833)(0.361,0.612,0.833)
C6(0.694,0.935,1.000)(0.056,0.225,0.433)(0.167,0.355,0.567)(0.417,0.677,0.867)(0.527,0.806,0.967)(0.694,0.935,1.000)(0.639,0.902,1.000)
Table 9. Distances between Ai (i = 1, 2, 3, 4, 5, 6, 7) and A* for each criterion.
d(A1, A*)d(A2, A*)d(A3, A*)d(A4, A*)d(A5, A*)d(A6, A*)d(A7, A*)
C10.2160.8550.8270.4420.2960.1460.216
C20.2830.8290.8290.4160.3240.2160.283
C30.4830.7530.8670.8320.5130.4420.483
C40.4290.8070.8480.5850.3930.3410.393
C50.4420.8870.7530.6090.5130.4220.442
C60.1810.7770.6580.3930.2960.1810.216
Table 10. Distance between Ai (i = 1, 2, 3, 4, 5, 6, 7) and A՟ for each criterion.
d(A1, A՟)d(A2, A՟)d(A3, A՟)d(A4, A՟)d(A5, A՟)d(A6, A՟)d(A7, A՟)
C10.8610.1890.2320.6320.7880.9120.861
C20.8150.2310.2310.6650.7690.8610.815
C30.6080.3080.1870.2260.5780.6320.608
C40.6710.2560.2110.4980.7080.7400.708
C50.6320.1870.3080.4750.5780.6450.632
C60.8860.2840.3980.6790.7880.8860.861
Table 11. Calculations of the di*, di՟ and closeness coefficient (CCi) values.
A1A2A3A4A5A6A7
di*2.0334.8894.7813.2772.3341.7482.033
di՟4.4741.4541.5673.1754.2094.6764.485
di* + di՟6.5076.3436.3486.4526.5436.4246.518
CCi0.6880.2290.2470.4920.6430.7280.688
Table 12. Acceptance conditions.
Closeness CoefficientAssessment Status
CCi € [0,0.2]Unadvisable
CCi € [0.2,0.4]Advisable with high risk
CCi € [0.4,0.6]Advisable with low risk
CCi € [0.6,0.8]Acceptable
CCi € [0.8,1.0]Acceptable and preferable
Table 13. Ranking order of geographical regions.
Geographical RegionOverall ScoreRanking
Marmara140.811
Central Anatolia70.142
Mediterranean48.173
Aegean37.873
Southeastern Anatolia32.944
Black Sea27.305
Eastern Anatolia 26.416
Table 14. Comparison table.
Option Rank1234567
Fuzzy TOPSISMarmaraAegeanMediterraneanCentral AnatoliaBlack SeaEastern AnatoliaSoutheastern Anatolia
GIS BasedMarmaraCentral AnatoliaMediterraneanAegeanSoutheastern AnatoliaBlack SeaEastern Anatolia

