1. Introduction
Buildings consume around 40% of the total energy consumption in the EU and U.S., with an equivalent contribution to the greenhouse gas emissions [
1]. Therefore, huge efforts have been concentrated in the last decades on improving the overall energy performance of newly-built buildings [
2,
3], in addition to retrofitting existing buildings [
4,
5,
6] to a level complying with the modern standards in terms of design and operation. Responding to the requirements and regulations of the European Union in terms of improving the overall energy performance of the building block, Denmark has implemented a holistic strategy targeting both newly-built and existing buildings. Regarding new buildings, the building regulations (BR) in Denmark have been tightened drastically in the recent decade with the current BR18 [
7], requiring strict standards in terms of building design, construction and materials, energy systems employed, primary energy consumption, and indoor thermal comfort and air quality.
The Danish BR standards are a set of directives and requirements for buildings, both newly-constructed and those about to be renovated. These regulations exist to ensure that buildings are at a certain level in terms of energy-efficient design and construction and that they meet the established standards for energy performance. They are part of the building directive set forth by the Danish government as an effort to improve energy efficiency in the existing building stock to reach energy goals for 2050 [
8]. The regulations have been continuously updated in the past decades, raising the requirements for building design and renovation each time. One important aspect of the BR is the requirements for the thermal heat transmittance coefficient for different types of building parts. This includes elements such as exterior walls, roofs, floors in contact with the ground, and any kind of fenestration in the exterior surfaces of a building. The U-values of various building components, considering different balding regulations, are shown in
Table 1. These U-value requirements ensure that the heat losses of buildings remain within acceptable limits. Better insulation in the individual envelope components of buildings is one way of achieving reduction in energy consumption, and the differences in this aspect between older existing buildings and newly-constructed ones that are up to standards is very significant.
In addition, Denmark has established a comprehensive strategy targeting existing buildings, “Strategy for the energy renovation of the existing building stock” [
10], with clear initiatives aiming to promote systematic and cost-effective energy renovation projects all over the country. The implementation of this strategy has led to a huge increase in the number of building renovation activities and projects, considering that the share of existing buildings built before 1980 is around 80% of the entire Danish building sector. With a minimum age of 40 years currently, this large block of existing buildings will urgently require a dramatic change in terms of building envelope, as well as energy systems’ modification and upgrade. In this context, a huge block of investigations has been reported, including both theoretical analysis and assessment, as well as practical implementations and activities, aiming to renovate and enhance the energy performance of existing buildings of various ages and types.
Morelli et al. [
11] carried out a technical and economic analysis considering Danish buildings from the 1930s, aiming to improve the overall energy performance by insulating the external walls of the building. An average of around 70% energy savings was reported in the considered buildings, but they highlighted that the economic feasibility of such renovation measures is very low and shall be assessed further considering a whole renovation package. In another study, Odgaard et al. [
12] investigated old Danish buildings with brick facades from the 1850–1930 period. They suggested that insulating exterior building walls by a minimum of 100 mm of insulation is a priority, which could save up to 48% on the overall energy usage. Another study on renovating four public buildings in Denmark was presented by Rose et al. [
13]. Two office buildings along with a cultural center and nursery were considered in this investigation, and energy savings ranging from 45%–85% were reported. Some of the selected renovation measures included LED lights, heat pump installation, walls and roof insulation, and changing old windows to newer triple-glazed windows. In a recent study, Jradi et al. [
14] investigated the energy renovation of four daycare centers in Aarhus, Denmark, through a systematic and dynamic energy performance-driven methodology for building energy modeling, simulation, and renovation. They reported that a renovation package consisting of LED lights, electrical equipment upgrade, heating circulation pump replacement, and ventilation system upgrade is favorable with average energy savings of 27.7% and a payback period of around four years along with annual CO
2 emissions’ reduction of 5.1 tons as an average in the four buildings.
Moreover, a large block of studies has been presented in the recent years dealing with energy retrofit processes and frameworks’ design, implementation, and optimization [
15,
16]. From the design perspective, studies could be divided between physical envelope-targeting investigations [
17,
18] and studies that investigated energy systems’ design and performance [
19,
20]. Regarding retrofit processes’ optimization, multi-objective optimization has been implemented and employed to aid the decision making of energy retrofit processes in various contexts and considering a wide range of different building types. In this regard, a decision-making optimization framework for energy-efficient retrofitting of existing buildings was proposed by He et al. [
21]. The net present value and the payback period of the retrofit process were chosen as objectives along with the energy savings and emissions reductions. Albatici et al. [
22] developed a decision making for comprehensive building retrofit evaluation, which was demonstrated in social housing buildings in Italy. The tool uses an optimization methodology based on energy efficiency, cost-effectiveness, and thermal comfort. In another study, Roberti et al. [
23] investigated energy retrofitting of historic buildings through the development of a multi-objective optimization employing the NSGA-II algorithm and considering conservation aspects, energy performance, and indoor comfort as objectives. The methodology was implemented in a medieval building in Bolzano in Italy, and a whole-building EnergyPlus was used to simulate and evaluate the dynamic performance of the building under various retrofit measures and improvements. On the other hand, multiple researchers have targeted net zero energy buildings, aiming to evaluate, highlight, and characterize cost-effective and energy-efficient retrofit processes to improve the building performance [
24,
25].
Furthermore, in the context of building energy retrofit, many tools have been developed in recent years with different approaches and targeting various applications. In principle, such tools use multiple building energy calculation methods to drive the tool estimations, assessment, and outputs. In the last two decades, three major methodologies have been adopted in developing energy retrofit tools; empirical data-driven methods, normative methods, and physics-based energy modeling approaches [
26]. In the case of empirical data-driven methods, such methods use data collected from building meters, mainly historical data, as a basis to predict the building energy usage. Such approaches could range from simple building performance bench-marking to a more sophisticated regression modeling considering building design and operation. Such tools include the Buildings Performance Database (BPD) [
27] and the Scandinavian tool SIMIEN [
28]. Major challenges associated with such approaches include the requirement of a large set of healthy data for training and the lack of building physics interpretation with a purely data-driven method. On the other hand, tools using normative calculations rely on reduced-order models with simple inputs and outputs. The most popular reduced-order model being used in the recent investigations is the RC model [
29]. Examples of such tools include HELiOS [
30]. While they provide a simple and straight-forward retrofit assessment and design, such normative method-driven tools are generally less accurate compared to other tools using physical energy modeling techniques. Finally, the physics-based energy modeling retrofit tools use advanced energy modeling of the whole building energy performance considering various specifications and characteristics. Such tools include COMBAT [
31] and the Commercial Building Energy Asset Scoring Tool [
32]. The major drawback of such tools is that they are very complex in design and time consuming in development. It was reported that such physics-based energy modeling retrofit tools are highly accurate and provide sensible assessment reporting. EnergyPlus was highlighted as a potential flexible software environment serving as a basis to build such effective building energy retrofit tools [
26].
On the other hand, energy renovation in the Danish building sector has been either in the form of purely theoretical investigations, studies or activities and projects driven by the need to change or be modified in a certain building or block of buildings. In such projects, simplified and static tools are often used, with no consideration for the building dynamics and the impact of various building characteristics and specifications on the overall energy performance [
33]. These static tools are generally associated with large gaps between the actual building energy performance after renovation and the predicted or expected performance [
34]. One of these tools is BE18 [
35], the official tool for energy assessment of buildings in Denmark, developed by the Danish Building Research Institute. The tool provides a user-friendly platform, but suffers from considerable inaccuracies. Although it works on a case-by-case basis, the BE18 tool is fully static with a large number of assumptions. For instance, the whole building is characterized by a large box, and the energy calculations rely on an average yearly outdoor temperature and do not utilize dynamic ambient temperature profiles throughout the year. A number of programs that function similarly to BE18 exist and are used in other countries, such as the German PHPPtool [
36]. Considering the comprehensive Danish strategy for energy renovation along with the large potential of implementing renovation projects all around the country, there is a need for a design and assessment tool that can aid the Danish buildings’ energy renovation decision-making, considering the technical, economic, and environmental impacts.
Considering the review presented on building energy retrofit tools, the current study presents a tool for Danish building energy retrofit design and assessment, DanRETRO. In its design and development, the DanRETRO tool adopts the physics-based energy modeling approach. Unlike current Danish building retrofit assessment tools, such as BE18, DanRETRO builds on a pre-simulation database comprising a large number of energy simulations for Danish buildings’ performance of different type, sizes, and age groups. The Danish building industry currently lacks such types of building energy retrofit design and assessment tools, where it relies majorly on static tabulated approaches with very large assumptions.
In the development of the tool, multiple building retrofitting techniques and improvements are carried out along with assessment of the impacts of implementing these measures on the overall energy performance. The improvement measures include upgrading the building physical envelope and constructions, upgrading or installing new technical energy conversion systems, and applying control and operation strategies, such as daylight-controlled interior lighting. DanRETRO uses a systematic and comprehensive approach in estimating the technical, economic, and environmental impacts of implementing different energy retrofit measures on the holistic performance. The tool development and demonstration are presented in this study along with an overall evaluation and assessment.
2. Approach and Methodology
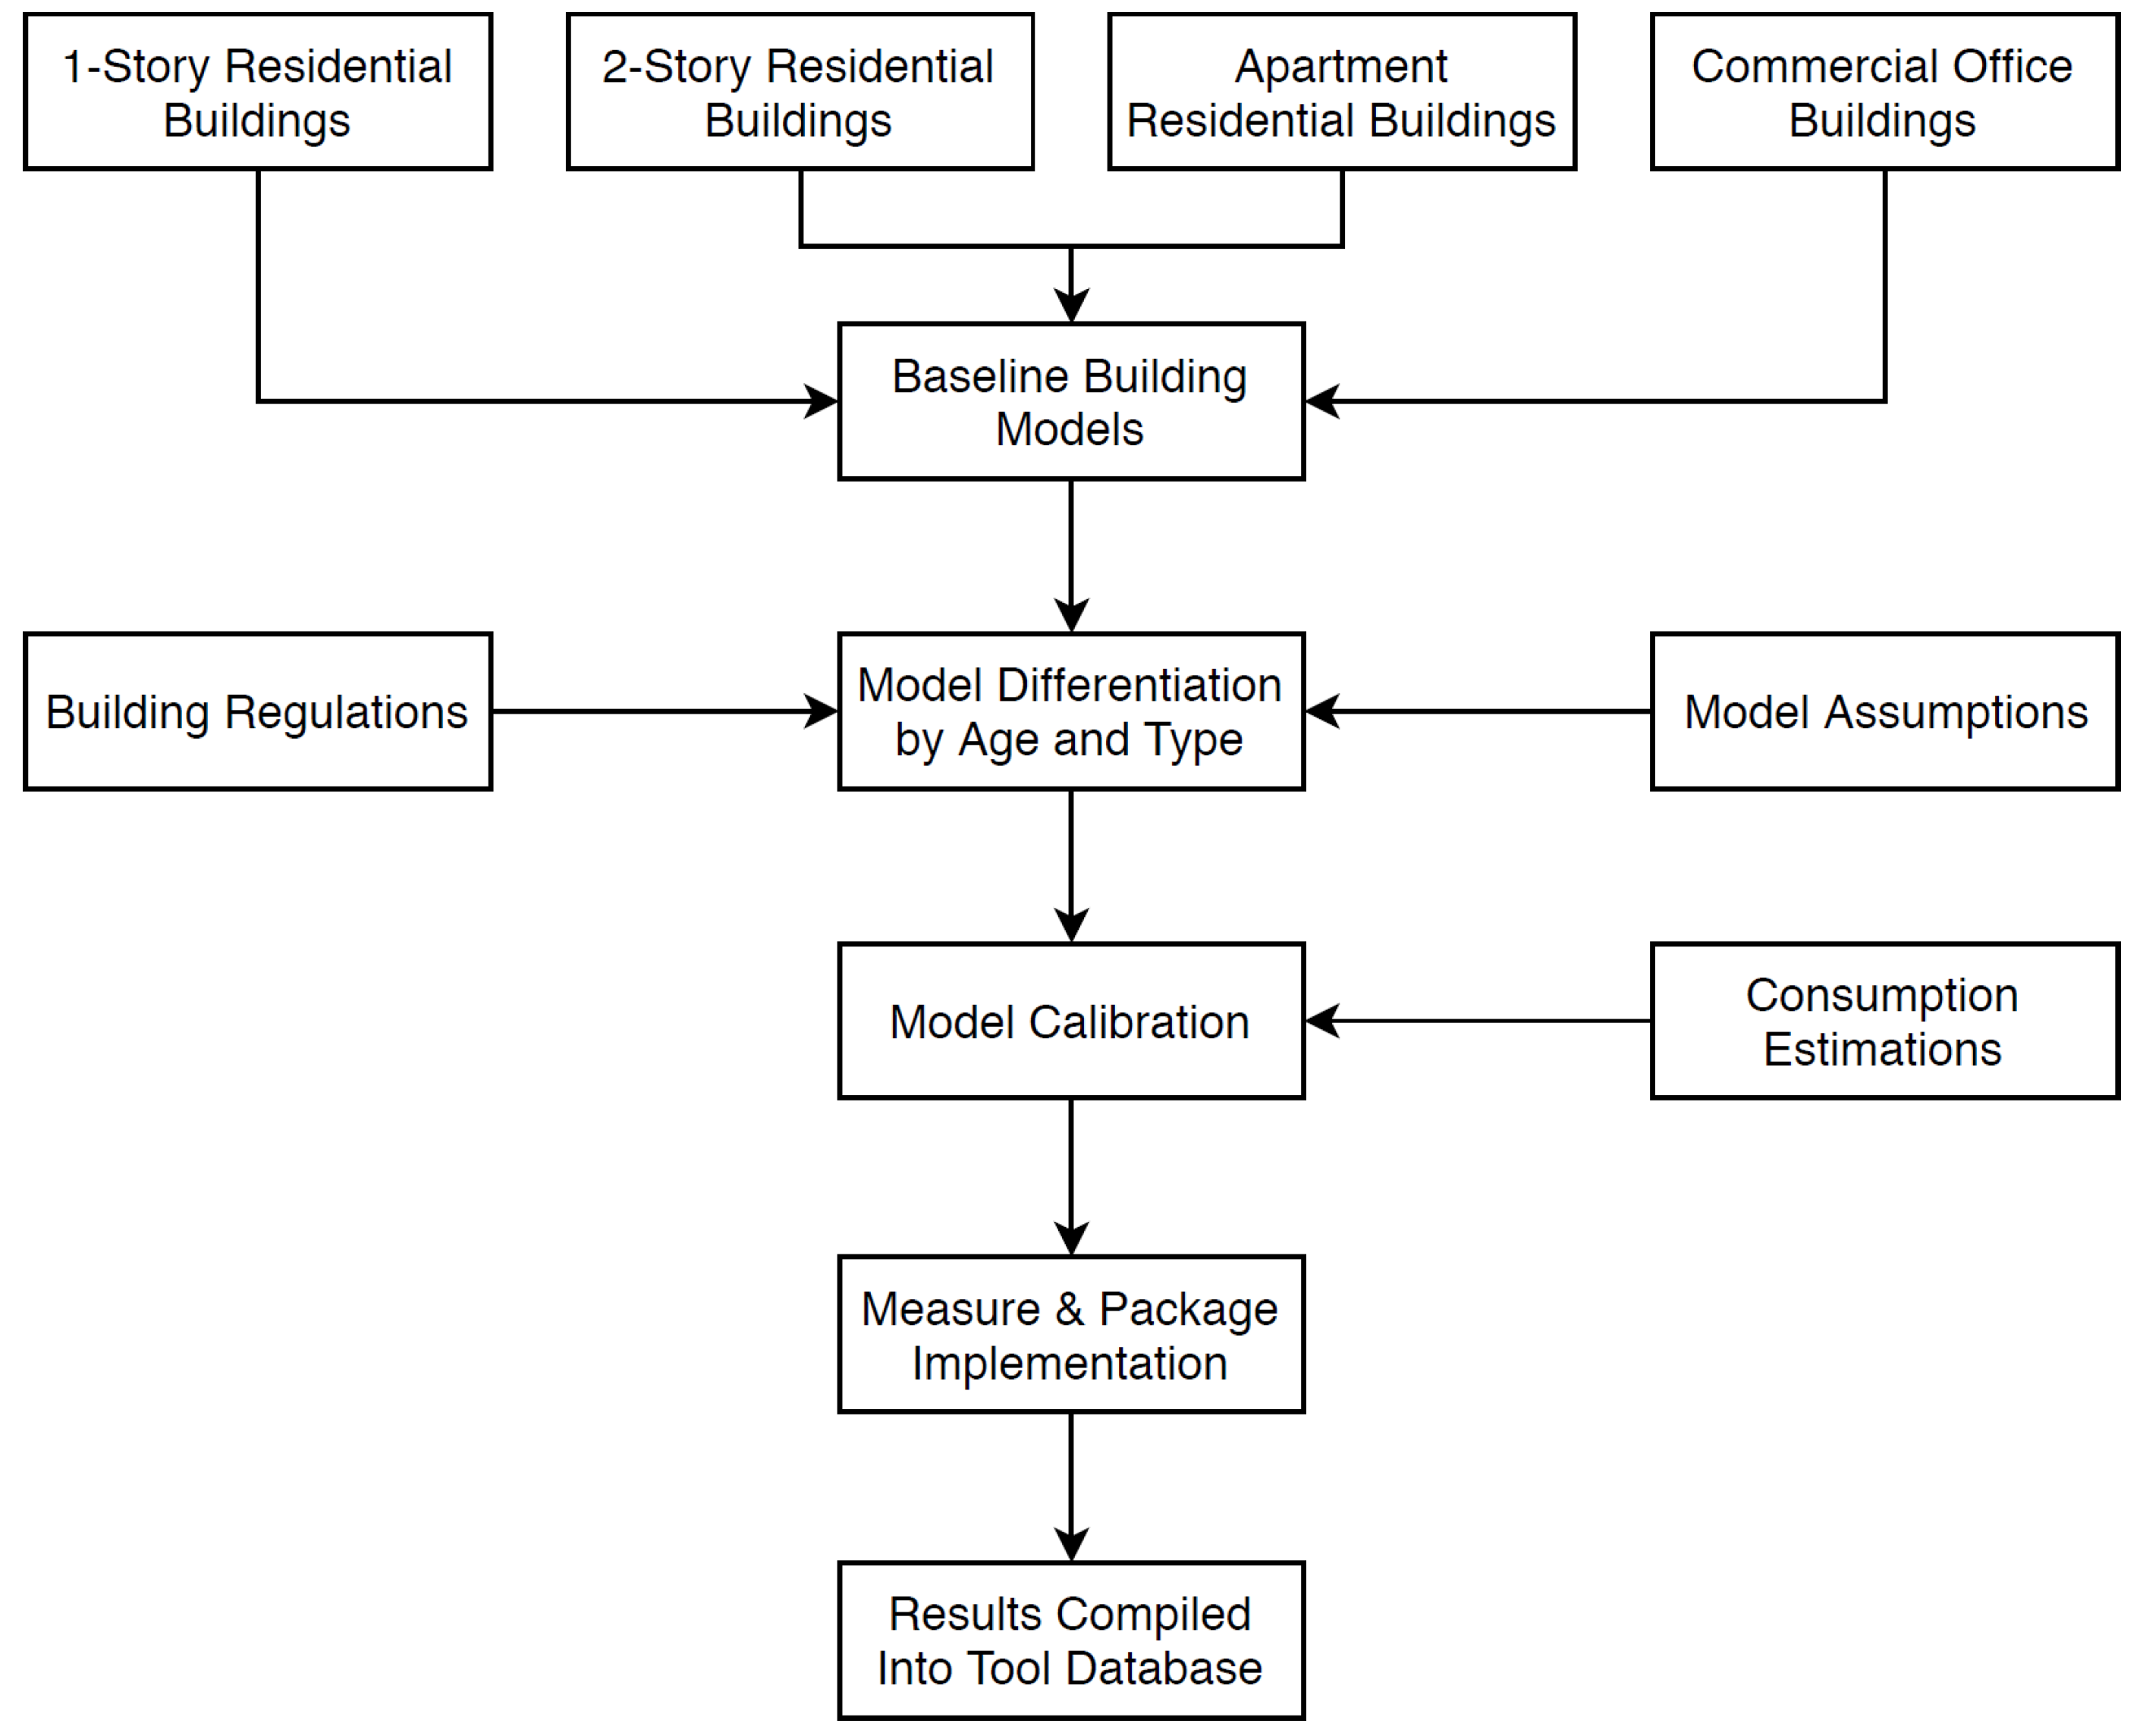
This study investigated the estimated impacts of different renovations and improvements to commercial and residential buildings over a time span of several decades with changing regulations and building practices. As this was done with the intention of creating a tool that can estimate the impact of a given improvement measure for a given building based on the type of building, the period where the building was constructed, and the net conditioned area of the building, applicable buildings must be sensibly separated into groups. The methodology used to create the models and the tool is presented in
Figure 1.
This study considered four types of buildings general enough in construction to be applicable for the tool. These types are 1-story houses, 2-story houses, apartment buildings, and office buildings. To account for the different construction dates and resulting difference in applicable regulations, each building type was divided into a series of time periods, and a dynamic model was made for each. All buildings built before 1961 were grouped into one set. Between 1961 and the modern day, buildings were grouped roughly by decades following the regulations BR72, BR85, BR98, and BR08. Specifically, all buildings between 1961 and 1979 were considered one set, and from there, it was separated by decade following the corresponding aforementioned regulation. As an added means of demonstrating what is possible for these buildings, buildings based on better principles were also considered for each type.
Then, a dynamic model was created for each building type using the modeling tools SketchUp and OpenStudio to characterize a standard building of each type. Each of these models was then replicated and individually defined to match the different building regulations in terms of envelope U-values and similar properties to ensure that the quality and thermal transmittance of the envelopes in each model matched the corresponding regulations, as shown in
Table 1.
The models were then all equipped with lighting equipment, electrical equipment, occupancy definitions, and heating equipment with appropriate usage and operation schedules to match a standard for each building type and construction date. Because of the lack of mechanical ventilation in most older buildings, it was assumed for the purposes of this study that none of the models had mechanical ventilation up until the models for the 1990s and 2000s, which both have two scenario models for each building type: one scenario with mechanical ventilation and one without mechanical ventilation. The schedules used for the building types were the same throughout the different construction dates, as it was assumed that said dates were independent of occupant levels and activity. The three residential buildings had similar schedules, while the office building differed and used predefined schedules and activity already present for a standard office. An example of electrical appliances’ operation schedule for a residential building, as defined in OpenStudio, is shown in
Figure 2. This schedule is a fractional type, meaning it operates between a maximum and minimum value of 1 and 0, respectively, of the defined appliance peak load.
As a means of avoiding the variance in exact appliances and usage from house to house, the occupancy schedules for the house types were estimated for an average family of 2 adults and 2 children with set weekly activities. The apartment building was done similarly with 1 or 2 people. On the same principle, the electrical appliances and lights were defined as a single Watt per square meter quantity for all building types so that an average level could be approximated to apply generally.
Once the models had all components defined, the energy performance of each building was simulated, and the overall electricity and heat consumption was reported. Considering the baseline consumption, the models were then each adjusted and calibrated until the consumption matched the values for annual heating and electricity consumption set by each of the building regulations in Denmark throughout the decades [
9]. To carry out the different energy simulations, standard Copenhagen weather conditions and ground temperature profiles were employed. Because residential buildings and office buildings do not have the same requirements in the BR, the office models were calibrated to the same set of numbers, but increased by 20%, as this is roughly the difference in allowed energy values between commercial buildings and residential buildings, based on the BR numbers. The calibrated consumption data for all baseline models are listed in
Table 2.
Once the modeled buildings were matched within an acceptable 5% margin of error to the expected consumption for the corresponding time period and building type, the models were then used as a basis for the investigation into the impact of different renovation approaches. This was carried out by recording the consumption of the calibrated base models, then applying a single renovation measure to the model and comparing the resulting new consumption to that of the baseline model. This was done for every considered measure in this study to all baseline models of every building type and every BR variant to estimate the impact of the individual changes to all the building models considered. Finally, a number of packages containing several measures implemented and simulated at once were established to model the impact of several measures at once, as all renovation measures were interdependent to various degrees if implemented together. This is important to note, as the impact of single measures cannot simply be added to each other without risking estimate error and a loss of accuracy.
The results of the simulations were in the form of lowered consumption in heat and/or electricity, which would then also result in lowered operational costs and environmental impact. These results varied by measure, construction date, and building type. Below, a list is given of implemented and simulated measures divided into respective categories with details explained.
3. Energy Retrofit Measures’ Description
The options for retrofit measures when considering residential and commercial buildings are plenty and dependent on the exact building in question. Areas of improvement in building performance include the envelope of the building and energy supply systems’ upgrade, in addition to improvement of the building’s intelligence level. Generally, the energy systems targeted in a Danish energy renovation process are the heating system, mechanical ventilation system, and lighting. In a renovation project, each building is a specific case itself, and the choice of renovation measures to implement is governed by many factors. This includes building type, age, energy systems used, physical envelope status, and occupants’ needs.
In this study, a list of energy improvement measures was selected, being the most implemented measures in the recent renovation projects. In this section, a description of the various measures selected is presented along with the approach followed in implementing each renovation measure.
Table 3 provides an overview of the different renovation measures along with their assigned category.
3.1. Envelope Improvements
Improving the building envelope mainly entails renovating the walls, roofs, floors, and windows in the exterior of a building such that the total heat loss through these surfaces is reduced. These improvements lead to less heating requirements and, thus, a reduction in the overall energy consumption by that building. Specifically, this study handled such improvements as lowered U-values for the given building elements, through adding mineral wool insulation on the exterior of the envelope constructions. The amount of insulation added to each construction was governed by the target to reach the specifications of U-value of each component set in the Danish building regulation of 2015, BR15.
Walls: Additional insulation was added at the exterior of the external masonry walls in the building so that the U-value attained the targeted 0.18, reducing overall heat loss through the affected surfaces.
Roofs: Additional insulation was added at the exterior of the external roofs in the building so that the U-value attained the targeted 0.12, reducing overall heat loss through the affected surfaces.
Floors: Additional insulation was added at the exterior of the floor construction in the building so that the U-value attained the targeted 0.18, reducing overall heat loss through the affected surfaces.
Windows: External windows were upgraded by replacing old model windows with new windows with an overall U-value of 1.4, reducing overall heat loss through the affected surfaces.
3.2. Electrical Appliances and Systems
The measures regarding electrical appliances and systems target the devices in a building, such as computers, and the reduction of the consumption of these appliances. Furthermore, it includes lighting controls to curb unnecessary lighting hours, as well as adding a photovoltaic system to the roof of a building to establish an on-site renewable electricity supply.
Appliances’ upgrade: All electrical appliances in the model had their consumption reduced by a certain level depending on their respective operation pattern.
Photovoltaic system: Photovoltaic panels were added to the roof of the building, providing an on-site electricity supply and reducing requirements from the electric grid, thereby lowering the consumption of paid electricity.
Daylight sensors: The interior lighting in the model had daylight controls added to its day-to-day operation. This added comparative logic to the model that would turn off the lighting if enough daylight were present.
Motion sensors: The interior lighting in the model had motion sensor logic added to its operation. This registers the levels of occupancy in the applicable rooms with lighting and turns the lights off in given rooms whenever those rooms have a period of vacancy.
LED lighting: This measure characterizes the installation of LED lights to replace conventional lighting devices. LED are on average a more efficient lighting equipment due to their ability to provide adequate lighting while using less electricity overall. To simulate this, the wattage per square meter for lighting equipment in the models was reduced to 3 or 3.5, depending on the building type.
3.3. Ventilation System
The measures concerning the ventilation system deal with mechanical ventilation installed in a given building. Improvement measures deal with controlling its operation based on a control scheme or adding a component to the system to influence the overall operation.
Heat exchanger: This measure adds a heat exchanger to the ventilation system so that the warmer air leaving the ventilation system can transfer some of its heat to the colder air entering the system. This exchange of heat raises the temperature of the air entering the ventilated spaces, thereby reducing the heating requirements for these spaces. In the models, a heat exchanger was placed into the ventilation definition at the air intake.
Demand control ventilation: This measure implements control logic in the ventilation system that monitors indoor conditions and controls the operation of the ventilation system based on these conditions. This allows the ventilation system to recognize when its operation is not needed or should be reduced, resulting in efficient operation and lowered consumption. In the models, this control scheme is an option that can be turned on.
Ventilation fan upgrade: This measure increases the efficiency of the fans in the ventilation system. This improvement is simple and merely reduces the electricity required to operate the fan as per the needs of the ventilation system by reducing the wasted electricity of a lower efficiency.
Preheating: This measure implements a preheating loop at the ventilation intake, which allows the air to be heated prior to being released into the ventilated spaces. Depending on the heat characteristics of the materials enclosing said space, this measure should allow for a more efficient heating process. In the models, this was done by implementing a hot water coil after the air intake and tying the hot water coil to the main heating system.
Temperature-based ventilation: This measure enables the ventilation system to operate based on temperature within the conditioned spaces and temperature setpoints, providing air based on this one parameter. In the models, this was done by changing the heating and cooling setpoints, so the system maintained indoor temperature by adjusting outdoor air intake to maintain it at set levels.
CO2-based ventilation: This measure adds a CO2 controller to every conditioned space, allowing ventilation control based on CO2 levels. This will enable the ventilation to alter operation based on whether the levels are within a set range. The system can then slow down when the levels are acceptable and speed up when the levels are reaching defined limits. In the models, this was done by defining CO2 controllers for each space and defining the acceptable limits for CO2.
3.4. Heating System
The improvement measures targeting the heating system in buildings deal with the operation and control of the system, along with the hot water circulation pumps employed. These measures make the heating process itself more efficient or alter it slightly to reach lower consumption.
Heating setpoint management: This measure lowers the heating temperature setpoint of the building by one degree Celsius. Lowering this setpoint reduces the consumption of the building and could be lowered further, but it should be noted that indoor comfort may well be affected if the change in setpoint is greater than one degree, based on Danish buildings’ indoor comfort reports.
Adaptive heating: This measure allows the heating system to adjust its operation based on outdoor temperature, meaning that higher and lower outdoor temperatures can enable the heating system to alter and adapt the heating supply to the building based on the ambient air temperature, resulting in less heat waste and more efficient heating.
Circulation pump: This measure improves the hot water circulation in the heating system by upgrading the pumps. This improvement should result in the same system heating output at lower electricity consumption, reducing the overall capacity required to heat the building. This is modeled by replacing the pump in the base models with an improved circulation pump.
3.5. Packages
In addition to the single measures implemented and assessed in this study, a list of energy improvement packages was also considered and simulated. Generally, multiple packages could be implemented, but six major packages were chosen in this study, with each targeting a certain aspect of the building performance.
Package 1, building envelope: Walls and roofs are improved.
Package 2, building envelope: Walls, roofs, floors, and windows are improved.
Package 3, electrical systems’ upgrade: Electrical lighting and equipment are upgraded; motion sensors are added, and a photovoltaic panel is included.
Package 4, ventilation system upgrade: The ventilation system is equipped with a heat exchanger and preheating. The fans are upgraded, and demand-controlled ventilation is enabled.
Package 5, heating system upgrade: The heating setpoint is lowered. The circulation pump is improved. Adaptive heating is implemented.
Package 6, energy management package: Daylight and motion sensors are implemented. Demand-controlled ventilation is enabled. The heating setpoint is lowered. Adaptive heating is implemented.
The results for all measures and packages applied to all building models were then compiled and set up to be used as a database for the energy retrofit tool to be developed.
It is important to note that the DanRETRO tool only implements one measure or package at a time without including other measures in the same result. For instance, a measure, such as the floor insulation, is only included in the tool calculations by itself and as part of Package 2, when Package 2 is chosen. In practice, any measure listed in
Table 3 can be investigated and implemented in a given building in combination with other measures. In addition, it is possible to implement Packages 2, 3, 4, and 5 simultaneously on the same building, as these packages all impact different aspects of a building and are not mutually exclusive. Doing so would lead to a deep energy retrofit process implementation and would have a tremendous impact on the performance of a building.
As mentioned earlier, 18 renovation measures and six selected packages were chosen to be included in the current version of the tool; however, additional options, including additional measures or even combinations of packages, could be added in later versions. In the current form, the DanRETRO tool provides good flexibility for the user to compare the impact of different measures, say if the user is considering either insulating walls, insulating roofs, or upgrading the fan of a ventilation unit. It should be noted that DanRETRO, in its current version, does not seek to dictate or determine which exact combination of measures is most favorable for a given building. The tool is intended to provide information that compares the impact of a large array of retrofit options. Thus, the tool serves as a preliminary analysis and could aid the decision-making process in a swift and as simple a manner as possible.
4. Tool Development
In this section, the development of the DanRETRO tool for Danish building energy retrofit design and assessment is presented. The tool development was based on the database of energy simulations carried out for the four building types presented earlier, along with simulations of various energy measures and packages for each building type and for each set of building age. The tool aimed to aid the decision-making process for Danish buildings’ energy retrofit projects and provide a preliminary assessment of the energy performance of existing buildings, namely residential and office buildings. To ensure availability and convenient use, the Google Sheets application was used for the development of the tool, thereby ensuring that the tool was accessible online. Google Sheets is essentially the same as Microsoft Excel, i.e., a spreadsheet program, and therefore, the tool benefits from this familiarity. The tool consists of a user interface and a set of databases that work in the background from which data are imported.
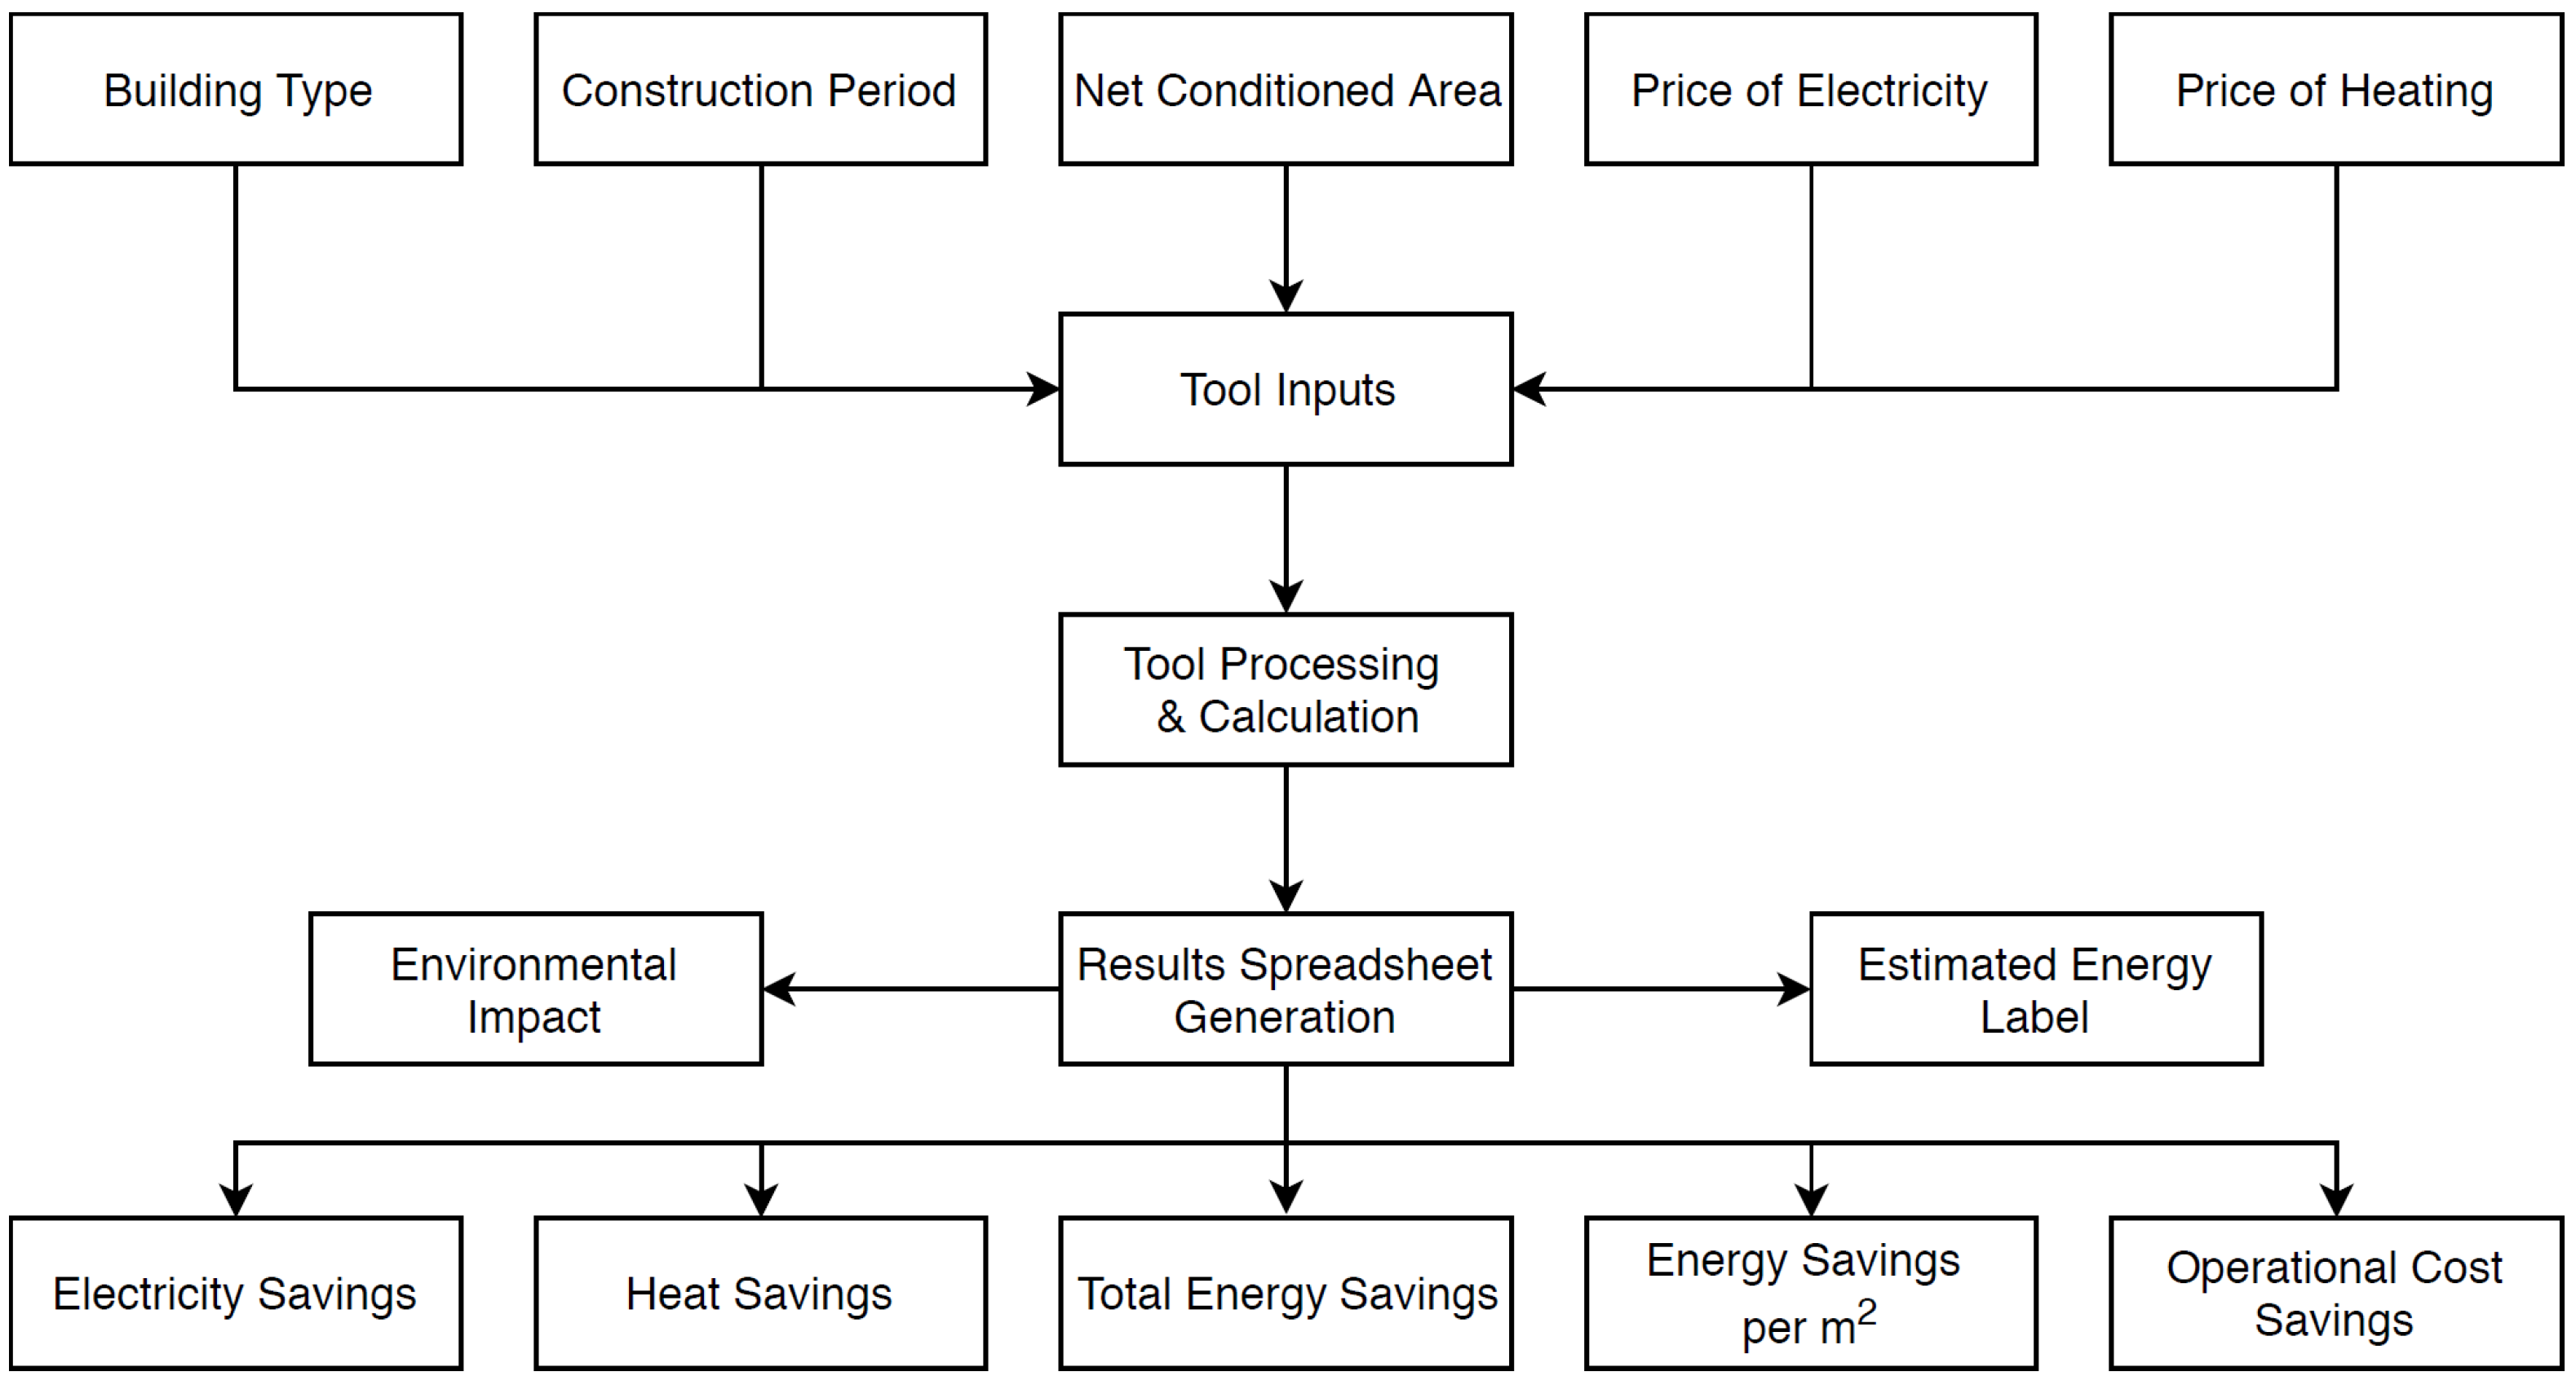
By comparing the energy consumption of the baseline model before and after the renovation measure, the electricity and heating savings were saved and stored in a database. Each building type had its own Google Sheets Workbook database with subsequent Sheets for the specified BR. This information, alongside input specified by the user, was used to calculate the total impact of the renovation measures on total energy, economic and environmental savings, as well as an energy label that represented the energy efficiency of the building. These savings were directly tied to the five inputs that the user must choose: building type, year of construction, building area, and prices for electricity and heating. The flow and sequences of actions of the DanRETRO are illustrated in
Figure 3, in terms of inputs, processes, and outputs.
The building type input is a drop-down menu that consists of the four building types, i.e., residential one-story, two-story, apartments, and commercial office buildings. Similarly, the construction period input is a drop-down menu that specifies the decade in which the building was constructed. The net conditioned area is a manual input for the net conditioned area in square meters of the building in question. The energy price, i.e., electricity and heating, is also a manual input because the energy prices vary significantly depending on the location and the supplier. The building type input ensures importing data from the correct Google Workbook, while the construction period provides the correct Google Sheet from said Workbook.
For any selected building type and year of construction configuration, the baseline model building values are listed as a point of reference. The 18 different individual renovation measures and six packages presented previously were printed with their energy, economic, and environmental savings. The electricity and heat savings column in kilowatt hours per square meter are static quantities and have been determined based on the baseline models. The electricity and heat saving percentages are the percent savings generated by the renovation measure in comparison to the baseline model consumption.
The total energy savings in kilowatt hours are the sum of the electricity and heat savings multiplied by the net conditioned area. The total economic savings likewise depend on the electricity and heat savings alongside the net conditioned area, electricity, and heat price inputs.
The total environmental savings were also calculated by multiplying the electricity and heat savings with their respective CO2 factor and the net conditioned area. All the savings are reported based on an annual assessment.
The primary energy consumption was calculated and printed, which was used for energy framework calculations. It is a definition for how much energy is used to produce the energy carriers and depends on an energy factor for electricity and heating that expresses how many kilowatt hours of energy, on average, are used to produce one kilowatt-hour for the end consumer [
37].
The equation for the primary energy is given in Equation (
1), where
EE is the factor for electricity and is 2.5, while
HH is the factor for heating equal to one [
37].
The primary energy was printed because it ties directly into the assignment of the energy label and provides a means to see how close the value is to a given energy label threshold. The energy label, that is a measure of a building’s energy efficiency, is based on the threshold values from
Table 4. The private sector thresholds cover the residential buildings, while the commercial sector thresholds cover the office building type.
The energy labels ranged from A2020–G, best to worst. The baseline energy label was printed for the selected building, while the new energy label was calculated on the basis of the energy consumption before and after the renovation.
While DanRETRO provides a holistic evaluation of the technical, economic, and environmental savings achieved for each energy renovation measure or package adopted, DanRETRO is not intended to serve as a standalone optimization tool, but a means for providing a preliminary assessment and comparison between various retrofit options. Saying that, the tool has an option that allows the user to sort the results attained for the different measures and packages either based on the energy savings, operational costs savings, or CO2 emissions eliminated.
5. Tool Demonstration and Results
The DanRETRO tool is accessed online by requesting permission of the authors. Once permission is granted, the user is met by a user interface that requires five inputs to calculate the total energy, economic, and environmental savings by implementing a given renovation measure or package. To illustrate the usage of DanRETRO, three cases are considered in this section. All the cases will use electricity and heating prices at 2.5 and 0.7 DKK per kilowatt hour (0.33 and 0.09 EUR), respectively, being the average electricity and heating costs for Odense, Denmark.
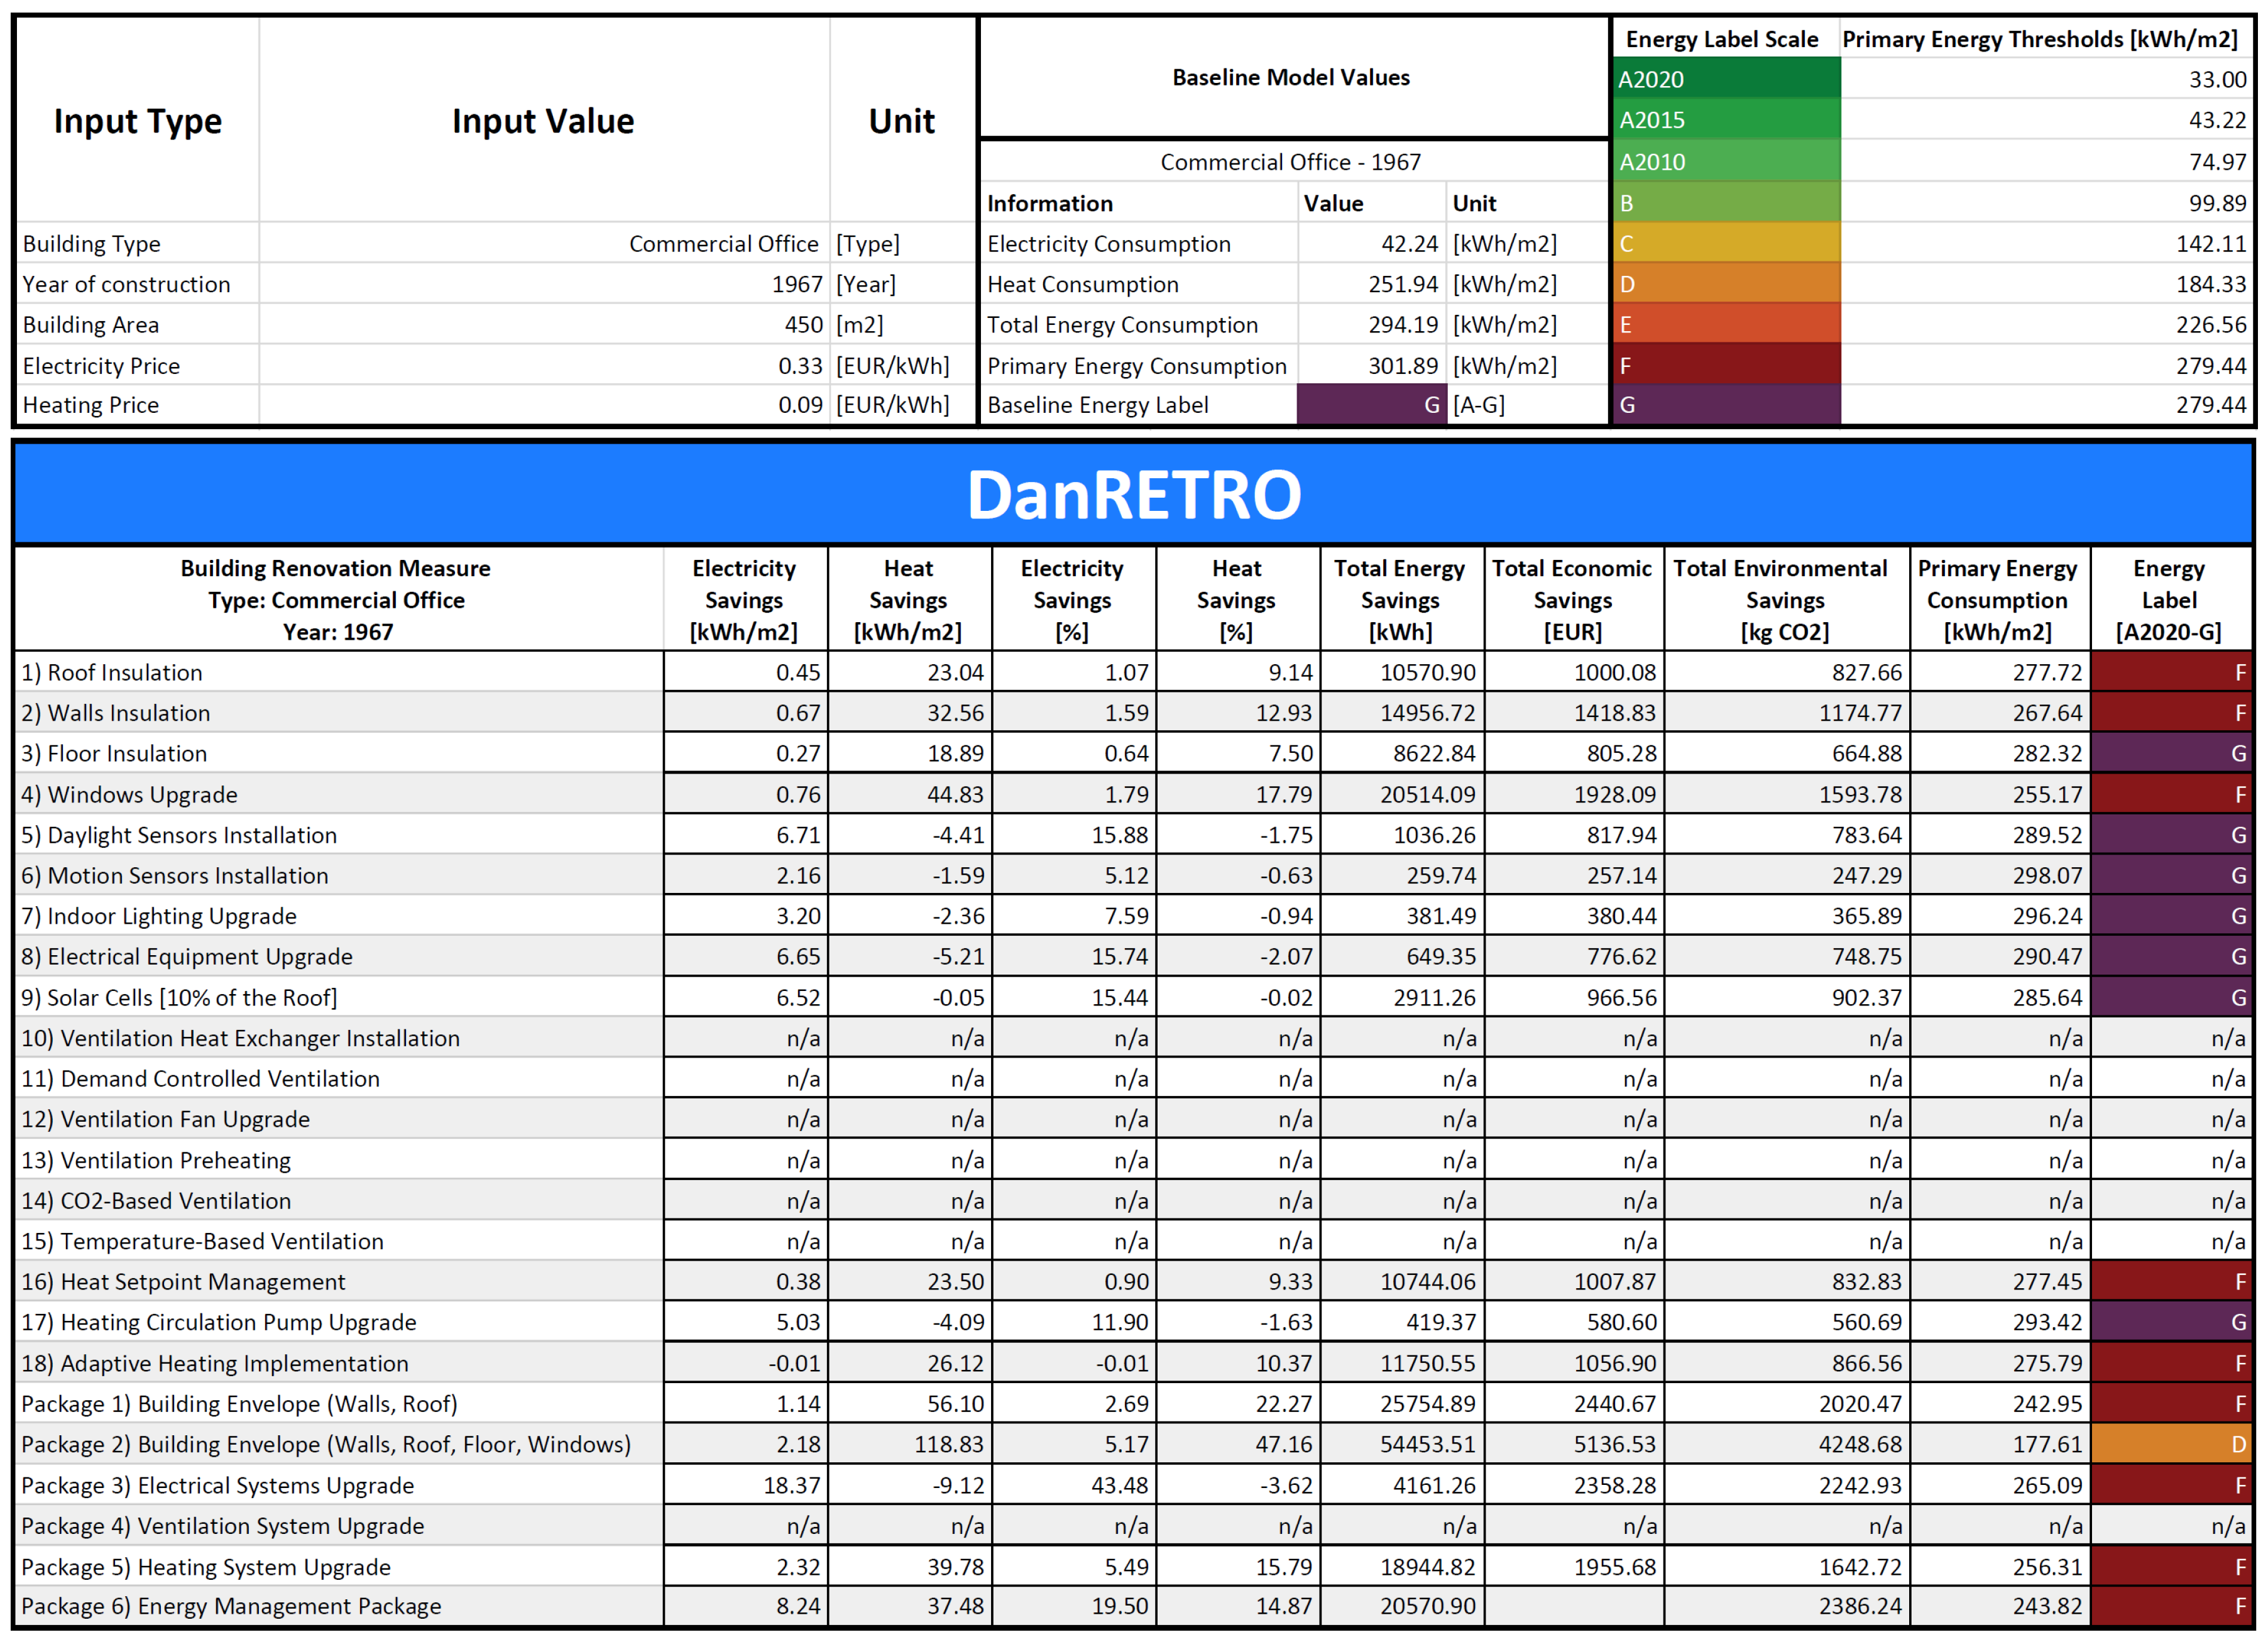
The implementation of three different cases, each with a different building type and year of construction, was examined in the tool, and a print of the results is shown in the following three figures in this section.
Figure 4 shows the DanRETRO results for a 300-square meter two-story residential house from 1992; the second case is shown in
Figure 5 using a 450-square meter office building from 1967, and the third and final case is shown in
Figure 6 using a one-story residential building from 2015 of 180 square meters.
A demonstration of these three particular combinations of building type, conditioned area, and year of construction is presented below.
Case 1 started with being labeled D as a baseline close to C, as was evident from several single improvements changing the label by themselves. Furthermore, by inspecting the impact of the individual measures, it was apparent that envelope improvements provided only some gain, with the windows providing substantially more than the other envelope options.
The electrical improvements provided a similar level of energy savings, the exception being solar panels, which did substantially more. Conversely, the electrical improvements lead to greater monetary savings. The more promising measures were the ventilation measures. These options provided significantly more savings in comparison to the previous ones, especially the heat exchanger and demand-controlled ventilation.
The heating improvements provided smaller improvements, with the exception being adaptive heating capabilities. The packages mirrored these tendencies, as the packages with the highest impact were the ones affecting ventilation and heating.
This would suggest that while the envelope can be improved, the building might gain more by focusing renovation efforts on technical systems. Both approaches were feasible, as any significant envelope improvement would make ventilation and heating improvements provide greater savings because the building would lose less heat to its surroundings with a better envelope. However, the technical systems can evidently also be upgraded by themselves, as Package 4 can increase the energy performance label to A2010 from the baseline label of D.
Case 2 was evidently a very poor building in terms of energy performance, as only about half of the simulated improvements managed to improve its energy performance above G. This was emphasized by the impacts of the individual measures, as the greatest savings can be attained through envelope measures and the improvements controlling the main heating system. This is because the envelope of the building was so poor in comparison to modern standards that any non-envelope or heating improvement would be undermined by the inherent magnitude of the heat losses through the envelope of the building.
This leads to envelope improvements being nearly mandatory for buildings such as this. The best indicator for this statement is the difference in savings between the complete envelope package and all the other options, as this package increased the energy performance label to D. Renovating the envelope of the building saved such a larger amount of energy that at least parts of it must be included in any improvement strategy. Without such improvements, other renovations or upgraded systems would not be very feasible. Therefore, it seems that the best approach to a building like the one in Case 2 is a larger package that combines heating measures and envelope measures in a manner that is not explicitly covered in the current version of the tool. This is because the label G represents such a large gap between actual performance and modern standards.
Case 3 was a better building than the other two cases, as the baseline label was B, with one single measure and two packages improving the label to A2010 and A2015, while Package 3 reached A2020.
The measures had varying levels of improvements, as the most effective measures were the solar cells, adaptive heating, ventilation heat exchanger, and the demand-controlled ventilation measures. A few of the measures also returned negative values, such as the preheating measure. This would indicate that the building was in a state where improvements to electrical systems might be offset by a resulting increase in heating requirements, and vice versa. With this being the case, a building such as this should carefully select which technical system improvements would be best. From the results, the electrical controls and upgrades offered the most, both in terms of economy and energy savings.
This is also evident in the package results, as the different combinations clearly showed which systems were most favorable. The electrical system improvements shown in Package 3 exceeded all other package results by a very significant margin, indicating that this case gains most from electrical improvements and then ventilation improvements second, following the tendency in the individual measures.
The exact cost of the implementation and practical circumstances will likely be the deciding factors between specific electrical improvements, as they are all feasible. The solar panels provided the greatest single improvement of the category, but the sensors and equipment were not far behind, and are arguably easier to install.
6. Discussion
While the results associated with this study and the tool detailed herein were based on a number of assumptions and estimates in the methodology, the application of the tool itself achieved its intended purpose. DanRETRO was capable of providing impact estimations for a moderate range of building renovation and improvement techniques with only a handful of simple inputs required from the user. This fits the intent of having an uncomplicated tool that is easy to use without much prior knowledge, but still achieving a level of comprehensive applicability. This will allow the tool to be used as a source guiding assessment for many renovation projects.
The four building types covered in DanRETRO granted it several advantages in this regard. By having those four types of buildings, the tool was generic enough and widely applicable to the Danish building sector without overreaching to cover all possible buildings, such as factories and other commercial buildings. Hence, it allowed some commercial and almost any private residential renovation endeavor to roughly estimate potential gains with little effort beyond providing the necessary inputs. This is because the ideal method of estimating improvements to a building in need of renovation is case-by-case analysis, which is a time- and resource-consuming process.
The method of using dynamic models also allowed for the use of package solutions to estimate several improvements made at once. Some present methods do not use this approach in general, instead relying on established tables for different renovation options on a per-square-meter-savings basis. This basis, while being simple to apply, involves precision errors when including several measures at once, as mentioned in the Methodology Section. The dynamic modeling alleviated this issue and allowed for the customization of measure combinations or packages to estimate the impact of more extensive or complex renovations.
To demonstrate this inherent error in simply adding the impact of individual measures, a simple comparison was made between the sum of the components of Package 1 and Package 1 as a whole. This should demonstrate the interdependent nature of separate improvements and why package simulations are very useful for more accurate estimations and assessments.
Using the data from the pre-1961 apartment building model, the individual impacts are compared with their sum and the impact of Package 2 on the same building model in
Table 5. Note that the discrepancy was different from building to building, depending on various properties of said building, but while it was small in some cases, it was very significant in others.
As is evident from
Table 5, there was a significant difference present with four measures simulated at once, which emphasizes why the tool associated with this study only applied the package method and refrained from all simple addition of impacts.
While this speaks to the value of DanRETRO, there were also shortcomings in the design and structure of the tool in its current form. At present, DanRETRO works in time intervals of a decade per interval. For instance, this means that a building constructed in 1971 will be identical to a building of the same type constructed in 1979, regardless of exact differences, when applied to DanRETRO. This is a result of the generalization in the tool to fit in the development of the BR, which invariably sacrifices a certain level of accuracy in some cases for the sake of wide applicability. Nevertheless, the tool in its current version is fully devoted to deal with buildings in a Danish context, considering the physical envelope, energy systems, and other building specifications.
Similarly, the generalized baseline cases used for the building types did not account for a set of smaller differences. For instance, all the building models only used a single set of occupant patterns. The residential houses all assumed families of four as residents. By extension, the models also assumed a single set of occupant behavior. This creates an inherent risk of deviation from any specific case for the sake of the generalized form of the tool, but it should not be a major concern for anything except significant outlier cases in terms of consumption. Saying that, fitting the needs of very specific cases is not the purpose of DanRETRO, as it would need considerably more work to facilitate specific variations.
In principle, the more detailed the building energy model developed is and the more variables, energy measures, and packages are targeted and investigated, the higher the accuracy of the results attained and the more effective the assessment. In this context, many currently available tools and interfaces are capable of performing a detailed energy retrofit assessment, using algorithms targeting a large number of variables and considering combinations of various retrofit measures and packages. An example of such tools is the OpenStudio Parametric Analysis Tool (PAT) [
39], which allows an automated investigation and comparison of different alternatives including modifications in building architectures and design, energy efficiency measures and packages, and mechanical systems’ modifications. PAT uses dynamic EnergyPlus simulations as a basis for this comparison and optimization, and thus, it requires a full and detailed building energy model with all specifications and characteristics defined. In general, although this yields accurate results and effective comparison of alternatives, it is a time- and resource-consuming process.
On the other hand, as presented in the research objectives and the DanRETRO tool development description, the aim behind this work is not to develop a tool for optimization, rather for preliminary assessment and comparison between various retrofit options. Thus, the DanRETRO tool with very simple inputs provides a technical, economic, and environmental comparison of the impacts of different energy measures and packages if they are to be implemented for a certain case study building. The main intention behind the development of DanRETRO is having a comprehensive tool, yet generic and simple to be used by any user, even with minimal knowledge, in the field of building engineering. This also provides a large potential for the tool to be applied on a large scale of buildings. The use of generic data is, however, also a limiting factor and could lead to lower accuracy in the estimations. This generic nature of the tool prevents it from achieving the highest levels of precision in its assessments of specific cases, especially for cases that deviate from the norm created by the BR and the energy consumption estimates, which form the basis of the tool development.
7. Conclusions
In this study, DanRETRO, a decision-making tool for energy retrofit design and assessment of Danish buildings, was presented and implemented. Currently, the majority of the energy retrofit projects in the Danish market rely on simplified and static tools, with no consideration for the building dynamics and the impact of various building characteristics and specifications on the overall energy performance. Aiming to overcome these issues, DanRETRO relies on a dynamic energy performance simulation database, carried out in EnergyPlus, for various Danish buildings of different ages, sizes and types. The intention was to develop a comprehensive tool, yet generic and simple to be used by any user, even with minimal knowledge in the field of building engineering. With very limited inputs, the tool was capable of providing an overall assessment and evaluation of the technical, economic, and environmental impacts of implementing a large number of energy retrofit measures, as well as energy improvement packages.
The tool methodology and development were presented in this study. In addition, DanRETRO was demonstrated considering three case study buildings of different types and ages. The results were assessed and discussed considering the impact of various improvement measures and packages on the energy consumption, operational costs, and environmental emissions. Although the tool made certain assumptions in its implementation and use, including occupancy patterns and schedules, along with buildings age groupings, DanRETRO was intended to be simple to use with very limited inputs by the user, while comprehensive in its assessment at various levels. In addition, the tool had the possibility to be coupled with a more detailed dynamic energy retrofit investigation on a specific case study, following the approach developed by Jradi et al. [
40].
Finally, further improvements to the current version of the DanRETRO building energy retrofit tool could be considered and implemented in the next versions. For example, this could be through the addition of more building types, including hotels, schools, retail stores, and others. These building types are more complex to model and adopt the generic approach presented, due to the specialized electrical equipment or machinery used, which may have a large impact on the overall facility performance. Moreover, additional modifications and alteration of the current DanRETRO version could include more detailed sampling of the building year of construction, considering different heating and electricity supply resources, including additional renovation measures, packages and combinations of packages, more detailed economic analysis with investment costs, and payback calculations.


