1. Introduction
Involving people in urban projects and the use of citizen’s views are the key factors for sustainable urban society development [
1,
2,
3]. People’s participation occurs in a variety of ways [
4,
5]. Considering people’s perceptions and their cognition of the environment that they live in can play a key role in successful urban planning based upon people’s actual needs [
6,
7,
8]. The feelings and expectations of people regarding space and their living space, with regard to their cultural and social characteristics, have always held researchers’ interests [
9,
10,
11].
When studying the mentality and perception of people with regard to city and urban spaces, one of the common methods is synchronizing their conceptual mapping of the city into a map that provides a tangible model of the city. These maps were first introduced by Tolman as cognitive maps in 1948 [
12] and express the subjective and abstract representations of the individual from the environment [
13]. Images that take this form include elements derived from the individual’s direct experience from a location and information from the environment, which include the place structure or appearance, its relative position and its values. These mental images are types of guiding maps [
14] and are in fact, images of the distances and directions formed in the memory [
15]. Lines, points and zones are the most important elements that are referred to most in research as the map’s main components.
Kevin Lynch [
16] developed this approach as the city’s image and examined the city’s imagery capacity in terms of understanding and remembering structural elements (path, edge, node, landmark and district). Lynch’s research on American cities has made this method renowned and made it the basis of considerable other research [
16]. Peter Gould utilized a similar method named mental maps to assess the spatial preferences of individuals on surfaces [
17] and other researchers, such as Golledge, have referred to these maps as cognitive maps that emphasize the priority of places in people’s imagery, as well as establishing relationships between places [
18].
Norberg-Schultz [
19] identified these maps as places, paths and territories where places are points similar to Lynch’s nodes and landmarks where major events occur. Paths are permanent elements that shape the city’s overall structure and territories are similar to Lynch’s districts. Territories have elements that are defined by an “enclosed space” and play the role of paths and places. In various studies, the names of maps drawn by citizens that depict the geographical, urban, residential or even architectural spaces are in the form of cognitive maps [
20,
21] sketch maps [
22] and map drawing [
23]. All of the mentioned studies refer to the same two-dimensional maps derived from the perception of individuals of their surroundings.
1.1. Why Is It Important to Analyze the Mental Map?
The study of mental maps as a scientific method constitutes the focus of knowledge on the impact of the environment on the perceptions and minds of individuals [
24], including environmental psychology, urban planning and human geography [
25]. However, mental maps are not without issues due to their qualitative nature and the absence of a constant pattern for accurately measuring the perception of space [
26] but are still considered as a reliable and practical scientific method [
27].
The study of mental maps is not only used to address the structural and physical characteristics of space that affect perception [
28,
29] but can be deeply rooted in the spatial behaviour of the environment [
30,
31,
32] and used to obtain valuable information on the sense of people’s enjoyment of existence within the space [
33]. Through mental maps, the prediction of individuals’ decision making and spatial selection [
34,
35,
36] will be possible, in addition to evaluating individuals’ routing and navigation [
37,
38,
39].
The utility of cognitive maps and their role as a mnemonic and metaphorical device [
40]; are precisely one of the other benefits of these maps, as shapers of the world and local attitudes and perspectives [
41]. Cognitive maps are therefore a means to structure and store knowledge [
42].
Moreover, other commonly applied features of mental maps include understanding the differences in spatial perception of different age groups, from children [
43] to elderly aged [
44], as well as different genders [
45,
46].
Kitchin [
47] referred to the applied worth and practical values of mental maps in various sciences in a relevant study, including cartography and remote sensing, geographical educational issues, crime solving, concerning the planning of suitable living environments, Geographical Information Systems (GISs), search and rescue, advertising, as well as designing and understanding computer interfaces and databases.
The subjective analysis method does not impose a predetermined structure on data and therefore this, it is possible to obtain understanding in a more descriptive and detailed way compared to open-ended questionnaires or in-depth interviews. Furthermore, it is possible to extract experiences that define and shape the meaning of the place by obtaining human imagery. Thus, mental maps within scientific studies have specific functionality due to their objective representation and are effective in scientific and practical advancement due to their correct and precise analysis.
1.2. The Significant Factors for Analyzing Mental Maps
The issue of peoples’ perception of their surroundings, the manner and processes in which people make connections with their surroundings and the ways in which these connections affect people are questions raised by many researchers which are not covered in the field of urban and environmental studies. Fundamental studies related to mental maps in the field of urbanization have been developed by theorists of this technique and include the studies of Donald Appleyard’s [
48] mental role grouping and research by Walsh, Krauss and Regnier [
49] regarding the complexity and accuracy of landmarks.
In general, there are different perspectives on peoples’ perception of their surroundings. Regarding a perspective based on the theories of Lynch [
16] and Appleyard [
50], landmarks are considered as the starting point for peoples’ perception of their surroundings which is within a network of paths. In a review by Evans, Marrero and Butler [
51], it is clear that over time, peoples’ perception of landmarks do not change but their location accuracy varies. Also, in another assessment by Hart and Moor [
52], Siegel and White [
53], it was shown that gradually, people had an improved and more accurate perception of other paths and nodes. In fact, paths are recognized more clearly as linking networks for landmarks over time and reflect the perceptions of people on the shape and structure of their surroundings [
54,
55].
Overall, landmarks and paths can be considered as the main contributor to the perceptual image of the surrounding environment. Landmarks in urban spaces are a three dimensional sign that shape the inhabitant’s knowledge of the urban space [
56,
57]. Paths and their shapes, as a two dimensional structure, create a network of spatial information in the human mind regarding the surrounding environment [
20].
In a study conducted by Koseoglu and Onder [
58], an effective way to measure an individual’s perceptions of the environment is introduced through two variables examining the landmarks and the complexity of the spatial layout, which is, in fact, the complexity of the two dimensional spatial design concerning space and paths. However, the functionality of landmarks refers to the three dimensional information of a space. In this regard, as mentioned in numerous studies, the analysis of landmark locations and the main structure of cities and paths depicted by citizens is described as the most important part of mental maps analysis, according to which peoples’ perception of the environment is evaluated [
59,
60,
61].
The purpose of analysing map drawings in addition to checking the accuracy of landmark locations which is a milestone in individuals’ perception of the environment is to evaluate individuals’ perception of the structure and shape of space by comparing trajectories drawn with the actual state to provide an overview of how individuals perceive the environment [
21]. However, given that these maps are merely a simple and abstract representation of reality, the analysis and assessment of these maps is challenging [
62]. Notwithstanding, based on these two important items, that is, landmarks and paths, mental maps can be analysed more accurately.
2. Methods of Mental Map Analysis
The analysis of mental maps is done quantitatively and qualitatively or as a quantitative-qualitative combination. Qualitative methods are mostly based on the logic and conclusions of researchers and empirical knowledge, therefore, considering that the purpose of this research is based on a software and computational solution, thus quantitative methods are implemented in this research.
Computational methods were initially considered by researchers and they have always aimed to analyse mental maps quantitatively and through valuation [
63] for more precise evaluation. In this regard, one of the first attempts was studies conducted by Appleyard [
48] where the complex perception of individuals is rated based on the drawings of mental maps and has been regarded as the one of the most prominent studies on mental maps.
Another prominent method in this regard is the Bi-dimensional Regression (BDR) method which was first introduced in the geography field by Tobler [
64]. BDR is a statistical and numerical method in which the similarity between two points is examined geographically. This method may be used to assess the analysis of mental maps and to compare the points drawn by the respondents and the actual points [
65]. In another study conducted by Symington, Charlton and Brunsdon [
66], this method also applies to the analysis of paths and the structure of the perceived environment. By using the coordinates of the paths, it is possible to analyse mental maps through the depicted paths.
With the advent of computers and data analysis based on computer methods regarding the analysis of mental maps, researchers have aimed to analyse mental maps faster and more accurately through computer methods. One of the first studies in this field was conducted by Sheetz et al. [
24], which proposed that mental maps can be evaluated by Group Support System (GSS) for more rapid and accurate analysis. Furthermore, in recent years, considering the many capabilities of GIS in environmental and urban studies [
67,
68,
69] measures have been taken to analyse people’s perception towards urban environments using the tools within this program [
70,
71,
72]. In the context of analysing mental maps in a computational manner, in research conducted by Trowbridge et al. [
73], the Georeferencing ArcGIS tool was used to evaluate the accuracy of the mental maps based on the metric distances of the main map, which actually evaluated the accuracy of landmark locations by overlapping the mental map with the city’s main map.
In another method presented by Tomko and Winter [
74], five lynch elements [
16] that is, node, path, edge, landmark and district, along with the innovative element of this research; restricted district, are classified based on two characteristics: 1. Accessibility (accessible and inaccessible) and 2. Dimensionality (0D, 1D and 2D) according to
Table 1. They presented a new model on peoples’ perception of the city image based on the type of transportation used (car, train and water transport). The output of these calculations determine the relationship between the factors via graphs and show the different images of the city from the perspective of different individuals travelling with different transportation within the city, as well as the differences between these images.
In reality, what is being discussed as common methods of analysing mental maps, is the valuation and evaluation of the references of important points and places from the perspective of citizens and the comparison of depictions with the main structure and paths of the city. According to the mentioned topics, as the most important objective of AMMA software formation, it was attempted to initially analyse and assess landmarks and paths depicted by the respondents in a simple software environment that is solely for analysing and assessing mental maps to obtain precise numerical outputs and analytical maps. Also, as a secondary objective, during another stage and based on the needs of other research in assessing the mental complexity of citizens, this software has made it possible to assess mental maps based on the studies conducted in this field.
3. Aram Mental Map Analyzer
It is noteworthy that when analysing mental maps, it is vital to know what features are depicted by citizens for suitable analysis. An important note about these maps is that in addition to peoples’ perception of the environment, the power and syntax of depiction are equally as important regarding mental maps thus various maps are evident from individuals which are depicted differently. In general, most individuals typically depict the curve paths as straight [
75] or the angles are mostly drawn as rectangular [
76]. Another important point is that lack of scalability regarding mental maps, which makes distances differ from reality such that the distance between landmarks are either too great or much less [
77].
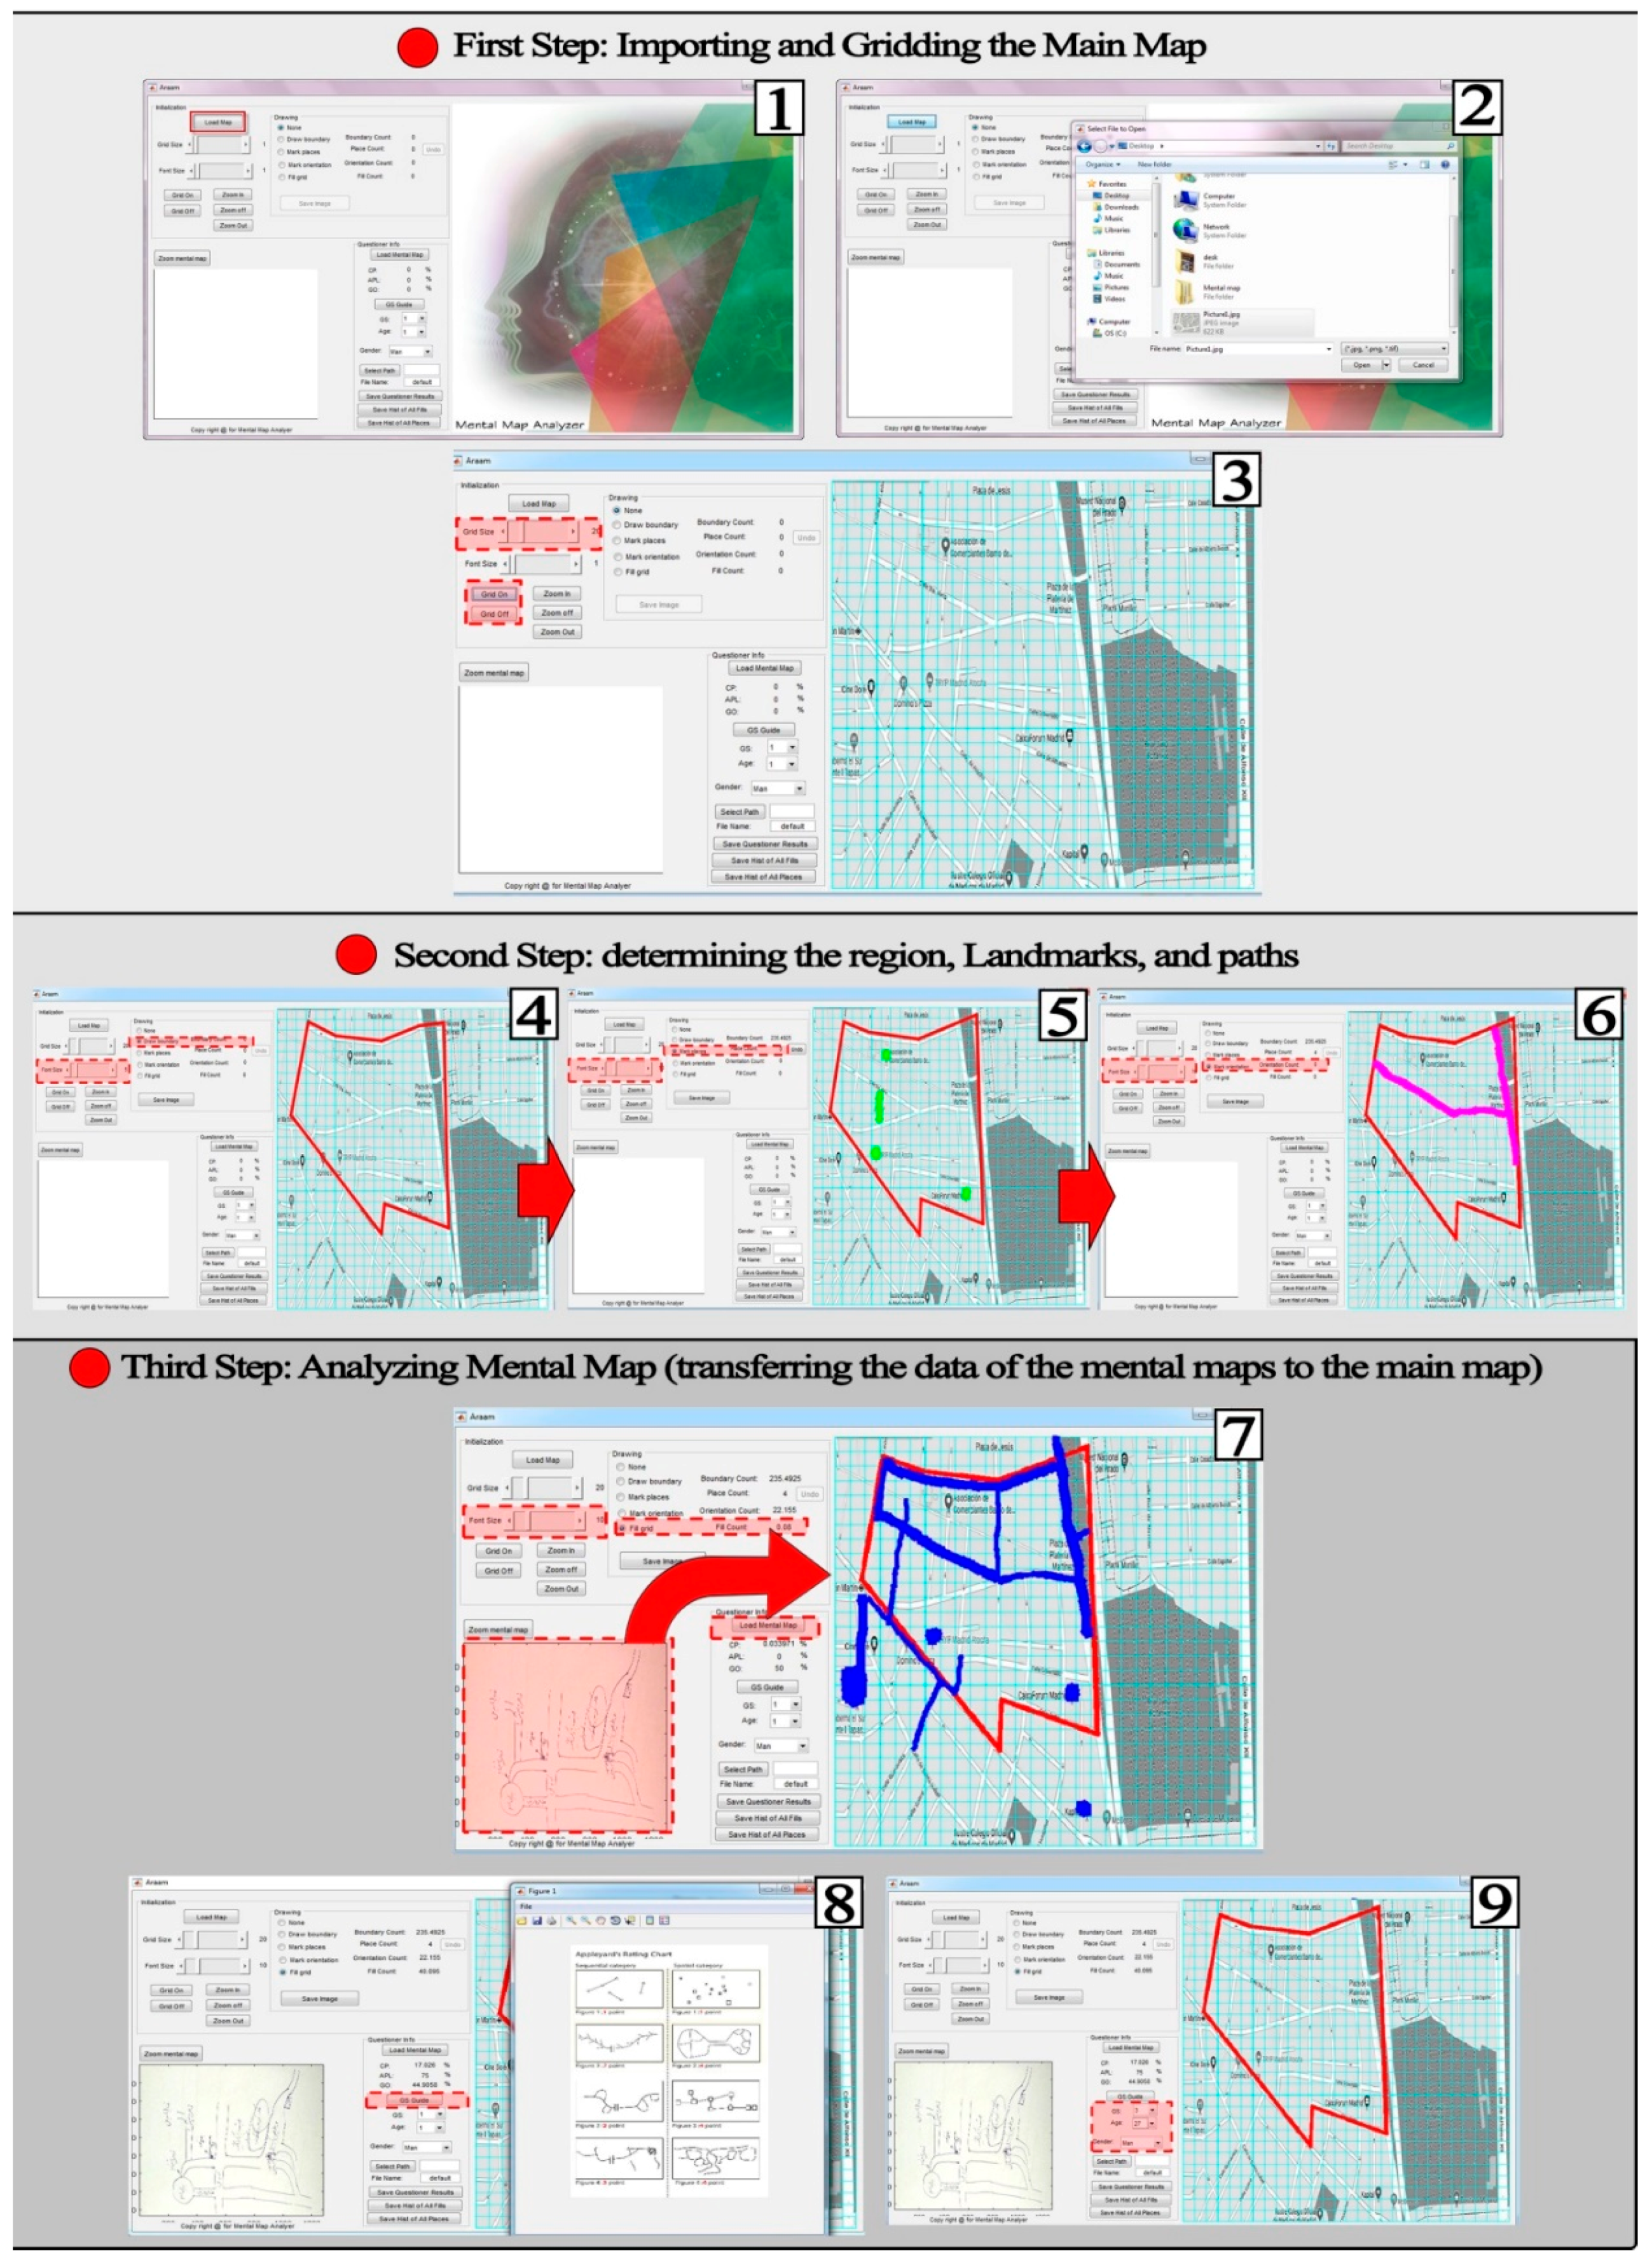
For this purpose, the AMMA mechanism is designed so that in a simple environment, the mental maps can easily be transferred to the software environment (main map) with all their drawing features using graphical tools in order to address mental map features based on the locations of landmarks and depicted paths for the accurate analysis of individuals’ perceptions towards their surroundings using common patterns derived from the mentioned maps. AMMA is programmed in MATLAB and its data processing method is based on image processing as a raster data. As seen, it is possible for the user to mark spots on the main city map using the tools provided in the software environment on the basis of depicted maps and to present results as numerical data and analytical maps. In essence, the main function of the AMMA software is the conversion of qualitative data resulting from mental maps into numerical data along with an analytical map in the form of individually or generally depicted maps. Generally, it can be said that the program has two inputs: the main map of the study area (as the basis for numerical calculations) and the mental maps (qualitative data). Firstly, by using the tools in the software the researchers implement the information (determination of the region, landmarks and paths) on the main map. Afterwards, the mental maps (qualitative data) are entered into the software and the drawings of the questioners (mental maps) are transferred to original maps using the software tools. Based upon the analyses outlined in the following sections (
Section 3.1 and
Section 3.2), they are extracted as numerical outputs. Additionally, in the form of colour spectral diagrams (based on calculations), graphical outputs are presented.
The software environment is such that the city map entered into the software as image files (JPG, TIFF or PNG) is in the form of a grid and each unit of the grid conforms to a binary code that is valuated if marked. This valuation takes place on the city map in two stages. In the first stage, the expert enters presuppositions regarding landmark points and main paths into the software (these presuppositions are based on the expert’s previous studies and research hypothesis) and stored in the software memory. In the second stage, considering the depicted mental maps, the map is marked individually where these marks are based on depictions by respondents and are compared by the expert with data from the previous stage. The output is in the form of numerical data according to the level of overlap based on the opinion of the expert. At this stage, the data of each mental map is stored in the software memory, in addition, the information is also stored in the user’s folder. All marks entered into the software based on the mental maps are stored as layers in the software memory so a general analysis is provided in addition to the singular analysis of individual maps.
At the end of the analysis process, according to the information provided by the depicted maps, two types of output are presented. 1- an excel file consisting of a table that contains all the analysis in the form of numerical data and 2- analytical maps, that, in addition to singular map analysis, provide a general analysis of all the depicted maps that show which spaces are the basis of individuals’ perceptions and also depictions which will be explained in more detail in the following sections.
3.1. AMMA Structure
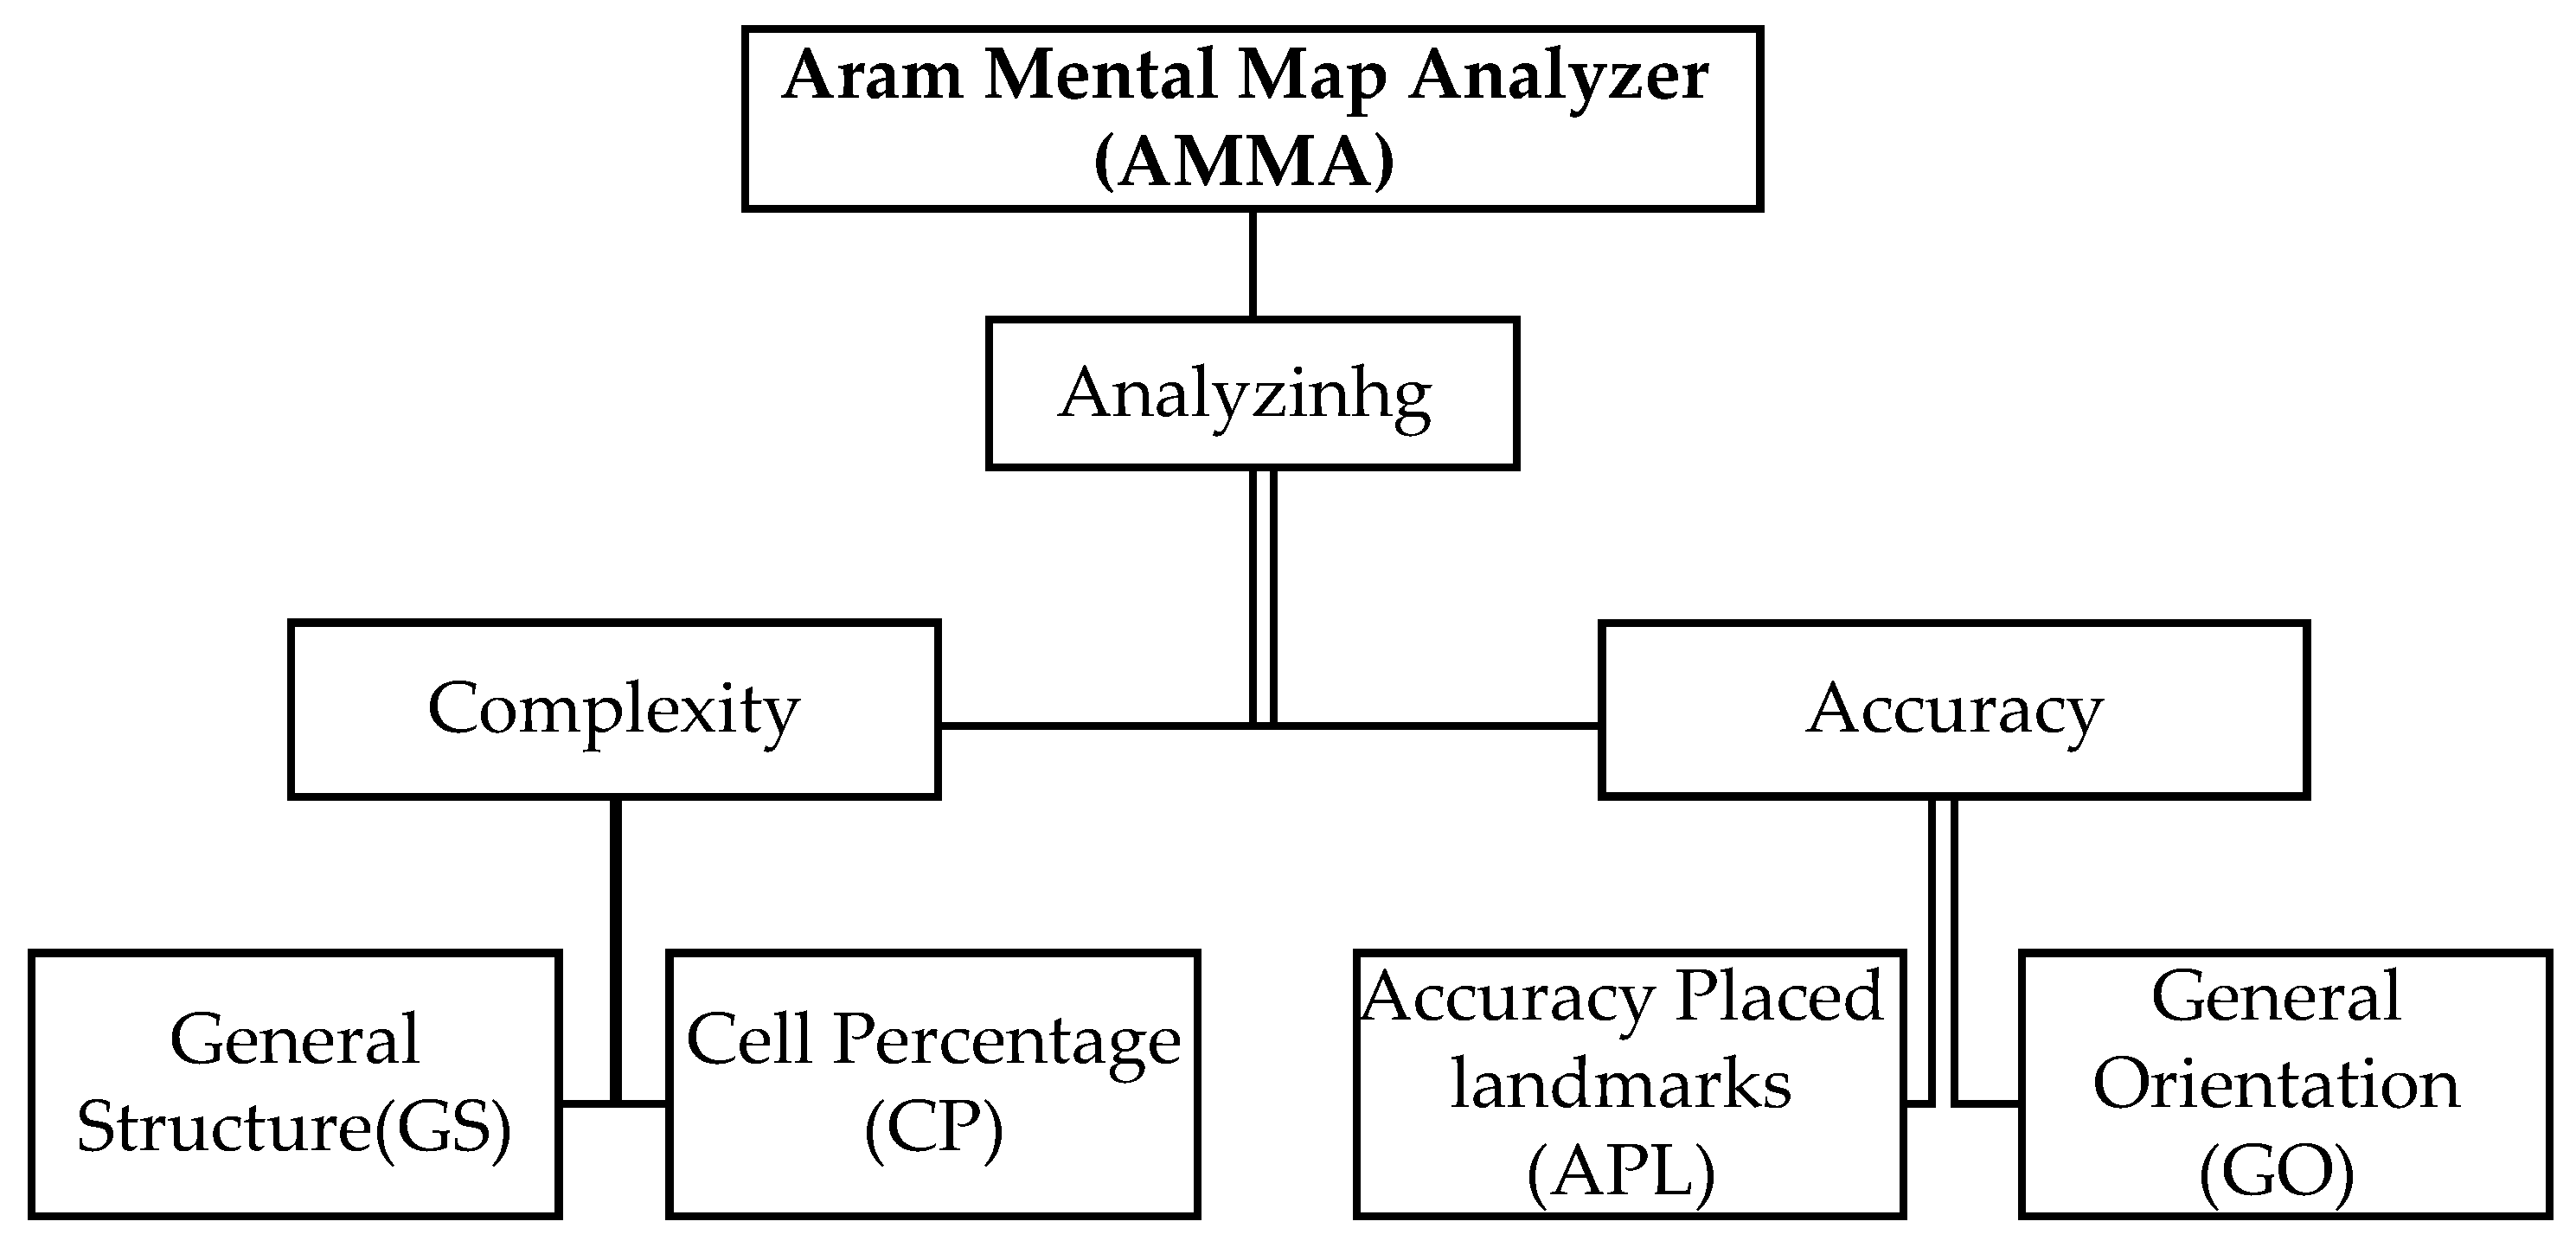
The mental image of citizens related to the environment is diverse but obtaining a common pattern is of importance in the field of mental maps research. The AMMA software is programmed on this basis to consider landmark points and paths depicted in mental maps as turning points regarding sketch maps analysis as well as examining the mental complexity of individuals. In this regard, this program is based on two main structures: 1- accuracy and 2- complexity of mental maps (
Figure 1). The analysis of the precision of mental maps actually focuses on depicted landmarks and paths by respondents and encompasses two factors that is, General Orientation (GO) and Accuracy Place Landmarks (APL). Mental maps complexity analysis also consists of two factors, that is, General Structure (GS) and Cell Percentage (CP), which assess the degree of individuals’ mental complexity based on studies by Appleyard [
48], Walsh, Krauss and Reigner [
49].
3.1.1. Accuracy
As previously noted, the landmark points and paths are considered as turning points and anchors of mental maps analysis and a correct evaluation and analysis of these two factors lead to an understanding of how people perceive space. Accordingly, this program aims to extract these two factors appropriately from the sketch maps using suitable tools and solutions. For this purpose, there are two analytical methods in this software; APL and GO.
In APL analysis, it discovers how well the inhabitants refer to the landmarks and the importance of each landmark in urban spaces. For this purpose, initially, within the software environment on the main city map, the prominent points of the area are determined according to the expert’s perspective or previous studies (urban planning, architect, psychologist, sociologist, etc.). Then, based on sketch maps, it is determined how many of these landmarks are marked by the inhabitants. Data is scored in this section in terms of percentage. Individual analysis shows the percentage of prominent points and landmarks entered into the software by the expert which the citizens have responded to. Also, general analysis in this section in the form of graphical maps determines the number of overall referrals to each of the landmarks and the significance of these landmarks.
Another important point is that the definition of landmarks in this stage is the responsibility of the expert because the landmark in this section may include the path (the way which residents move along. For example: attractive roads, sidewalks, etc.), district (the section of a city, characterized based on the special feature. For example, university campuses, historical city centres), node (remarkable points which the paths reach together. For example, crowded intersections, plazas, etc.), edge (dividing lines between two surfaces. For example, hedge, seashores, etc.) [
16] or in particular points that are required for research. For example, in research that studies the marketing impact on people’s perception, key points are supermarkets and shopping centres or in study on thermal comfort, the key points are places where people feel warm [
78,
79,
80]. Furthermore, regarding social studies on safety, places may be considered that have the most sense of safety and night lighting. In general, the landmark points are entered to the software according to the research conducted by the expert and sketch maps are analysed accordingly.
In GO analysis, the level of citizen referrals to the main paths is determined and the obtained data is calculated by comparisons with the paths determined by the expert. In this section, GO analysis shows the level of referred main paths as percentages. Here, initially, the main paths are entered into the software by the expert, which, according to the expert’s perspective, can be based on the path characteristic such as the width and length or other path features which the expert has used as a basis for research. For example, paths can be identified as main paths by the expert which have the most connectivity previously analysed in the Space Syntax software.
The prominent point regarding this software is that the expert (based on previous studies or on the basis of considered research hypothesis) can identify the locations or paths that are deemed more important by people compared to other paths and points according to the research subject this may be contrary to the expectation of the researcher. Thus, at the end of the software analysis, maps are presented as outputs where all points and paths marked by the respondents are presented as an overlay of all maps which highlight the most prominent and least important spaces in the form of a colour spectrum that may or may not have been predicted by the expert. In this regard, the researcher is able to achieve scientific results based on previous hypothesis and studies or may consider new hypothesis for their research.
3.1.2. Complexity
The complexity of mental maps is one the analysis assessed by the AMMA software. In this assessment, the level of mental complexity of individuals is investigated based on individual characteristics and to this end, two fundamental studies in this field have been utilized for analysis; CP analytical method and the GS method.
In the CP analytical method, the overall drawings (paths and landmarks) are assessed. In order to measure the amount of reflected information in each map, the number of surface units referred to by the respondents are measured. In this method, first implemented by Walsh, Krauss and Reigner [
49], initially, a chessboard type grid is placed on the main map of the research and the number of units in the whole domain is labelled S. On the other hand, according to the information given on each map, the number of referred units by the respondent is shown as S1. The ratio of S1 to S represents the percentage of information provided on the map by the respondent, which is shown by the CP index.
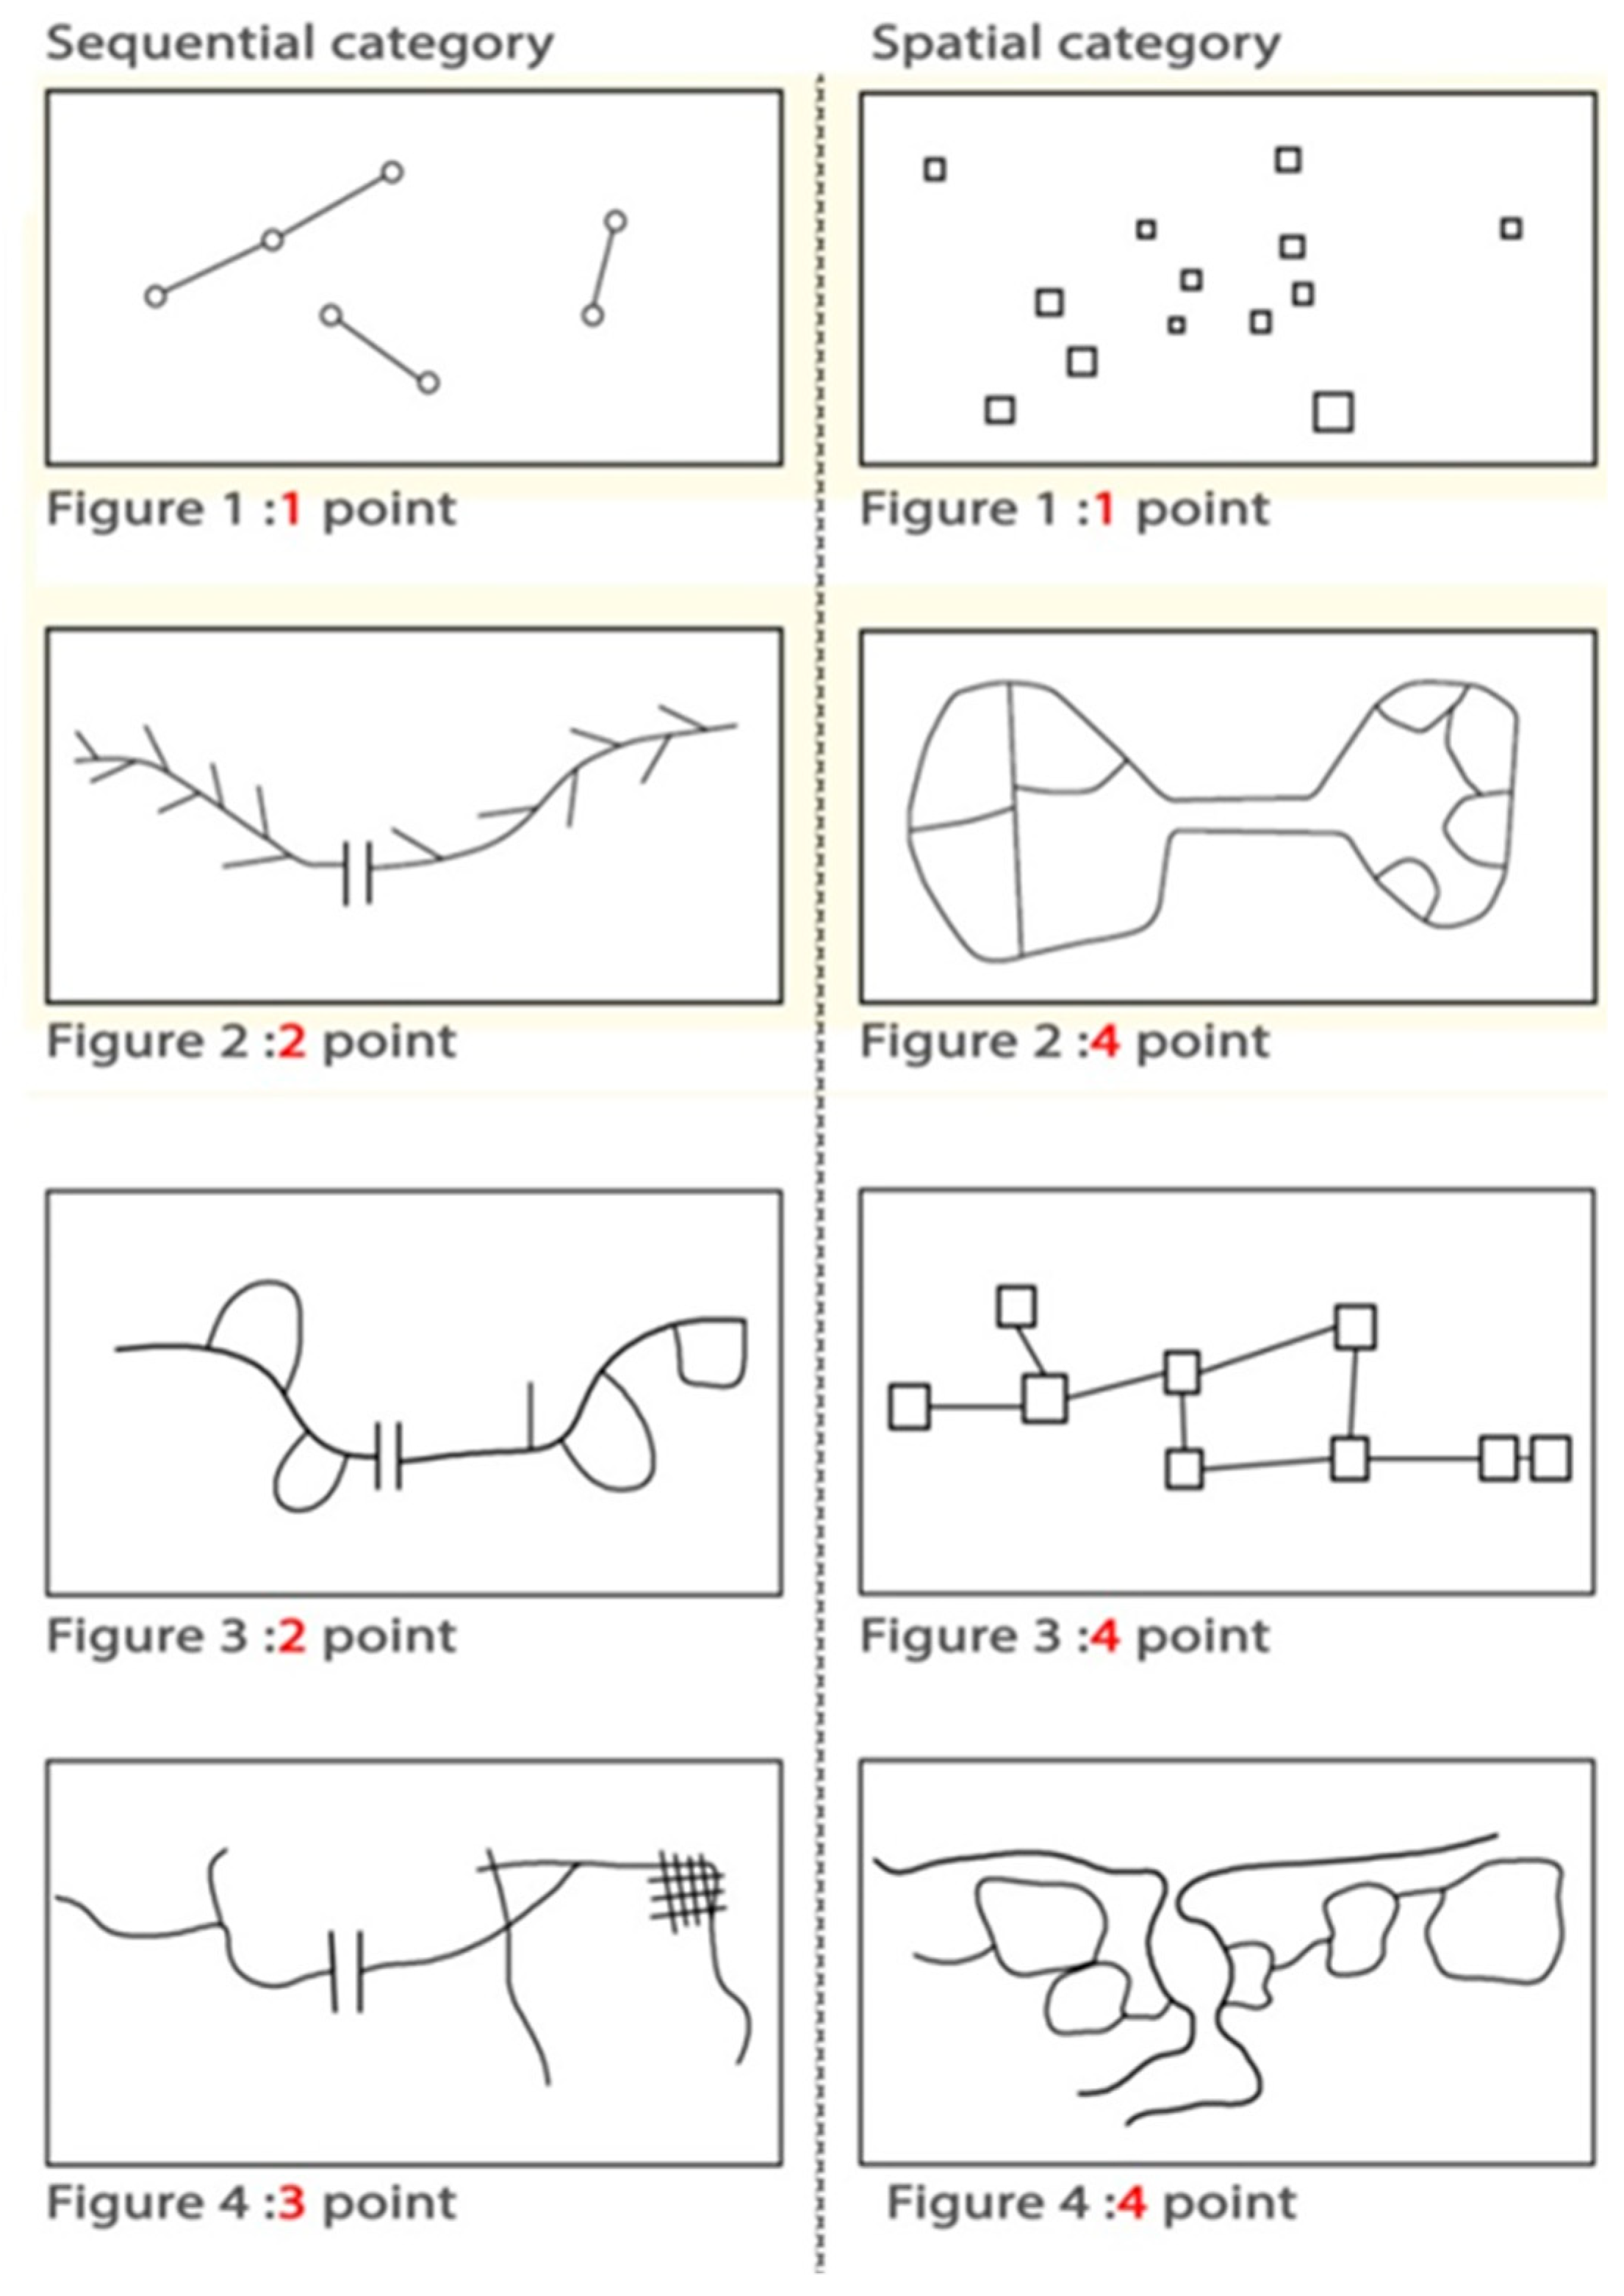
Finally, the GS components are examined. This component refers to the complexity of citizens’ perception of space. In this section, based on Appleyard’s scoreboard [
48], the expert accredits scores to mental maps based on depicted characteristics. In this table, Appleyard divides the mental complexity of individuals in two groups of spatial and linear depictions and assigns scores for each of the drawings, as follows.
In regard to Appleyard’s valuable studies on citizen’s mental maps, which is the basis of scientific studies in this field, this analysis has been proposed as a software option for researchers who tend to compare their research with Appleyard’s perspective for comparisons with Appleyard’s table according (
Figure 2) to mental maps characteristics and to enter their scores in the software’s relevant section.
In this software, only the GS index is based on Appleyard’s default studies and other software components including APL, GO and CP are entered into the software based on field studies and field observations conducted by the expert. Finally, the software computes three components based on specified points and paths by the expert. GS related data is manually entered in the application environment.
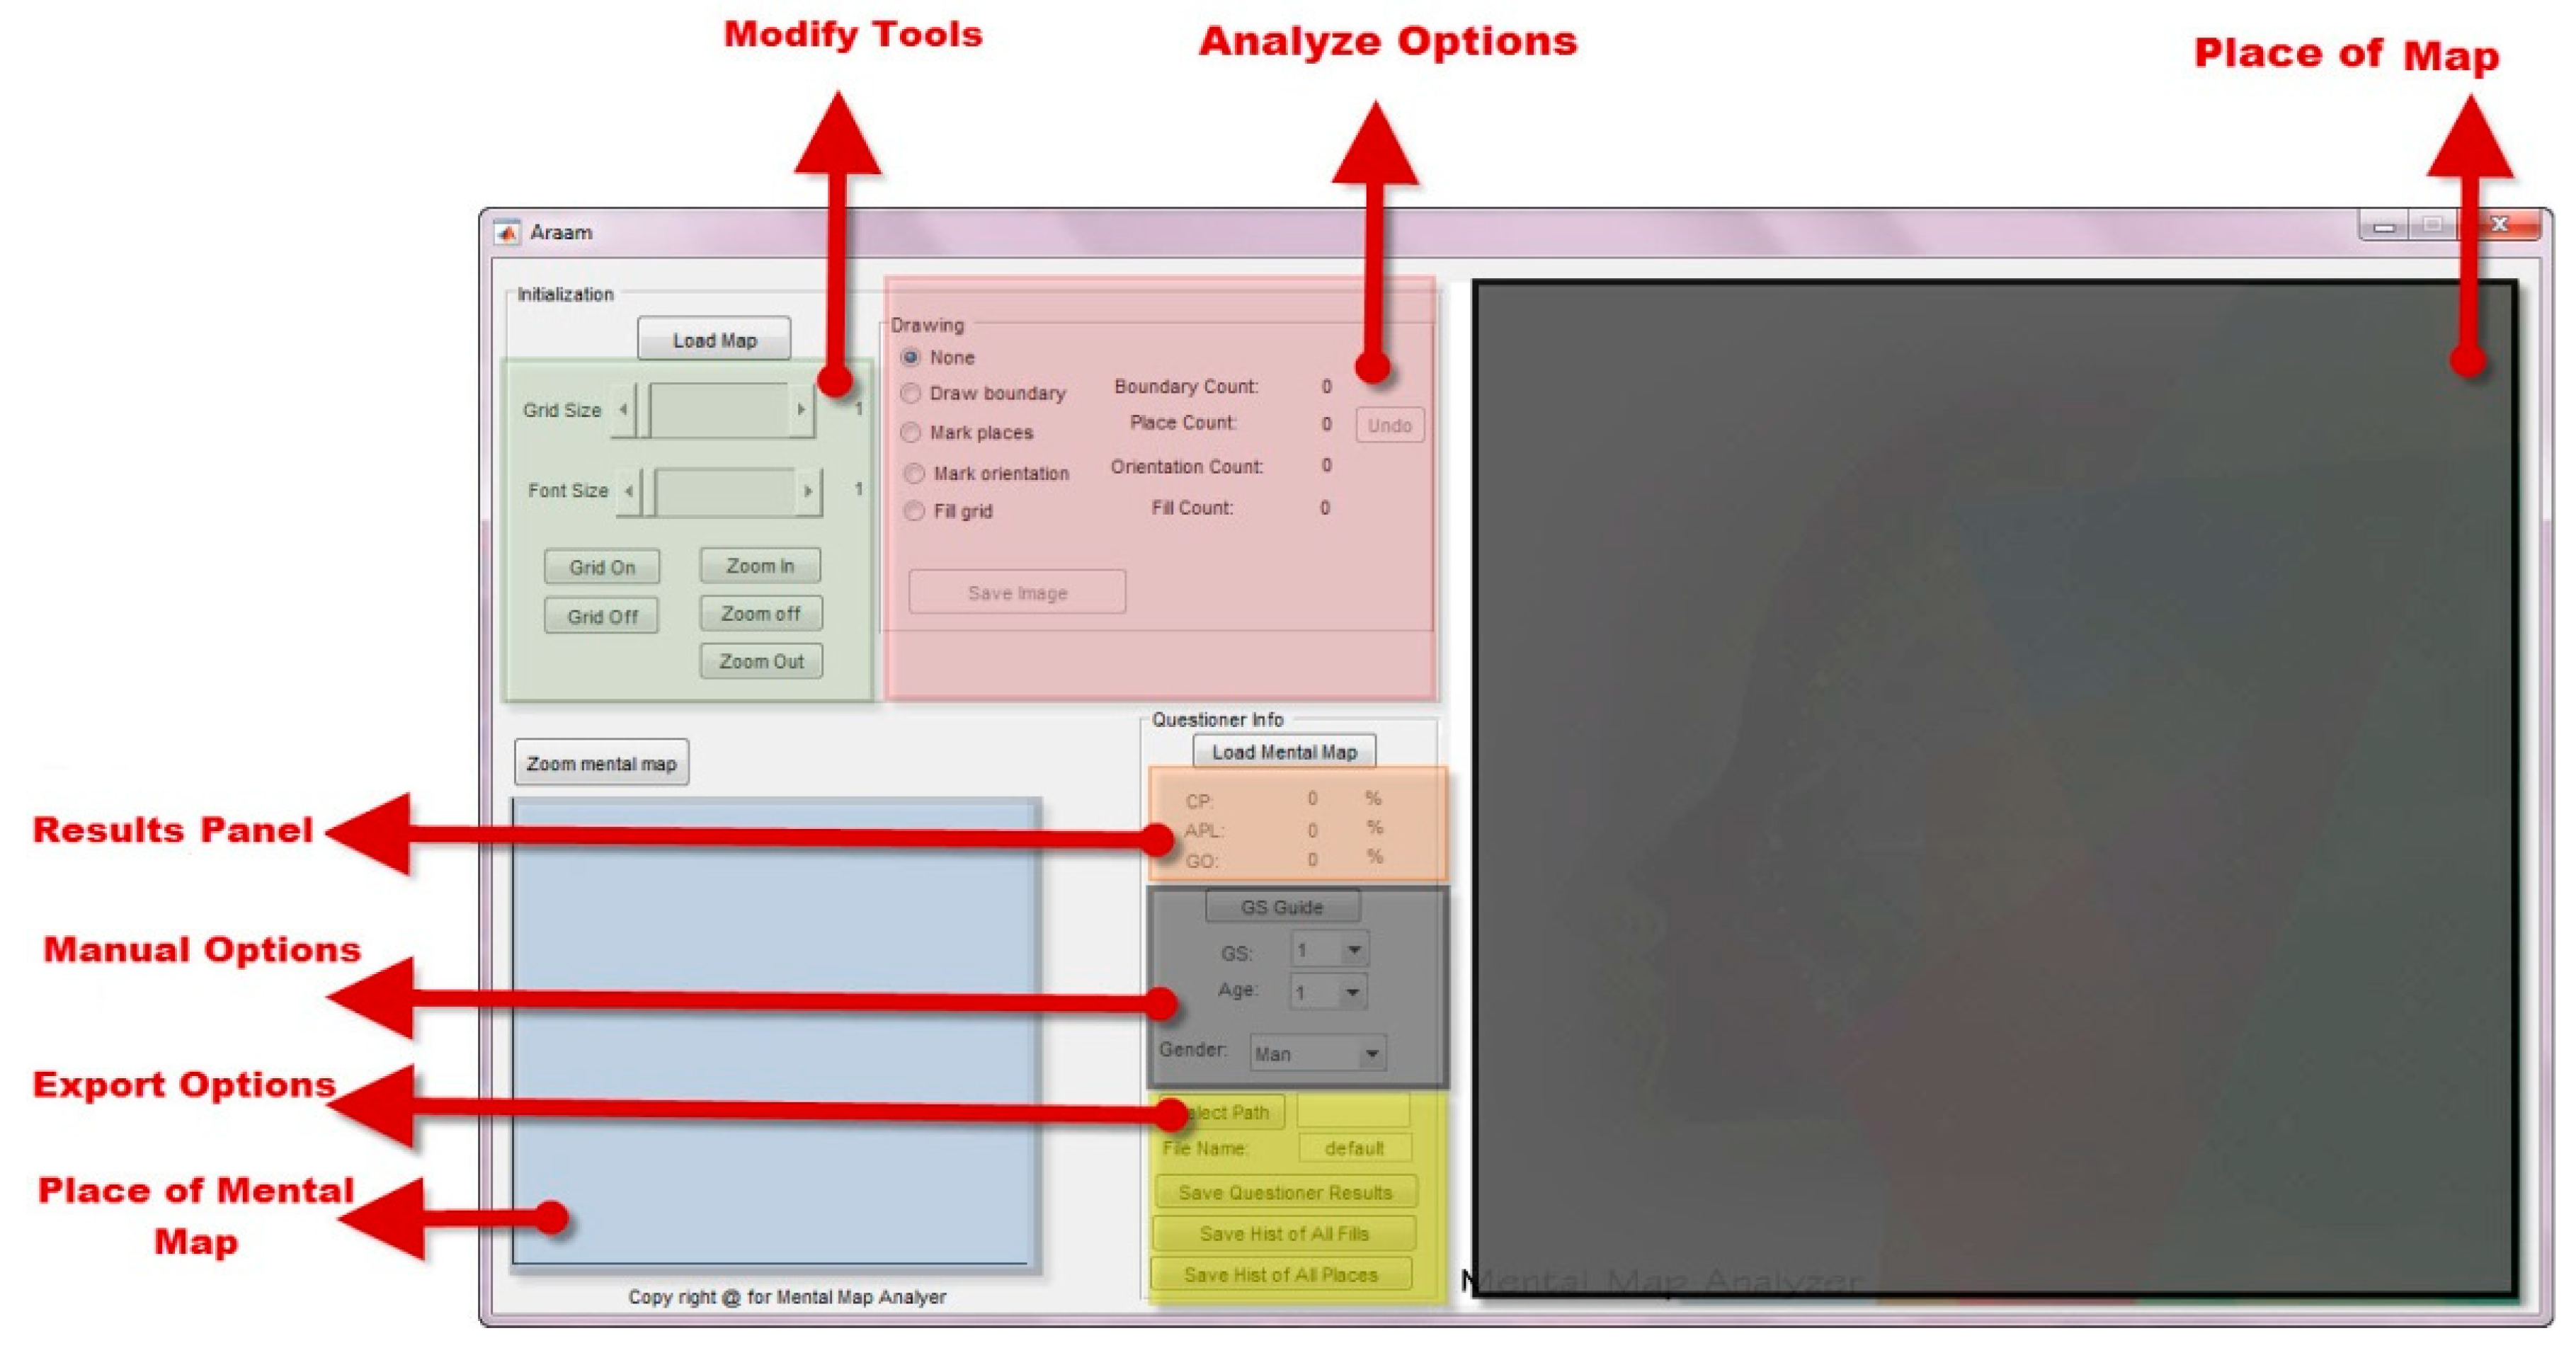
3.2. Environment and Features of AMMA
The AMMA software environment is designed to be very simple and easy to use. In general, the software environment consists of 7 sections, two of which are related to the software input that is, the main area map assessed and the mental map. In fact, the main map and mental maps as inputs should be prepared and imported during running the software. That is, firstly, the main map of the city is entered and then landmarks and paths are identified by an expert on those, afterwards the mental maps are entered respectively, based on which the main map is stacked and saved, then the next map will be inserted and so on. Other sections include Modify Tools, Analyse Option, Result Panel, Export Options, Manual Options (
Figure 3). The entry of maps and input data consists of 8 stages, the process of which is described in
Figure 4.
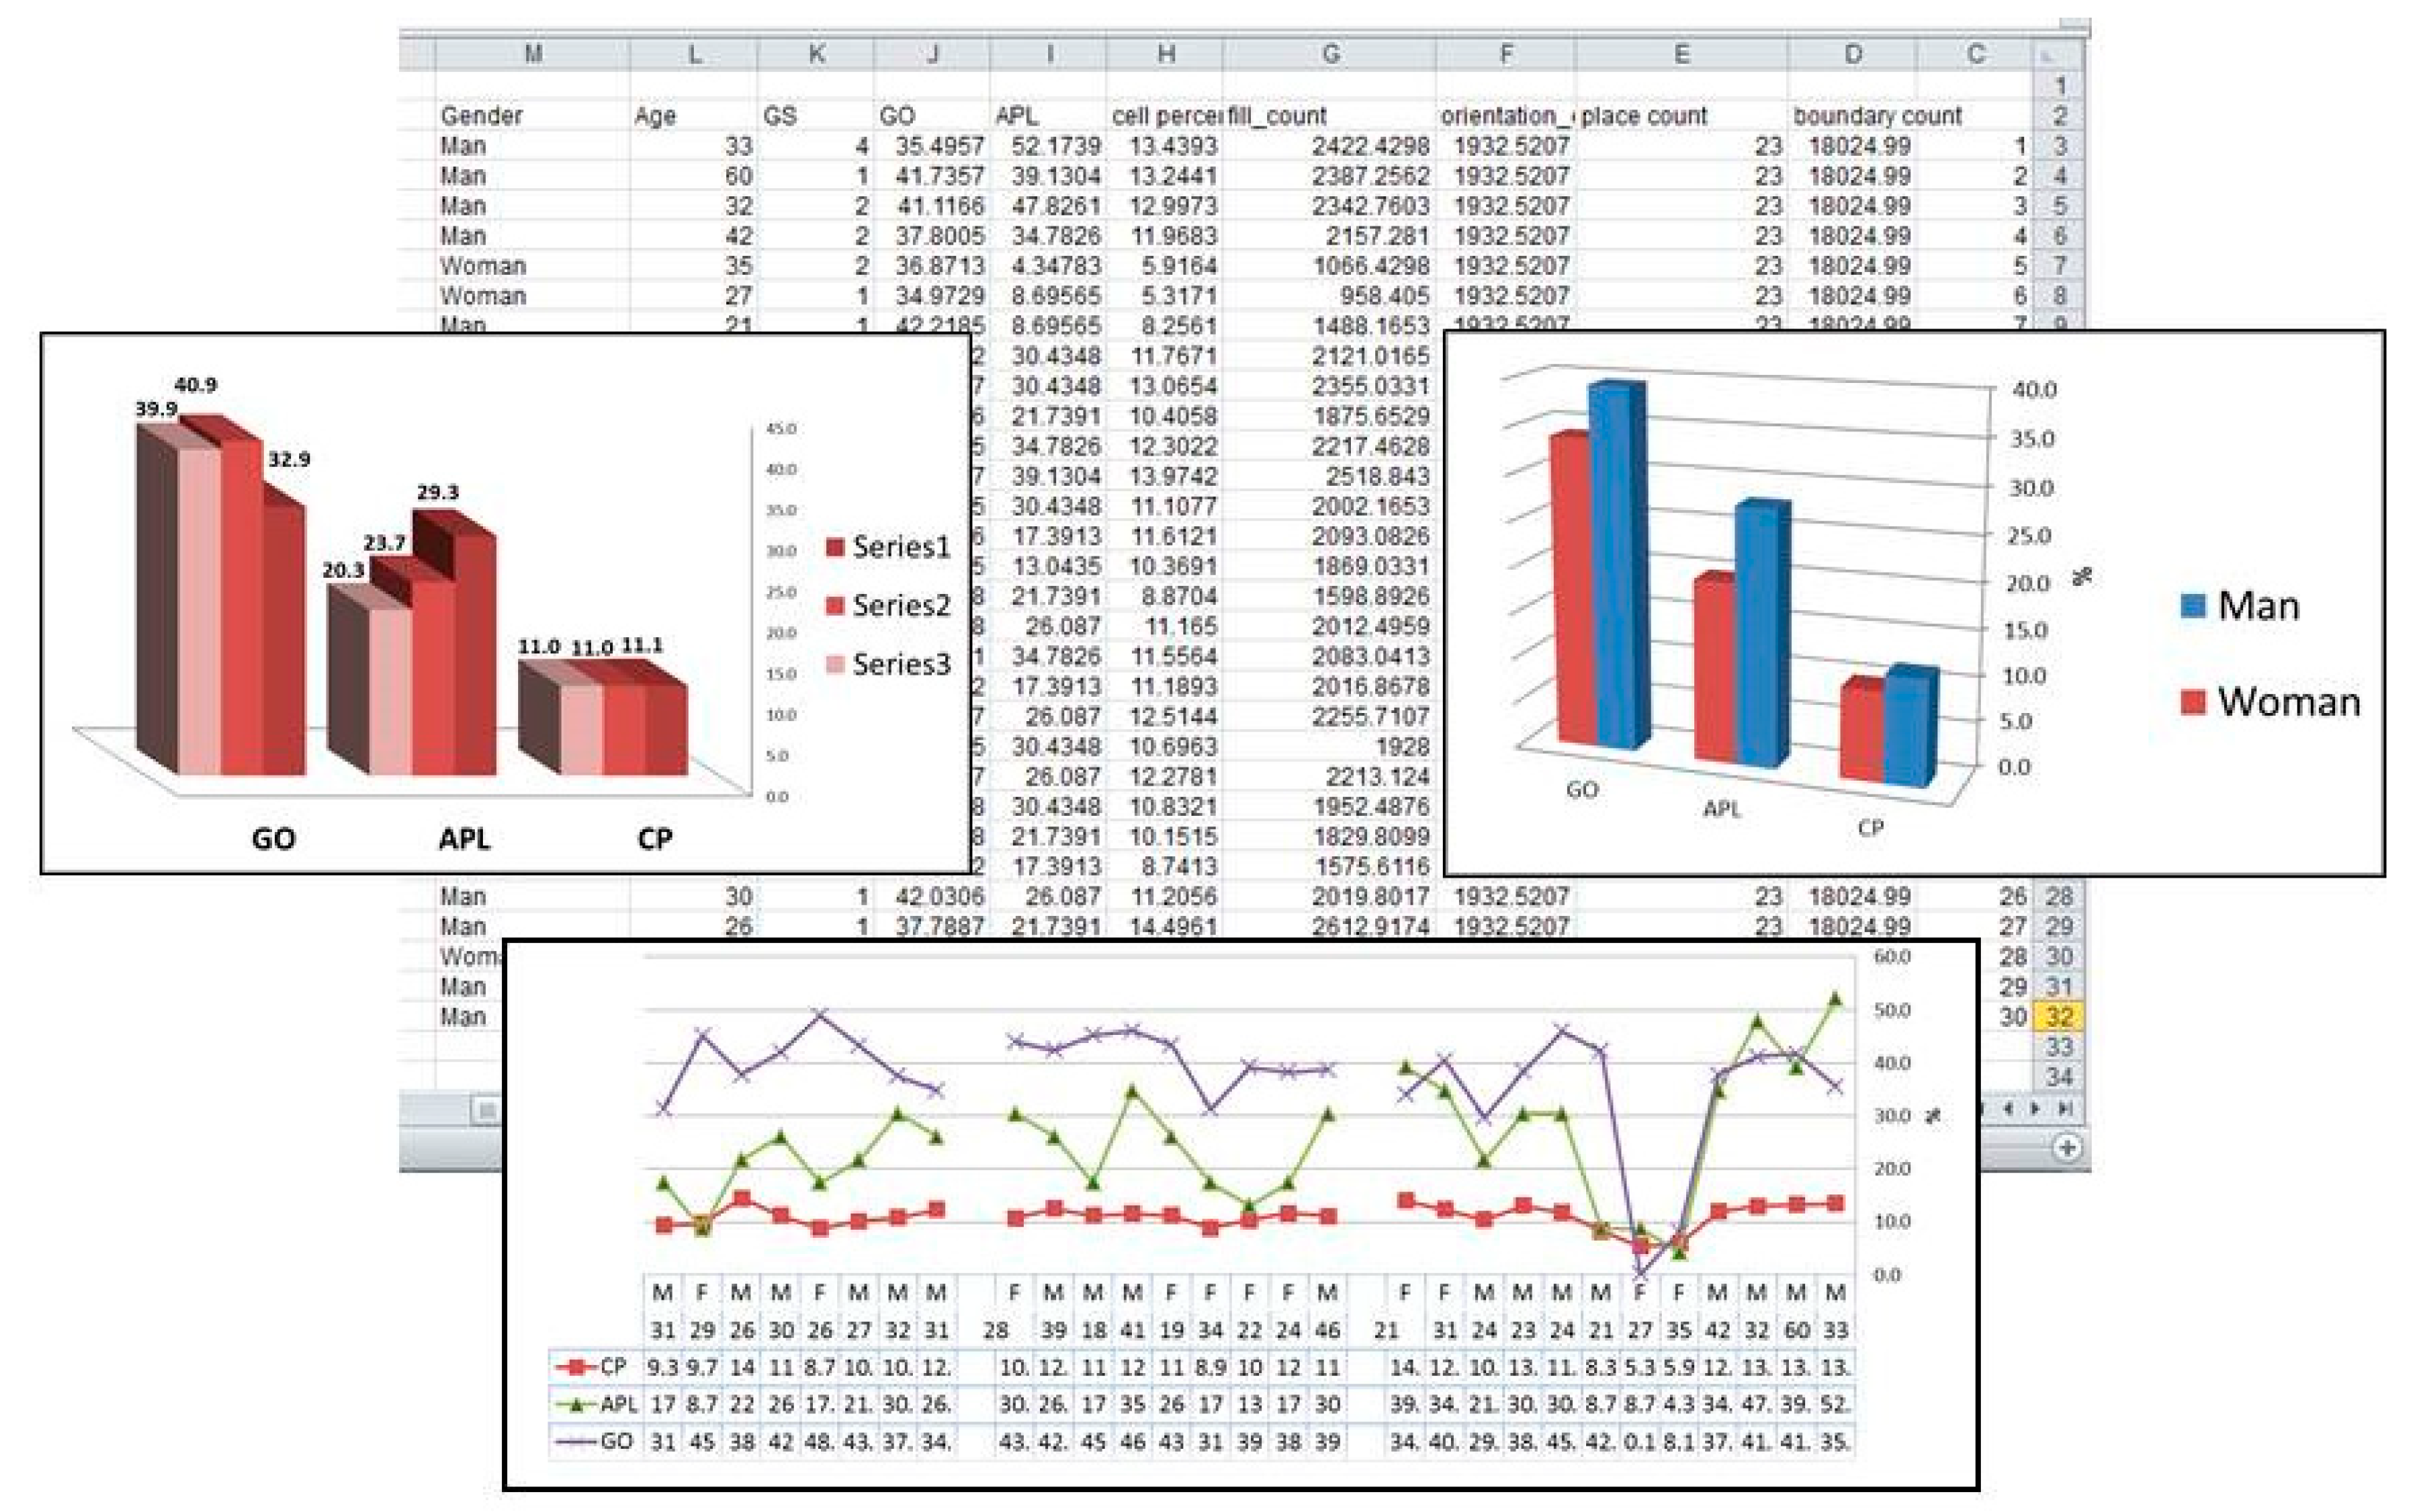
The output of AMMA is twofold. Output is in the form of numerical data and analytical maps. In numerical output, which is an Excel file, all the data for mental maps analysis are numerical and categorized by the researcher and through the use of this data, a variety of maps and graphs are produced based on the research subject (
Figure 5).
Software analytical maps also consist of three sections:
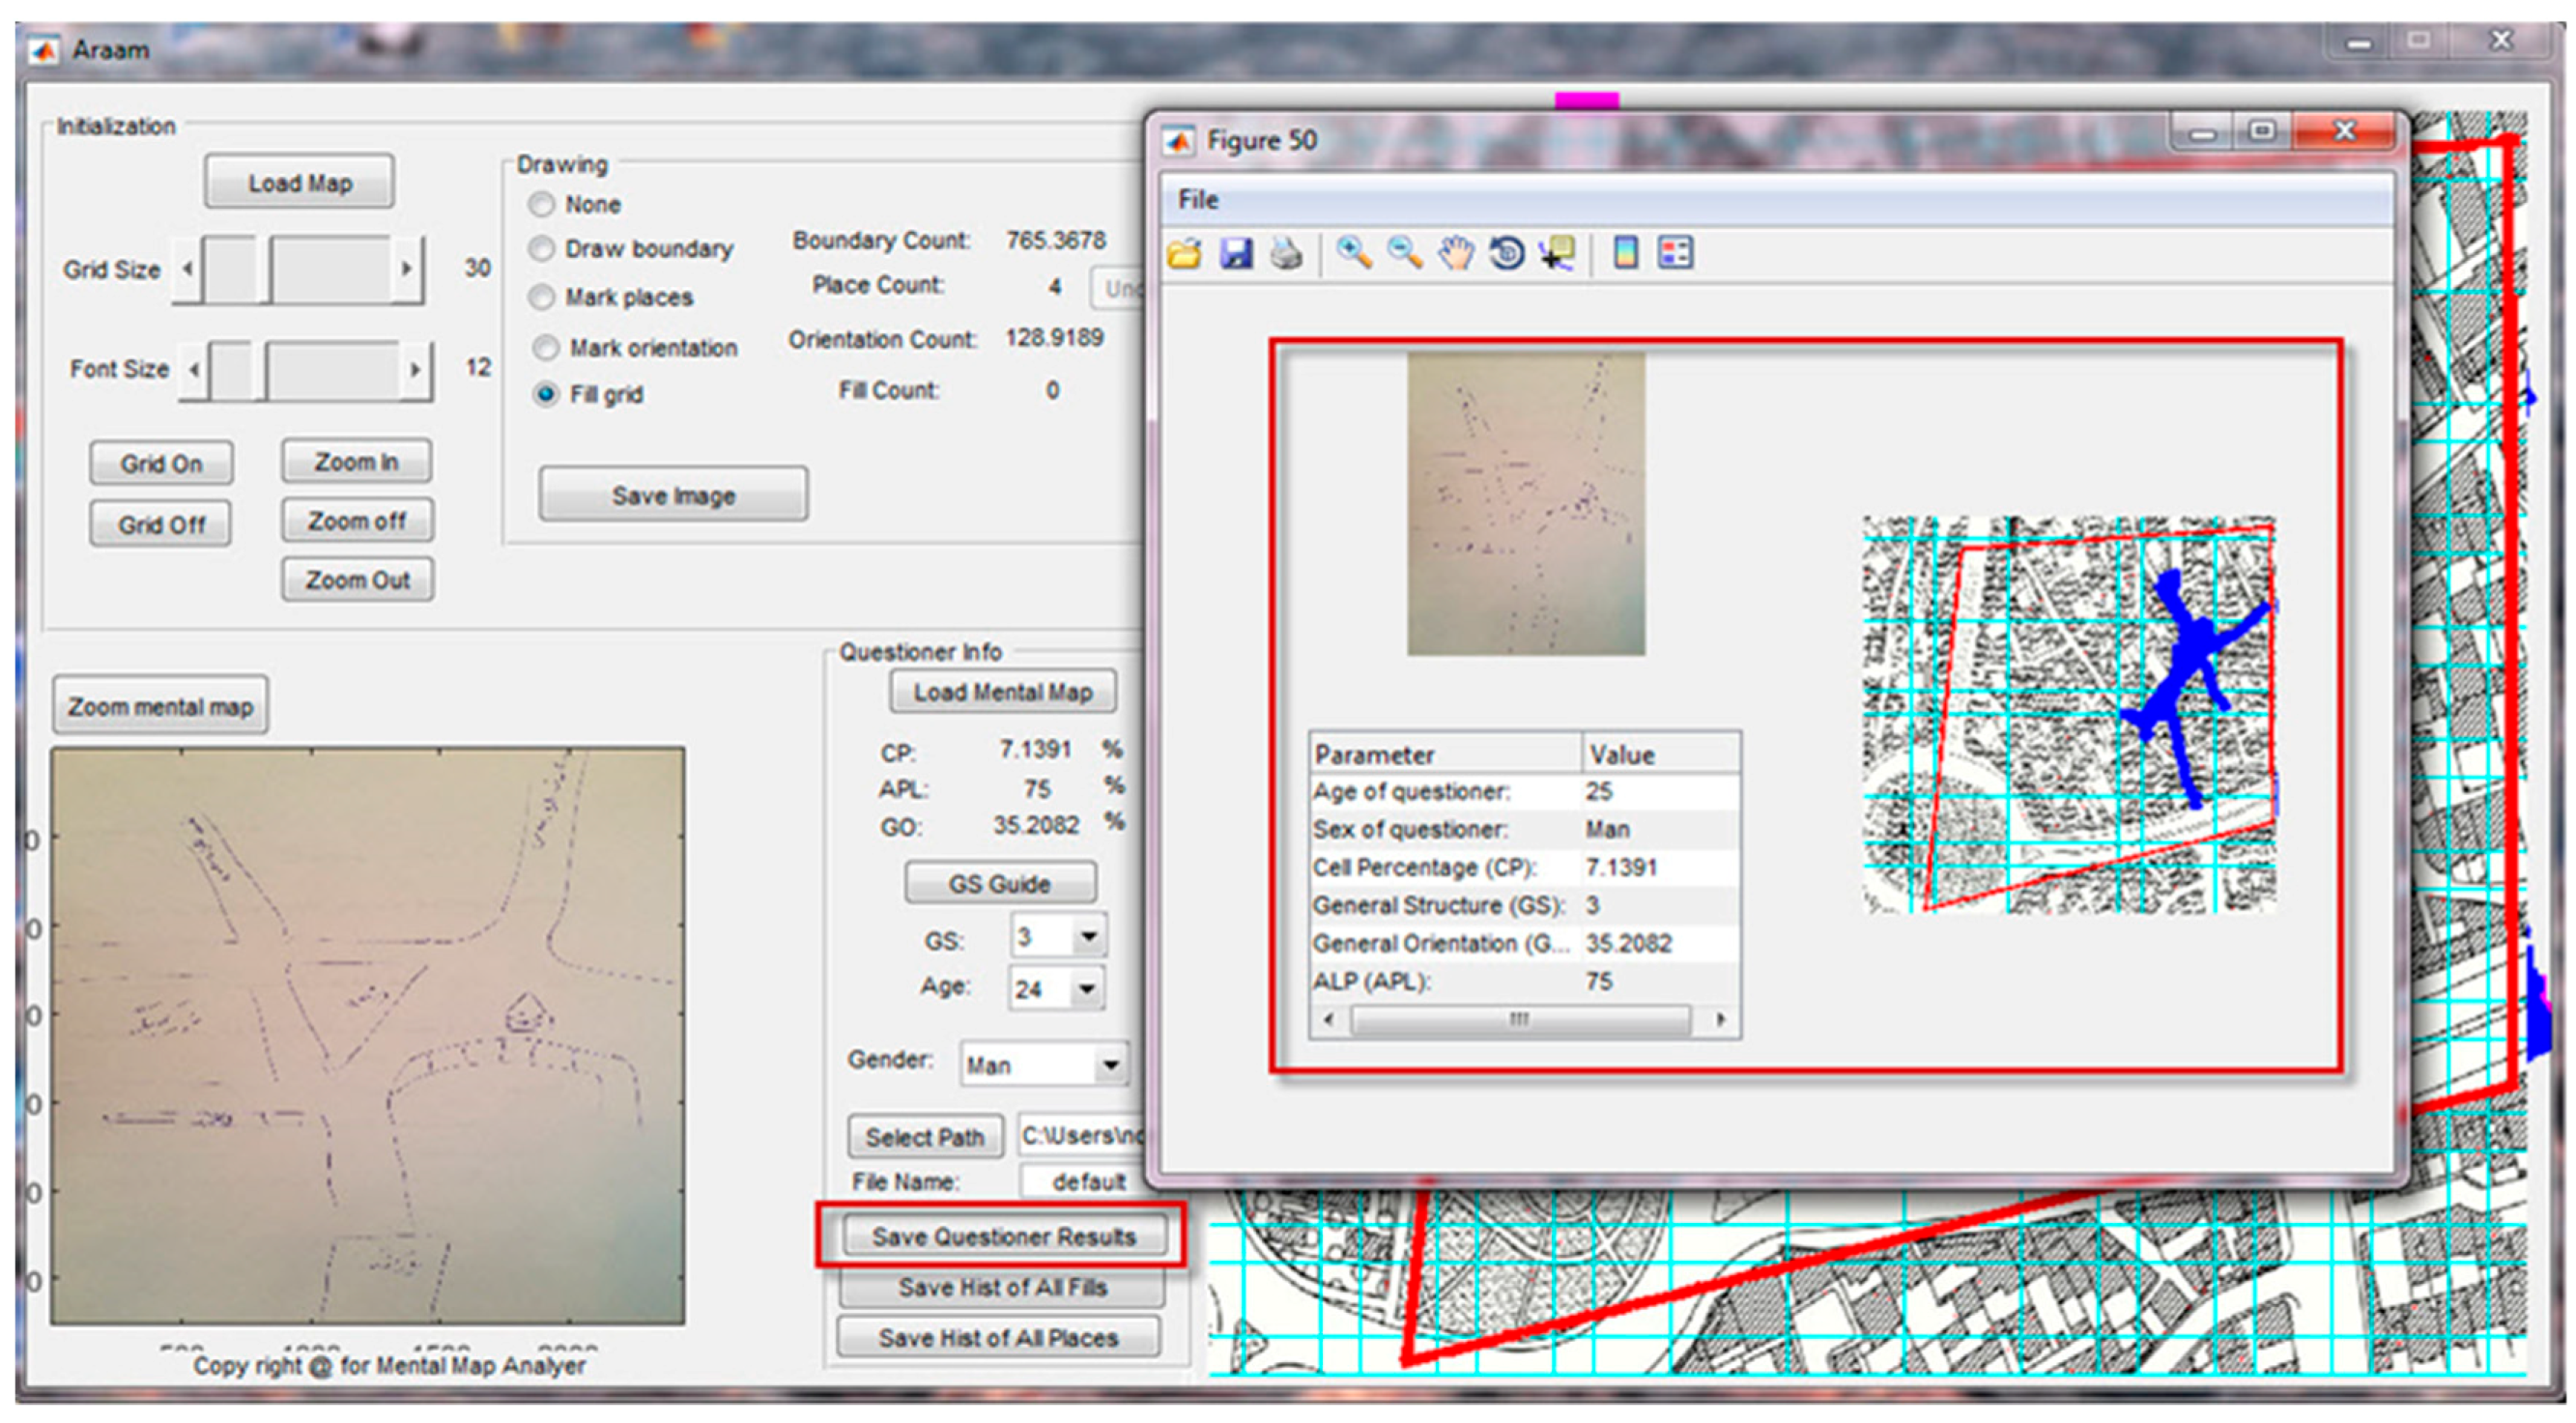
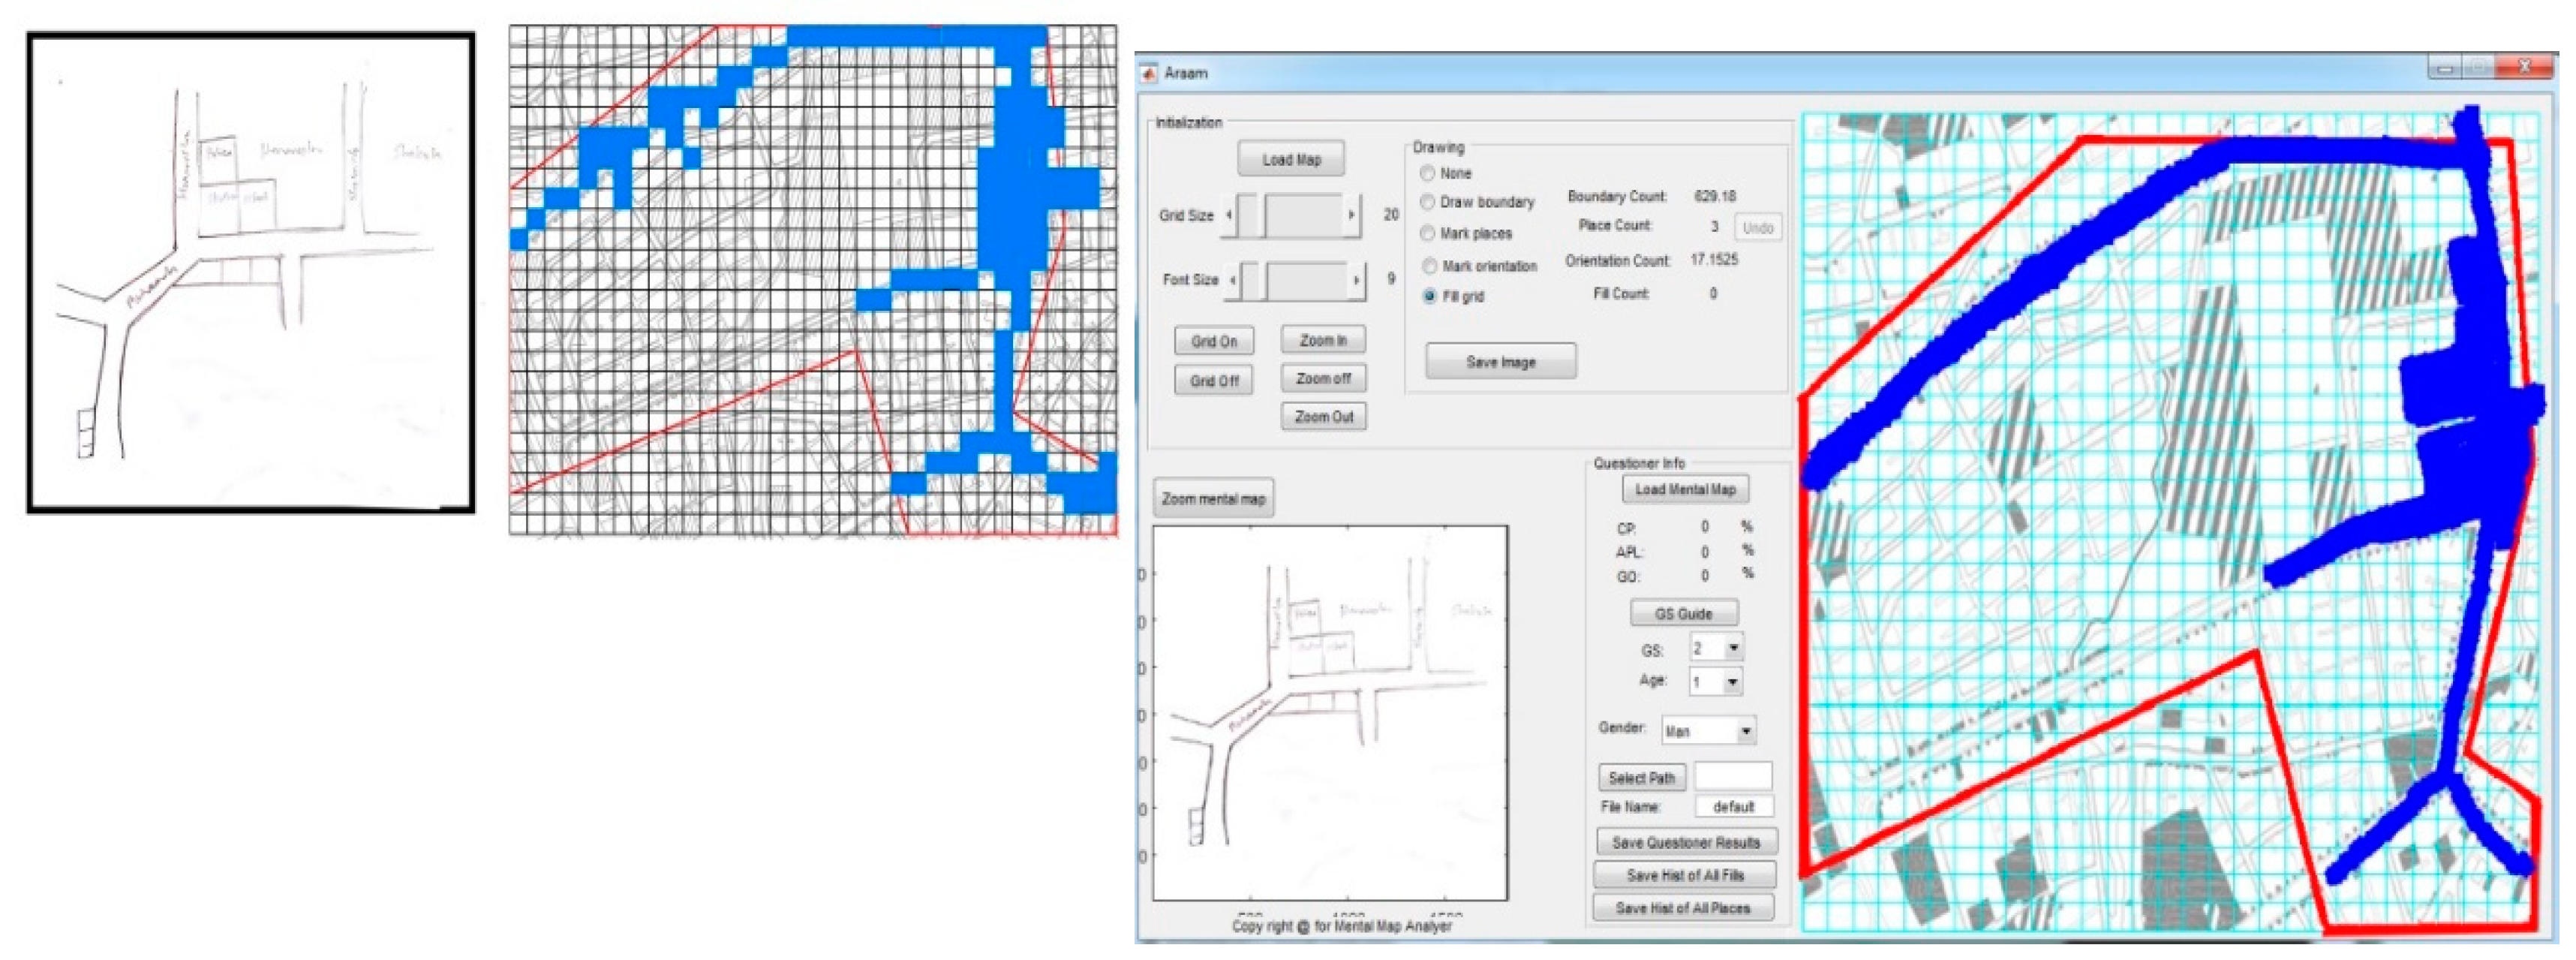
1- Analytical maps are specific to each mental map, including mental map image, places referred to according to the main mental map image and finally a table containing numerical data and general characteristics of the individual interviewed. These maps are commonly used for individual analysis and comparison of mental maps (
Figure 6).
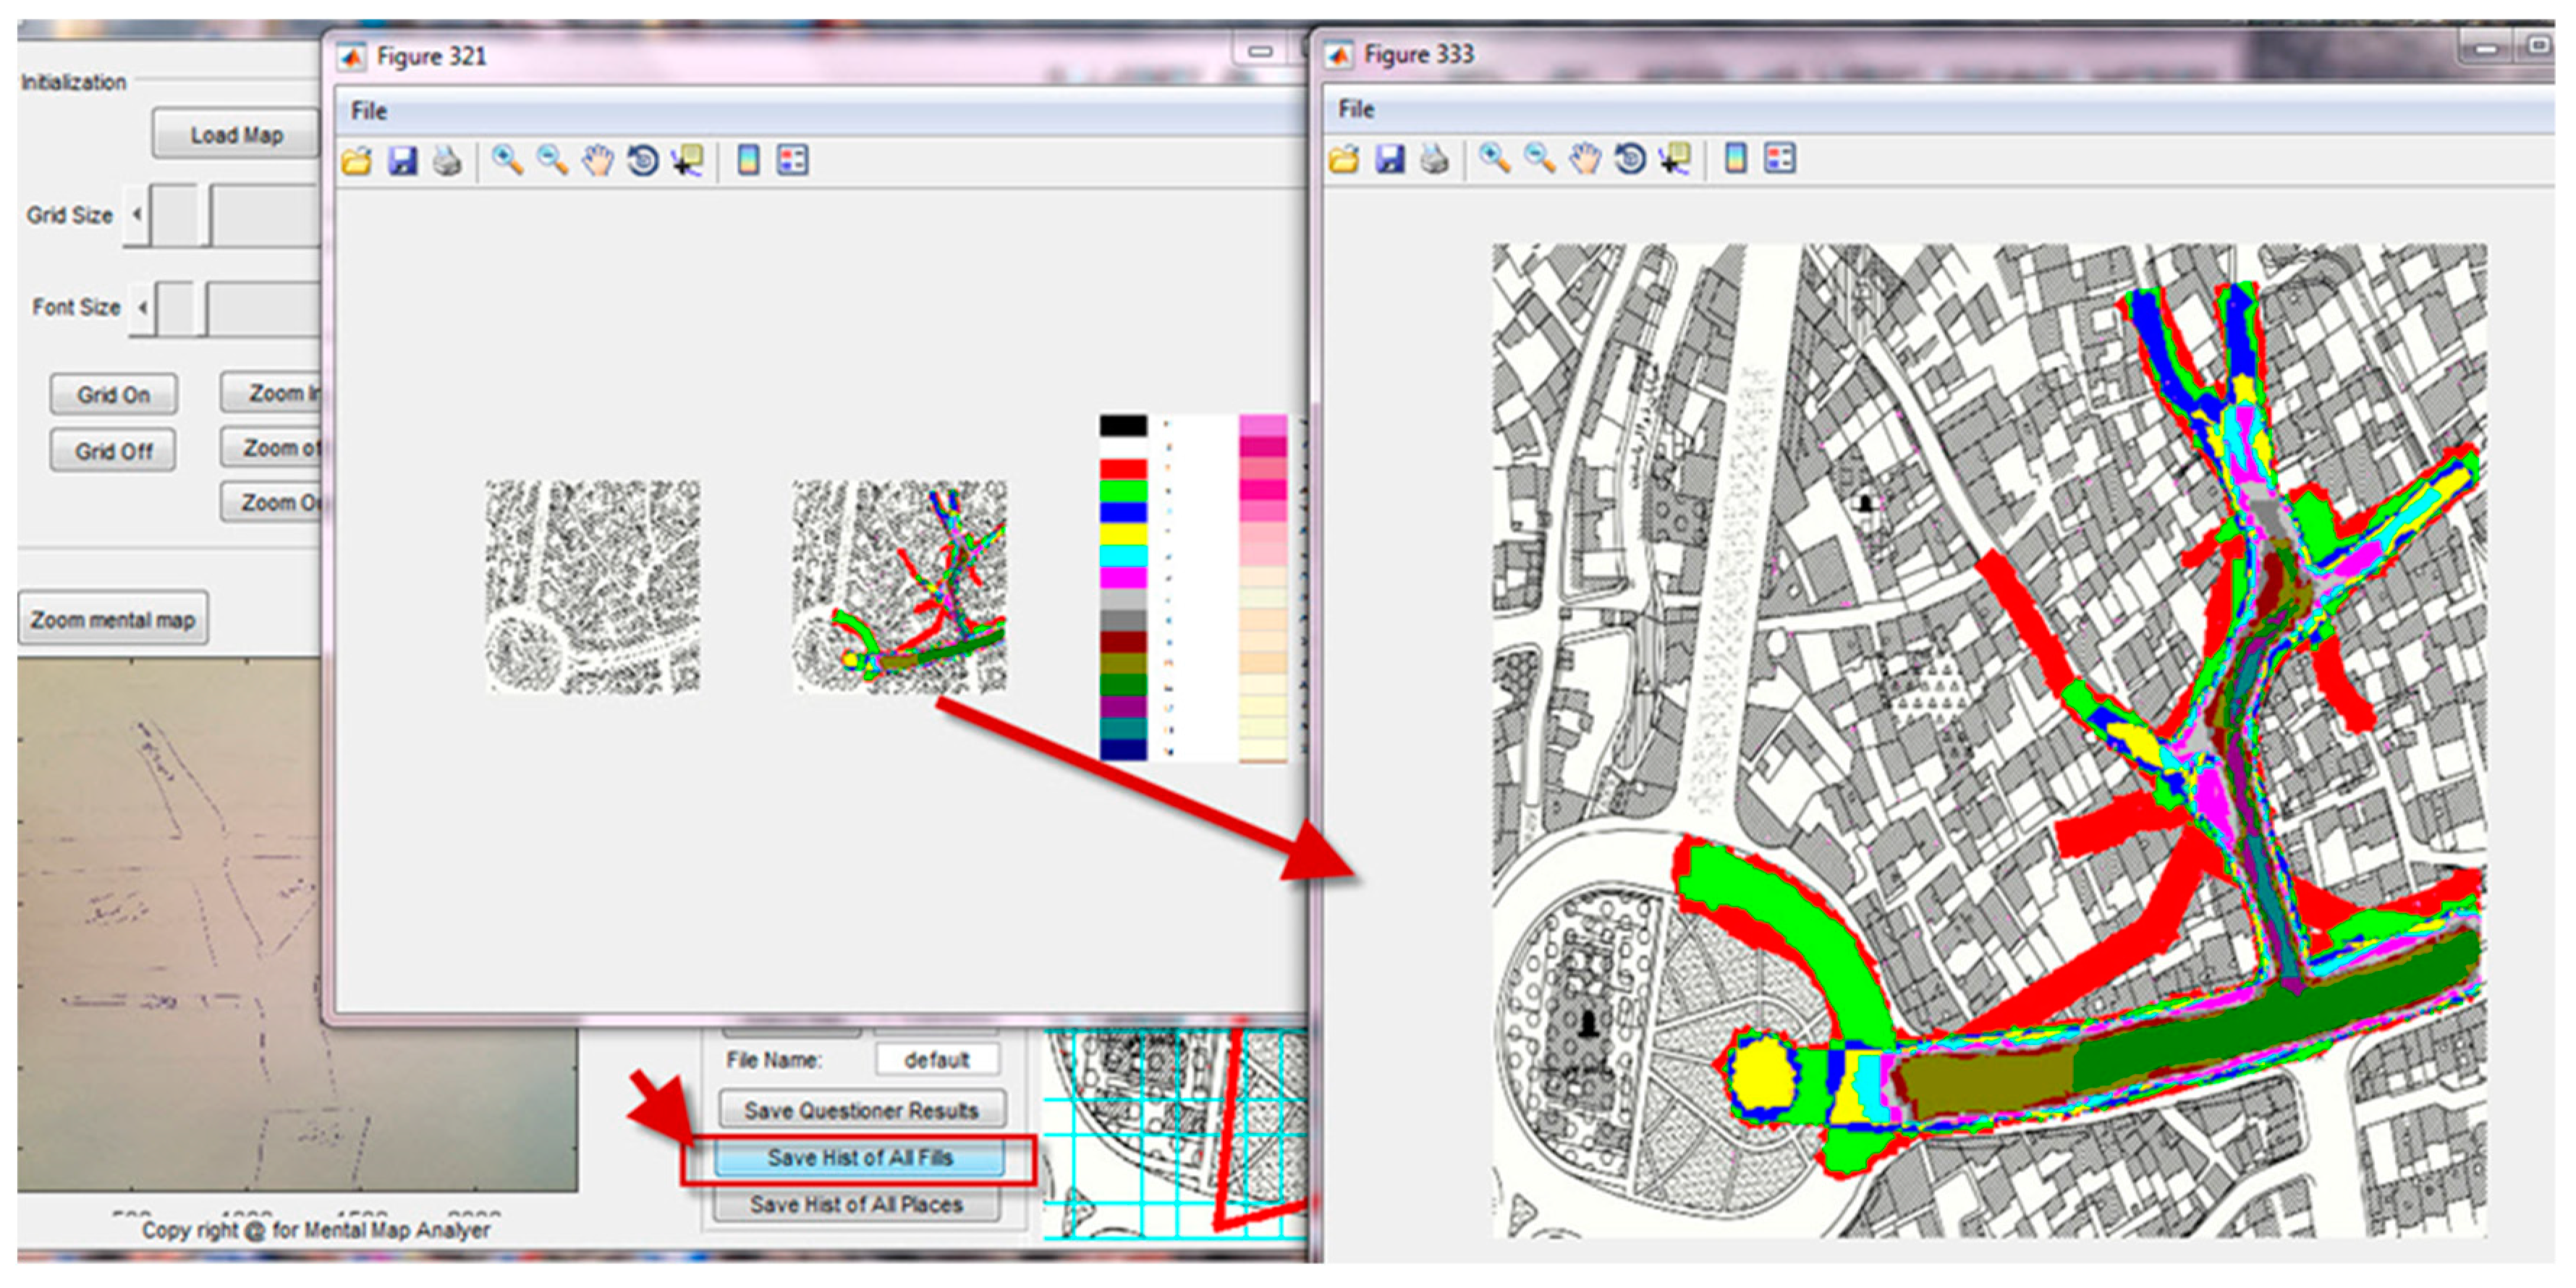
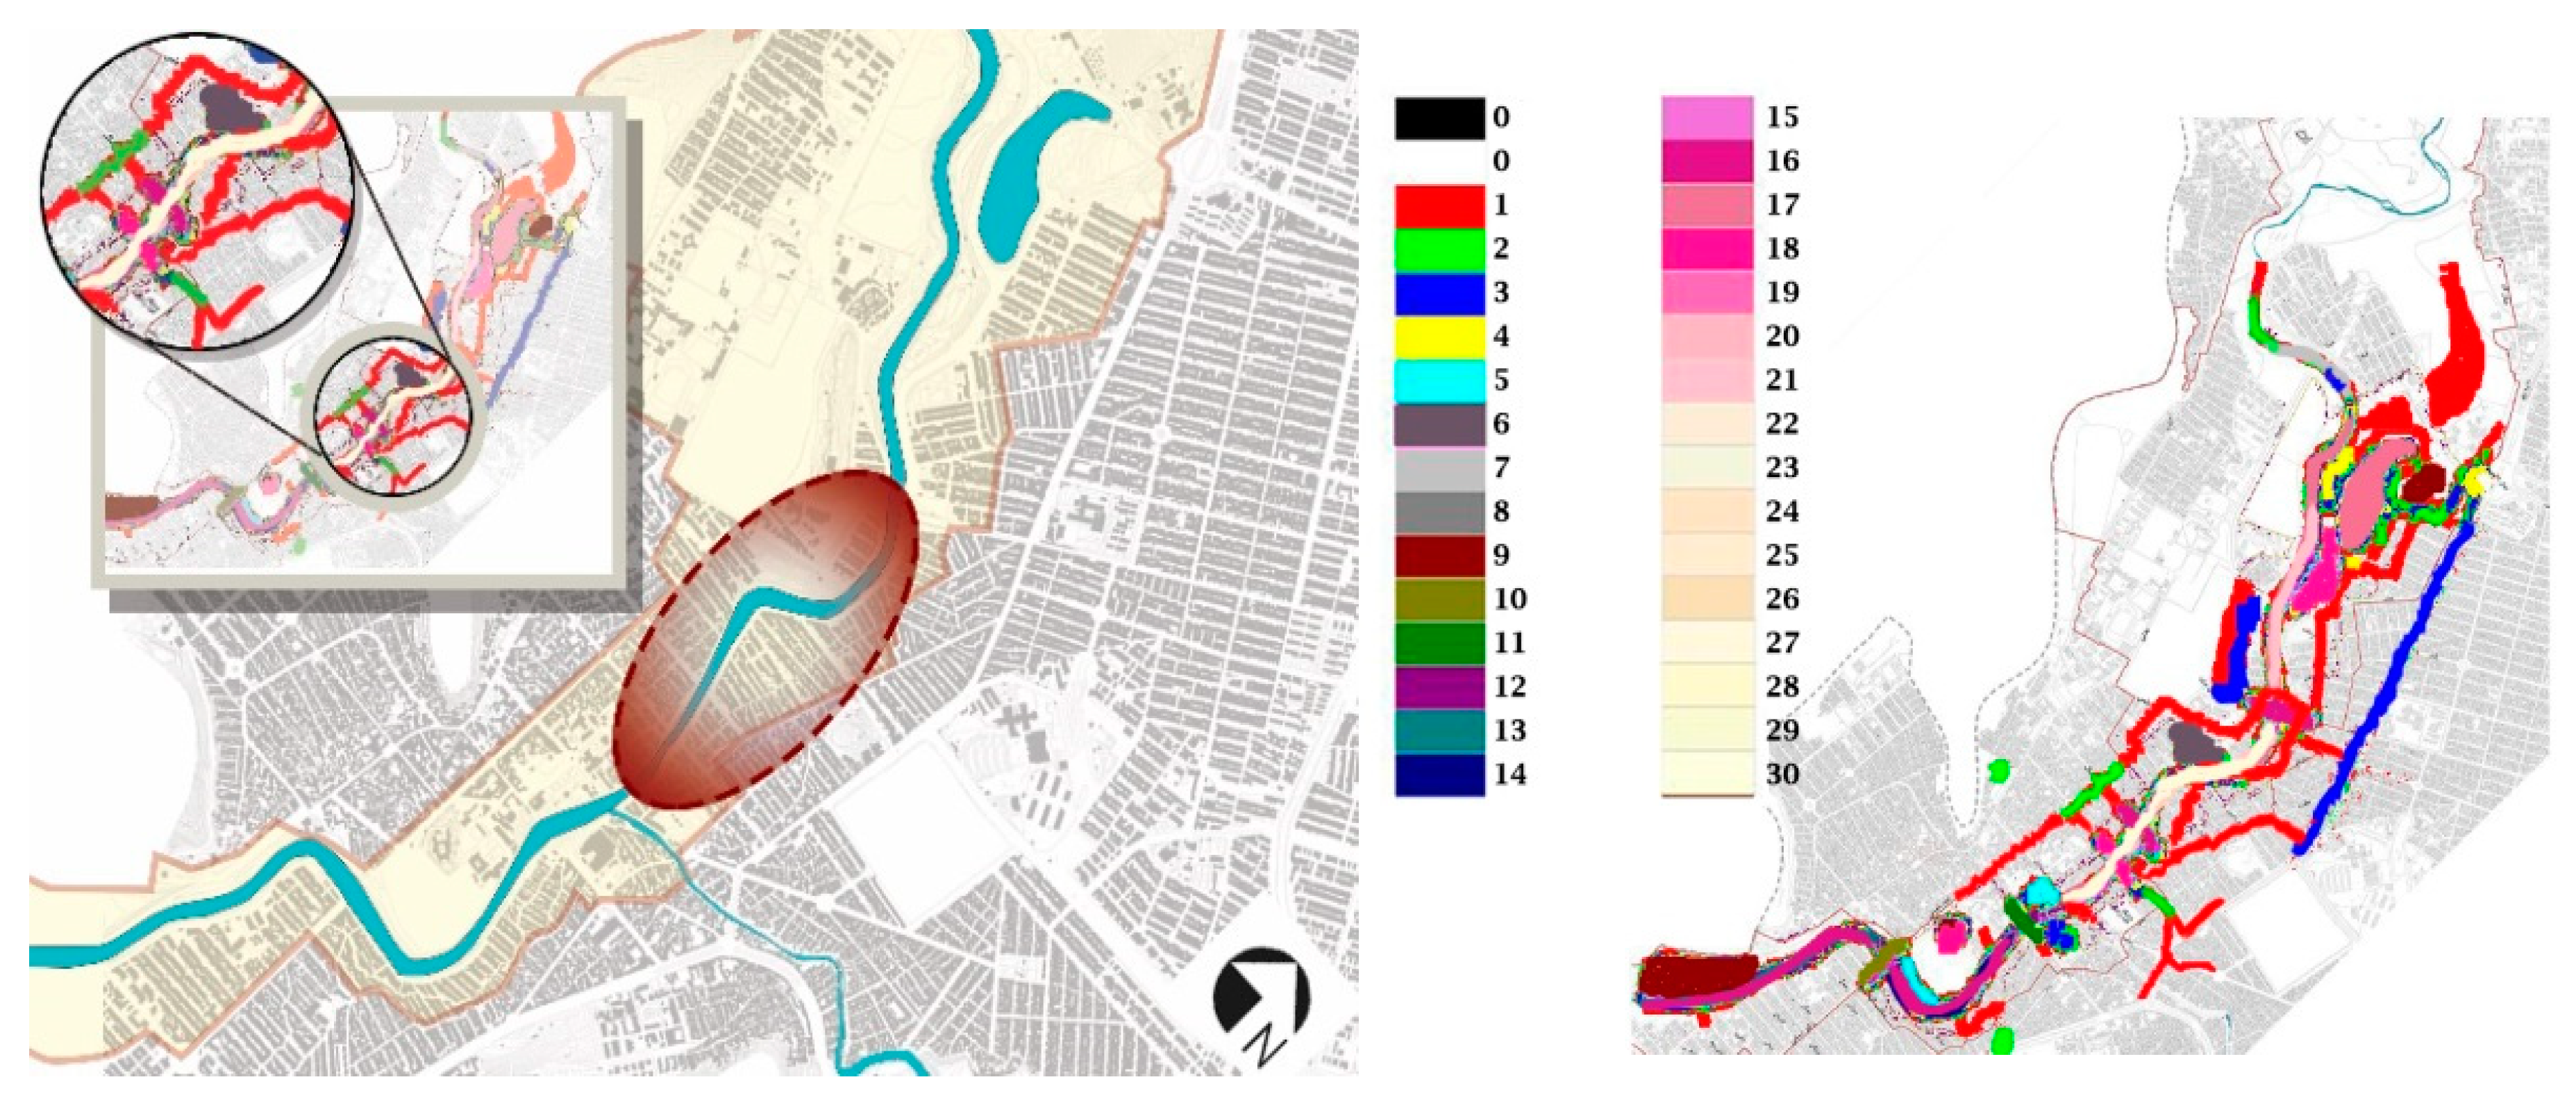
2- HIST of all analytical maps. In this map, all mental maps are placed on top of one another in the form of various layers and locations that overlap each other and are displayed as a colour spectrum based on the number of overlaps. By using this, it is determined which places are most referenced by citizens and the number of references is also indicated according to the map key (
Figure 7).
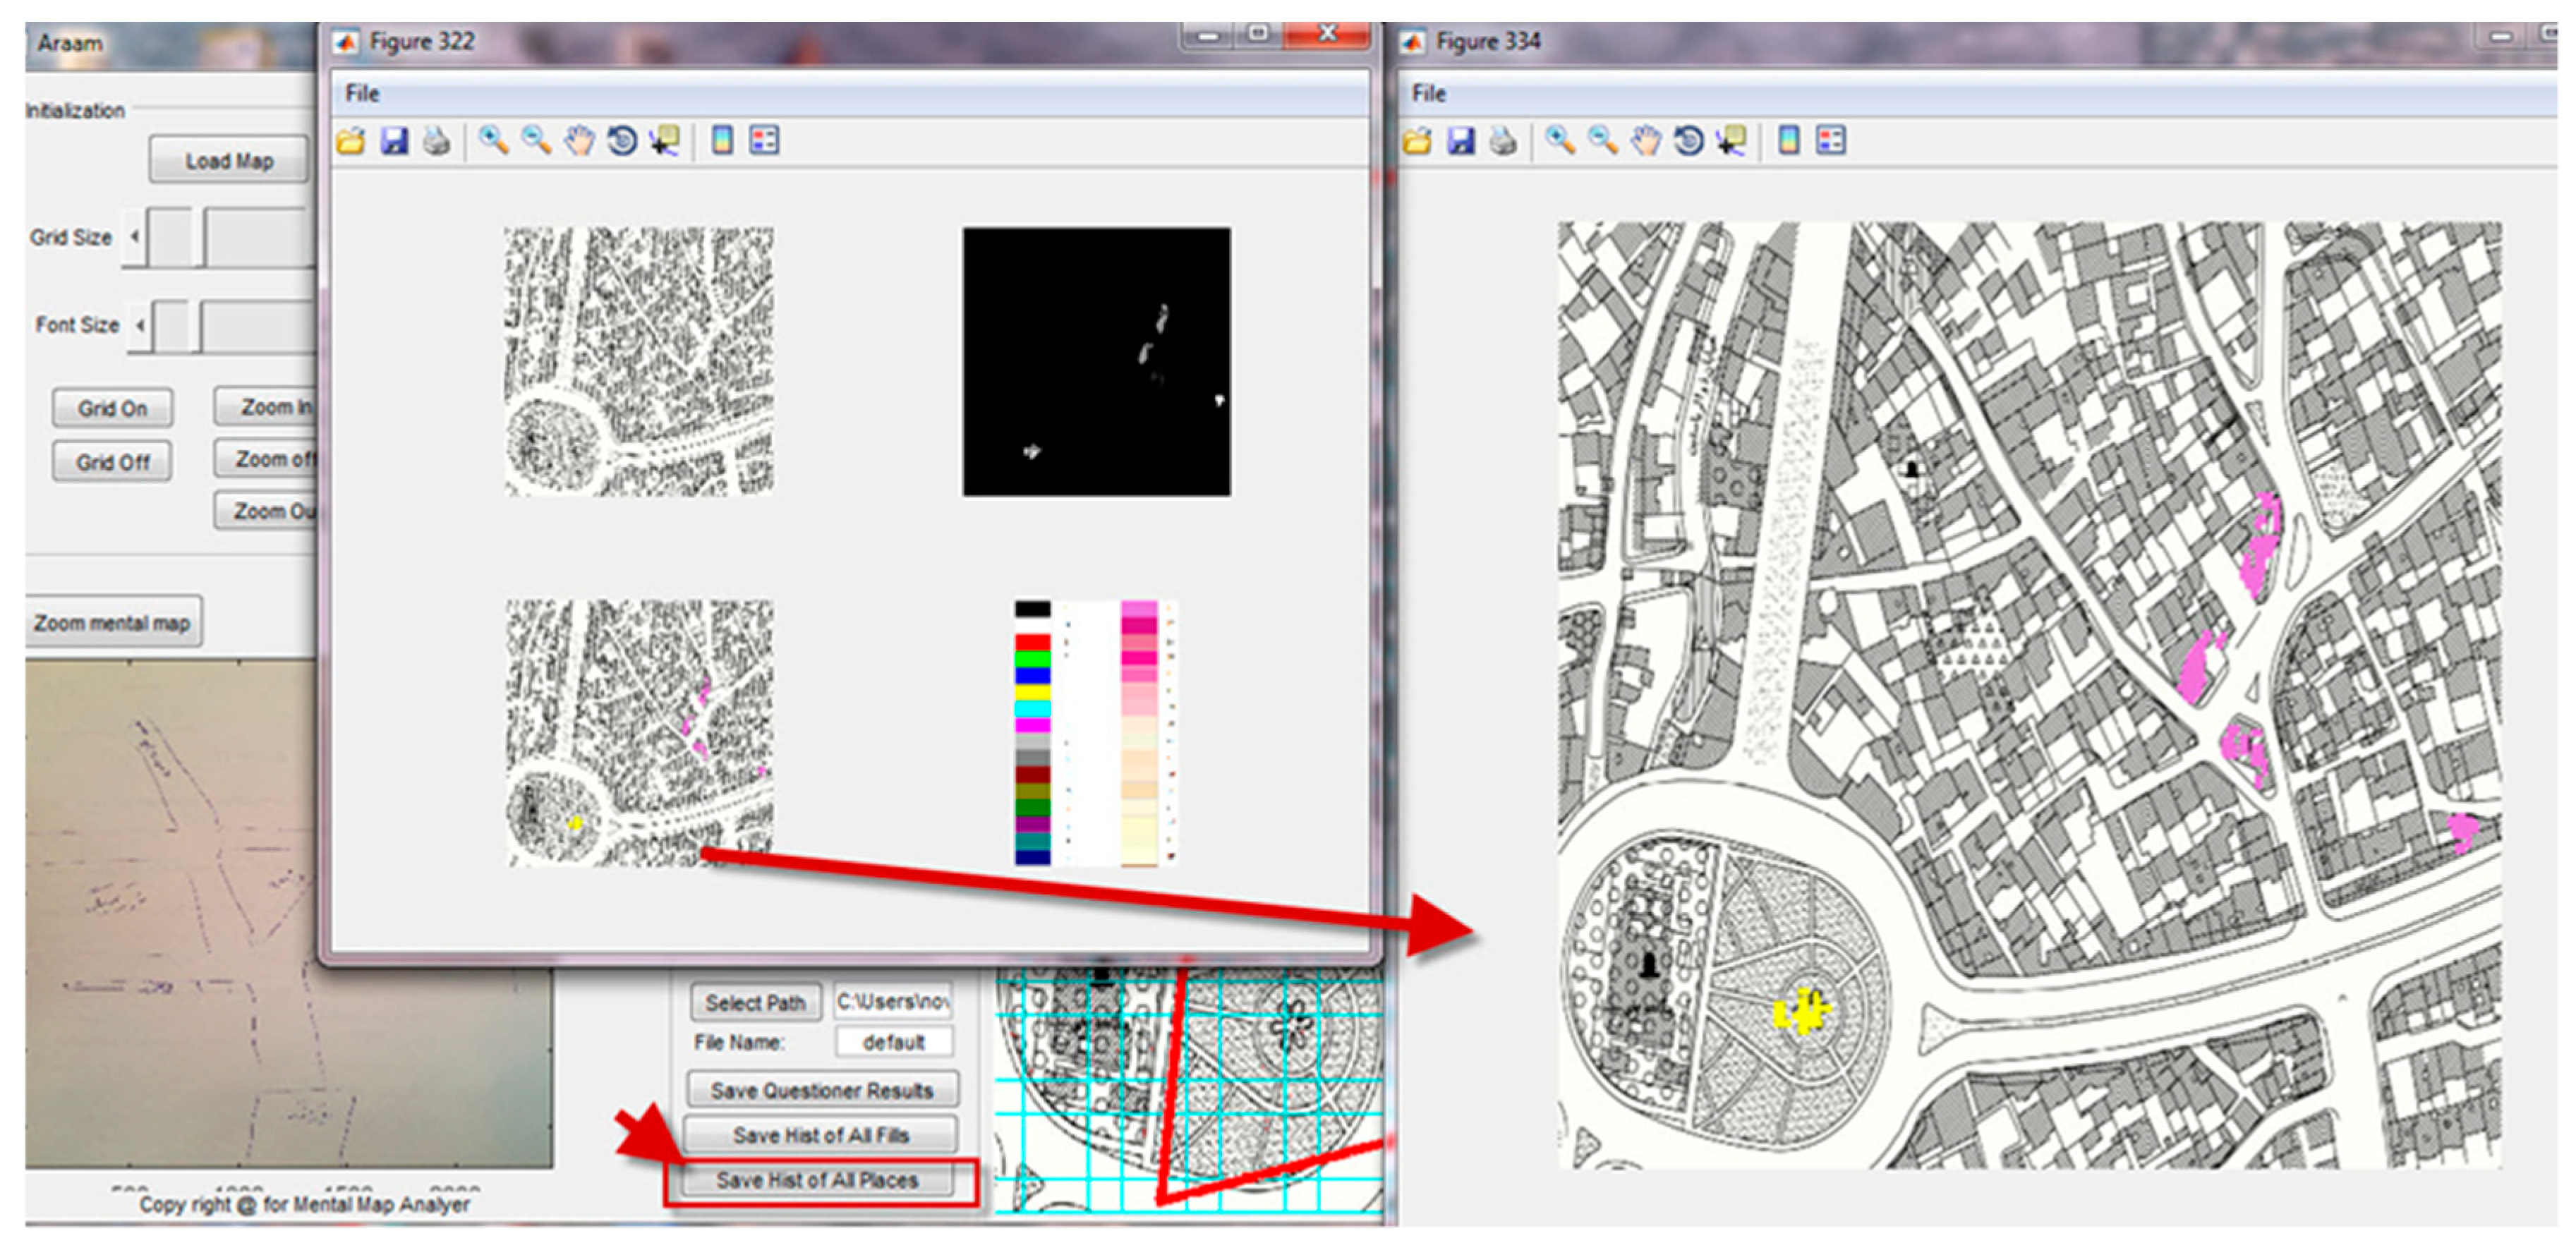
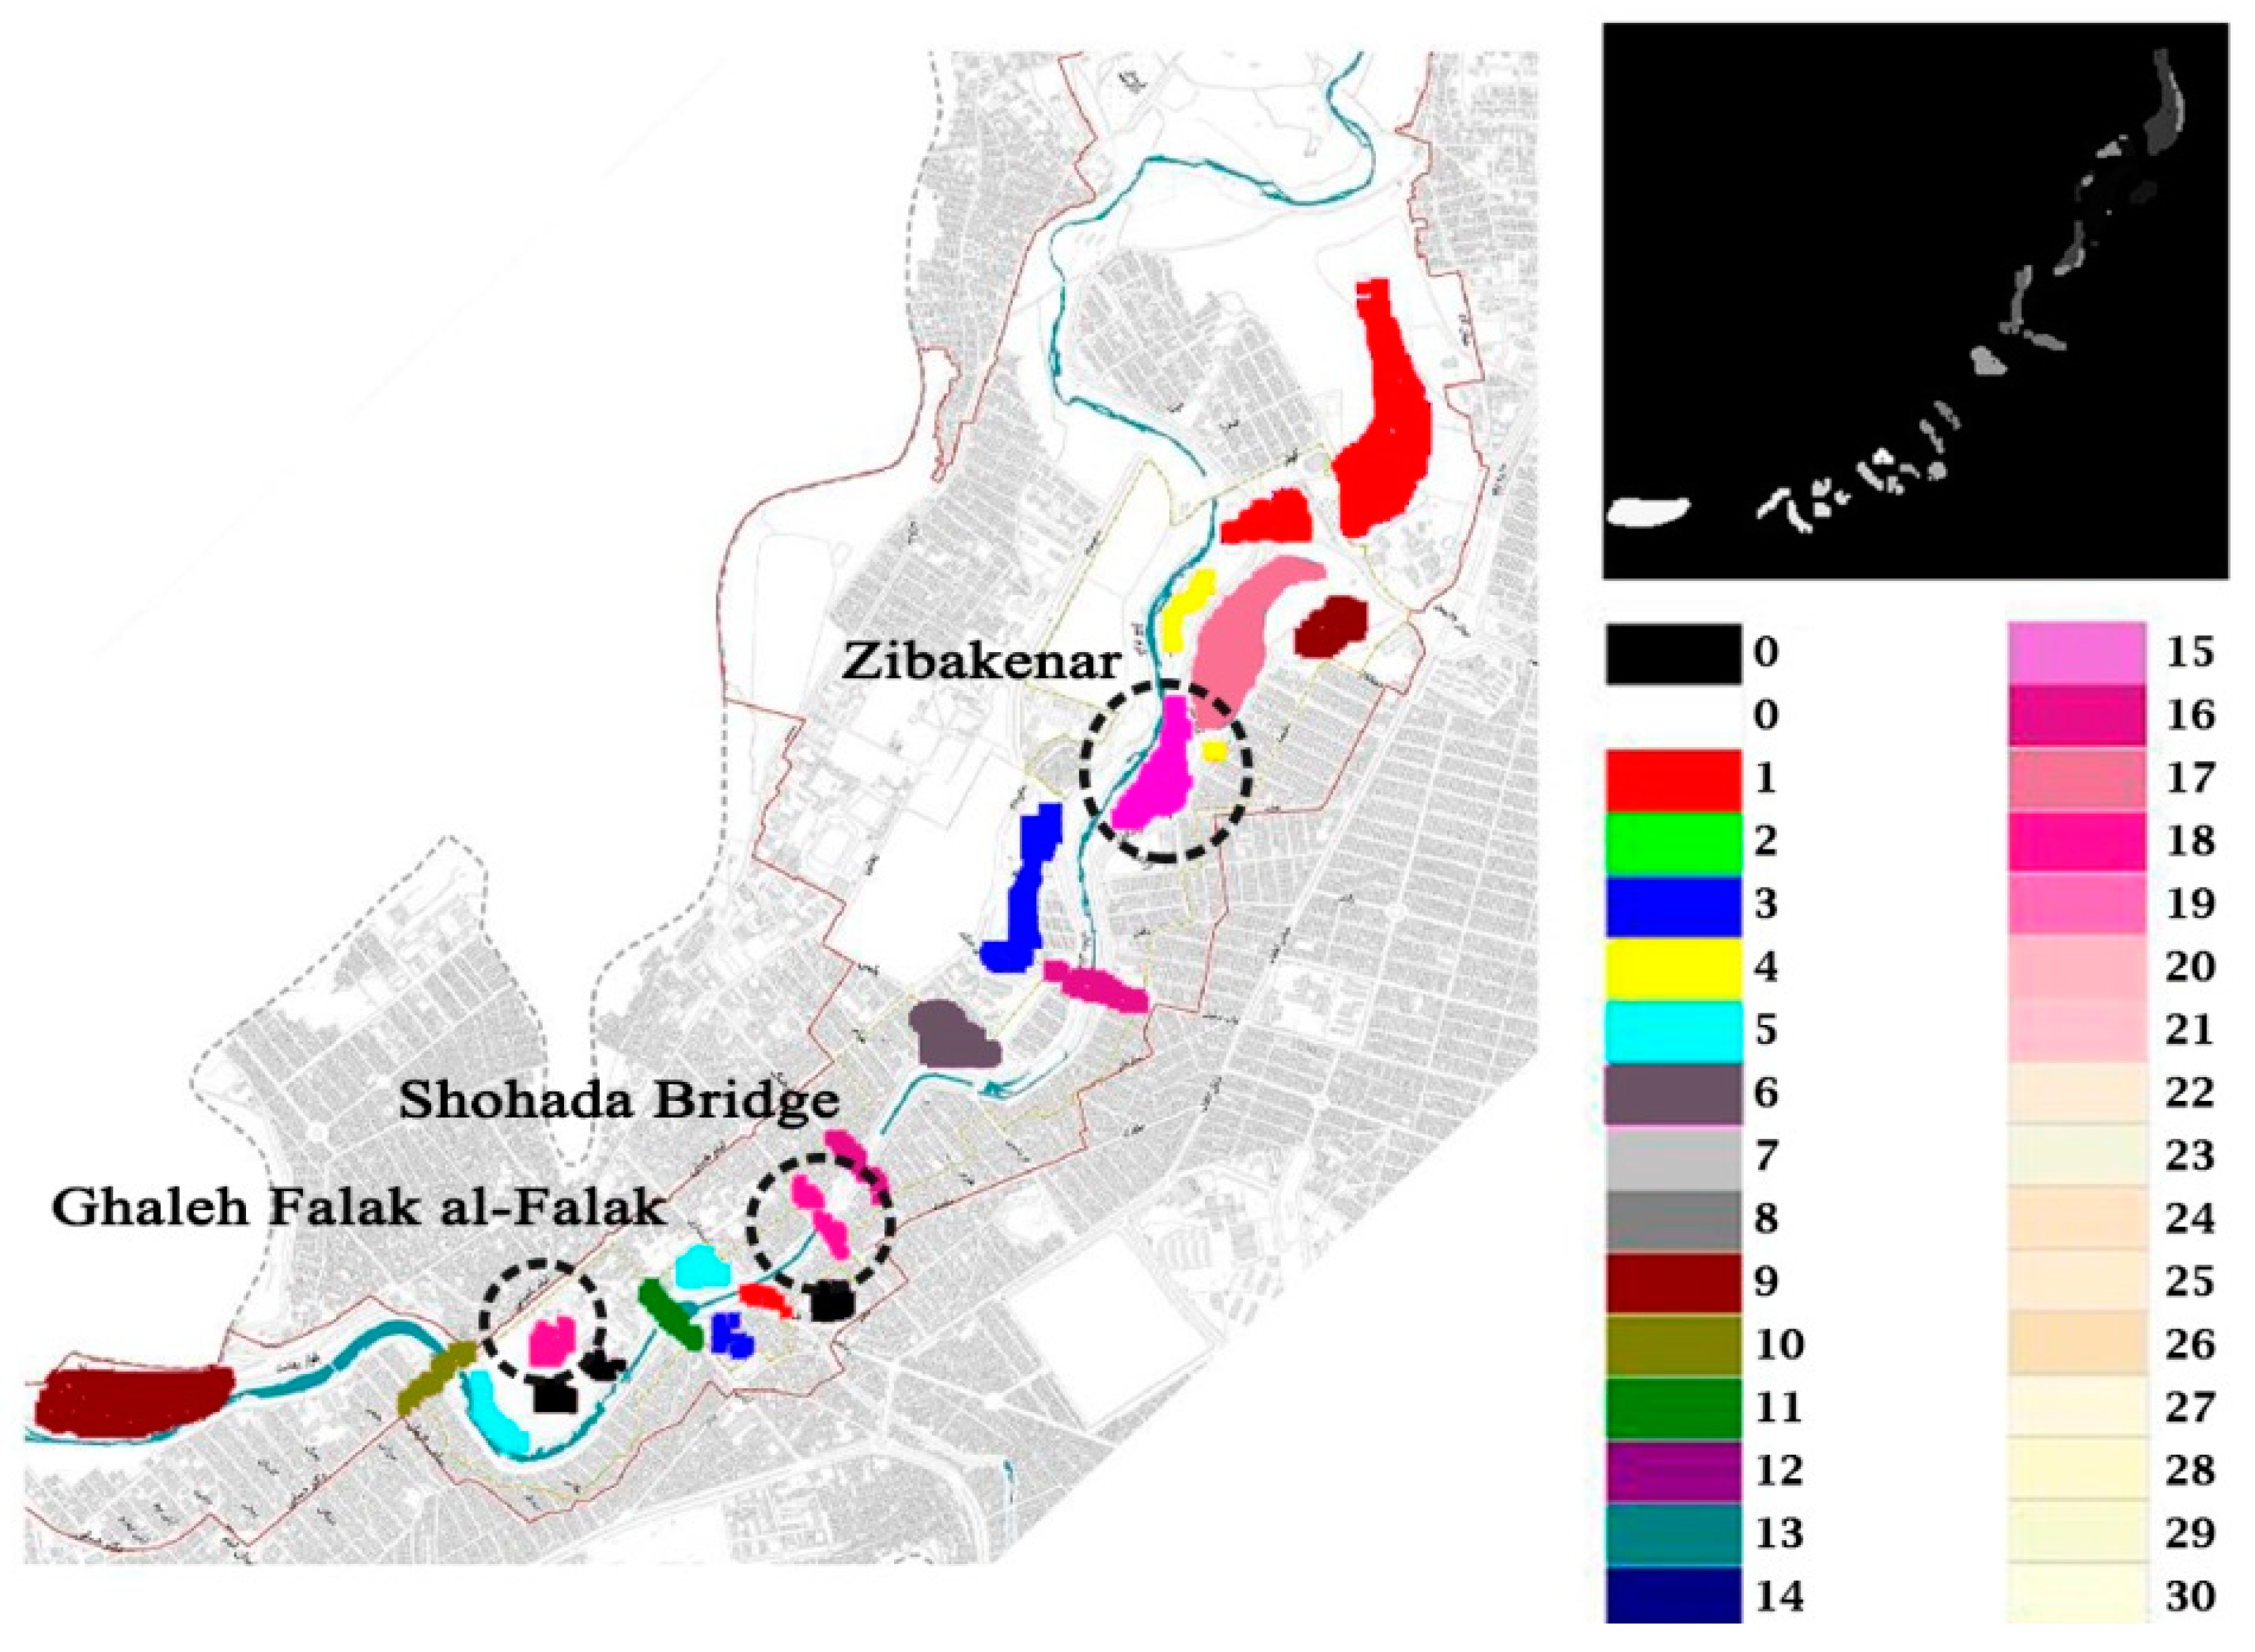
3- HIST of all Places. In this map, all mental maps are placed on one another again but this time, only the places designated as landmarks by the expert are assessed and finally, the number of times these places have been referred to is determined. Through this map, the significance and value of the landmark points entered to the software by the expert is determined (
Figure 8).
3.3. Validating Experiments
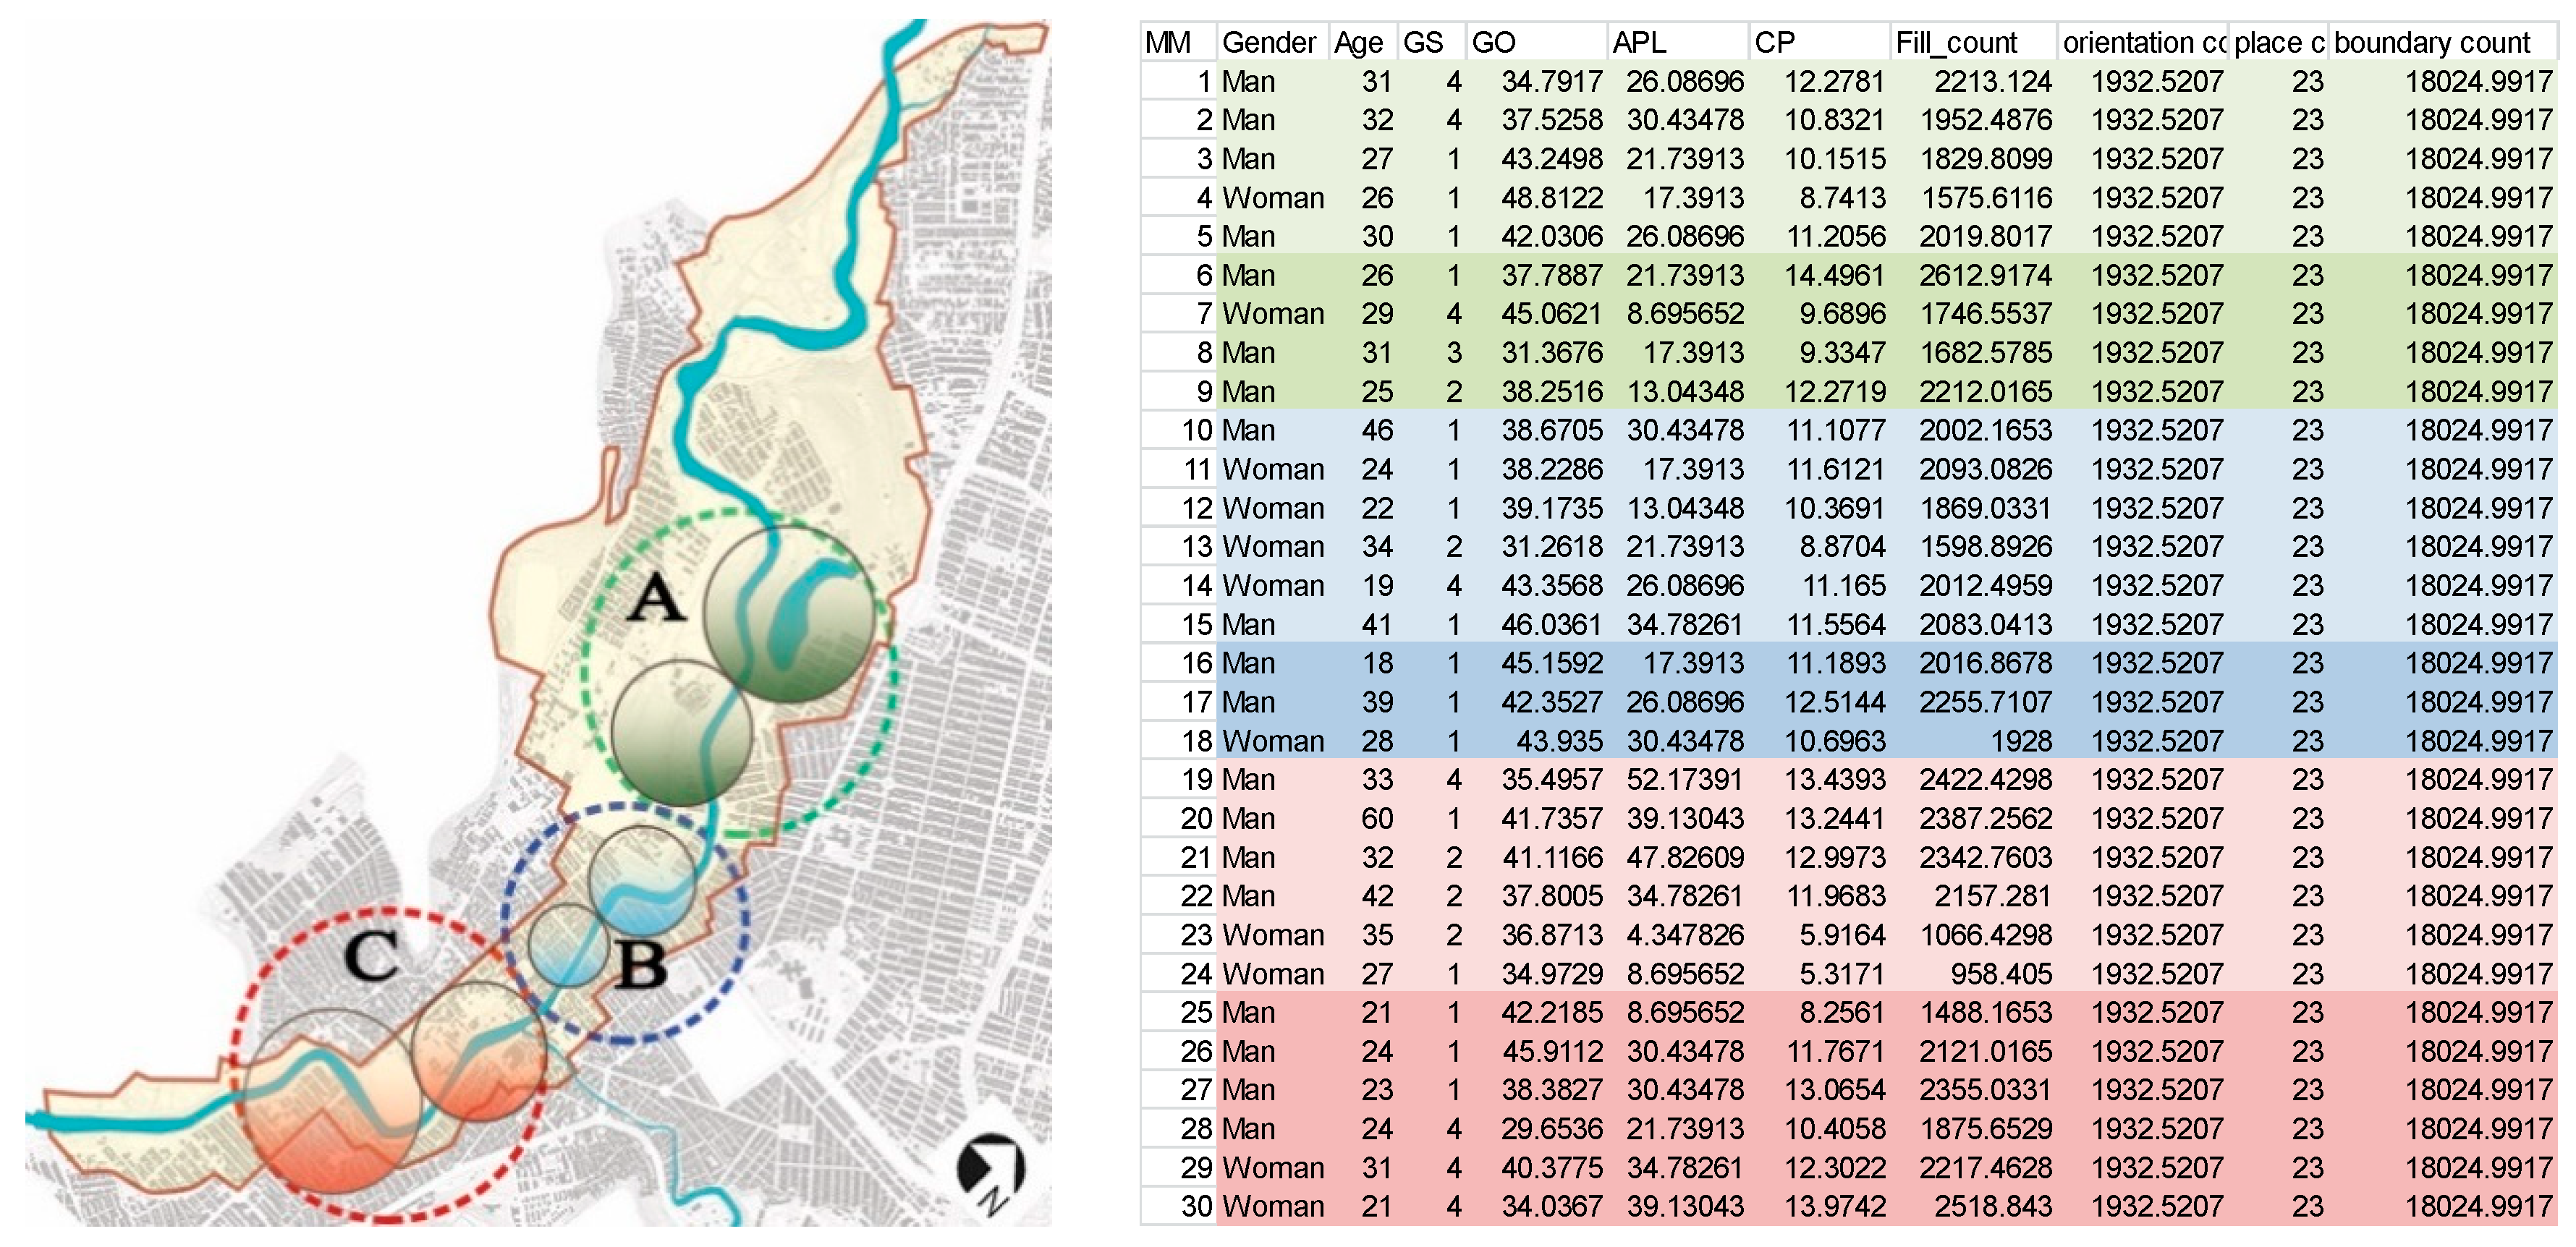
In order to test the validity of the software, it was utilized in a real project related to the urban structure of the Gelal River route in the city of Khorramabad, to assess the validity of AMMA. For this purpose, 30 mental map questionnaires were distributed in three areas as different ages and genders randomly (A, B and C) and each region was divided into two sections (
Figure 9). Part A is located in the northern part of the city and covers the area between the Sakhrei and the QUE parks. This area is considered as a recreational area for the leisure time of Khorramabad residents. Part B is located in the central part of the city between the Shohada Bridge and Daraei Bridge and is considered a part of the city’s busy and crowded area. Part C is located in the southern part of the city, which is considered as the historical area of Khorramabad. Ghaleh Falak al-Falak, which is 1300 years old, and Safavi Bridge, which is about 300 years old, are located in this area. This section includes the area between Hajji Bridge and Safavid Bridge.
In the mental map questionnaire, people were asked to draw a map of their city including the route of the Gelal River.
Prior to collecting mental maps, in a survey that was conducted separately through 384 questionnaires (as multiple choice questions) in the same three areas, it was shown that in the area named Shohada Bridge located in area B, the highest score was achieved in terms of various indexes (functional, physical, social and environmental). Also, it was shown that from the perspective of women, area C scored the lowest in terms of the four questionnaire components and in contrast, the highest score accredited by women was for area A. Furthermore, the last question of the collected questionnaires was titled: “which part of your neighbourhood would you like to spend more time in?” In area A, from 131 questionnaires, 63.4% stated with “Zibakenar,” in area B, from 125 questionnaires, 83.6% responded with “Shohada Bridge” and in area C, from 128 questionnaires, 71% referred to the Ghaleh Falak al-Falak green space, which includes a historic cast.
Thirty mental maps were collected for AMMA testing and analysis, which was done only for software testing; however, interesting results were obtained, some of which are consistent with previous results, including the fact that the Shohada Bridge area was referred to and drawn the most by citizens such that it was the most referenced place within the software (22 times) in the form of a colour spectrum (Cream colour) (
Figure 10). It was interesting that 12 women who had drawn their mental maps had referenced area C urban spaces the least and in contrast, most area A drawings were related to the mental maps drawn by women. In addition, based on software results, the three areas of Zibakenar, Shohada Bridge and Ghaleh Falak al-Falak were the most referred to places by citizens with 18 references equally (pink colour). (
Figure 11).
Based on these results, it can be deduced that information collected via mental maps in a random manner for a limited statistical society (30 people) solely to test software credibility was consistent with expectations. Additionally, other results were provided including level of citizens’ mental complexity, neglected points, landmarks’ value and so forth.
4. Discussion and Summary
Based on the outputs and results obtained from the software implementation experience, the software analysis has been validated for scientific research. By utilizing analytical maps along with AMMA numerical outputs provided as Excel files, various analyses and interpretations can be deduced from mental maps such as the results obtained from the case study concerning women’s favourite places and the impact of environment quality on the mentality of individuals. These specific features are provided by AMMA, through which mental maps can be processed faster and more accurately according to the research subject.
What is dealt with regarding the analysis of mental maps is the differing drawings from various individuals with various perceptions. Therefore, obtaining common patterns by simplifying and transferring depicted points and paths drawn on the main map and comparing them with one another will aid in suitable analysis. This is possible with the drawing tools available in AMMA.
Drawing tools can accurately transfer perceptual information in the software environment [
81,
82,
83] and the user is able to easily transfer mental maps in the program environment on to the main drawing map. By utilizing this feature, the issue of turning and marking landmarks using rectangular boxes (which are only located at the perimeter of the landmark and are not flexible in coinciding with the original landmark) is resolved [
84]. Also, given that all numerical calculations are based on gridding conducted on the main map, marking could only take place within each grid. Otherwise in the regions on the main map where angles, skews or curves exist, marking could not be achieved on the main map in exact accordance to mental maps (
Figure 12). Thus, considering this software feature, calculations are done more accurately. It should also be noted that, although the hexagonal grids, as opposed to square grids, are recommended for calculating the quantitative calculations of the mental maps, and considering the geometric properties [
85], this is true when within the grids are supposed to be spotted. However, the spotting in AMMA is graphical and the grids only have a computational role.
Moreover, calculations completed in computational methods such as BDR is based on the calculation of the position of the location drawn by the actual position of the location based on numerical calculations compared to the urban structure in the mind of the citizen. However, in AMMA, by using a much simpler method of transferring respondent drawings to the main map, in addition to landmark locations within the drawn city and based on referred points within the citizen’s drawings, calculations take place. In this case, the urban structure drawn by citizens is more tangible and comparable. In fact, it can simply be said that by using the Mark Place and Mark Orientation options the landmarks and main paths consequently can be drawn by the experts on the main map. Then, by inserting mental maps and matching them with the original map (using the Load Mental Map options) the ability to move the ranges drawn on the mental map (including landmarks and paths) can be provided. Mental map information then is implemented on the main map and analysed on the basis of inputs given by the expert to the mental maps. In this case, it is not necessary to enter numerical coordinates of the sign or path (as in the BDR method) and the user only marks the landmarks or paths (based on mental map) on the original map for analysing.
5. Limitations
Despite the benefits of the current technique, AMMA also has limitations. First, AMMA does not examine the feelings people have towards a place. This issue, which was neglected from the outset in mental maps, has always made individual’s feelings towards their surroundings unclear when analysing mental maps with individual perception. These feelings may include five senses or a sense of identity that are formed based on the memories individuals have concerning the environment. Nevertheless, next software versions attempts to include information concerning individuals’ feelings towards their environment and relevant valuation such as when placing marks on the main map based on mental maps, it will also be possible to determine individuals’ feelings towards landmarks by valuation on various levels (from very little to very much) based on the research subject.
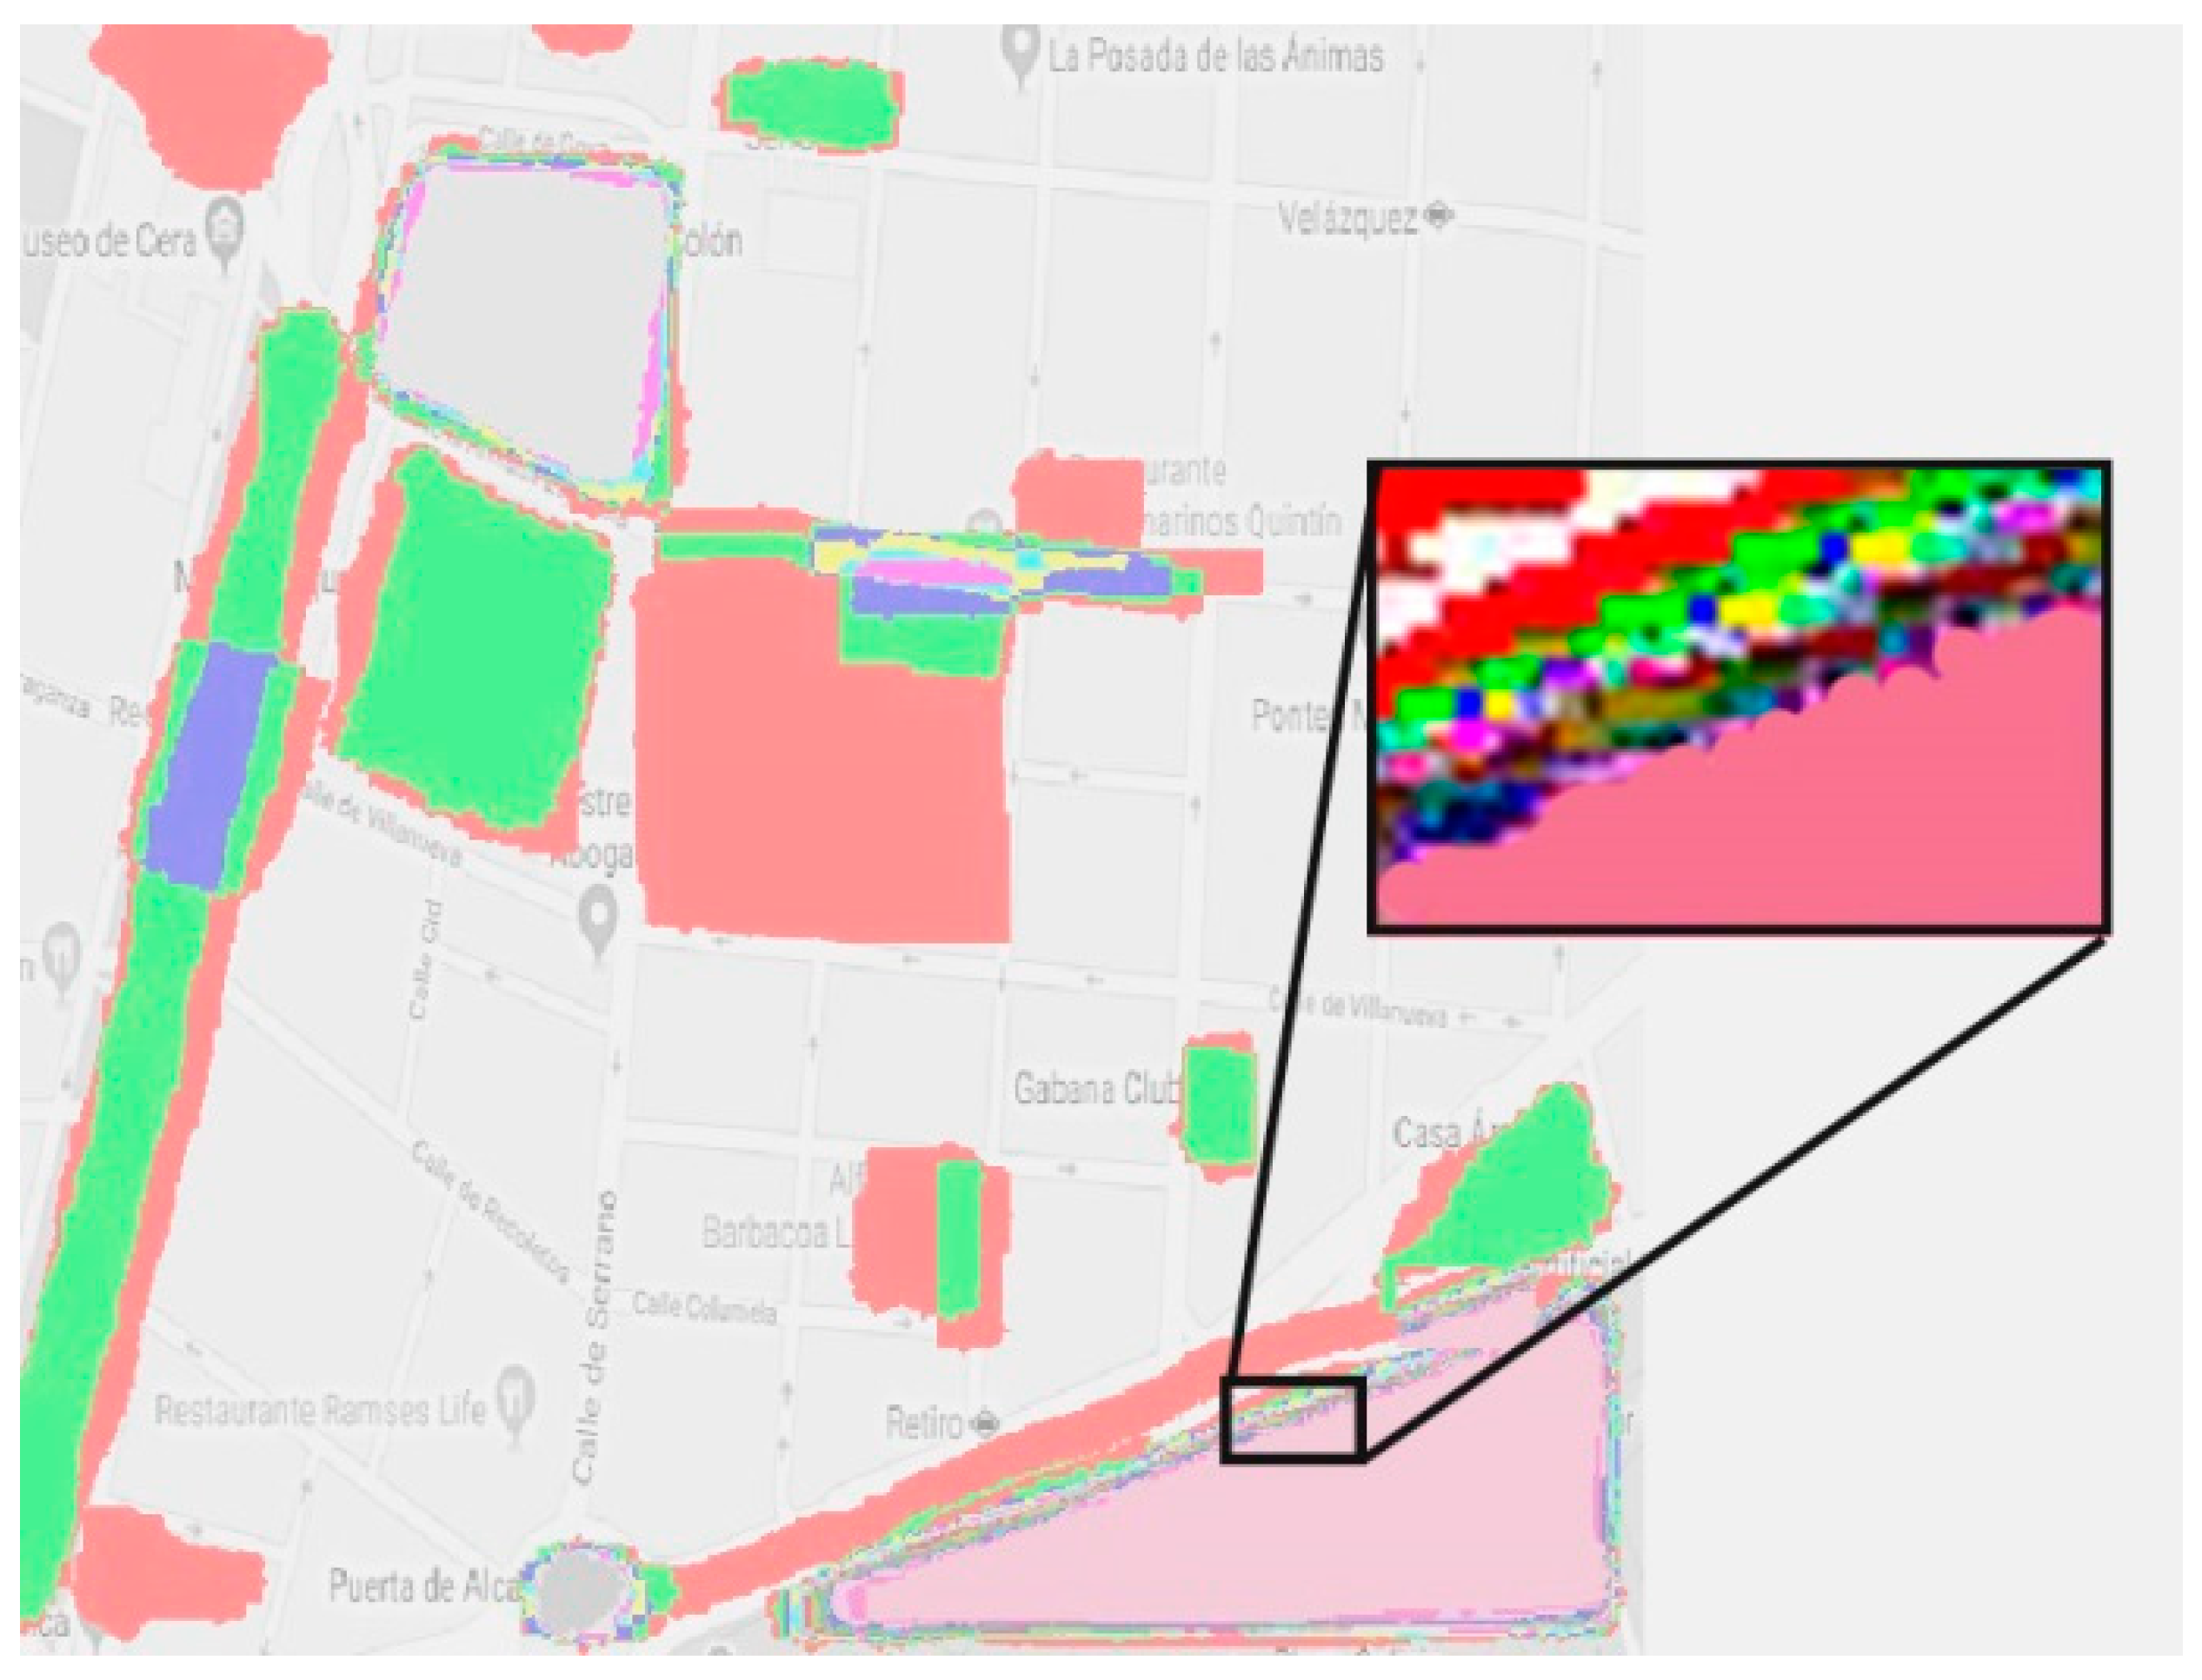
Another noteworthy point is that despite the features of AMMA drawing tools, these tools also have limitations including the fact that drawing takes place based on the movement of the mouse. This may entail vibration or unwanted movement, when, for example, a path or location is referred to by many respondents in the final software analysis, which is in the form of various multi-layers of mental maps, the path and landmark edges will be shown as multi-colours and sliced (
Figure 13).
Other features that are considered software limitations are the dimensions and image of the original map which should be in a square shape (e.g., 4in*4in) and JPG, TIFF or PNG format. Although, considering that scaling the original map takes place within this program by the user based on grid dimensions and size, there will not be any issues if the mentioned dimensions do not coincide. Furthermore, only the form of the original map will be slightly pulled or condensed because the criterion is the created grids and the percentage that they are filled with.
Grid networking is one of the advantages of AMMA, through which quantitative calculations are carried out and there are no issues concerning scale-matching. As with the Space Syntax software, the grid dimensions are regulated based on the size and dimensions of the map, as well as block size. However, this process may be time consuming since grid matching is based on desired size according to the size and dimensions of city blocks or buildings which results in confusion for the user. Nevertheless, in AMMA grids, it attempts to minimize limitations compared to Space Syntax limitations so that the user is able to use the mouse and tools available to enlarge and shrink the grids thus expediting grid matching.
In some other systems, the grid network is not seen as orderly. In this case, despite the distorted image displayed on the screen, the image within the software is calculated correctly and there are no computational or operational issues, such that only the image on the screen may be seen as irregular. Despite the disadvantages mentioned above, these disadvantages do not affect the analysis of mental maps and the reduction of the credit quality of AMMA and output data is accurately provided to researchers.
6. Conclusions
Mental maps are valuable methods of presenting individuals’ perceptions of their surroundings. Despite vast applications in various studies, in the computational and quantitative analysis field, sufficient research has not been conducted. Peoples’ perception method assessment known as “image of the city” has been raised from the outset as Lynch’s elements but considering that the most common mental maps drawn by people consist of landmarks as a three dimensional image and paths as a two dimensional image from the environment structure, these two factors have been focused on for recent research in order to analyse mental maps.
Even though among computational methods, emphasis has been places on landmarks and landmark position calculations, a quantitative method has been presented in AMMA to assess paths and the main environment structure. The most important section of AMMA regarding mental map accuracy and validity are in the form of APL and GO analysis which assess landmark points and paths forming the main environment structure respectively. These methods are presented as valid evaluating techniques for the accurate analysis of mental maps by researchers. Citizens’ mental complexity are also items assessed in AMMA in addition to mental maps analysis via the CP and GS method analysis. The availability of this section along with the main AMMA section have entailed unique results for the program which provides the means for comprehensive mental maps analysis. As such, AMMA is a modern and credible method for mental maps analysis and it is hoped that this program will be useful for researchers active in the perceptual and environmental studies field due to the features available in this program. In order to increase the efficiency and responsiveness of computer programs they need to be upgraded over different time periods, which is always possible through reprogramming. Accordingly, it can be said that AMMA has the ability to meet the new study requirements in this area through plugins and options that will be considered as the future plans of the AMMA program.
Author Contributions
Software development, and writing the original draft, F.A.; urban planning expertise, F.A., E.S., and E.H.G.; computer science expertise, A.M., S.S., and D.M.S.; management, database, conceptualization, writing, administration and methodology, F.A., E.S., and E.H.G.; data curation and visualization, F.A., E.S.; supervision, resources, software, expertise, revision, and verifying the results, E.H.G., A.M. and S.S.
Funding
This research received no external funding.
Acknowledgments
We would like to express our sincere thanks to Morvarid Ghasemi, chief executive officer of the Art of City Engineering (ACE) Consulting Engineers Co. who has paved the way for testing AMMA in Khorramabad’s river project and for validating it through her close cooperation and helpful contributions.
Conflicts of Interest
The authors declare no conflict of interest.
References
- Alvarez, L.; Borsi, K.; Rodrigues, L. The role of social network analysis on participation and placemaking. Sustain. Cities Soc. 2017, 28, 118–126. [Google Scholar] [CrossRef]
- Trindade, E.P.; Hinnig, M.P.F.; Moreira da Costa, E.; Marques, J.S.; Bastos, R.C.; Yigitcanlar, T. Sustainable development of smart cities: A systematic review of the literature. J. Open Innov. Technol. Mark. Complex. 2017, 3, 11. [Google Scholar] [CrossRef]
- Pinna, F.; Masala, F.; Garau, C. Urban Policies and Mobility Trends in Italian Smart Cities. Sustainability 2017, 9, 494. [Google Scholar] [CrossRef]
- Angelidou, M.; Psaltoglou, A. An empirical investigation of social innovation initiatives for sustainable urban development. Sustain. Cities Soc. 2017, 33, 113–125. [Google Scholar] [CrossRef]
- Cohen, M.; Gajendran, T.; Lloyd, J.; Maund, K.; Smith, C.; Bhim, S.; Vaughan, J. Valuing Creative Placemaking: Development of a Toolkit for Public and Private Stakeholders; NSW Government: Sydney, Australia, 2018.
- Piga, B.; Morello, E. Environmental design studies on perception and simulation: An urban design approachLes études sur la perception et la simulation en design environnemental: Une approche par le design urbain. Ambiances 2017, 1. [Google Scholar] [CrossRef]
- Rebernik, N.; Goličnik Marušić, B.; Bahillo, A.; Osaba, E. A 4-dimensional model and combined methodological approach to inclusive Urban planning and design for ALL. Sustain. Cities Soc. 2019, 44, 195–214. [Google Scholar] [CrossRef]
- Dilawar, N.; Majeed, H.; Beg, M.O.; Ejaz, N.; Muhammad, K.; Mehmood, I.; Nam, Y. Understanding Citizen Issues through Reviews: A Step towards Data Informed Planning in Smart Cities. Appl. Sci. 2018, 8, 1589. [Google Scholar] [CrossRef]
- Gao, Y.; Li, Z.; Khan, K. Effect of Cognitive Variables and Emotional Variables on Urban Residents’ Recycled Water Reuse Behavior. Sustainability 2019, 11, 2208. [Google Scholar] [CrossRef]
- Ivancevic, V.G.; Ivancevic, T.T. Introduction: Human and computational mind. Stud. Comput. Intell. 2007, 60, 1–269. [Google Scholar] [CrossRef]
- Aram, F.; Solgi, E.; Holden, G. The role of green spaces in increasing social interactions in neighborhoods with periodic markets. Habitat Int. 2019, 84, 24–32. [Google Scholar] [CrossRef]
- Tolman, E.C. Cognitive maps in rats and men. Psychol. Rev. 1948, 55, 189–208. [Google Scholar] [CrossRef] [PubMed]
- Matlin, M.W. Memory Strategies and Metacognition. In Cognition, 6th ed.; Wiley: London, UK, 2005. [Google Scholar]
- Neisser, U. Cognition and Reality: Principles and Implications of Cognitive Psychology; W. H. Freeman and Company: New York, NY, USA, 1976. [Google Scholar]
- Lang, J. Creating Architectural Theory: The Role of the Behavioral Sciences in Environmental Design; Van Nostrand Reinhold Company: New York, NY, USA, 1987. [Google Scholar]
- Lynch, K. The Image of City; The MIT Press: Cambridge, MA, USA, 1960; ISBN 9780262120043. [Google Scholar]
- Gould, P.R. On Mental Maps; Discussion Paper No. 9 1966; Michigan Interuniversity Community of Mathematical Geographers, University of Michigan: Ann Arbor, MI, USA, 2003. [Google Scholar]
- Golledge, R.G. Human Wayfinding and Cognitive Maps. In The Colonization of Unfamiliar Landscapes: The Archaeology of Adaptation; Routledge Taylor & Francis Group: Oxford, NY, USA, 2003. [Google Scholar]
- Norberg-Schulz, C. Existence, Space and Architecture; Praeger: New York, NY, USA, 1971; p. 7. [Google Scholar]
- Yaski, O.; Portugali, J.; Eilam, D. Arena geometry and path shape: When rats travel in straight or in circuitous paths? Behav. Brain Res. 2011, 225, 449–454. [Google Scholar] [CrossRef] [PubMed]
- Zhu, Q.; Wang, R.; Wang, Z. A cognitive map model based on spatial and goal-oriented mental exploration in rodents. Behav. Brain Res. 2013, 256, 128–139. [Google Scholar] [CrossRef] [PubMed]
- Wang, J.; Schwering, A. Invariant spatial information in sketch maps—A study of survey sketch maps of urban areas. J. Spat. Inf. Sci. 2015, 11, 31–52. [Google Scholar] [CrossRef]
- Brunyé, T.T.; Taylor, H.A. Working memory in developing and applying mental models from spatial descriptions. J. Mem. Lang. 2008, 58, 701–729. [Google Scholar] [CrossRef]
- Sheetz, S.D.; Tegarden, D.P.; Kozar, K.A.; Zigurs, I. A group support systems approach to cognitive mapping. J. Manag. Inf. Syst. 1994, 11, 31–57. [Google Scholar] [CrossRef][Green Version]
- Horan, M. What students see: Sketch maps as tools for assessing knowledge of libraries. J. Acad. Libr. 1999, 25, 187–201. [Google Scholar] [CrossRef]
- Fontaine, S.; Edwards, G.; Tversky, B.; Denis, M. Expert and non-expert knowledge of loosely structured environments. In Proceedings of the International Conference on Spatial Information Theory, Ellicottville, NY, USA, 14–18 September 2005. [Google Scholar]
- Blades, M. The reliability of data collected from sketch maps. J. Environ. Psychol. 1990, 10, 327–339. [Google Scholar] [CrossRef]
- Montello, D.R. The measurement of cognitive distance: Methods and construct validity. J. Environ. Psychol. 1991, 11, 101–122. [Google Scholar] [CrossRef]
- Kitchin, R.M. Methodological convergence in cognitive mapping research: Investigating configurational knowledge. J. Environ. Psychol. 1996, 16, 163–185. [Google Scholar] [CrossRef]
- Golledge, R.G. Misconceptions, misinterpretations and misrepresentations of behavioral approaches in human geography. Environ. Plan. A 1981, 13, 1325–1344. [Google Scholar] [CrossRef]
- MacEachren, A.M. Application of Environmental Learning Theory to Spatial Knowledge Acquisition from Maps. Ann. Assoc. Am. Geogr. 1992, 82, 245–274. [Google Scholar] [CrossRef]
- Ramadier, T.; Moser, G. Social legibility, the cognitive map and urban behaviour. J. Environ. Psychol. 1998, 18, 307–319. [Google Scholar] [CrossRef]
- Smith, C.D. The relationship between the pleasingness of landmarks and the judgement of distance in cognitive maps. J. Environ. Psychol. 1984, 43, 229–234. [Google Scholar] [CrossRef]
- Garling, T.; Book, A.; Lindberg, E. Adults’ memory representations of the spatial properties of their everyday physical environment. In The Development of Spatial Cognition; Cohen, R., Ed.; Erlbaum Lawerence: Hillsdale, NJ, USA, 1985; pp. 141–184. [Google Scholar]
- Briggs, R. Urban distance cognition. In Image and Environment; Downs, R.M., Stea, D., Eds.; Aldine: Chicago, IL, USA, 1937; pp. 361–388. [Google Scholar]
- Rovine, M.J.; Weisman, G.D. Sketch-map variables as predictors of way-finding performance. J. Environ. Psychol. 1989, 9, 217–232. [Google Scholar] [CrossRef]
- Couclelis, H. Artificial intelligence in geography: Conjec-tures on the shape of things to come. Prof. Geogr. 1986, 38, 1–11. [Google Scholar] [CrossRef]
- Blades, M. Wayfinding Theory and Research: The Need for a New Approach. In Cognitive and Linguistic Aspects of Geographic Space; Mark, D.M., Frank, A.D., Eds.; Kluwer Academic Publishers: Dordrecht, The Netherlands, 1990; pp. 137–165. [Google Scholar]
- Motieyan, H.; Mesgari, M.S. Towards Sustainable Urban Planning Through Transit-Oriented Development (A Case Study: Tehran). ISPRS Int. J. Geo-Inf. 2017, 6, 402. [Google Scholar] [CrossRef]
- Tuan, Y.F. Images and mental maps. Ann. Assoc. Am.Geogr. 2015, 65, 205–213. [Google Scholar] [CrossRef]
- Golledge, R.G.; Timmermanns, H. Applications of behavioral research on spatial problems I: Cognition. Prog. Hum. Geogr. 1990, 14, 57–99. [Google Scholar] [CrossRef]
- Saarinen, T.F.; MacCabe, C.L.; Morehouse, B. Sketch Maps of the World as Surrogates for World Geographic Knowledge; Paper 83-3; Department of Geography Regional Development, University of Arizona: Tucson, AZ, USA, 1998. [Google Scholar]
- Siegel, A.W.; Schadler, M. Young children’s cognitive maps of their classroom. Child Dev. 1977, 48, 388–394. [Google Scholar] [CrossRef]
- Evans, G.W.; Smith, C.; Pezdek, K. Cognitive maps and urban form. J. Am. Plan. Assoc. 1982, 48, 232–244. [Google Scholar] [CrossRef]
- Webley, P. Sex differences in home range and cognitive maps in eight-year old children. J. Environ. Psychol. 1981, 1, 293–302. [Google Scholar] [CrossRef]
- Matlin, M.W. Response competition, recognition and affect. J. Personal. Soc. Psychol. 1971, 19, 295–300. [Google Scholar] [CrossRef]
- Kitchin, R.M. Cognitive maps: What are they and why study them? J. Environ. Psychol. 1994, 14, 1–19. [Google Scholar] [CrossRef]
- Appleyard, D. Styles and methods of structuring a city. Environ. Behav. 1970, 2, 100–117. [Google Scholar] [CrossRef]
- Walsh, D.A.; Krauss, I.K.; Regnier, V.A. Spatial ability, environmental knowledge and environmental use: The elderly. In Spatial Representation and Behavior Across the Life Span: Theory and Application; Liben, L.S., Patterson, A.H., Newcombe, N., Eds.; Academic Press: New York, NY, USA, 1981. [Google Scholar]
- Appleyard, D. The environment as a social symbol: Within a theory of environmental action and perception. J. Am. Plan. Assoc. 1979, 45, 143–153. [Google Scholar] [CrossRef]
- Evans, G.W.; Marrero, D.G.; Butler, P.A. Environmental learning and cognitive mapping. Environ. Behavr. 1981, 13, 84–104. [Google Scholar] [CrossRef]
- Hart, R.A.; Moore, G.T. The Development of Spatial Cognition: A Review. In Image and Environment; Downs, R.M., Stea, D., Eds.; Aldine: Chicago, IL, USA, 1973; pp. 246–288. [Google Scholar]
- Siegel, A.W.; White, S.H. The development of spatial representations of large-scale environments. Adv. Child Dev. Behav. 1975, 10, 9–55. [Google Scholar] [CrossRef]
- Evans, G.W.; Skorpanich, M.A.; Gärling, T.; Bryant, K.J.; Bresolin, B. The effects of pathway configuration, landmarks and stress on environmental cognition. J. Environ. Psychol. 1984, 4, 323–335. [Google Scholar] [CrossRef]
- Porębska, A.; Rizzi, P.; Otsuki, S.; Shirotsuki, M. Walkability and Resilience: A Qualitative Approach to Design for Risk Reduction. Sustainability 2019, 11, 2878. [Google Scholar] [CrossRef]
- Safari, H.; Moridani, F.F.; Mahdzar, S.S. Influence of geometry on legibility: An explanatory design study of visitors at the Kuala Lumpur City Center. Front. Archit. Res. 2016, 54, 499–507. [Google Scholar] [CrossRef]
- Ruiz, E.C.; De la Cruz, E.R.R.; Vázquez, F.J.C. Sustainable Tourism and Residents’ Perception towards the Brand: The Case of Malaga (Spain). Sustainability 2019, 11, 292. [Google Scholar] [CrossRef]
- Koseoglu, E.; Onder, D.E. Subjective and objective dimensions of spatial legibility. Procedia Soc. Behav. Sci. 2011, 30, 1191–1195. [Google Scholar] [CrossRef]
- Coluccia, E.; Iosue, G.; Antonella Brandimonte, M. The relationship between map drawing and spatial orientation abilities: A study of gender differences. J. Environ. Psychol. 2016, 27, 135–144. [Google Scholar] [CrossRef]
- Zanbaka, C.A.; Lok, B.C.; Babu, S.V.; Ulinski, A.C.; Hodges, L.F. Comparison of path visualizations and cognitive measures relative to travel technique in a virtual environment. IEEE Trans. Vis. Comput. Graph. 2005, 11, 694–705. [Google Scholar] [CrossRef] [PubMed]
- Carassa, A.; Geminiani, G.; Morganti, F.; Varotto, D. Active and passive spatial learning in a complex virtual environment: The effect of effcient exploration. Cogn. Process. 2002, 3, 65–81. [Google Scholar]
- Blaser, A. A study of peoples sketching habits in GIS. Spat. Cogn. Comput. 2000, 2, 393–419. [Google Scholar] [CrossRef]
- Billinghurst, M.; Weghorst, S. The use of sketch maps to measure cognitive maps of virtual environments. In Proceedings of the IEEE Annual International Symposium on Virtual Reality 1995, Albuquerque, NM, USA, 1–5 March 1995; pp. 40–47. [Google Scholar]
- Tobler, W.R. Bidimensional Regression. Geogr. Anal. 1994, 26, 187–212. [Google Scholar] [CrossRef]
- Friedman, A.; Kohler, B. Bidimensional Regression: Assessing the Configural Similarity and Accuracy of Cognitive Maps and Other Two-Dimensional Data Sets. Psychol. Methods 2003, 8, 468–491. [Google Scholar] [CrossRef]
- Symington, A.; Charlton, M.E.; Brunsdon, C.F. Using bidimensional regression to explore map lineage. Comput. Environ. Urban Syst. 2002, 262–263, 201–218. [Google Scholar] [CrossRef]
- Repetti, A.; Soutter, M.; Musy, A. Introducing SMURF: A software system for monitoring urban functionalities. Comput. Environ. Urban Syst. 1989, 30, 686–707. [Google Scholar] [CrossRef]
- Steiniger, S.; Hunter, A.J.S. The 2012 free and open source GIS software map - A guide to facilitate research, development and adoption. Comput. Environ. Urban Syst. 2013, 39, 136–150. [Google Scholar] [CrossRef]
- Jung, J.-K. Computer-Aided Qualitative GIS: A software-level integration of qualitative research and GIS. Qual. GIS 2009, 115–136. [Google Scholar] [CrossRef]
- Tu Huynh, N.; Doherty, S.T. Digital Sketch-Map Drawing as an Instrument to Collect Data about Spatial Cognition. Cartogr. Int. J. Geogr. Inf. Geovisualization 2007, 42, 285–296. [Google Scholar] [CrossRef]
- Curtis, J.W.; Shiau, E.; Lowery, B.; Sloane, D.; Hennigan, K.; Curtis, A. The prospects and problems of integrating sketch maps with geographic information systems to understand environmental perception: A case study of mapping youth fear in Los Angeles gang neighborhoods. Environ. Plan. B Plan. Des. 2014, 41, 251–271. [Google Scholar] [CrossRef]
- Huerta, J.; Schade, S.; Granell, C. Connecting a digital Europe through location and place. Lect. Notes Geoinf. Cartogr. 2014, 37–54. [Google Scholar] [CrossRef]
- Trowbridge, S.; Council, N.; Education, G.; Council, N. Using ArcGIS to quantitatively measure sketch map quality for the comparison of theoretical frameworks of spatial microgenesis. Emporia State Res. Stud. 1975, 50, 11–17. [Google Scholar]
- Tomko, M.; Winter, S. Describing the functional spatial structure of urban environments. Comput. Environ. Urban Syst. 2013, 41, 177–187. [Google Scholar] [CrossRef]
- Milgram, S.; Jodelet, D. Psychological maps of paris. In The People 2014, Place and Space Reader; Taylor and Francis: London, UK, 1970. [Google Scholar]
- Byrne, R.W. Memory for urban geography. Quarterly J. Exp. Psychol. 1979, 31, 147–154. [Google Scholar] [CrossRef]
- Holyoak, K.J.; Mah, W.A. Cognitive reference points in judgments of symbolic magnitude. Cogn. Psychol. 1982, 14, 328–352. [Google Scholar] [CrossRef]
- Aram, F.; Higueras García, E.; Solgi, E.; Mansournia, S. Urban green space cooling effect in cities. Heliyon 2019, 54, e01339. [Google Scholar] [CrossRef] [PubMed]
- Yun, S.; Kim, T. What Do Coffee Shop Entrepreneurs Need to Do to Raise Pro-Environmental Customer Behavioral Intentions? Sustainability 2019, 11, 2666. [Google Scholar] [CrossRef]
- Higueras García, E.; Aram, F. Investigating the role of Retiro Park in creating the thermal and psychological comfort and tranquility of citizens. In Proceedings of the City Futures IV (EURA-UAA Conference), Dublin, Ireland, 20–22 June 2019. [Google Scholar]
- Forbus, K.D.; Usher, J.; Chapman, V. Qualitative spatial reasoning about sketch maps. AI Mag. 2004, 25, 61–72. [Google Scholar] [CrossRef]
- Nosratabadi, S.; Mosavi, A.; Shamshirband, S.; Kazimieras Zavadskas, E.; Rakotonirainy, A.; Chau, K.W. Sustainable Business Models: A Review. Sustainability 2019, 11, 1663. [Google Scholar] [CrossRef]
- Ijadi Maghsoodi, A.; Ijadi Maghsoodi, A.; Rabczuk, T.; Zavadskas, E. Renewable energy technology selection problem using integrated h-swara-multimoora approach. Sustainability 2018, 10, 4481. [Google Scholar] [CrossRef]
- Gardony, A.L.; Taylor, H.A.; Brunyé, T. Gardony Map Drawing Analyzer: Software for quantitative analysis of sketch maps. Behav. Res. Methods 2016, 48, 151–177. [Google Scholar] [CrossRef]
- Pánek, J. Emotional Maps: Participatory Crowdsourcing of Citizens´ Perceptions of Their Urban Environment. Cartogr. Perspect. 2018, 90. [Google Scholar] [CrossRef]
© 2019 by the authors. Licensee MDPI, Basel, Switzerland. This article is an open access article distributed under the terms and conditions of the Creative Commons Attribution (CC BY) license (http://creativecommons.org/licenses/by/4.0/).

 ,
, 


