Article

Continued Hydrothermal and Radiative Pressure on Changed Cropland in China

1
Key Laboratory of Geospatial Technology for the Middle and Lower Yellow River Regions, Ministry of Education, Kaifeng 475004, China
2
College of Environment and Planning, Henan University, Kaifeng 475004, China
*
Author to whom correspondence should be addressed.
Sustainability 2019, 11(14), 3762; https://doi.org/10.3390/su11143762
Submission received: 8 June 2019 / Revised: 29 June 2019 / Accepted: 1 July 2019 / Published: 10 July 2019
(This article belongs to the Section Sustainable Agriculture)

Abstract

:
Both cropland and climate change over time, but the potential effects of climate change on cropland is currently not well understood. Here, we combined temporally and spatially explicit dynamics of cropland with air temperature, precipitation, and solar radiation datasets. China’s cropland showed a clear northward-shifting trend from 1990 to 2015. The cropland decreased south of the break line at 38° N, whereas it increased from the break line to northern regions. Correspondingly, the temperature showed a significant warming trend in the early part of the study period, which slowed down in later years. During the whole study period, both precipitation and solar radiation decreased over time, showed no significant linear characteristics, and the annual fluctuations were very large. The cropland areas in China showed a displacement characteristic with the increasing temperature, precipitation, and radiation. Overall, the cropland was shifting towards the high-temperature, low-precipitation, and low-radiation areas. The cropland dynamics indicate that they are likely to face severe drought and radiation pressure. Our findings imply that more resources such as irrigation may be needed for cropland, which will undoubtedly aggravate the agricultural water use in most northern regions, and the potential impacts on food security will further emerge in the future.

1. Introduction

The supply of cropland directly affects China’s food security and has received considerable research attention [1,2]. In the context of global change, systematic analysis of cropland dynamics and their corresponding changes in key climate conditions such as hydrothermal and solar radiation conditions are important for understanding cropland resources, assessing the supply of resources needed for farming, and ensuring food production safety [3,4].
There have been clear temporal and spatial changes in China’s cropland. Many studies have built a series of long-term series of land use datasets based on remote sensing and other multi-source data. The changes of China’s cropland and the factors driving this change have also been analyzed [5,6,7]. In recent years, in response to urban expansion, a large amount of high-quality cropland around the city has been converted to urban land [5,8]. A series of ecological engineering measures, such as returning cropland to forest and grassland, have also led to the loss of cropland [9,10]. In addition, rural labor transfer has led to artificial abandonment of cropland in some regions in China [11]. In view of the various impacts faced by cropland, the government has proposed to adhere to a cropland area of 1.2 million km2 across China to ensure the bottom line of food security. The government has introduced a series of measures such as “balance of occupation and compensation for cropland” and “basic farmland protection” to limit the loss of cropland resources [12].
There are many factors affecting crop production, among which hydrothermal and solar radiation resources are the most basic natural factors [13,14]. Crop photosynthesis is highly sensitive to air temperature, precipitation, and solar radiation. In general, within a certain range, the more abundant the hydrothermal resources and the greater the intensity of solar radiation, the higher the corresponding crop productivity [15,16,17]. Moreover, the impacts of climate change on cropland is highly uncertain [18], and China’s hydrothermal and radiation conditions have also changed substantially over time [16,19]. Moreover, under the influence of scientific and technological progress, new changes have emerged in China’s cropland since the 1990s [6,20]. However, there is little systematic understanding and no clear conclusions on the corresponding impact of the hydrothermal and radiation conditions on cropland.
This study systematically analyzed the temporal and spatial dynamics of China’s cropland from 1990 to 2015 and the corresponding changes in temperature, precipitation, and solar radiation conditions. This study will play an important role in assessing the consumption and input of resources that require human intervention.

2. Materials and Methods

2.1. Study Data

Land use and land cover (LULC) data were downloaded from the Natural Resources and Environment Data Center of the Chinese Academy of Sciences [21]. The dataset was mainly constructed by human–computer interaction using satellite data such as Landsat optical images interpreted by hundreds of scientists [12,21]. The data used a hierarchical classification system of 6 LULC categories and 25 subclasses. Here, we used the latest version of the LULC datasets with a spatial resolution of 1 km to analyze the temporal and spatial patterns of cropland in China from 1990 to 2015.
The interpolated gridded hydrothermal data of annual average temperature and total precipitation from 1990 to 2015 were taken from the Natural Resources and Environment Data Center of the Chinese Academy of Sciences. The data with a spatial resolution of 1 km were generated based on daily observation data of more than 2400 meteorological stations nationwide in China and the ANUSPLIN interpolation method. ANUSPLIN is able to perform statistical analysis and data diagnosis, and can analyze the spatial distribution of data to achieve final spatial interpolation [22].
Gridded solar radiation grid data were taken from the Environmental Ecology Laboratory of Seoul National University [23]. The data span from 2000 to 2015 with a spatial resolution of 0.05° and a temporal resolution of months. These data have been widely validated and applied worldwide [23].
In addition, to further clarify the exact cropland change, vector zone data with 1° latitude were created to carry out the latitude analysis.

2.2. Methods

According to China’s LULC data, we first extracted the type of cropland for every five years from 1990 to 2015. Then, the linear trend analysis method was used to analyze the temporal and spatial trends of temperature, precipitation, and solar radiation. Finally, spatial statistical methods were used to comprehensively analyze the changes of hydrothermal and radiation conditions under the dynamics of cropland in China.
The change trends of temperature, precipitation, and solar radiation were calculated by the slope of the least squares regression. If we have one dataset (x1, …, xn) containing n values and another dataset (y1, …, yn) containing n values then the formula for the slope is:
S l o p e i = n x y i x y i n x 2 ( x ) 2   ( i   =   1 ,   2 ,   3 )
where x is the year (the year corresponding temperature and precipitation are from 1990 to 2015, while the time corresponding to solar radiation is from 2000 to 2015); and yi is expressed as temperature, precipitation, and radiation factor, respectively.

3. Results

3.1. Temporal and Spatial Changes of Cropland

China’s cropland was distributed over various regions over the study period but was mainly concentrated in the North China Plain (including Henan, Hebei, Shandong, Anhui, and Jiangsu provinces). In addition, a large number of contiguous croplands were also distributed in parts of Sichuan, and Chongqing, Xinjiang, and three northeastern provinces (Heilongjiang, Jilin, and Liaoning). In terms of temporal change, compared with 1990, the area of cropland declined slightly in 1995, but in 2000 there was a large increase, followed by a gradual decline again. Compared with the area of 1.772 million km2 in 1990, the area of cropland in 2015 was 1.786 million km2, representing a slight increase. Overall, the area of cropland in China has remained between 1.77 and 1.80 million km2 within the study period (Figure 1).
China’s cropland has shown a clear latitudinal characteristic in dynamic change (e.g., northward shifting). Figure 2 shows that most of the cropland was distributed between 23° N and 47° N, accounting for about 95% of all cropland area in China. The cropland was mostly concentrated at 30° N–37° N, and the cropland area exceeded 80,000 km2 in each latitude zone within these bounds. In 1990, the cropland area was largest in the 31° N zone, reaching 101,400 km2, but in 2015, the cropland area of the zone decreased to 95,900 km2, and the largest cultivated area occurred again at 31° N, reaching 96,700 km2. The area of cropland had a significant increase in the 22° N and 29° N zones, whereas there was a significant decrease in the 38° N and 48° N zones. The two elliptical regions in Figure 2a indicate that the cropland in the two latitudinal zones changed considerably. Compared with 1990, the cropland decreased year by year at 30° N–32° N, whereas there was a relatively obvious increasing process for cropland above 40° N.
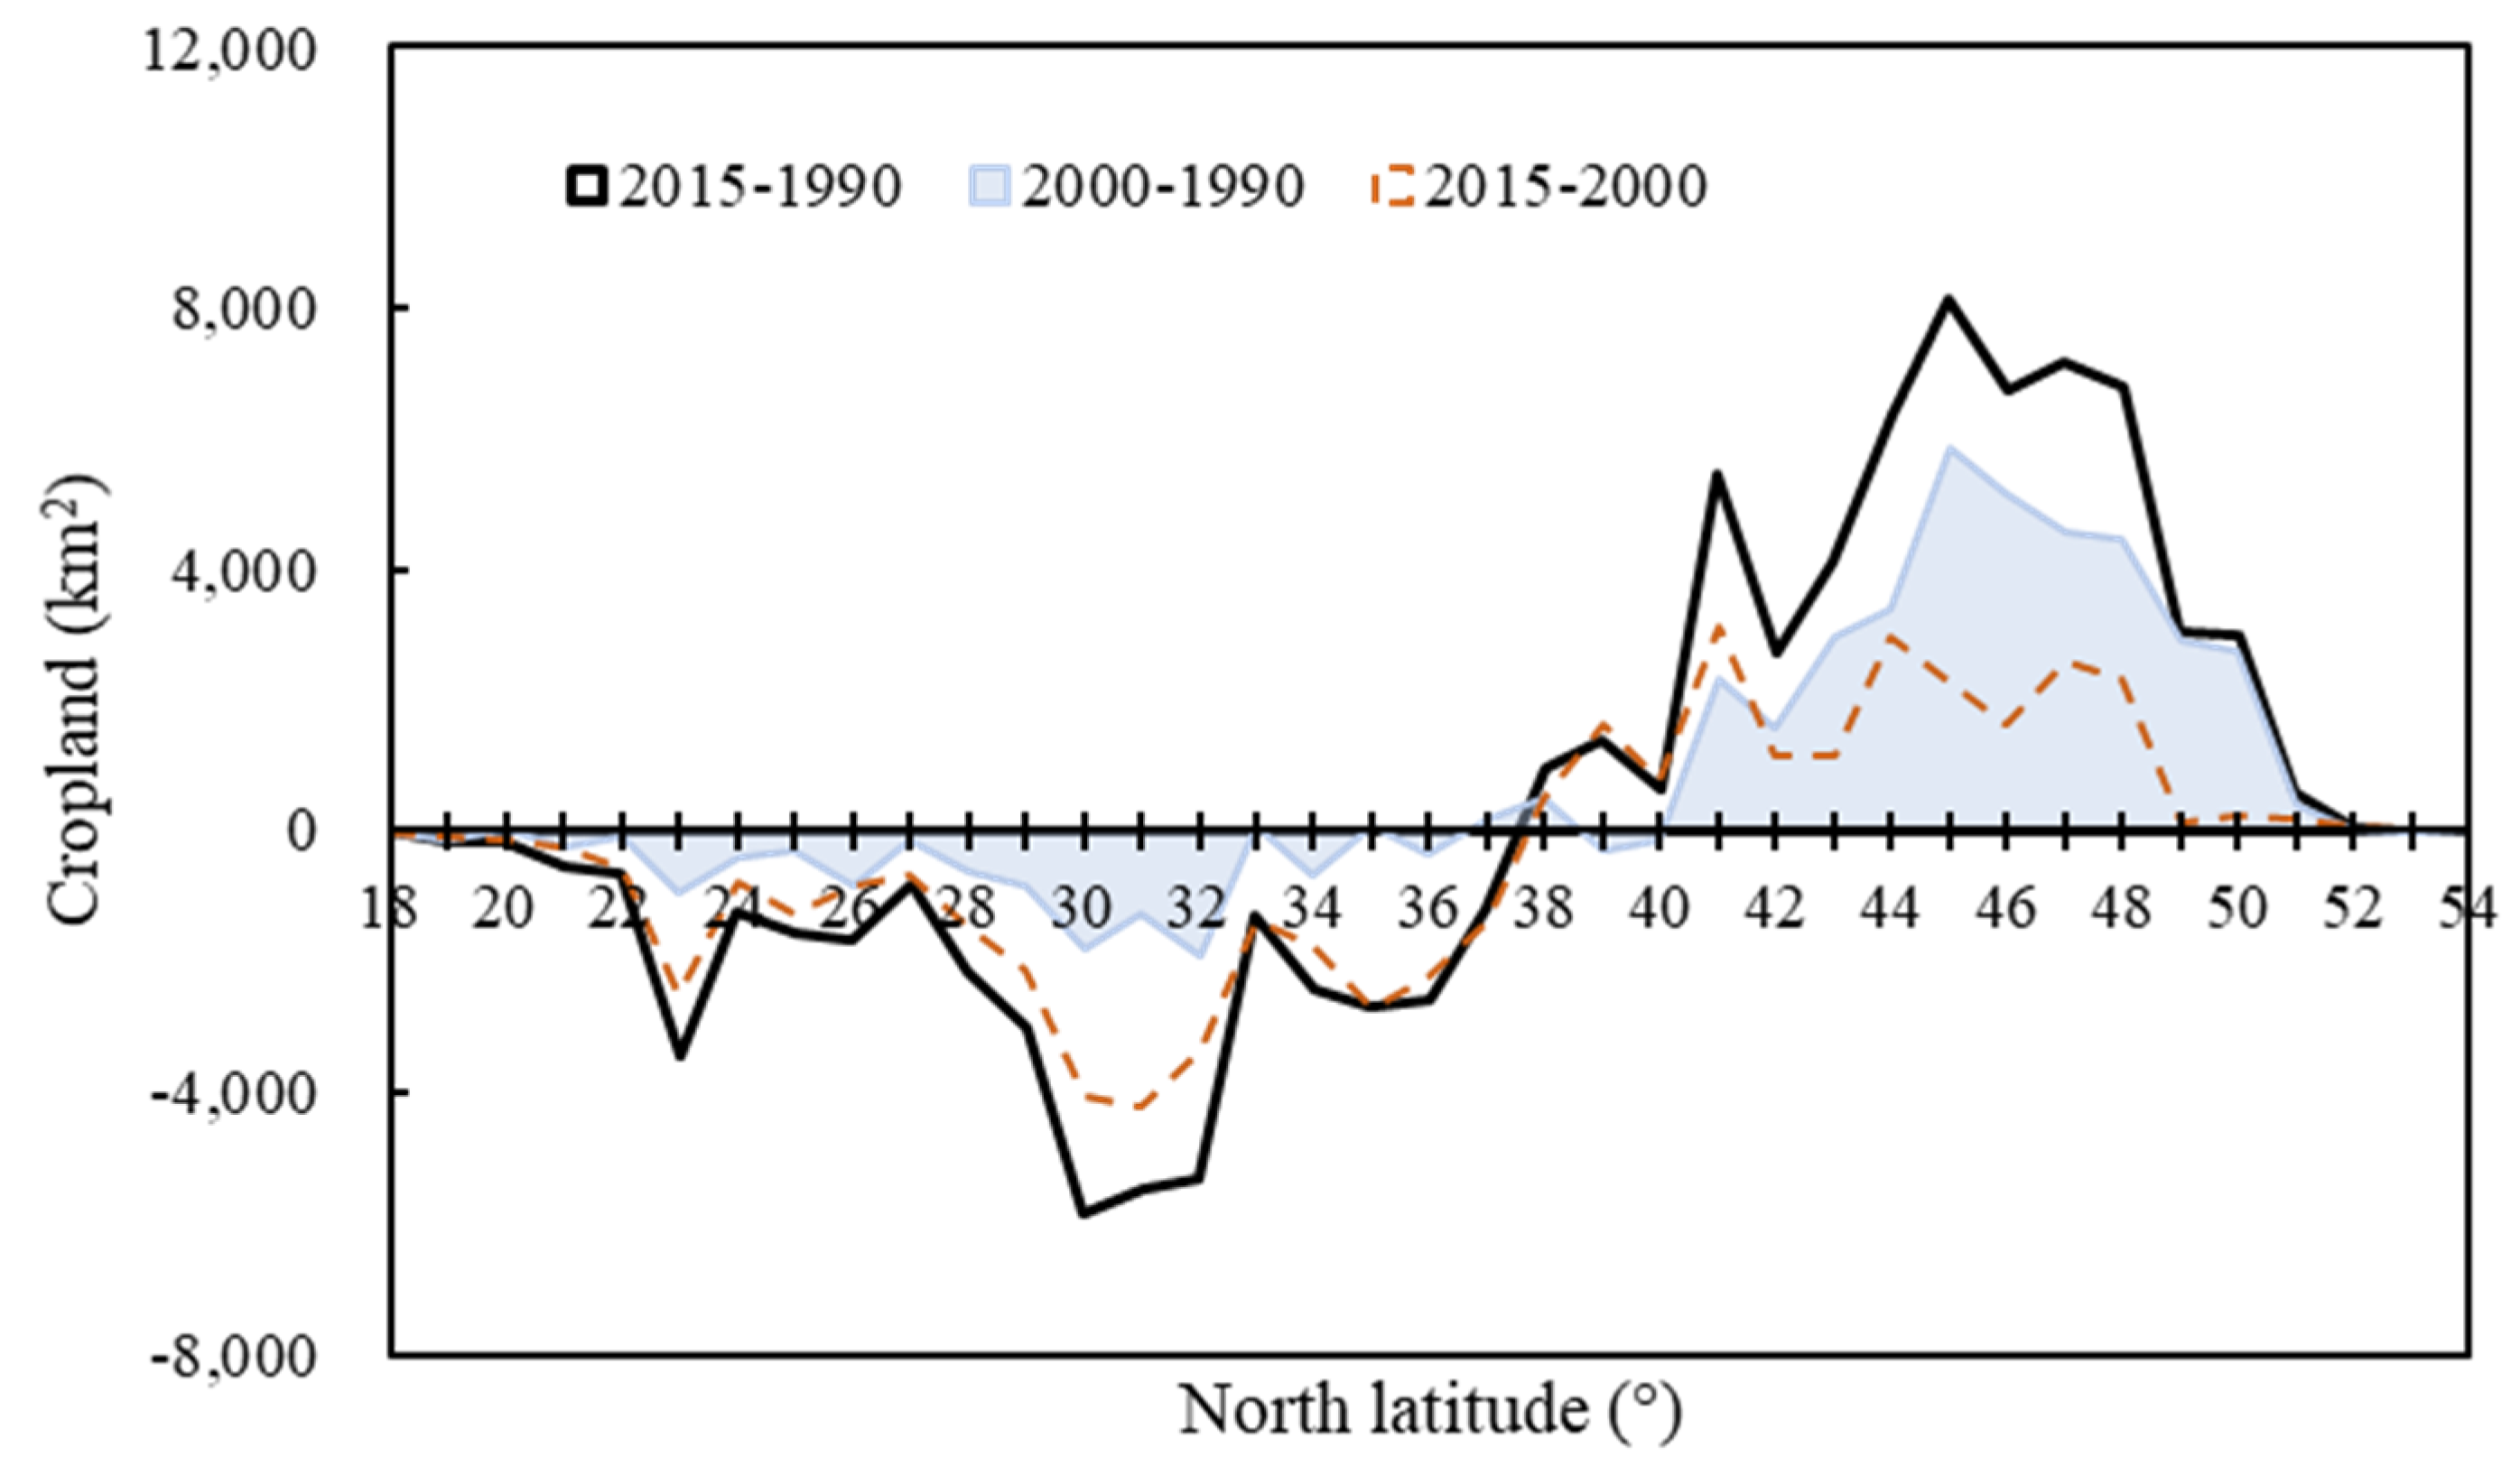
Figure 2b shows the change of cropland in each latitude zone from 1990 to 2015 in China. The results indicate that over the 25-year study period, the cropland in China showed a decreasing trend between 18° N and 37° N, whereas it increased between 38° N and 48° N, with the 38° N line as a break line. Moreover, 57,000 km2 of cropland was added from the 38° N line to the high latitude (towards the north), while 42,000 km2 of cropland reduced from the 38° N line to the low latitude (towards the south). Combined with the location of the 38° N line in Figure 1, the croplands in the entire south–central regions all decreased during this study period.

3.2. Temporal and Spatial Changes of Hydrothermal Conditions.

We analyzed the interannual variations of China’s hydrothermal conditions in two different aspects: (i) overall trend analysis, involving analysis of the overall changes in hydrothermal conditions over the 25-year study periods, which corresponded to the interannual variation during the study period (dashed line in Figure 3); and (ii) sliding trend analysis, in which, starting from 1990, a 13-year scale was used as the sliding window to analyze the subsequent trends among the sliding window intervals. The results of the sliding trend analysis clearly show the trends of hydrothermal conditions in each period (solid line in Figure 3).
Overall, the temperature increased significantly and its trend reached 0.02 °C/yr during 1990–2015. Especially in the early stage, the warming trends in the seven sliding windows from 1990 to 2008 were all more than 0.05 °C/yr. Subsequently, the temperature began to decline. In 1998–2010 and 1999–2011, the trend was still positive (~0.01 °C/yr), but in the four sliding windows after 2000, it showed cooling trends (Figure 3a). On the one hand, this result indicates that temperature change has a strong time-scale dependence. On the other hand, this also shows that the warming hiatus phenomenon was present in China since 1998. Compared with temperature, the precipitation trend was more complicated and fluctuated substantially. Although there was a decreasing trend during the whole study period, it did not show any clear linear characteristics. The sliding window analysis of different periods also showed that the precipitation was decreasing for most of the study period.
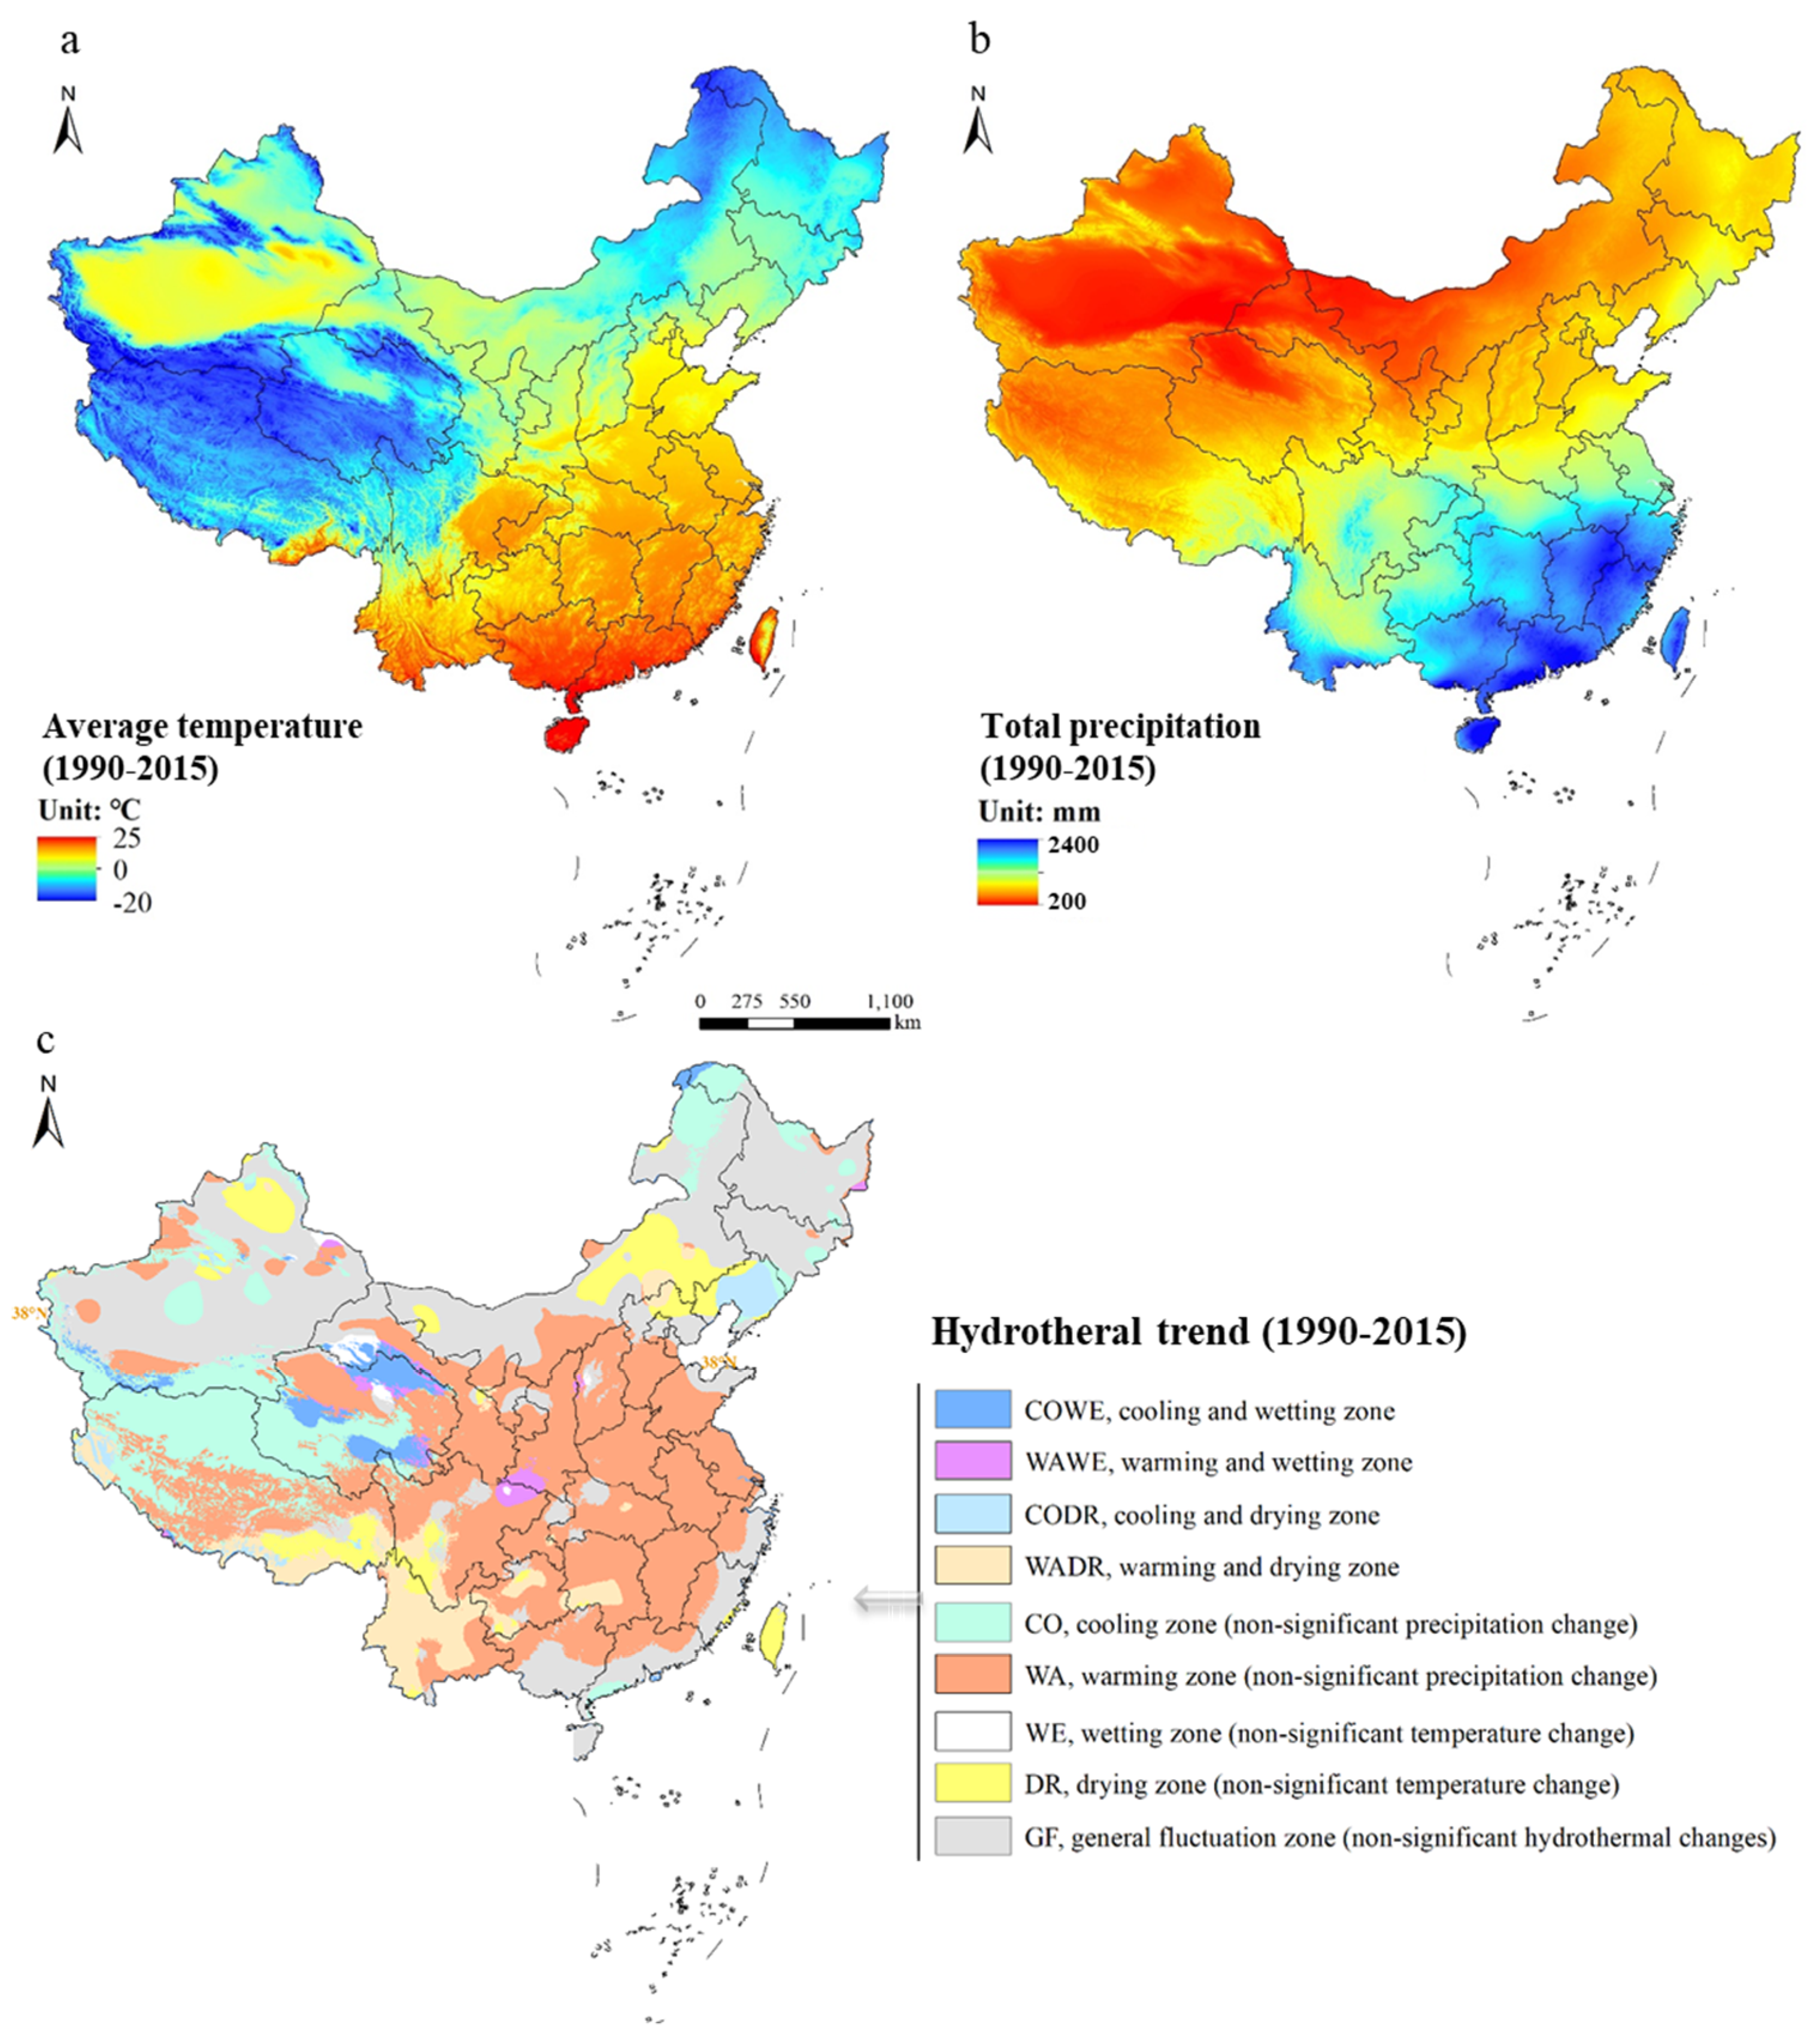
We also analyzed the spatial distribution and variation of temperature and precipitation. The temperature is mainly due to the latitudinal location and elevation and the temperature has an obvious spatial pattern in China. That is, Qinghai–Tibetan Plateau and some northern regions in Xinjiang and northeastern China had the lowest annual mean temperature, while the temperatures generally decreased from north to south in the rest regions of China (Figure 4a). In terms of precipitation, unlike temperature, the distribution pattern of precipitation was clear and simple in China. The precipitation distribution in most parts of China were gradually weakening from southeast to northwest (Figure 4b).
According to the interannual variations, this study created a spatial trend distribution map of hydrothermal conditions in China from 1990 to 2015. In the map, both temperature and precipitation were considered from the two aspects of the positive/negative trend (threshold value of 0) and the significance P test (threshold value of 0.1); then, the trends of temperature and precipitation were divided into warming/cooling zone and wetting/drying zone, respectively; Finally, on the basis of the change trends and significances in the hydrothermal condition, we obtained nine hydrothermal zones by overlay analysis: WAWE (warming and wetting zone), WADR (warming and drying zone), COWE (cooling and wetting zone), CODR (cooling and drying zone), WA (warming zone, non-significant precipitation change), CO (cooling zone, non-significant precipitation change), WE (wetting zone, non-significant temperature change), DR (drying zone, non-significant temperature change), and GF (general fluctuation zone, non-significant hydrothermal changes) (Figure 4c).
China has a variety of climate types, and its hydrothermal conditions also have a strong spatial differentiation. Most regions in China showed a warming trend, but in the Qinghai–Tibetan Plateau, Xinjiang, Liaoning, and northeastern Inner Mongolia, contiguous cooling zones remained. There were no significant changes in the hydrothermal conditions in southeastern coastal, northern, and northeastern China. From the perspective of the spatial pattern of the precipitation trend, the drying zones were mainly distributed in the Qinghai–Tibetan Plateau, Yunnan–Guizhou Plateau, Central Inner Mongolia, Northern Xinjiang, and Taiwan province. The simultaneous analysis on hydrothermal changes in China in the 25-year study period showed the characteristic of “warming and drying”. Except for the Qinghai–Tibetan Plateau and some southeastern regions, most of the central and southern regions in China had varying degrees of warming, or warming and drying (Figure 4).

3.3. Temporal and Spatial Changes of Solar Radiation

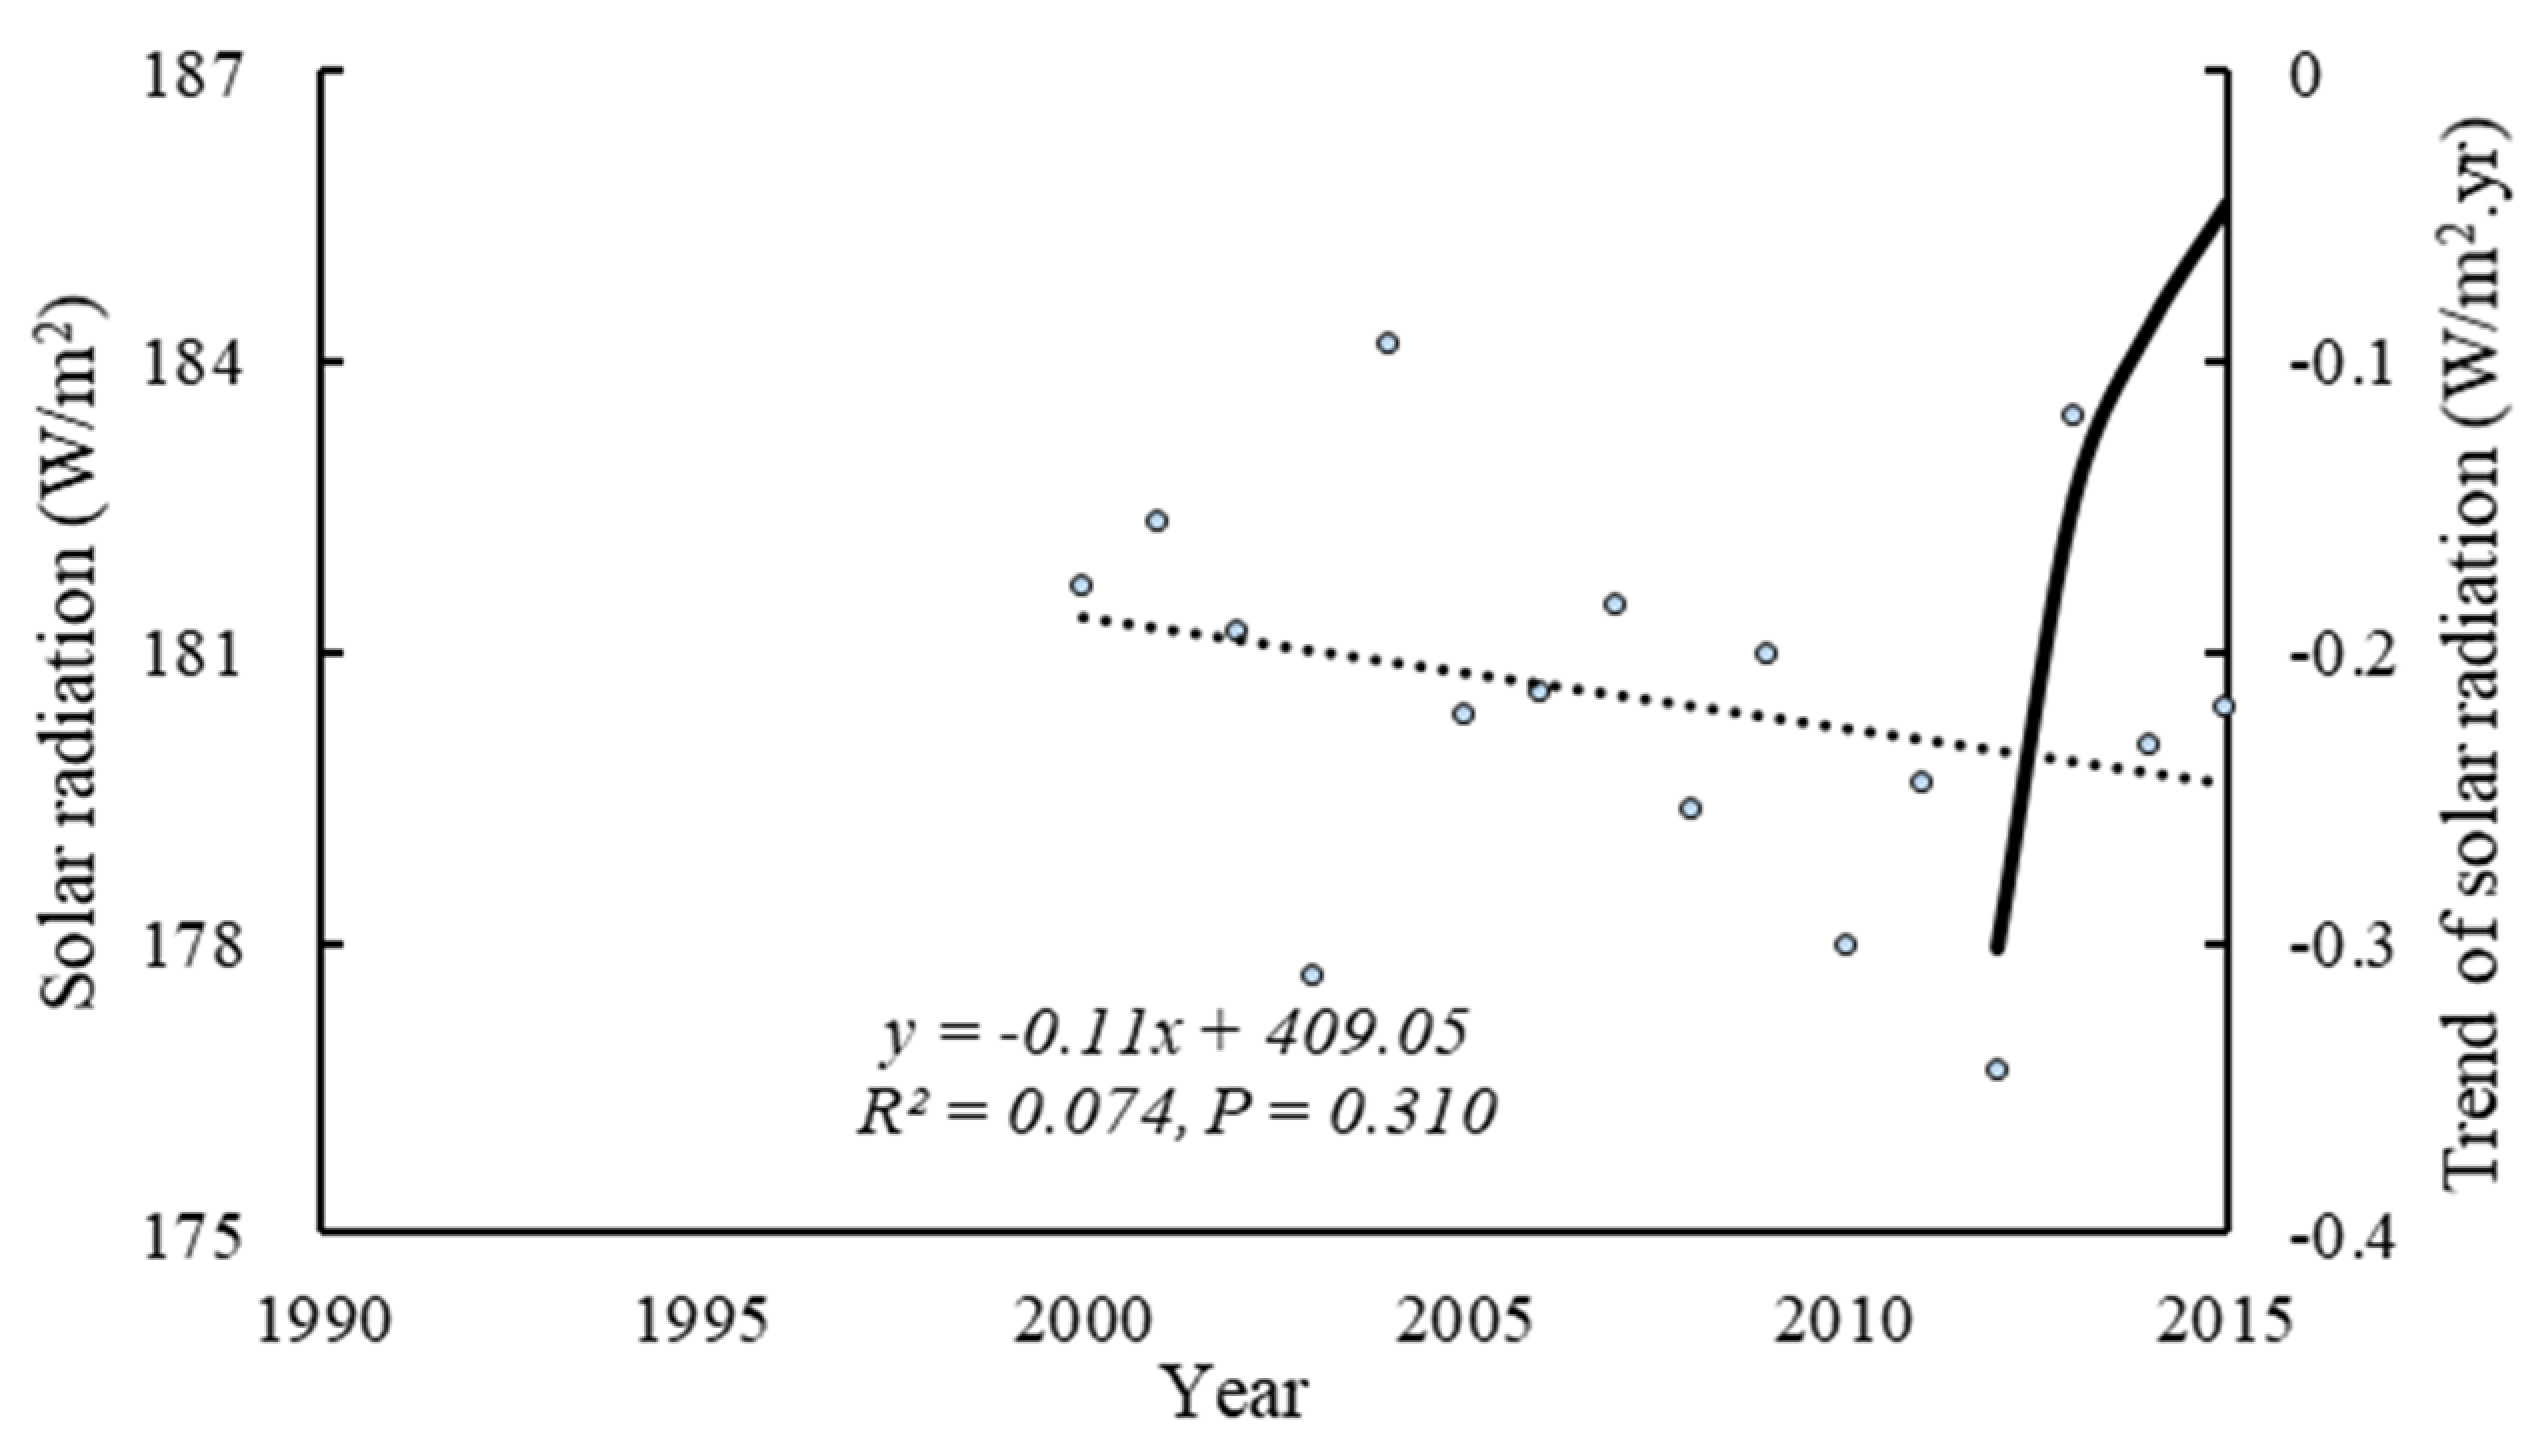
Solar radiation is the most important source of energy on Earth, and it is closely related to the growth of crops. China’s solar radiation showed a downward trend during 2000–2015, with an annual decline of −0.11 W/m2 and large annual fluctuations (Figure 5). The maximum and minimum values occurred in 2004 and 2012 at 184.17 and 176.67, respectively W/m2. The trends obtained with the 13-year sliding window since 2000 showed that although the trends of solar radiation decreased continually, the downward trends weakened rapidly, from −0.3 W/m2·yr in 2000–2012 to −0.05 W/m2·yr in 2003−2015.
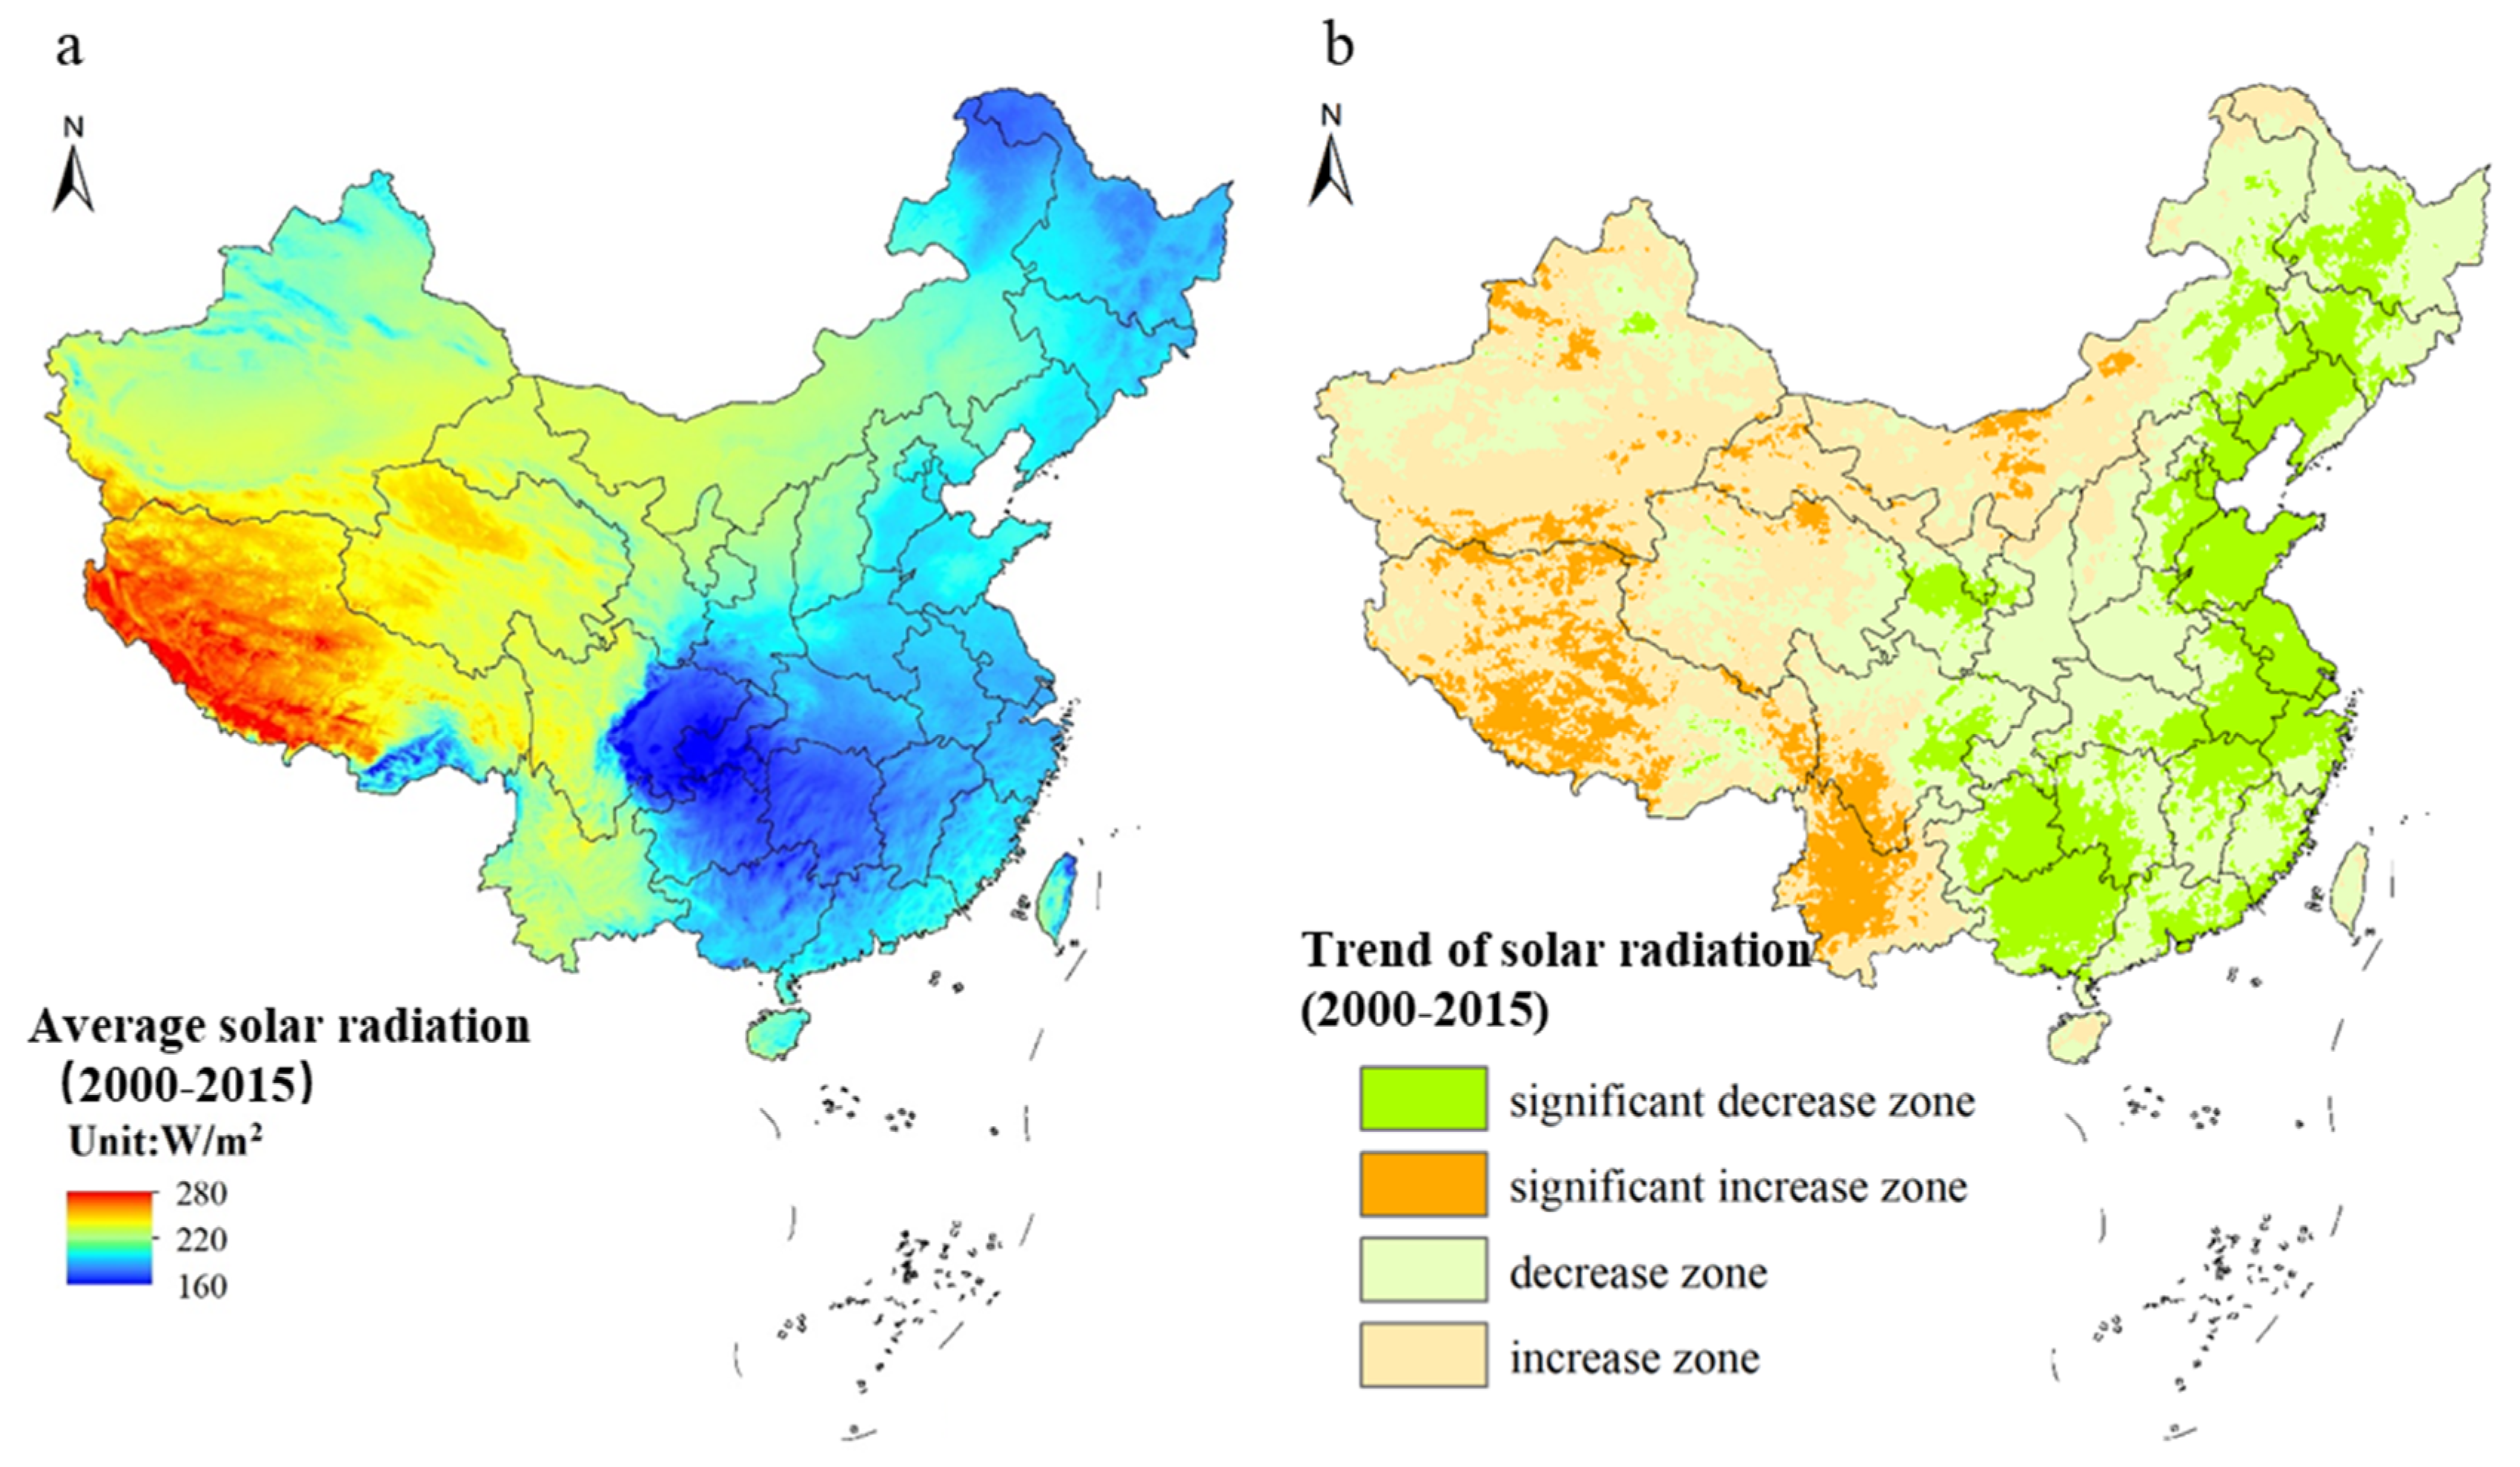
Solar radiation is affected by both atmospheric and surface conditions. China's annual mean solar radiation also showed a certain distributional characteristic in space (Figure 6a). The highest solar radiation was located in Southwestern regions in Tibet, while the lowest solar radiation was concentrated in Sichuan, Chongqing, Guizhou, and Jiangxi provinces. The highest value could exceed 270 W/m2 and the lowest value was less than 170 W/m2. Overall, from the Southeast to the Northwest, from Xinjiang to Tibet, solar radiation increased gradually.
In order to analyze the spatial change of solar radiation in China from 2000 to 2015, the radiation changes were divided into four zones. China’s radiation variation had very strong spatial characteristics: the central and eastern parts of the country decreased and the western part increased. Specifically, solar radiation increased significantly in Yunnan and the Qinghai–Tibetan Plateau, and increased greatly in Xinjiang, Qinghai, Sichuan, Inner Mongolia, and western Gansu. The radiation in some of the central and eastern regions, and the northeastern and southern parts of the country decreased significantly, and the remaining central and eastern provinces showed a slightly decreased trend. On the whole, the significant increase and increase zones accounted for 8.92% and 36.24% of the total area, respectively, whereas the significant decrease and decrease zones accounted for 18.90% and 35.95% of the total area, respectively (Figure 6b).

3.4. Changes in Hydrothermal and Radiation Conditions with the Cropland Dynamics

By observing the changes in cropland with hydrothermal and radiation conditions, we can reveal the relationships between cropland and climate conditions. In terms of temperature, the area of cropland showed a significant displacement with increasing temperature (Figure 7a). The cropland was mainly distributed at temperature of 8.0–12.5 °C. At around −2.0 °C, the area of cropland increased, while the area decreased sharply at 5.0–9.0 °C and then increased. Therefore, the area of cropland had a movement toward higher temperatures. The area of cropland also changed with the increase in precipitation (Figure 7b). The peak area of cropland was concentrated in the precipitation of 490–650 mm. Unlike the temperature, the peak area of cropland moved toward the low precipitation. Furthermore, the area of cropland declined in the high precipitation areas of 1300–1800 mm. Therefore, as a whole, the cropland is moving toward a region with high temperature and low precipitation, and thus the current situation of drought faced by cropland is more severe than before.
Analysis of the changes of solar radiation corresponding to the distribution of cropland showed that the cropland also had an obvious displacement with the increase of solar radiation (Figure 7c). The cropland area was concentrated between solar radiation values of 135–170 W/m2. In 2000, the peak of cropland area appeared at about 153 W/m2, but it was transferred to 145 W/m2 in 2015. Overall, cropland has moved towards regions with low solar radiation.
Furthermore, this study analyzed the supply of hydrothermal and radiation resources corresponding to the cropland, and the hydrothermal and radiation pressures faced by the cropland. The cropland decreased greatly in the warm zone of China from 1990 to 2015, reaching 27,900 km2, but it showed a significant growth trend in the general fluctuation zone (non-significant areas of temperature and precipitation change), increasing by 35,200 km2 from 1990 to 2015. In addition, the area of cropland decreased in warming and drying zones, cooling and wetting zones, and wetting zones; the area of cropland increased in warming and wetting zones, cooling and drying zones, cooling zones, and drying zones, especially in cooling zones and drying zones (Figure 8a). Correspondingly, there was a clear change in the cropland of the four zones of solar radiation in China during 2000–2015. In the zones where radiation significantly increased, the area of cropland was basically unchanged, whereas in zones where radiation significantly decreased, the area of cropland decreased by 18,800 km2. At the same time, the area of cropland increased by 0.96 million km2 in zones in which radiation had not significantly increased (Figure 8b).
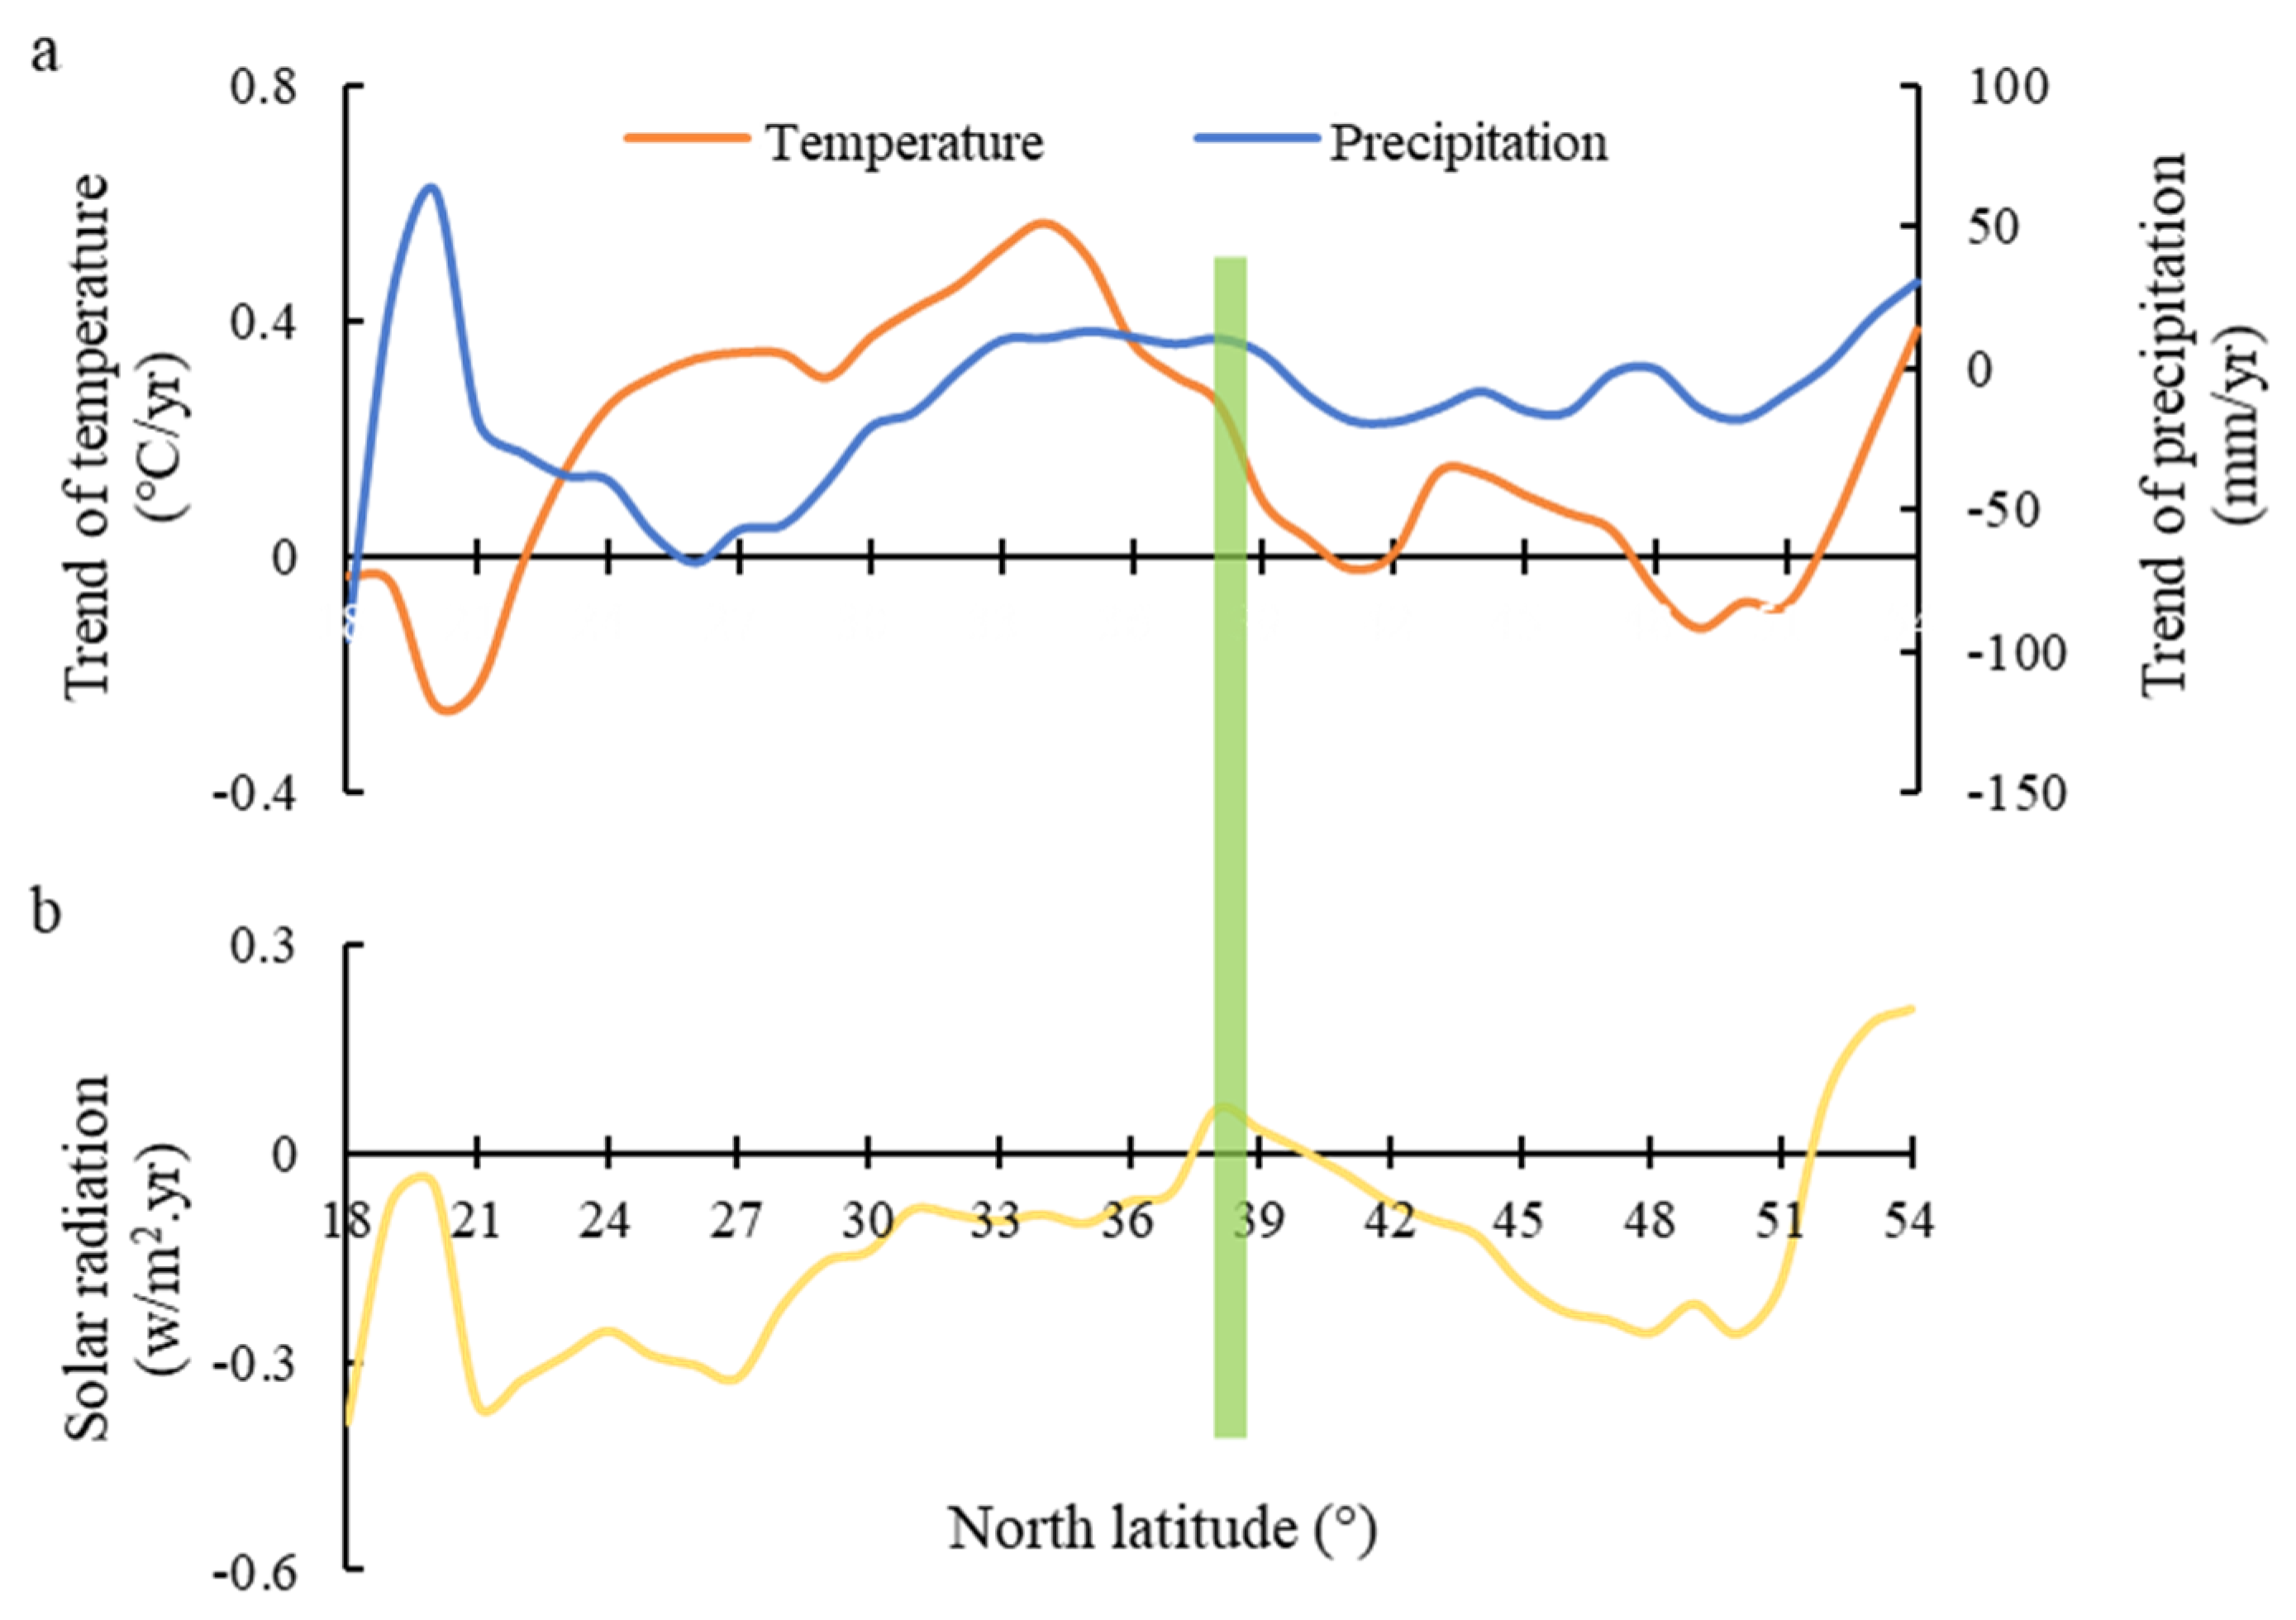
This study combined the characteristics of the northward shifting of cropland in China with the changes in hydrothermal and radiation conditions (Figure 9). During the study period, the temperature showed an increasing trend in most latitude zones except for the two latitude zones of 18° N–22° N and 47° N–52° N. Combined with the latitudinal characteristics of the cropland distribution (Figure 2), it was found that the proportion of cropland in both of these latitude zones were very small.
In addition, based on the 38° N line, the warming trends in the south latitude zones were substantially higher than those in the north latitude zones (Figure 9). The precipitation situation was different from that of temperature, and the overall trend fluctuated around zero. Moreover, the precipitation trend had a significant fluctuation in the 18° N–21° N zones but a significant decreasing trend in the 22° N–30° N zones. The trend of solar radiation was relatively consistent, and the trend value was less than 0 except for in the 38° N and 52° N–54° N zones. As a whole, the cropland in some southern regions was facing precipitation and radiation decline, and cropland in some in northern regions was facing the combined effects of low temperatures, low precipitation, and low radiation. Thus, the cropland has increased towards the north over the study period, which has led to severe multiple pressures such as unfavorable temperatures, precipitation, and radiation levels.

4. Discussion

4.1. Impact Factors of Cropland Dynamics

Unlike the study on the change of gravity center of cropland, this study quantified the latitudinal characteristics of cropland [24]. It should be noted that because the spatial resolution of the LULC data used was 1 km, the cropland grid of this study exaggerated the area because of the mixed pixels [12]. In addition, the break line of cropland change at different periods was not always at the line of 38° N. For example, the span of the increase/decrease transition between 1990 and 2000 was large, and very complicated fluctuations occurred in the zones of 33° N–40° N. Despite this, the increase and decrease of cropland during the entire study period showed a relatively clear break line at 38° N, whereas the hydrothermal and radiation conditions had not changed significantly around this latitude zone. These findings indicate that although natural climate factors have impacts on cropland, other factors including human activities are not negligible [20].
Global change, technological progress, market demand, urbanization, and the development of social economy in China since the 1990s have caused great changes to cropland [7]. Compared with the cropland areas in different periods, the new distribution pattern of cropland has had to face new conditions of hydrothermal and radiation resources. The area change of cropland in the first 10 years (1990–2000) accounted for a large proportion in comparison with the total area change of cropland during the study period. In particular, in the high latitude zones above 40° N, the area change of cropland from 1990 to 2000 accounted for about 70% of the whole area change (Figure 10). Correspondingly, the early warming trend was obvious, but with the global warming slowing or hiatus [25], the warming trend in northern China also began to slow down [19]. The change of cropland is uncertain because of the multiple impacts of policy guidance, economic trade, farming techniques and management, but it mainly expanded in the northern regions after ~2000 [6,20]. In the northeastern regions, plastic membrane mulching techniques are often used to supplement the low temperature [20] and irrigation or drip irrigation techniques are commonly used in Xinjiang and Inner Mongolia to compensate for the shortage of precipitation [26]. Conversely, the farms in southern regions are generally small in size and mostly distributed in hilly areas, and it is thus susceptible to ecological measures such as returning farmland to forests, grasslands, and lakes [27]. In addition, the urbanization and industrialization of the central and southern regions has developed rapidly, resulting in cropland abandonment [28]. This increase–decrease reversal around 38° N even reflects the north–south regional differences of China’s urbanization, agriculture and animal husbandry [29,30]. In short, although the interference of other factors on the dynamics of cropland is still very important, at a long-term scale, human activities can actively adapt to climate change, and the northward shifting of cropland corresponding to the background of climate warming partially reflects this adaptability.

4.2. Hydrothermal and Radiation Pressure of Cropland

The International Food and Agriculture Organization (FAO) defines food security in four aspects: sufficient supply, stable supply, affordable, and provision of nutrients for human health. Among them, the area and distribution pattern of cropland is not only the guarantee of a “sufficient supply” but also the land foundation for guaranteeing “stable supply” [1,12]. The area and distribution pattern of cropland are of great importance for evaluating the safety status of China’s food system [12]. Therefore, it is necessary to optimize the quantity and quality of cropland, improve the comprehensive agricultural productivity, and achieve safe and stable production of food.
Because of the influence of the background value of hydrothermal and radiation conditions and the differences in the demand for temperature, precipitation, and radiation among various crops [31], it is difficult to assess the climatic pressure of cropland. For example, although the average precipitation in some southern regions with abundantly initial precipitation decreases, it cannot be considered that the cropland causes the hydrothermal pressure. Correspondingly, this study made the following basic assumptions when discussing climate pressure of cropland: the stronger the radiation, the more precipitation, and the higher the temperature, the better the farming conditions [15,17,32,33,34]. The actual situation is often complicated, such as rising temperatures and reduced precipitation will lead to more severe drought [35,36]. Furthermore, the quality degradation of cropland is another factor that cannot be ignored [37]. Some studies have analyzed the occupation of cropland by urban expansion, and have clarified that the replaced croplands were often high-quality cropland with good farming conditions and high productivity [5,38]. This is, compared with the direct impact of urban expansion on cropland area, the new distribution pattern of cropland will have greater overall effect on cropland [8,12,39].
In addition, in order to make our data and results contribute to other sciences at a broader perspective, especially climate change and some engineering fields. We used a stretch display to show the spatial patterns of temperature, precipitation, and solar radiation so as to present more spatial details than the hierarchical maps. The temperature, precipitation, and solar radiation in this study are very consistent with other people's studies in the spatial pattern [40,41,42]. Moreover, the data of this study is expressive in space, which can effectively reflect the elevation and large landform details. Especially for solar radiation, other studies can reflect the larger pattern, and the data used in this study can reflect details on the grid scale, which can provide a certain practical role on the use of solar engineering within a local scale [42].

5. Conclusions

The temporal and spatial changes in cropland directly affect the security of food supply. This study systematically analyzed the dynamics of cropland in China from 1990 to 2015 and its corresponding changes in hydrothermal and solar radiation. China’s cropland showed a clear northward-shifting pattern in this 25-year period. With 38° N as the break line, cropland decreased in the south and increased in the north. However, as far as the total area of cropland is concerned, there has been little change, and it remained 1.77–1.8 million km2 for the majority of the studied period. The overall change of hydrothermal resources in China was characterized by an increase in temperature, but a decrease in precipitation and solar radiation. The area of cropland showed an obvious displacement with increasing temperature, precipitation, and radiation. In the context of climate change, China’s cropland is subject to a considerable climate pressure, especially the pressure of reduced precipitation and radiation.
Temperature, precipitation, and solar radiation are the primary climatic elements for assessing the farming conditions of cropland. This study clarified the changes of these basic elements corresponding to the dynamics of cropland, and provided scientific references for assessing human resource inputs for farming. In the future, we can combine the specific farming environment and crop types to explore the hydrothermal and radiation pressures faced by cropland.

Author Contributions

Conceptualization, Y.F., Y.C., and Y.Q.; methodology, Y.F., Y.C. and N.L.; software, Y.F.; formal analysis, Y.C., L.C., Y.F. and H.X.; writing–original draft preparation, Y.C. and Y.F.; writing–review and editing, Y.C.; supervision, Y.C. and Y.Q.; funding acquisition, Y.Q.

Funding

This research was funded by the Natural Science Foundation of China (41671425 and 41401504), Chinese National Key Basic Research Program (2014CB954302), HENU-CPGIS International Collaborative Fund (JOF201701), and Scientific Research Start-up Funding of Special Talent Zone in Henan University (Zhaodong Feng).

Acknowledgments

The authors acknowledge the Natural Resources and Environment Center, Chinese Academy of Sciences (http://www.resdc.cn/) and the Environmental Ecology Laboratory of Seoul National University (http://environment.snu.ac.kr/) for providing land use data and solar radiation data.

Conflicts of Interest

The authors declare no conflicts of interest. The funders had no role in the design of the study; in the collection, analyses, or interpretation of data; in the writing of the manuscript, or in the decision to publish the results.

References

  1. Anderson, K.; Strutt, A. Food security policy options for China: Lessons from other countries. Food Policy 2014, 49, 50–58. [Google Scholar] [CrossRef]
  2. Ministry of Science and Technology. Third National Assessment Report on Climate Change of China; Science Press: Beijing, China, 2015.
  3. Rounsevell, M.D.A.; Ewert, F.; Reginster, I.; Leemans, R.; Carter, T.R. Future scenarios of European agricultural land use. II. Projecting changes in cropland and grassland. Agric. Ecosyst. Environ. 2005, 107, 117–135. [Google Scholar] [CrossRef]
  4. Lee, H.L. The impact of climate change on global food supply and demand, food prices, and land use. Paddy Water Environ. 2009, 7, 321–331. [Google Scholar] [CrossRef]
  5. D’Amour, C.B.; Reitsma, F.; Baiocchi, G.; Barthel, S.; Güneralp, B.; Erb, K.-H.; Haberl, H.; Creutzig, F.; Seto, K.C. Future urban land expansion and implications for global croplands. Proc. Natl. Acad. Sci. USA 2017, 114, 8939–8944. [Google Scholar] [CrossRef] [PubMed]
  6. Liu, J.; Ning, J.; Kuang, W.; Xu, X.; Zhang, S.; Yan, C.; Li, R.; Wu, S.; Hu, Y.; Du, G. Spatiotemporal patterns and characteristics of land-use change in China during 2010–2015. J. Geogr. Sci. 2018, 28, 547–562. [Google Scholar]
  7. Liu, J.; Kuang, W.; Zhang, Z.; Xu, X.; Qin, Y.; Ning, J.; Zhou, W.; Zhang, S.; Li, R.; Yan, C. Spatiotemporal characteristics, patterns, and causes of land-use changes in China since the late 1980s. J. Geogr. Sci. 2014, 24, 195–210. [Google Scholar] [CrossRef]
  8. Chen, J. Rapid urbanization in China: A real challenge to soil protection and food security. Catena 2007, 69, 1–15. [Google Scholar] [CrossRef]
  9. Qin, Y.; Yan, H.; Liu, J.; Dong, J.; Chen, J.; Xiao, X. Impacts of ecological restoration projects on agricultural productivity in China. J. Geogr. Sci. 2013, 23, 404–416. [Google Scholar] [CrossRef]
  10. Guo, X.; Chang, Q.; Xiao, L.; Bao, H.; Zhang, Y.; Tu, X.; Zhu, C.; Lv, C.; Zhang, Y. Multi-dimensional eco-land classification and management for implementing the ecological redline policy in China. Land Use Policy 2018, 74, 15–31. [Google Scholar] [CrossRef]
  11. Deng, X.; Xu, D.; Qi, Y.; Zeng, M. Labor off-farm employment and cropland abandonment in rural China: Spatial distribution and empirical analysis. Int. J. Environ. Res. Public Health 2018, 15, 1808. [Google Scholar] [CrossRef]
  12. Cui, Y.; Liu, J.; Xu, X.; Dong, J.; Li, N.; Fu, Y.; Lu, S.; Xia, H.; Si, B.; Xiao, X. Accelerating Cities in an Unsustainable Landscape: Urban Expansion and Cropland Occupation in China, 1990–2030. Sustainability 2019, 11, 2283. [Google Scholar] [CrossRef]
  13. Wang, J.; Dong, J.; Yi, Y.; Lu, G.; Oyler, J.; Smith, W.; Zhao, M.; Liu, J.; Running, S. Decreasing net primary production due to drought and slight decreases in solar radiation in China from 2000 to 2012. J. Geophys. Res. Biogeosci. 2017, 122, 261–278. [Google Scholar] [CrossRef] [Green Version]
  14. Zhai, R.; Tao, F. Contributions of climate change and human activities to runoff change in seven typical catchments across China. Sci. Total Environ. 2017, 605, 219–229. [Google Scholar] [CrossRef] [PubMed]
  15. Li, J.; Cui, Y.; Liu, J.; Shi, W.; Qin, Y. Estimation and analysis of net primary productivity by integrating MODIS remote sensing data with a light use efficiency model. Ecol. Model. 2013, 252, 3–10. [Google Scholar] [CrossRef]
  16. Hamby, A.L. Estimation of solar radiation for use in crop modeling. Agric. For. Meteorol. 1998, 91, 293–300. [Google Scholar]
  17. Abraha, M.G.; Savage, M.J. Comparison of estimates of daily solar radiation from air temperature range for application in crop simulations. Agric. For. Meteorol. 2008, 148, 0–416. [Google Scholar] [CrossRef]
  18. Mu, J.E.; Mccarl, B.A.; Sleeter, B.; Abatzoglou, J.T.; Zhang, H. Adaptation with climate uncertainty: An examination of agricultural land use in the United States. Land Use Policy 2018, 77, 392–401. [Google Scholar] [CrossRef]
  19. Cui, Y.; Ning, X.; Qin, Y.; Xu, L.I.; Chen, Y. Spatio-temporal changes in agricultural hydrothermal conditions in China from 1951 to 2010. J. Geogr. Sci. 2016, 26, 643–657. [Google Scholar] [CrossRef] [Green Version]
  20. Dong, J.; Xiao, X.; Zhang, G.; Menarguez, M.A.; Choi, C.Y.; Qin, Y.; Luo, P.; Zhang, Y.; Moore, B. Northward expansion of paddy rice in northeastern Asia during 2000-2014. Geophys. Res. Lett. 2016, 43, 3754–3761. [Google Scholar] [CrossRef] [Green Version]
  21. Liu, J.; Liu, M.; Tian, H.; Zhuang, D.; Zhang, Z.; Zhang, W.; Tang, X.; Deng, X. Spatial and temporal patterns of China’s cropland during 1990-2000: An analysis based on Landsat TM data. Remote. Sens. Environ. 2005, 98, 442–456. [Google Scholar] [CrossRef]
  22. Hutchinson, M.F. Interpolation of rainfall data with thin plate smoothing splines. Part I: Two dimensional smoothing of data with short range correlation. J. Geogr. Inform. Decis. Anal. 1998, 2, 139–151. [Google Scholar]
  23. Jiang, C.; Ryu, Y. Multi-scale evaluation of global gross primary productivity and evapotranspiration products derived from Breathing Earth System Simulator (BESS). Remote Sens. Environ. 2016, 186, 528–547. [Google Scholar] [CrossRef]
  24. Liu, Y.; Li, J.; Yang, Y. Strategic adjustment of land use policy under the economic transformation. Land Use Policy 2018, 74, 5–14. [Google Scholar] [CrossRef]
  25. Knight, J.; Kennedy, J.; Folland, C.; Harris, G.; Jones, G.; Palmer, M.; Parker, D.; Scaife, A.; Stott, P. Do global temperature trends over the last decade falsify climate predictions. Bull. Am. Meteorol. Soc. 2009, 90, 22–23. [Google Scholar]
  26. Yamamoto, T.; Jalaldin, A.; Maimaidi, A.; Nagasawa, T. Land reclamation and water management in an arid region: A case study of Xayar county in Xinjiang Uygur autonomous region, China. WIT Trans. Ecol. Environ. 2010, 134, 3–14. [Google Scholar]
  27. Huang, L.; Shao, Q.; Liu, J. Forest restoration to achieve both ecological and economic progress, Poyang Lake basin, China. Ecol. Eng. 2012, 44, 53–60. [Google Scholar] [CrossRef]
  28. Wang, N.; Jiao, J.Y.; Jia, Y.F.; Bai, W.J.; Zhang, Z.G. Germinable Soil Seed Banks and the Restoration Potential of Abandoned Cropland on the Chinese Hilly-Gullied Loess Plateau. Environ. Manag. 2010, 46, 367–377. [Google Scholar] [CrossRef]
  29. Zou, Y.; Zhang, Z.; Zhou, Q.; Zhao, X. Land use change dynamics spatial pattern in ecotone between agriculture and animal husbandry and its driving force analysis. J. Nat. Resour. 2003, 2, 222–227. [Google Scholar]
  30. Wang, J.; Xu, X.; Liu, P. Landuse and land carrying capacity in ecotone between agriculture and animal husbandry in northern China. Res. Sci. 1999, 21, 21–26. [Google Scholar]
  31. Mueller, N.D.; Rhines, A.; Butler, E.E.; Ray, D.K.; Siebert, S.; Holbrook, N.M.; Huybers, P. Global relationships between cropland intensification and summer temperature extremes over the last 50 years. J. Clim. 2017, 30, 7505–7528. [Google Scholar] [CrossRef]
  32. Cui, Y. Preliminary estimation of the realistic optimum temperature for vegetation growth in China. Environ. Manag. 2013, 52, 151–162. [Google Scholar] [CrossRef] [PubMed]
  33. Wu, W.; Yu, Q.; You, L.; Chen, K.; Tang, H.; Liu, J. Global cropping intensity gaps: Increasing food production without cropland expansion. Land Use Policy 2018, 76, 515–525. [Google Scholar] [CrossRef]
  34. Demetriades-Shah, T.H.; Fuchs, M.; Kanemasu, E.T.; Flitcroft, I. A note of caution concerning the relationship between cumulated intercepted solar radiation and crop growth. Agric. For. Meteorol. 1992, 58, 193–207. [Google Scholar] [CrossRef]
  35. Jie, Z.; Mu, Q.; Huang, J. Assessing the remotely sensed Drought Severity Index for agricultural drought monitoring and impact analysis in North China. Ecol. Indic. 2016, 63, 296–309. [Google Scholar]
  36. Doughty, R.; Xiao, X.; Wu, X.; Yao, Z.; Bajgain, R.; Zhou, Y.; Qin, Y.; Zou, Z.; Mccarthy, H.; Friedman, J. Responses of gross primary production of grasslands and croplands under drought, pluvial, and irrigation conditions during 2010–2016, Oklahoma, USA. Agric. Water Manag. 2018, 204, 47–59. [Google Scholar] [CrossRef]
  37. Li, X.; Li, H.; Yang, L.; Ren, Y. Assessment of soil quality of croplands in the Corn Belt of Northeast China. Sustainability 2018, 10, 248. [Google Scholar] [CrossRef]
  38. Song, W.; Liu, M. Farmland conversion decreases regional and national land quality in China. Land Degrad. Dev. 2017, 28, 459–471. [Google Scholar] [CrossRef]
  39. Seto, K.C.; Ramankutty, N. Hidden linkages between urbanization and food systems. Science 2016, 352, 943–945. [Google Scholar] [CrossRef]
  40. Liu, J.; Zhuang, D.; Luo, D.; Xiao, X. Land-cover classification of china: Integrated analysis of avhrr imagery and geophysical data. Int. J. Remote Sens. 2003, 24, 2485–2500. [Google Scholar] [CrossRef]
  41. Lu, Y.; Jiang, S.; Ren, L.; Zhang, L.; Wang, M.; Liu, R.; Wei, L. Spatial and temporal variability in precipitation concentration over mainland China, 1961–2017. Water 2019, 11, 881. [Google Scholar] [CrossRef]
  42. Kabir, E.; Kumar, P.; Kumar, S.; Adelodun, A.A.; Kim, K.H. Solar energy: Potential and future prospects. Renew. Sustain. Energy Rev. 2017, 82, 894–900. [Google Scholar] [CrossRef]
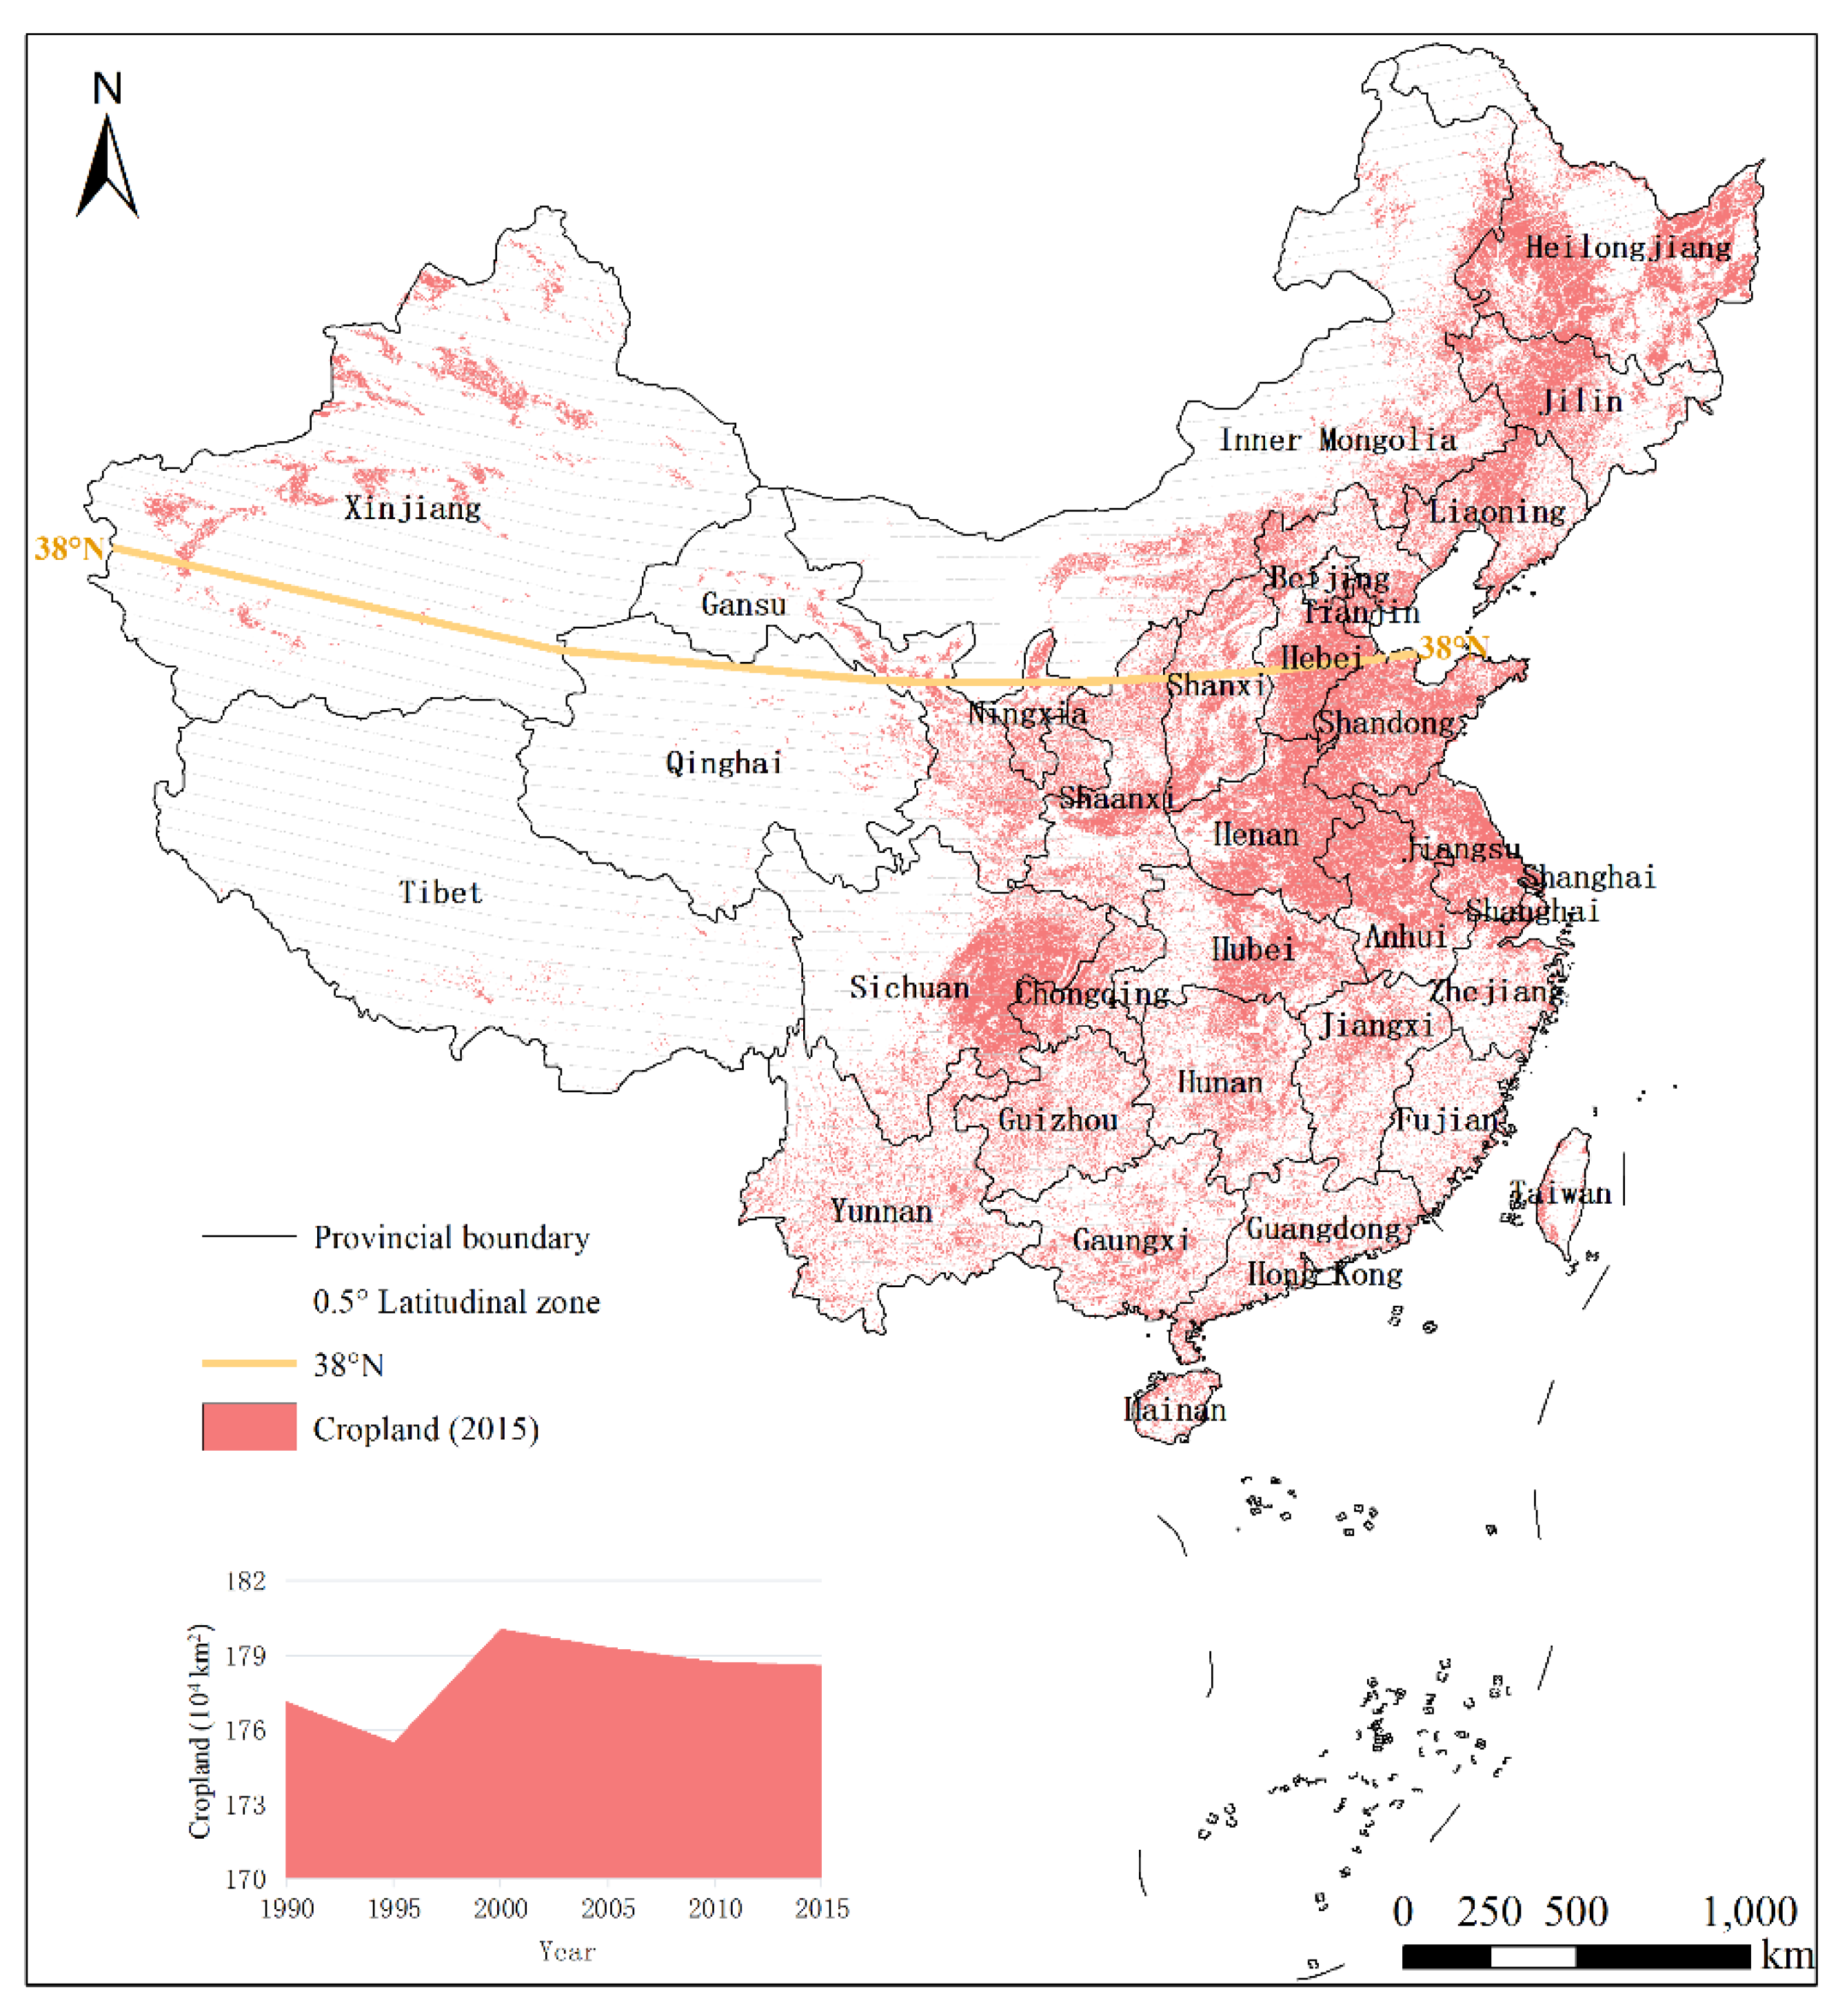
Figure 1. Spatial pattern (2015) and area change of cropland in China.
Sustainability 11 03762 g001
Figure 2. Spatial changes of cropland area with latitude in China. (a) Multi-year changes of cropland area with latitude from 1990 to 2015; (b) increment and decrement of cropland area with latitude.
Sustainability 11 03762 g002
Figure 3. Annual changes of temperature (a) and precipitation (b) in China during 1990–2015.
Sustainability 11 03762 g003
Figure 4. Spatial pattern of annual temperature (a), precipitation (b), and hydrothermal trend (c) from 1990 to 2015 in China.
Sustainability 11 03762 g004
Figure 5. Annual changes of solar radiation during 2000−2015 in China.
Sustainability 11 03762 g005
Figure 6. Spatial pattern of annual mean (a) and trend (b) of solar radiation during 2000–2015 in China.
Sustainability 11 03762 g006
Figure 7. Transfers of temperature (a), precipitation (b), and solar radiation (c) conditions corresponding to croplands in China.
Sustainability 11 03762 g007
Figure 8. Change of cropland under different hydrothermal (a) and radiative (b) trends in China. WAWE, warming and wetting zone; WADR, warming and drying zone; COWE, cooling and wetting zone; CODR, cooling and drying zone; WA, warming zone with non-significant precipitation change; CO, cooling zone with non-significant precipitation change; WE, wetting zone with non-significant temperature change; DR, drying zone with non-significant temperature change; GF, general fluctuation zone with non-significant hydrothermal changes.
Sustainability 11 03762 g008
Figure 9. Latitudinal characteristics of changes in different hydrothermal (a) and radiative (b) conditions in China.
Sustainability 11 03762 g009
Figure 10. Comparison of cropland changes in different periods (2000–1990, 2015–2000, 2015–1990).
Sustainability 11 03762 g010