R&D, Advertising and Firms’ Financial Performance in South Korea: Does Firm Size Matter?


Abstract
:1. Introduction
2. Literature Review
2.1. R&D and Advertising
2.2. R&D and Advertising Expenditures and Financial Performance
2.3. Firm Size Effect
3. Hypotheses Development
4. Methodology
4.1. Data Collection
4.2. Variables
4.3. Model Specification
5. Results
5.1. Descriptive Statistics
5.2. Correlation Analysis
5.3. Estimation Results
5.4. Robustness Check
5.5. Additional Analysis on the Duration of R&D and Advertising
6. Conclusions
Author Contributions
Funding
Acknowledgments
Conflicts of Interest
References
- Chauvin, K.W.; Hirschey, M. Advertising, R&D expenditures and the market value of the firm. Financ. Manag. 1993, 22, 128–140. [Google Scholar]
- Wernerfelt, B. A resource-based view of the firm. Strateg. Manag. J. 1984, 5, 171–180. [Google Scholar] [CrossRef]
- Henri, J.F. Management control systems and strategy: A resource-based perspective. Account. Org. Soc. 2006, 31, 529–558. [Google Scholar] [CrossRef]
- Han, B.H.; Manry, D. The value-relevance of R&D and advertising expenditures: Evidence from Korea. Int. J. Account. 2004, 39, 155–173. [Google Scholar]
- Peterson, R.A.; Jeong, J. Exploring the impact of advertising and R&D expenditures on corporate brand value and firm-level financial performance. J. Acad. Mark. Sci. 2010, 38, 677–690. [Google Scholar]
- Bhagwat, Y.; DeBruine, M. R&D and advertising efficiencies in the pharmaceutical industry. Int. J. Appl. Econ. 2011, 8, 55–65. [Google Scholar]
- Sridhar, S.; Narayanan, S.; Srinivasan, R. Dynamic relationships among R&D, advertising, inventory and firm performance. J. Acad. Mark. Sci. 2014, 42, 277–290. [Google Scholar]
- Peng, C.; Wei, A.; Chen, M.; Huang, W. Synergy between R&D and advertising on shareholder value: Does firm size matter? Can. J. Adm. Sci. 2018, 35, 47–64. [Google Scholar]
- Sung, J.K.; Park, J.; Yoo, S. Exploring the impact of strategic emphasis on advertising versus R&D during stock market downturns and upturns. J. Bus. Res. 2019, 94, 56–64. [Google Scholar]
- McAlister, L.; Srinivasan, R.; Kim, M. Advertising, research and development, and systematic risk of the firm. J. Mark. 2007, 71, 35–48. [Google Scholar] [CrossRef]
- Chen, M.L.; Peng, C.L.; Wei, A.P. Advertising, research and development, and capital market risk: Higher risk firms versus lower risk firms. J. Bus. Econ. Manag. 2012, 13, 724–744. [Google Scholar] [CrossRef]
- Bublitz, B.; Ettredge, M. The information in discretionary outlays: Advertising, research, and development. Account. Res. 1989, 64, 108–124. [Google Scholar]
- Lantz, J.S.; Sahut, J.M. R&D investment and the financial performance of technological firms. Int. J. Bus. 2005, 10, 251–270. [Google Scholar]
- Steenkamp, J.B.E.M.; Fang, E. The impact of economic contractions on the effectiveness of R&D and advertising: Evidence from U.S. companies spanning three decades. Market. Sci. 2011, 30, 628–645. [Google Scholar]
- Min, B.S.; Smyth, R. How does leverage affect R&D intensity and how does R&D intensity impact on firm value in South Korea? Appl. Econ. 2016, 48, 5667–5675. [Google Scholar]
- Askenazy, P.; Breda, T.; Irac, D. Advertising and R&D: Theory and evidence from France. Econ. Innov. New Tech. 2016, 25, 33–56. [Google Scholar]
- Kim, J.Y. The effect of adopting K-IFRS on financial reports-Case study with KT&G. Int. J. Multimed. Ubiquitous Eng. 2013, 8, 205–212. [Google Scholar]
- Pindado, J.; de Queiroz, V.; de la Torre, C. How do firm characteristics influence the relationship between R&D and firm value? Financ. Manage. 2010, 39, 757–782. [Google Scholar]
- Scherer, F.M.; Ross, D. Industrial Market Structure and Economic Performance; Houghton Mifflin: Boston, MA, USA, 1990. [Google Scholar]
- Li, C.W. An Empirical Study on the Predictability of R&D Costs and Advertising Expenditures to the Accounting Income. Ph.D. Thesis, Dankook University, Yongin-si, Korea, 1994. [Google Scholar]
- Heo, S.H. R&D expenditures, Advertising Expenditures and Firm Valuation of KOSDAQ Securities. Master’s Thesis, Kyung Hee University, Seoul, Korea, 2002. [Google Scholar]
- Zhang, R.; Fu, X.F. Analysis for optimal R&D and advertising investment strategies. Sci. Technol. Prog. Policy 2010, 27, 86–90. (In Chinese) [Google Scholar]
- Connolly, R.A.; Hirschey, M. R&D, market structure, and profits: A value-based approach. Rev. Econ. Stat. 1984, 66, 682–686. [Google Scholar]
- Farber, S.C. Buyer market structure and R&D effort: A simultaneous equations model. Rev. Econ. Stat. 1981, 63, 336–345. [Google Scholar]
- Nakao, T. Market share, advertising, R&D, and profitability: An empirical analysis of leading industrial firms in Japan. Rev. Ind. Organ. 1993, 8, 315–328. [Google Scholar]
- Ren, H.Y. Research on the Value Relevance of Advertising Expenditure and R&D Expenditure. Sci. Res. Manag. 2014, 35, 153–160. (In Chinese) [Google Scholar]
- Graevenitz, G.V.; Sandner, P. Are Advertising and R&D Complements? Available online: https://ssrn.com/abstract=1443415 (accessed on 17 June 2019).
- Chen, Y.H.; Nie, P.Y.; Peng, B.Y. Advertising and R&D innovation under debt constraint. Chin. J. Manag. Sci. 2015, 23, 142–149. (In Chinese) [Google Scholar]
- Paton, D. Advertising, quality and sales. Appl. Econ. 2002, 34, 431–438. [Google Scholar] [CrossRef]
- Nakao, T. Profitability, market share, product quality, and advertising in oligopoly. J. Econ. Dyn. Control 1983, 6, 153–171. [Google Scholar] [CrossRef]
- Hirschey, M.; Weygandt, J.J. Amortization policy for advertising and research and development expenditures. J. Account. Res. 1985, 23, 326–335. [Google Scholar] [CrossRef]
- Hall, B.H. The stock market’s valuation of R&D investment during the 1980’s. Am. Econ. Rev. 1993, 83, 259–264. [Google Scholar]
- Andras, T.L.; Srinivasan, S.S. Advertising intensity and R&D intensity: Differences across industries and their impact on firm’s performance. Int. J. Bus. Econ. 2003, 2, 167–176. [Google Scholar]
- Li, Q.Y. R&D and advertising expenditures: Expensing or capitalization-Empirical evidence from manufacturing listed corporations in China. Commun. Finan. Account. Acad. Version. 2006, 10, 3–7. (In Chinese) [Google Scholar]
- Xing, S.; Yang, Y. An empirical study on R&D, advertising investment and main operating profit of traditional Chinese medicine. Chin. J. Pharm. 2009, 40, 474–476. (In Chinese) [Google Scholar]
- Ma, Y.Y.; Zhang, X.L.; Lu, Y.W. R&D expenditure, advertising expenditure, and enterprise economic performance: Based on empirical analysis of Chinese manufacturing sub-sectors. J. Dalian Univ. Technol. Soc. Sci. 2015, 36, 30–34. (In Chinese) [Google Scholar]
- Chan, S.H.; Martin, J.D.; Kensinger, J.W. Corporate research and development expenditures and share value. J. Financ. Econ. 1990, 26, 255–276. [Google Scholar] [CrossRef]
- Doukas, J.; Switzer, L. The stock market’s valuation of R&D spending and market concentration. J. Econ. Bus. 1992, 44, 95–114. [Google Scholar]
- Cho, S.P.; Lim, K.; Kwon, G.J.; Sung, Y.H. R&D investment and performance in Korea: Korean R&D scoreboard 2005. Asian, J. Technol. Innov. 2008, 16, 143–160. [Google Scholar]
- Depken, C.A.; Snow, A. The strategic nature of advertising in segmented markets. Appl. Econ. 2008, 40, 2987–2994. [Google Scholar] [CrossRef]
- Mai, Y.Y.; Li, Y. Impact of advertising and R&D expenditures on brand equity of new ventures. Sci. Res. Manag. 2016, 37, 137–144. (In Chinese) [Google Scholar]
- Fogg-Meade, E. The place of advertising in modern business. J. Political Econ. 1901, 9, 218–242. [Google Scholar] [CrossRef]
- Jin, Z.J.; Shang, Y.; Xu, J. The impact of government subsidies on private R&D and firm performance: Does ownership matter in China’s manufacturing industry. Sustainability 2018, 10, 2205. [Google Scholar]
- Gómez, J.; Vargas, P. Intangible resources and technology adoption in manufacturing firms. Res. Policy 2012, 41, 1607–1619. [Google Scholar] [CrossRef]
- Shim, D.; Kim, J.G.; Altmann, J. Strategic Managment of R&D and marketing integration for multi-dimensional success of new product developments: An empirical investigation in the Korean ICT industry. Asian J. Technol. Innov. 2016, 24, 293–316. [Google Scholar]
- Zhu, G.L.; Zhang, Y.; Chen, K.H.; Yu, J. The impact of R&D intensity on firm performance in an emerging market: Evidence from China’s electronics manufacturing firms. Asian J. Technol. Innov. 2017, 25, 41–60. [Google Scholar]
- Xu, J.; Sim, J.W. Characteristics of corporate R&D investment in emerging markets: Evidence from manufacturing industry in China and South Korea. Sustainability 2018, 10, 3002. [Google Scholar]
- Mavrommati, A.; Papadopoulos, A. Measuring advertising intensity and intangible capital in the Greek food industry. Appl. Econ. 2005, 37, 1777–1787. [Google Scholar] [CrossRef]
- Doraszelski, U.; Markovich, S. Advertising dynamics and competitive advantage. RAND J. Econ. 2007, 38, 557–592. [Google Scholar] [CrossRef]
- Das, B.J.; Chappell, W.F.; Shughartii, W.F. Advertising, competition and market share instability. Appl. Econ. 1993, 25, 1409–1412. [Google Scholar] [CrossRef]
- Jeong, J. Advertising vs. R&D: Relative effectiveness on brand equity. S. Afr. J. Bus. Manag. 2015, 46, 31–42. [Google Scholar]
- Kang, T.; Baek, C.; Lee, J.D. R&D activities for becoming a high-growth firm through large jumps: Evidence from Korean manufacturing. Asian J. Technol. Innov. 2018, 26, 222–245. [Google Scholar]
- Kang, H.; Mah, J.S. R&D policy for small and medium-sized enterprises in Korea. Sci. Technol. Soc. 2015, 20, 1–20. [Google Scholar]
- Sun, W.F.; Huang, Z.H. Advertising expenditure, R&D expenditure, and firm performance. Sci. Res. Manag. 2013, 34, 44–51. (In Chinese) [Google Scholar]
- Eng, L.L.; Keh, H.T. The effects of advertising and brand value on future operating and market performance. J. Advert. 2007, 36, 91–100. [Google Scholar] [CrossRef]
- Luo, Y.J.; Chen, X.; He, L.T. The relations among social donation, advertising expenditure and performance of Chinese agricultural listed companies. J. Anhui Agric. Univ. Soc. 2016, 25, 44–49. (In Chinese) [Google Scholar]
- Zhang, H.; Li, L.; Zhou, D.; Zhou, P. Political connections, government subsidies and firm financial performance: Evidence from renewable energy manufacturing in China. Renew. Energy 2014, 63, 330–336. [Google Scholar] [CrossRef]
- Ho, Y.K.; Keh, H.T.; Ong, J.M. The effects of R&D and advertising on firm value: An examination of manufacturing and nonmanufacturing firms. IEEE Trans. Eng. Mana. 2005, 52, 3–14. [Google Scholar]
- Tokic, D. R&D, advertising and the market value of Internet firms: Part II. J. Internet Commer. 2005, 4, 23–40. [Google Scholar]
- Jung, K.O.; Chang, W.K.; Kim, Y.Y. The relationships between R&D, advertising expenses and the market value of the firms in Korean manufacturing industry. Korean J. Bus. Adm. 2005, 18, 1851–1867. (In Korean) [Google Scholar]
- Qiao, J. R&D and ad impact on the efficiency of enterprise technology research: Based on an empirical analysis of the food Industry Listed Companies in China. Nanjing J. Soc. Sci. 2015, 4, 23–29. (In Chinese) [Google Scholar]
- He, F.; Chen, R. R&D, advertising and firm technical efficiency: An empirical analysis on Chinese and Japanese household appliance industry. Int. J. Serv. Technol. Manag. 2011, 16, 107–122. [Google Scholar]
- Kim, P.R. R&D and firm sizes in the information and telecommunication industry of Korea. Small Bus. Econ. 2000, 15, 183–192. [Google Scholar]
- Dong, X.Q.; Zhao, J.; Yuan, P.W. A study on the relationship between enterprise scale and technological innovation capacity. J. Beijing Jiaotong Univ. 2013, 12, 40–46. (In Chinese) [Google Scholar]
- Jo, I.S.; Choi, N.S. An empirical study about value-relevance of R&D costs and advertising expenses-A comparative analysis between KOSDAQ venture companies and KOSDAQ general companies. Korea Int. Account. Rev. 2005, 13, 111–137. (In Korean) [Google Scholar]
- Li, Q.J.; Yin, S. Corporate social responsibility, advertising investment and enterprise value: Agricultural listed companies as samples. J. China Agric. Univ. 2015, 20, 281–287. (In Chinese) [Google Scholar]
- Tsai, S.C. Valuation of R&D and advertising expenditures. J. Contemp. Account. 2001, 2, 40–74. [Google Scholar]
- Lunn, J. R&D, concentration and advertising: A simultaneous equations model. Manag. Decis. Econ. 1989, 10, 101–105. [Google Scholar]
- Tang, E.Z. The relationship between advertising tactic and R&D strategy of enterprises in China. Res. Inst. Econ. 2017, 2, 87–110. (In Chinese) [Google Scholar]
- Song, T.B.; Zhong, X.; Chen, W.H.; Wu, X.J. R&D investment or advertising investment?–Choice of strategic behavior of firms in poor performance. R D Manag. 2018, 30, 12–21. (In Chinese) [Google Scholar]
- Reekie, W.D.; Bhoyrub, P. Profitability and intangible assets: Another look at advertising and entry barriers. Appl. Econ. 1981, 13, 99–107. [Google Scholar] [CrossRef]
- Currim, I.S.; Lim, J.; Kim, J.W. You get what you pay for: The impact of top executives’ compensation on advertising and R&D spending decisions and stock market return. J. Mark. 2012, 76, 33–48. [Google Scholar]
- Xiao, S.S.; Jeong, I.; Moon, J.J.; Chung, C.C.; Chung, J. Internationalization and performance of firms in China: Moderating effects of governance structure and the degree of centralized control. J. Int. Manag. 2013, 19, 118–137. [Google Scholar] [CrossRef]
- Hirschey, M.; Spencer, R.S. Size effects in the market valuation of fundamental factors. Financ. Anal. J. 1992, 48, 91–95. [Google Scholar] [CrossRef]
- Boulding, W.; Staelin, R. Identifying generalizable effects of strategic actions on firm performance: The case of demand-side returns to R&D spending. Mark. Sci. 1995, 14, G222–G236. [Google Scholar]


| Variable | Definition | Measurement |
|---|---|---|
| ROA | Firm performance | Net income divided by the average total assets |
| RD | R&D intensity | Annual R&D expenses divided by the annual sales |
| AD | Advertising intensity | Annual advertising expenses divided by the annual sales |
| Asset | Firm size | Logarithm of the total assets |
| Lev | Debt ratio | Total liabilities to total assets |
| Sales | Sales growth rate | Percentage of growth in the annual sales |
| Year | Year | Dummy variable that takes 1 for the test year, 0 otherwise |
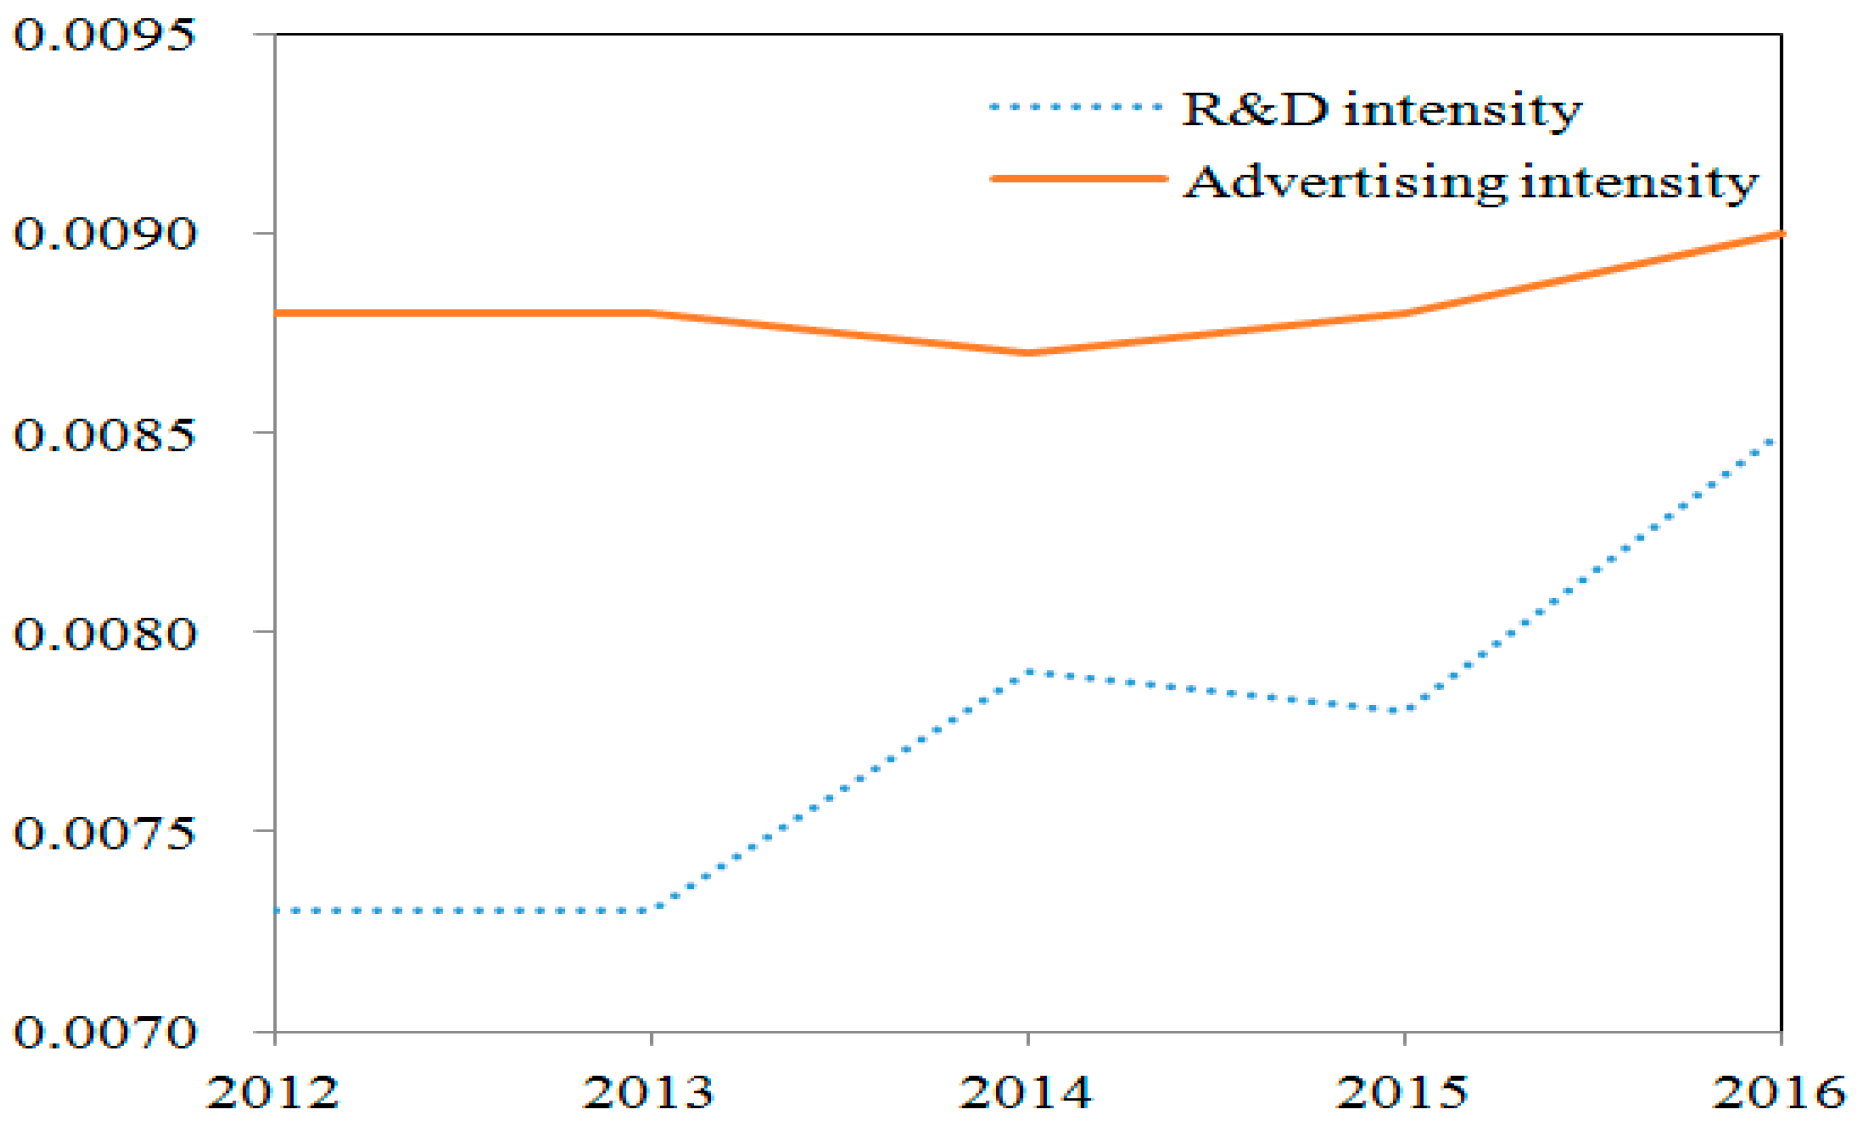
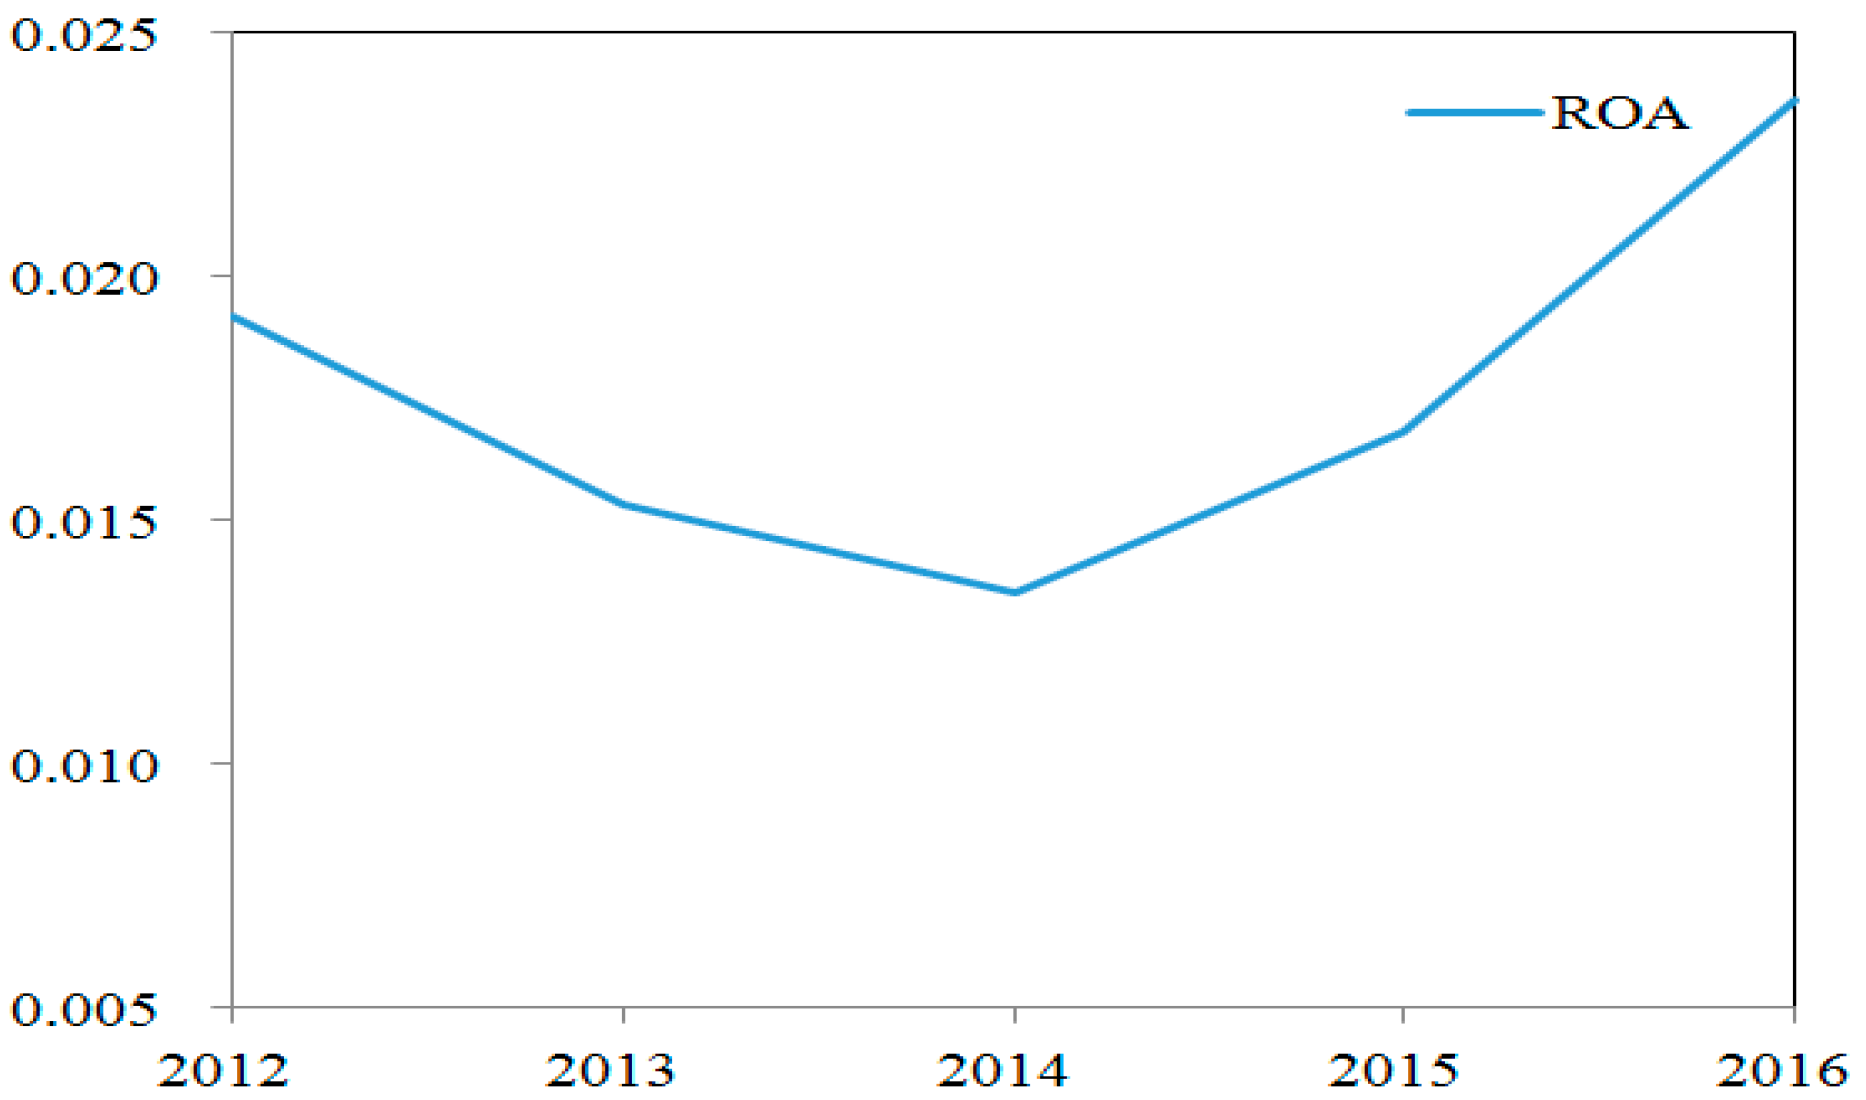
| Panel A: Descriptive statistics by year | ||||
| Year | Mean level of the R&D intensity | Mean level of the advertising intensity | Mean performance | |
| 2012 | 0.0073 | 0.0088 | 0.0192 | |
| 2013 | 0.0073 | 0.0088 | 0.0153 | |
| 2014 | 0.0079 | 0.0087 | 0.0135 | |
| 2015 | 0.0078 | 0.0088 | 0.0168 | |
| 2016 | 0.0085 | 0.0090 | 0.0236 | |
| Panel B: Descriptive statistics by firm size | ||||
| Variable | All | Large firms | Small firms | Difference t-statistic |
| ROA | 0.0177 | 0.0300 | 0.0054 | 7.721 *** |
| RD | 0.0077 | 0.0072 | 0.0083 | –1.673 ** |
| AD | 0.0088 | 0.0092 | 0.0084 | 0.968 |
| Asset | 11.7087 | 12.2155 | 11.2021 | 56.212 *** |
| Lev | 0.4691 | 0.5223 | 0.4160 | 14.721 * |
| Sales | 0.1567 | 0.2540 | 0.0594 | 0.977 |
| Panel A: Pearson correlations for all firms | ||||||
| Variable | ROA | RD | AD | Asset | Lev | Sales |
| ROA | 1 | |||||
| RD | 0.003 | 1 | ||||
| AD | 0.087 *** | 0.115 *** | 1 | |||
| Asset | 0.171 *** | 0.022 | 0.056 *** | 1 | ||
| Lev | –0.305 *** | –0.117 *** | –0.149 *** | 0.275 *** | 1 | |
| Sales | –0.018 | –0.006 | –0.003 | 0.034 ** | 0.039 ** | 1 |
| Panel B: Pearson correlations for large firms | ||||||
| Variable | ROA | RD | AD | Asset | Lev | Sales |
| ROA | 1 | |||||
| RD | 0.097 *** | 1 | ||||
| AD | 0.226 *** | 0.063 *** | 1 | |||
| Asset | –0.054 ** | 0.120 *** | 0.045 | 1 | ||
| Lev | –0.524 *** | –0.116 *** | –0.226 *** | 0.174 *** | 1 | |
| Sales | –0.052 ** | –0.009 | –0.007 | 0.036 * | 0.049 ** | 1 |
| Panel C: Pearson correlations for small firms | ||||||
| Variable | ROA | RD | AD | Asset | Lev | Sales |
| ROA | 1 | |||||
| RD | –0.046 ** | 1 | ||||
| AD | 0.003 | 0.180 *** | 1 | |||
| Asset | 0.299 *** | –0.042 * | 0.104 *** | 1 | ||
| Lev | –0.286 *** | –0.110 *** | –0.087 *** | 0.070 *** | 1 | |
| Sales | 0.056 ** | 0.027 | 0.025 | –0.038 * | 0.022 | 1 |
| Variable | Predicted Sign | All | Large Firms | Small Firms |
|---|---|---|---|---|
| Constant | ? | –0.002 (–0.448) | –0.039 *** (–4.077) | 0.041*** (2.765) |
| AD | + | 0.078 *** (5.117) | 0.021 (0.992) | 0.153 *** (6.887) |
| Asset | + | 0.001 ** (2.535) | 0.004 *** (5.431) | –0.003 ** (–2.071) |
| Lev | - | –0.010 *** (–6.025) | –0.013 *** (–5.003) | –0.008 *** (–3.547) |
| Sales | + | –7.84 × 10⁻⁶ (–6.025) | –1.90 × 10⁻⁵ (–0.306) | 0.001 (0.876) |
| Year | Included | Included | Included | |
| adj. R2 | 0.024 | 0.032 | 0.042 | |
| F | 19.203 *** | 13.028 *** | 17.238 *** | |
| N | 2945 | 1472 | 1473 |
| Variable | Predicted Sign | Equation (2) | Equation (3) | ||||
|---|---|---|---|---|---|---|---|
| All | Large Firms | Small Firms | All | Large Firms | Small Firms | ||
| Constant | ? | –0.306 *** (–12.340) | 0.078 *** (2.910) | –1.102 *** (–12.919) | –0.307 *** (–12.351) | 0.078 *** (2.906) | –1.101 *** (–12.907) |
| RD | + | –0.247 *** (–2.946) | 0.094 (1.283) | –0.377 ** (–2.809) | –0.283 *** (–2.652) | 0.098 (0.974) | –0.464 ** (–2.561) |
| AD | + | 0.082 (1.182) | 0.285 *** (4.832) | –0.265 ** (–2.065) | 0.067 (0.883) | 0.287 *** (4.600) | –0.320 ** (–2.223) |
| RD×AD | + | 2.092 (0.536) | –0.256 (–0.057) | 4.896 (0.399) | |||
| Asset | + | 0.034 *** (15.709) | 0.002 (1.095) | 0.106 *** (13.839) | 0.034 *** (15.713) | 0.002 (1.087) | 0.106 *** (13.835) |
| Lev | - | –0.165 *** (–21.443) | –0.156 *** (–21.473) | –0.172 *** (–13.580) | –0.165 *** (–21.447) | –0.156 *** (–21.463) | –0.172 *** (–13.594) |
| Sales | + | –0.0002 (–0.731) | –0.0002 (–1.233) | 0.011 *** (3.333) | –0.0002 (–0.736) | –0.0002 (–1.232) | 0.011 *** (3.303) |
| Year | Included | Included | Included | Included | Included | Included | |
| adj. R2 | 0.165 | 0.287 | 0.194 | 0.165 | 0.286 | 0.194 | |
| F | 117.300 *** | 119.259 *** | 71.941 *** | 97.774 *** | 99.316 *** | 60.058 *** | |
| N | 2945 | 1472 | 1473 | 2945 | 1472 | 1473 | |
| Variable | Predicted Sign | Equation (2) | Equation (3) | ||||
|---|---|---|---|---|---|---|---|
| All | Large Firms | Small Firms | All | Large Firms | Small Firms | ||
| Constant | ? | –0.204 *** (–10.566) | 0.121 *** (4.989) | –0.676 *** (–10.652) | –0.204 *** (–10.584) | 0.119 *** (4.925) | –0.676 *** (–10.642) |
| RD | + | –0.174 *** (–2.666) | 0.118 * (1.782) | –0.315 *** (–2.845) | –0.207 ** (–2.502) | 0.071 (0.780) | –0.362 *** (–2.688) |
| AD | + | 0.180 *** (3.329) | 0.301 *** (5.666) | –0.032 * (–0.335) | 0.165 *** (2.820) | 0.288 *** (5.134) | –0.062 * (–0.577) |
| RD×AD | + | 1.973 (0.651) | 3.037 (0.755) | 2.655 (0.615) | |||
| Asset | + | 0.024 *** (14.270) | –0.002 (–1.033) | 0.066 *** (11.664) | 0.024 *** (14.283) | –0.002 (–0.974) | 0.066 *** (11.660) |
| Lev | - | –0.097 *** (–16.242) | –0.099 *** (–15.098) | –0.098 *** (–10.413) | –0.097 *** (–16.250) | –0.099 *** (–15.081) | –0.098 *** (–10.422) |
| Sales | + | –0.00001 (–0.070) | –0.00001 (–0.087) | 0.008 *** (3.217) | –0.00001 (–0.076) | –0.00001 (–0.095) | 0.008 *** (3.194) |
| Year | Included | Included | Included | Included | Included | Included | |
| adj. R2 | 0.120 | 0.189 | 0.139 | 0.120 | 0.189 | 0.138 | |
| F | 81.317 *** | 69.524 *** | 48.364 *** | 67.822 *** | 58.015 *** | 40.349 *** | |
| N | 2945 | 1472 | 1473 | 2945 | 1472 | 1473 | |
| Variable | Predicted Sign | Equation (2) | Equation (3) | ||||
|---|---|---|---|---|---|---|---|
| All | Large Firms | Small Firms | All | Large Firms | Small Firms | ||
| Constant | ? | –0.125 *** (–5.245) | 0.046 * (1.760) | –0.439 *** (–5.083) | –0.125 *** (–5.244) | 0.047 * (1.802) | –0.439 *** (–5.080) |
| RD | + | –0.146 * (–1.889) | 0.046 (0.656) | –0.254 * (–1.796) | –0.154 (–1.567) | 0.088 (0.909) | –0.285 * (–1.650) |
| AD | + | 0.065 * (0.313) | 0.116 ** (2.010) | –0.018 (–0.144) | 0.062 * (0.890) | 0.128 ** (2.106) | –0.036 (–0.264) |
| RD×AD | + | 0.467 (0.132) | –2.661 (–0.630) | 1.673 (0.311) | |||
| Asset | + | 0.015 *** (6.818) | 0.001 (0.566) | 0.043 *** (5.517) | 0.015 *** (6.811) | 0.001 (0.511) | 0.043 *** (5.517) |
| Lev | - | –0.078 *** (–10.309) | –0.090 *** (–11.236) | –0.088 *** (–7.004) | –0.078 *** (–10.306) | –0.090 *** (–11.236) | –0.088 *** (–7.008) |
| Sales | + | 0.019 *** (7.990) | 0.058 *** (7.948) | 0.017 *** (5.909) | 0.019 *** (7.988) | 0.058 *** (7.965) | 0.017 *** (5.906) |
| Previous year’s ROA | + | 0.525 *** (31.352) | 0.379 *** (15.626) | 0.519 *** (21.210) | 0.525 *** (31.338) | 0.379 *** (15.612) | 0.519 *** (21.178) |
| Year | Included | Included | Included | Included | Included | Included | |
| adj. R2 | 0.415 | 0.445 | 0.413 | 0.415 | 0.445 | 0.413 | |
| F | 279.716 *** | 158.745 *** | 138.914 *** | 239.659 | 136.054 *** | 118.991 | |
| N | 2356 | 1180 | 1176 | 2356 | 1180 | 1176 | |
| Variable | Predicted Sign | Equation (2) | Equation (3) | ||||
|---|---|---|---|---|---|---|---|
| All | Large Firms | Small Firms | All | Large Firms | Small Firms | ||
| Constant | ? | –1.012 *** (–6.23) | –0.069 (–0.39) | –2.132 *** (–6.98) | –1.010 *** (–6.21) | –0.070 (–0.39) | –2.140 *** (–6.99) |
| RD | + | –0.915 *** (–4.74) | –0.937 (–4.03) | –0.744 ** (–2.54) | –0.873 *** (–4.03) | –1.054 (–4.00) | –0.816 ** (–2.48) |
| AD | + | 0.040 (0.27) | 0.574 ** (2.35) | –0.741 ** (–2.89) | 0.059 (0.38) | 0.515 ** (2.04) | –0.798 ** (–2.82) |
| RD×AD | + | –2.247 (–0.42) | 8.541 (0.94) | 3.569 (0.48) | |||
| Asset | + | 0.102 *** (7.28) | 0.022 (1.46) | 0.205 *** (7.44) | 0.102 *** (7.26) | 0.022 (1.47) | 0.206 *** (7.45) |
| Lev | - | –0.330 *** (–18.37) | –0.309 *** (–13.11) | –0.340 *** (–12.98) | –0.330 *** (–18.33) | –0.310 *** (–13.14) | –0.340 *** (–12.99) |
| Sales | + | –0.0003 (–1.34) | –0.0001 (–0.90) | 0.119 *** (4.47) | –0.0003 (–1.34) | –0.0001 (–0.90) | 0.119 *** (4.47) |
| Year | Included | Included | Included | Included | Included | Included | |
| adj. R2 | 0.154 | 0.257 | 0.197 | 0.154 | 0.257 | 0.197 | |
| F | 44.70 *** | 24.68 *** | 26.93 *** | 40.24 *** | 22.30 *** | 24.24 *** | |
| N | 2945 | 1472 | 1473 | 2945 | 1472 | 1473 | |
| Variable | t | t-1 | t-2 |
|---|---|---|---|
| Constant | –0.306 *** (–12.340) | –0.301 *** (–10.916) | –0.307 *** (–9.405) |
| RD | –0.247 *** (–2.946) | –0.125 * (–1.288) | 0.002 (0.016) |
| AD | 0.082 (1.182) | 0.027 (0.348) | –0.045 (–0.495) |
| Asset | 0.034 *** (15.709) | 0.034 *** (13.855) | 0.034 *** (11.794) |
| Lev | –0.165 *** (–21.443) | –0.163 *** (–19.214) | –0.157 *** (–15.758) |
| Sales | –0.0002 (–0.731) | 0.013 *** (4.827) | 0.025 *** (4.337) |
| Year | Included | Included | Included |
| adj. R2 | 0.165 | 0.168 | 0.158 |
| F | 117.300 *** | 96.417 *** | 67.359 *** |
| N | 2945 | 2356 | 1767 |
© 2019 by the authors. Licensee MDPI, Basel, Switzerland. This article is an open access article distributed under the terms and conditions of the Creative Commons Attribution (CC BY) license (http://creativecommons.org/licenses/by/4.0/).
Share and Cite
Xu, J.; Liu, F.; Chen, Y.-h. R&D, Advertising and Firms’ Financial Performance in South Korea: Does Firm Size Matter? Sustainability 2019, 11, 3764. https://doi.org/10.3390/su11143764
Xu J, Liu F, Chen Y-h. R&D, Advertising and Firms’ Financial Performance in South Korea: Does Firm Size Matter? Sustainability. 2019; 11(14):3764. https://doi.org/10.3390/su11143764
Chicago/Turabian StyleXu, Jian, Feng Liu, and You-hua Chen. 2019. "R&D, Advertising and Firms’ Financial Performance in South Korea: Does Firm Size Matter?" Sustainability 11, no. 14: 3764. https://doi.org/10.3390/su11143764
APA StyleXu, J., Liu, F., & Chen, Y.-h. (2019). R&D, Advertising and Firms’ Financial Performance in South Korea: Does Firm Size Matter? Sustainability, 11(14), 3764. https://doi.org/10.3390/su11143764