Article

A Bayesian Network-Based Integrated for Flood Risk Assessment (InFRA)

1
Department of Civil Engineering, Inha University, Incheon 22212, Korea
2
Department of Land, Water and Environment Research, Korea Institute of Civil Engineering and Building Technology, Ilsan 10223, Korea
*
Author to whom correspondence should be addressed.
Sustainability 2019, 11(13), 3733; https://doi.org/10.3390/su11133733
Submission received: 28 May 2019 / Revised: 26 June 2019 / Accepted: 2 July 2019 / Published: 9 July 2019

Abstract

:
Floods are natural disasters that should be considered a top priority in disaster management, and various methods have been developed to evaluate the risks. However, each method has different results and may confuse decision-makers in disaster management. In this study, a flood risk assessment method is proposed to integrate various methods to overcome these problems. Using factor analysis and principal component analysis (PCA), the leading indicators that affect flood damage were selected and weighted using three methods: the analytic hierarchy process (AHP), constant sum scale (CSS), and entropy. However, each method has flaws due to inconsistent weights. Therefore, a Bayesian network was used to present the integrated weights that reflect the characteristics of each method. Moreover, a relationship is proposed between the elements and the indicators based on the weights called the Integrated Index for Flood Risk Assessment (InFRA). InFRA and other assessment methods were compared by receiver operating characteristics (ROC)-area under curve (AUC) analysis. As a result, InFRA showed better applicability since InFRA was 0.67 and other methods were less than 0.5.

1. Introduction

Recent major disasters highlight the importance of disaster preparedness around the world and emphasize the concept of disaster risk across communities. Floods are major natural disasters and have been studied with great interest worldwide [1,2]. Federal Emergency Management Agency (FEMA) [3] and National Oceanic and Atmospheric Administration (NOAA) [4] developed a risk assessment program to estimate the extent of damage related to disasters. Munich Re Group [5] classified disasters into four categories after evaluating disaster scenarios using four factors (natural, technological, socio-political, and economic factors) and direct/indirect damages. The Tyndall Centre [6] classified flood vulnerability into social and biological categories and proposed a basic framework to improve vulnerability-specific adaptability.
Rygel et al. [7] suggested that the most important issue in a vulnerability assessment is selecting appropriate indicators. They proposed a method to evaluate flood risk using the Pareto ranking process after selecting and collecting vulnerabilities into two categories (exposure and sociological). Chang and Huang [8] selected potential impact indicators (PIs) for urban areas in Taiwan and estimated the flood risk index by combining PIs with adaptive capacity indicators (AIs). Kablan et al. [9] estimated a flood vulnerability index based on the concept of climate change vulnerability assessment through proxy variables that are relevant to disaster risk management and adaptation to climate changes using three flooding indices: (1) an exposure index (EI), (2) sensitivity index (SI), and (3) adaptive capacity index (AI). In addition, some studies have examined the impact of forest areas on flood risk [10] and the relationship between intensity-duration-frequency (IDF) curves and flood risk [11].
Many research institutes around the world have also assessed flood risk, including the Environment Agency (EA), Jeollabuk-do Total Human Institute National of Korea (JTHINK), Korea Institute of Civil Engineering and Building Technology(KICT), Korea Research Institute for Human Settlements (KRIHS), Korea Environment Institute(KEI), Ministry of Land, Transport and Maritime Affairs (MOLTMA), National Disaster Management Research Institute (NDMI), National Institute for Land and Infrastructure Management (NILIM), and Seoul Institute (SI) [12,13,14,15,16,17,18,19,20,21]. The above studies commonly selected indicators that are expected to have an effect on flood risk. Then, the conclusive flood risk is derived from the weight between each indicator (mainly expert questionnaire or subjective judgment). Their goal is to address flood management through flood risk assessment.
To assess flood risks, it is essential to select indicators that affect floods and assign them reasonable weights. However, as mentioned earlier, most studies lack a basis for the selection of indicators, and they have typically selected indicators based on the frequency of their use in other studies or a subjective view on the importance of such indicators. In addition, most flood risk assessment methods are not differentiated because they use similar estimation methods. These problems have not been validated for the methods to be actually applied.
The purpose of this study is to develop a flood risk assessment method that can address the problems of undifferentiated and accurate estimates of previous methods. To this end, a methodology is proposed to derive the integrated weights of components and indicators using Bayesian networks (BNs) as an integrated decision model after selecting representative indicators among the existing flood risk indicators through factor analysis and principal component analysis (PCA). Section 2 explains the basic theories behind the methodologies that are material in this study, and Section 3 discusses the result of the methodology used on the target areas. Finally, Section 4 presents the conclusions.

2. Materials and Theories

2.1. Existing Flood Risk Assessment Indices

In general, flood risk is computed by multiplying three factors of vulnerability related to flood occurrence: (1) hazard; (2) asset or human exposure; and (3) lack of flood protection [22]. Based on these definitions, many flood risk assessment indicators have been developed for flood risk management. The indicators mainly used in Korea are the potential flood damage (PFD) [17], excess flood vulnerability index (EFVI) [18], flood disaster risk reduction index (FDRRI) [19], flood vulnerability assessment (FVA) [13], flood damage index (FDI) [15], and regional safety assessment (RSA) [21]. These six methods have been used mainly in Korea because they are well known to be applicable with general indicators for assessing flood risk. Each assessment method is estimated by the general procedure with almost similar methods presented in introduction.
In this study, the factors of these indicators were reviewed and classified into four components: (1) hydro-geology; (2) socio-economics; (3) protection; and (4) climate. Furthermore, 28 indicators were also used for the components, as shown in Table 1. The flood risk index (FRI) increases as the H (hydro-geology), S (socio-economics), and C (climate) components increase. The index decreases as the P (protection) component increases. With these indicators, the FRI can be expressed as follows:
FRI= (H × S × C)/P

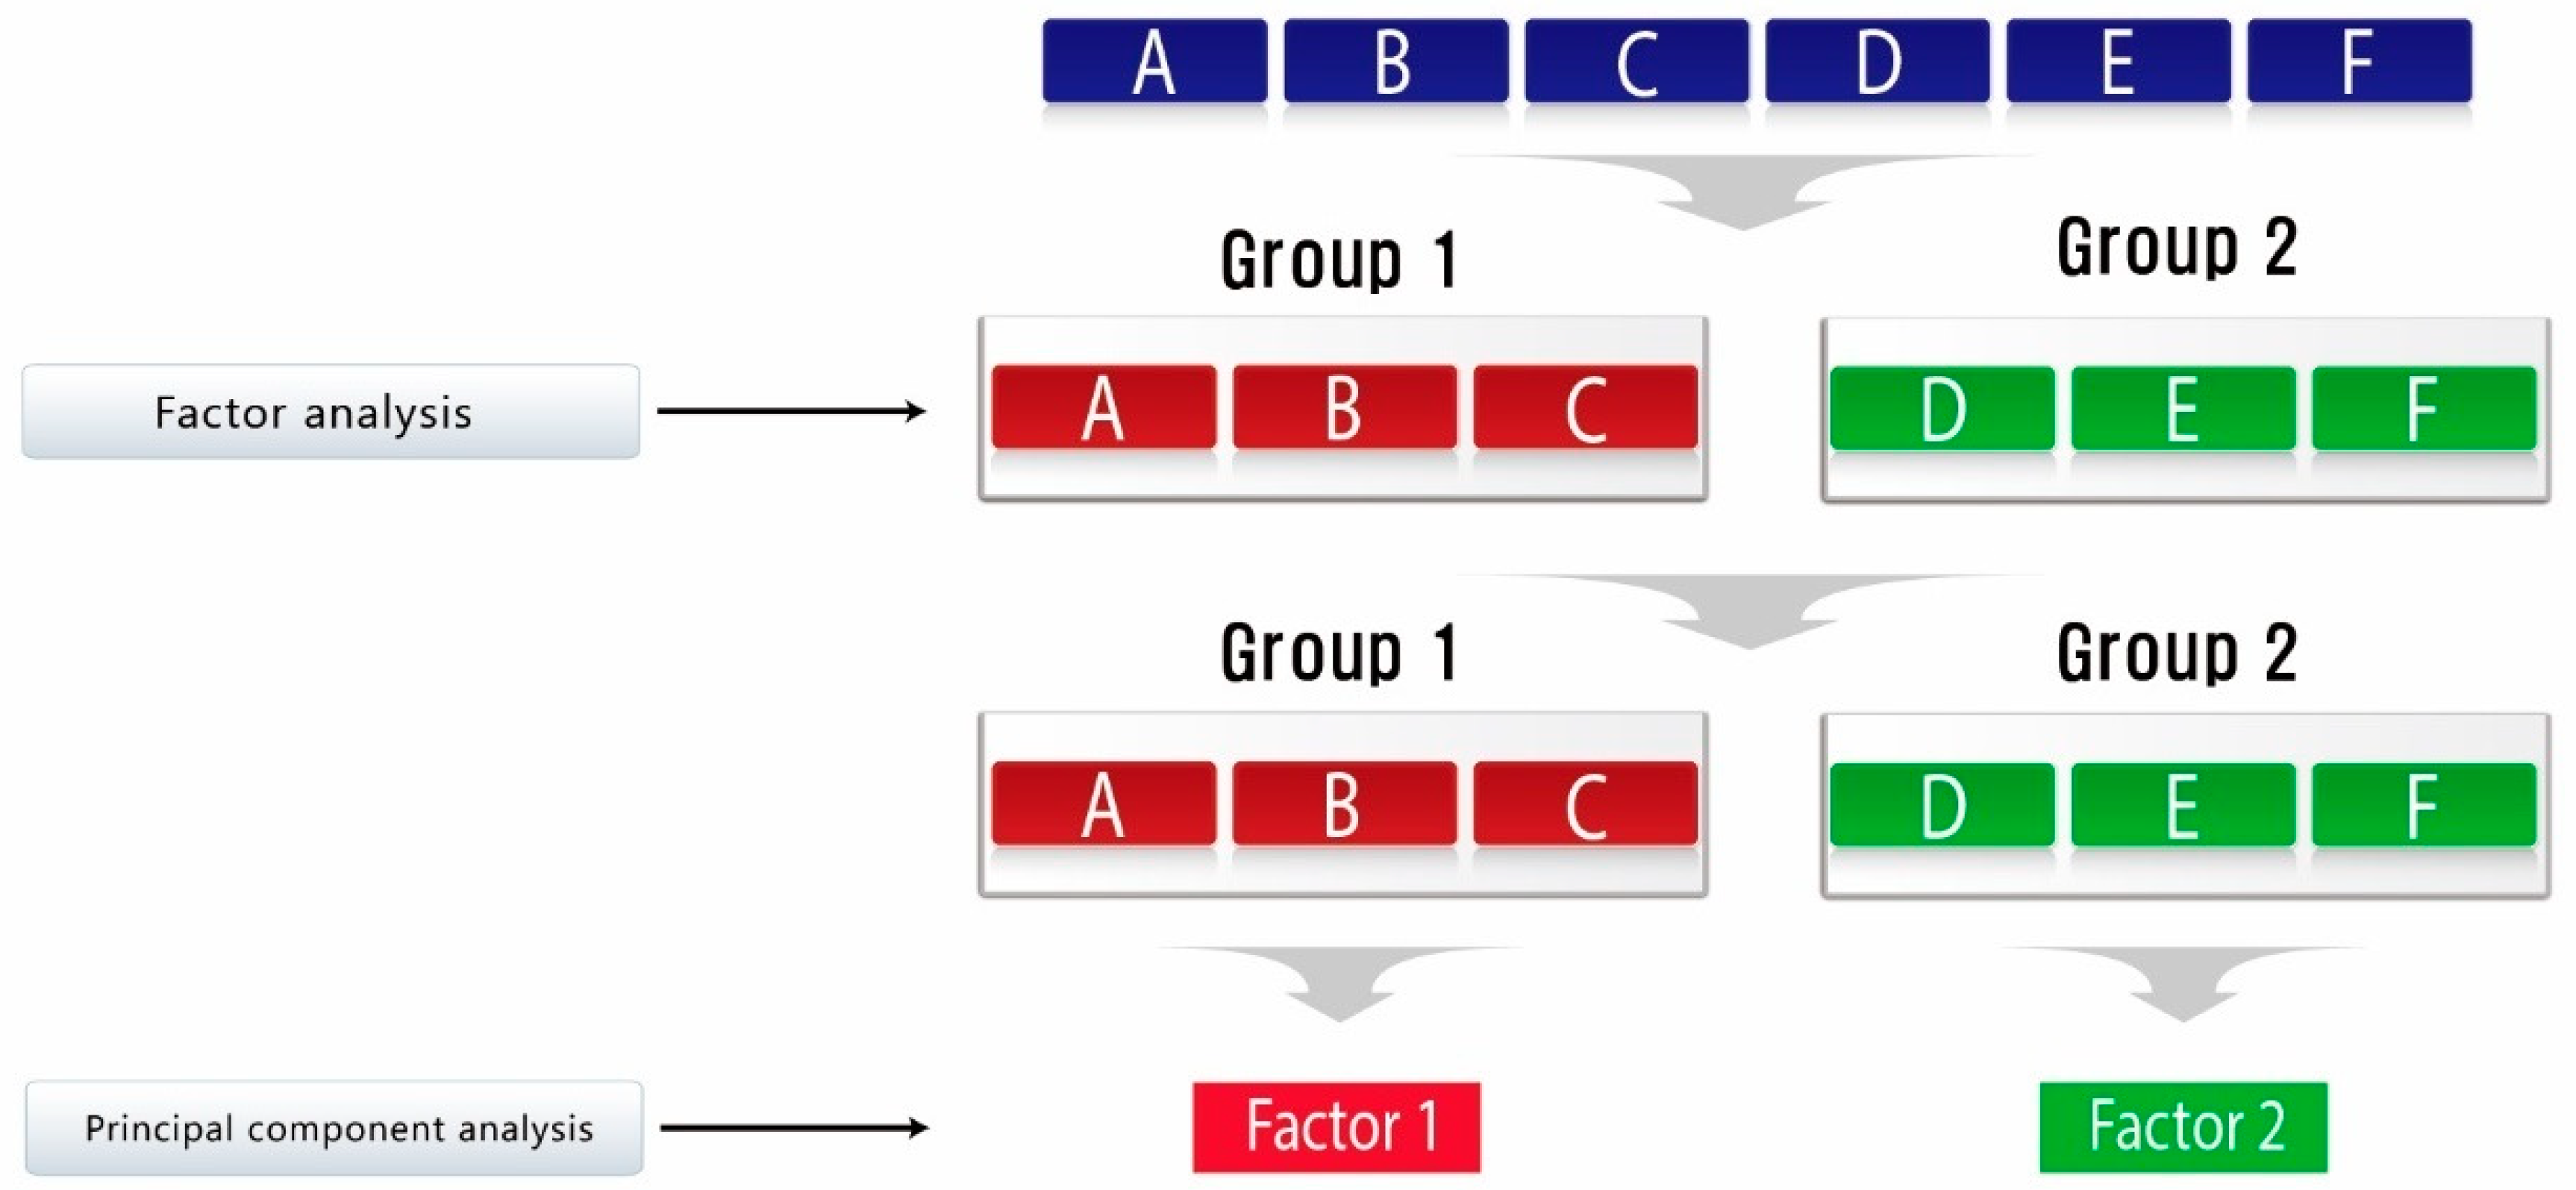
2.2. Methodology for Selecting Representative Indicators

Factor analysis is used to reduce the complexity of data by grouping measurement variables into common factors and determining whether the measured variables measure the desired data in the same construct [23]. Factor analysis is advantageous because it is relatively free of constraints of multicollinearity, it can classify variables by factors in the development process of a measurement scale, and it can analyze them based on the correlation of variables. principal component analysis (PCA) in factor analysis is a technique for creating a small number of new variables by combining many highly correlated variables. It is a method of forming a group of components that represent many variables by reducing the dimensionality of data [24]. In addition, it can easily identify the component that has the highest explaining power in the group because the component of each variable can be quantified.
Figure 1 illustrates the method of selecting representative indicators using factor analysis and PCA. Assuming that there are six indicators A–F, they can be grouped by factor analysis, and the ones that have high explanatory power can be selected using PCA. In this way, the complexity of the FRI can be effectively reduced.

2.3. Methodology for Assigning Weights

Weights should be assigned according to the importance of each indicator that affects the flood in assessing flood risk. There are many theories for weight assignment methods, and it is difficult to say that these weighting techniques differ in explanatory power or merit. Only the classification methods differ according to the purpose of a study or a subjective view about importance. The weighting techniques originate from differences in assumptions that lead to values or preferences [25], and they are categorized into direct and indirect methods, including surveys [26]. In this study, the analytic hierarchy process (AHP), constant sum scale (CSS), and entropy weight were selected for weighting the flood risk indicators identified to derive the FRI.
AHP is a typical method of multicriteria decision-making (MCDM). It forms a hierarchical structure by assessment items and evaluates alternatives through pairwise comparison. Quantitative and qualitative data can be processed on a ratio scale, which makes the method useful for verifying objectivity through the process of secondary processing of data [27,28]. CSS provides a consistent fixed total score to respondents and divides the score according to the relative importance of the attributes within the total score [29]. The score used for the total fixed scale is usually 10 or 100 based on the number of factors and indicators.
The entropy weight technique is based on the theory that information about the signal can be measured indirectly with a degree of reduction of uncertainty. In this sense, information and uncertainty are dual terms and sometimes used interchangeably [30], and weights between the indicators can be determined using the characteristics of these entropies. The estimation procedure consists of (1) constructing a matrix for each item; (2) normalizing the attribute information for each constructed indicator; (3) calculating the entropy for each attribute; (4) considering the degree of diversity between the indicators; and (5) determining the final weights (see Equations (2)–(6)).
(1)
Matrix construction
x 11 x 1 j x 1 n x i 1 x m 1 x i j x m j x 1 n x m n
(2)
Normalization of assessment items
p i j = x i j i = 1 m x i j ( i = 1 , 2 , m ;   j = 1 , 2 , n )
(3)
Calculation of entropy of each attribute
E j = k i = 1 m p i j l o g p i j ( H e r e ,   k = 1 l o g m ; i = 1 , 2 , m ;   j = 1 , 2 , n )
(4)
Weight assignment between assessments
d j = 1 E j
w j = d j j = 1 n d j ( j = 1 , 2 , n )

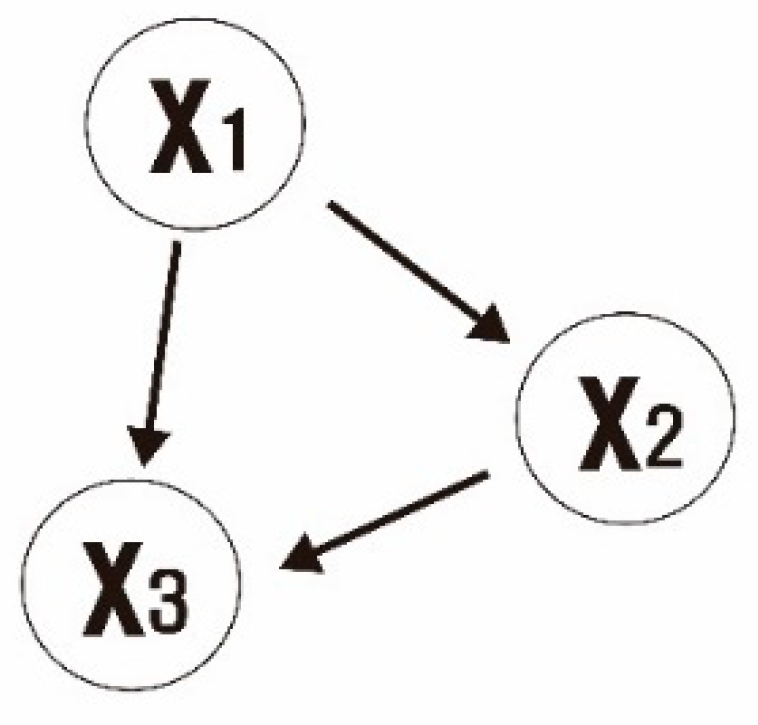
2.4. Bayesian Networks (BNs)

A BN is a stochastic graphical model that can represent the relationship between variables even when there is uncertainty between them. It consists of a directed acyclic graph (DAG) model of nodes and links and has the advantage of integrating variables of sources and types into a single structure. The relationship between nodes is described by conditional probability distribution (CPD), which considers dependencies between variables [31,32,33].
For example, the child nodes ( x 1 ,   x 2 ) in Figure 2 are determined by the conditional probability of the parent nodes ( x 2 ,   x 3 ) if there is a graph that has the nodes ( x 1 , x 2 ,   x 3 ) that follow the CPD. Any unconnected node is ignored. The joint distribution with n number of variables p ( x 1 ,   x 2 ,   , x n ) is expressed in Equation (7):
p ( x 1 ,   x 2 ,   , x n ) = i = 1 n p ( x i   |   a i )
where a i denotes the set of parent nodes of x i , and p ( x 1 ,   x 2 ,   , x n ) is normalized constantly as the predistribution has been normalized.

2.5. Integrated Index for Flood Risk Assessment (InFRA)

Equation (8) is proposed as a formula to construct the Integrated Index for Flood Risk Assessment (InFRA) based on the weight of each factor:
InFRA = H a 1 × S a 2 × C a 3 × ( 1 P ) a 4
where:
  • H = hydro-geology
  • S = socio-economics
  • C = climate
  • P = flood protection and
  • α i = weight of each indicator
As flood protection is inversely proportional to InFRA, it is necessary to consider it in descending order when estimating flood protection. If flood protection is 0 and the other indicators are 1, the value of InFRA will be 1, and the closer the value is to 1, the higher the flood risk will be. The key components that make up an indicator can be determined by multiplying them by the weights and summing them (Equations (9)–(12)):
H = β 1 h 1 + β 2 h 2 + + β n h n
S = γ 1 s 1 + γ 2 s 2 + + γ n s n
C = δ 1 c 1 + δ 2 c 2 + + δ n c n
P = ε 1 p 1 + ε 2 p 2 + + ε n p n
where:
  • h i ,   s i ,   c i ,   p i = each indicator
  • β i ,   γ i ,   δ i ,   ε i = the weights of each indicator

3. Application and Results

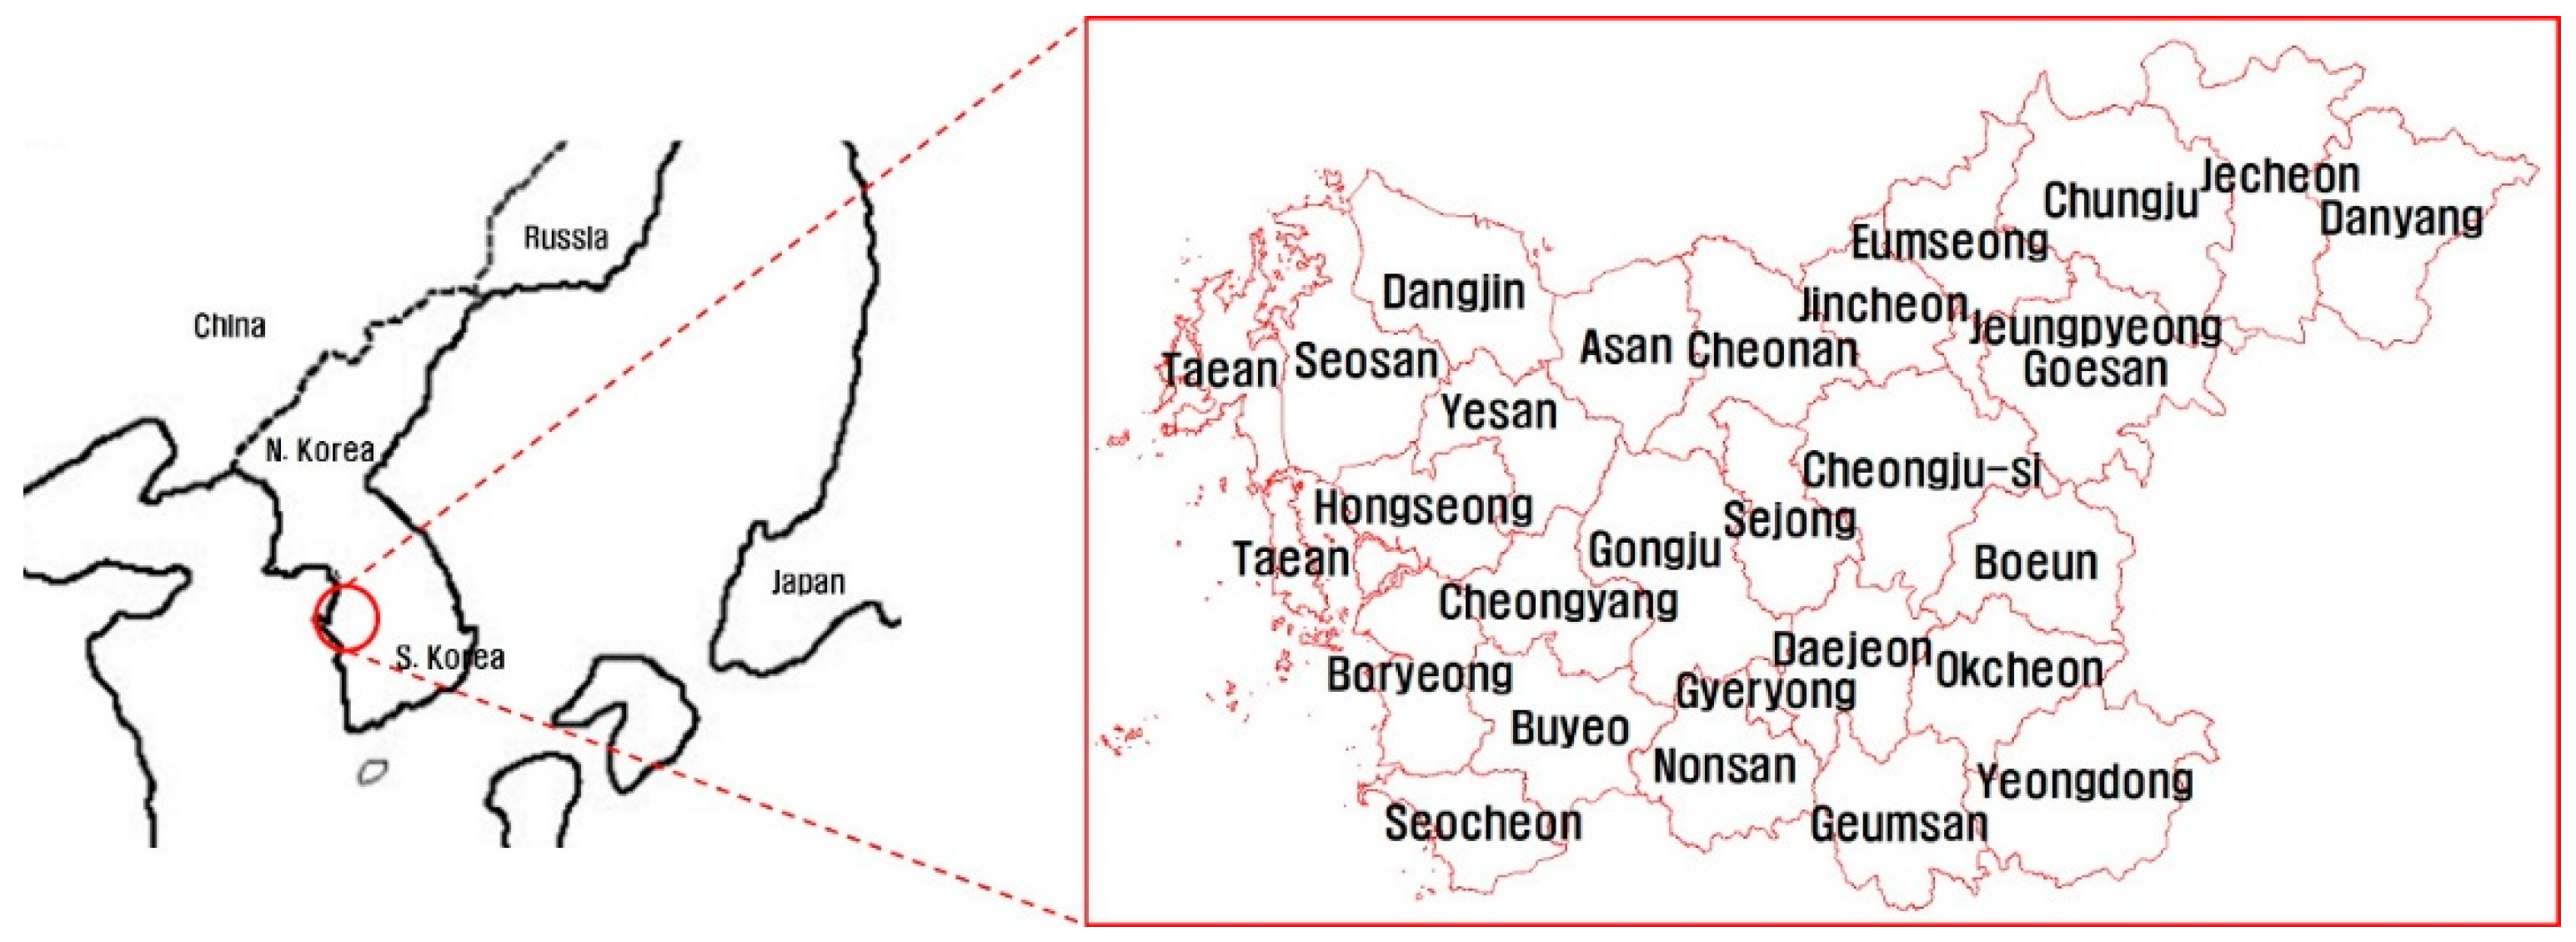
3.1. Selection of Target Areas and Data Collection

This study targeted the Midwest region of the Republic of Korea, including Daejeon Metropolitan City, Sejong Special Self-Governing City, Chungnam Province, and Chungbuk Province. The area consists of 28 cities and gun (districts or counties in Korea), including two municipalities, 11 cities, and 15 gun (see Figure 3). The advantage of the area is that it provides various geographical environments to select flood risks because it encompasses large cities, small and medium cities, coastal cities, mountainous regions, and rural areas.
The elements needed to construct an indicator database are summarized as statistical data and geographic information system (GIS)-based data. Demographic, social, and economic data were collected from the Korean Statistical Information Service (KOSIS), the statistical yearbooks of local governments, and the Statistical Yearbook of Natural Disasters. Meteorological data were collected from the Korea Meteorological Administration. All data were collected based on GIS for spatial analysis. The base year of the data is 2016, and statistical data for the ten years prior (2007–2016) were used. As shown in Table 1, data were collected for all 28 indicators of four components. All indicators were normalized to values between 0 and 1 using the average values estimated for each region and the standard deviations. Thus, the larger the value of an indicator for a region is, the closer it is to 1. The indicators of the H, S, and C components are positively correlated with FRI, whereas the indicators of P are negatively correlated.

3.2. Selection of Indicators Using Factor Analysis and Principal Component Analysis

Factor analysis and PCA were performed on each of the four components (hydro-geology, socio-economics, flood protection, and climate), which each consisted of several indicators. First, the indicators were grouped by factor using factor analysis, and the indicators with the highest component point for each group were selected using PCA. The procedure can prevent the duplication of meaning of the indicators and reduce dimension of the indicators in each group.
Table 2 shows the results of the factor analysis. The hydro-geology, socio-economic, and protection components were classified into three groups, whereas climate was classified into two groups. Kaiser–Meyer–Olkin (KMO) [34] and Barlett’s test of sphericity [35] were used to determine the appropriateness of the analysis. The Kaiser–Harris measurement [34] was used to select principal components that have an eigenvalue of 1 or higher (see Table 2). The result of each component was determined to be significant because KMO remained at 0.5 or higher, and the probability value (p) remained below 0.05.
PCA was used to select indicators that have the most significant contribution for each group. Among 28 indicators, 17 were eliminated and 11 were chosen: (1) three indicators for hydro-geology (damage cost, urban rate, and lowland area rate); (2) three for socio-economics (total number of houses, financial independence rate, and dependence population); (3) three for flood protection (number of pump stations, drainage capacity, and number of public servants per resident); and (4) two for climate (frequency of intensive rainfall and probability rainfall), as shown in Table 2.

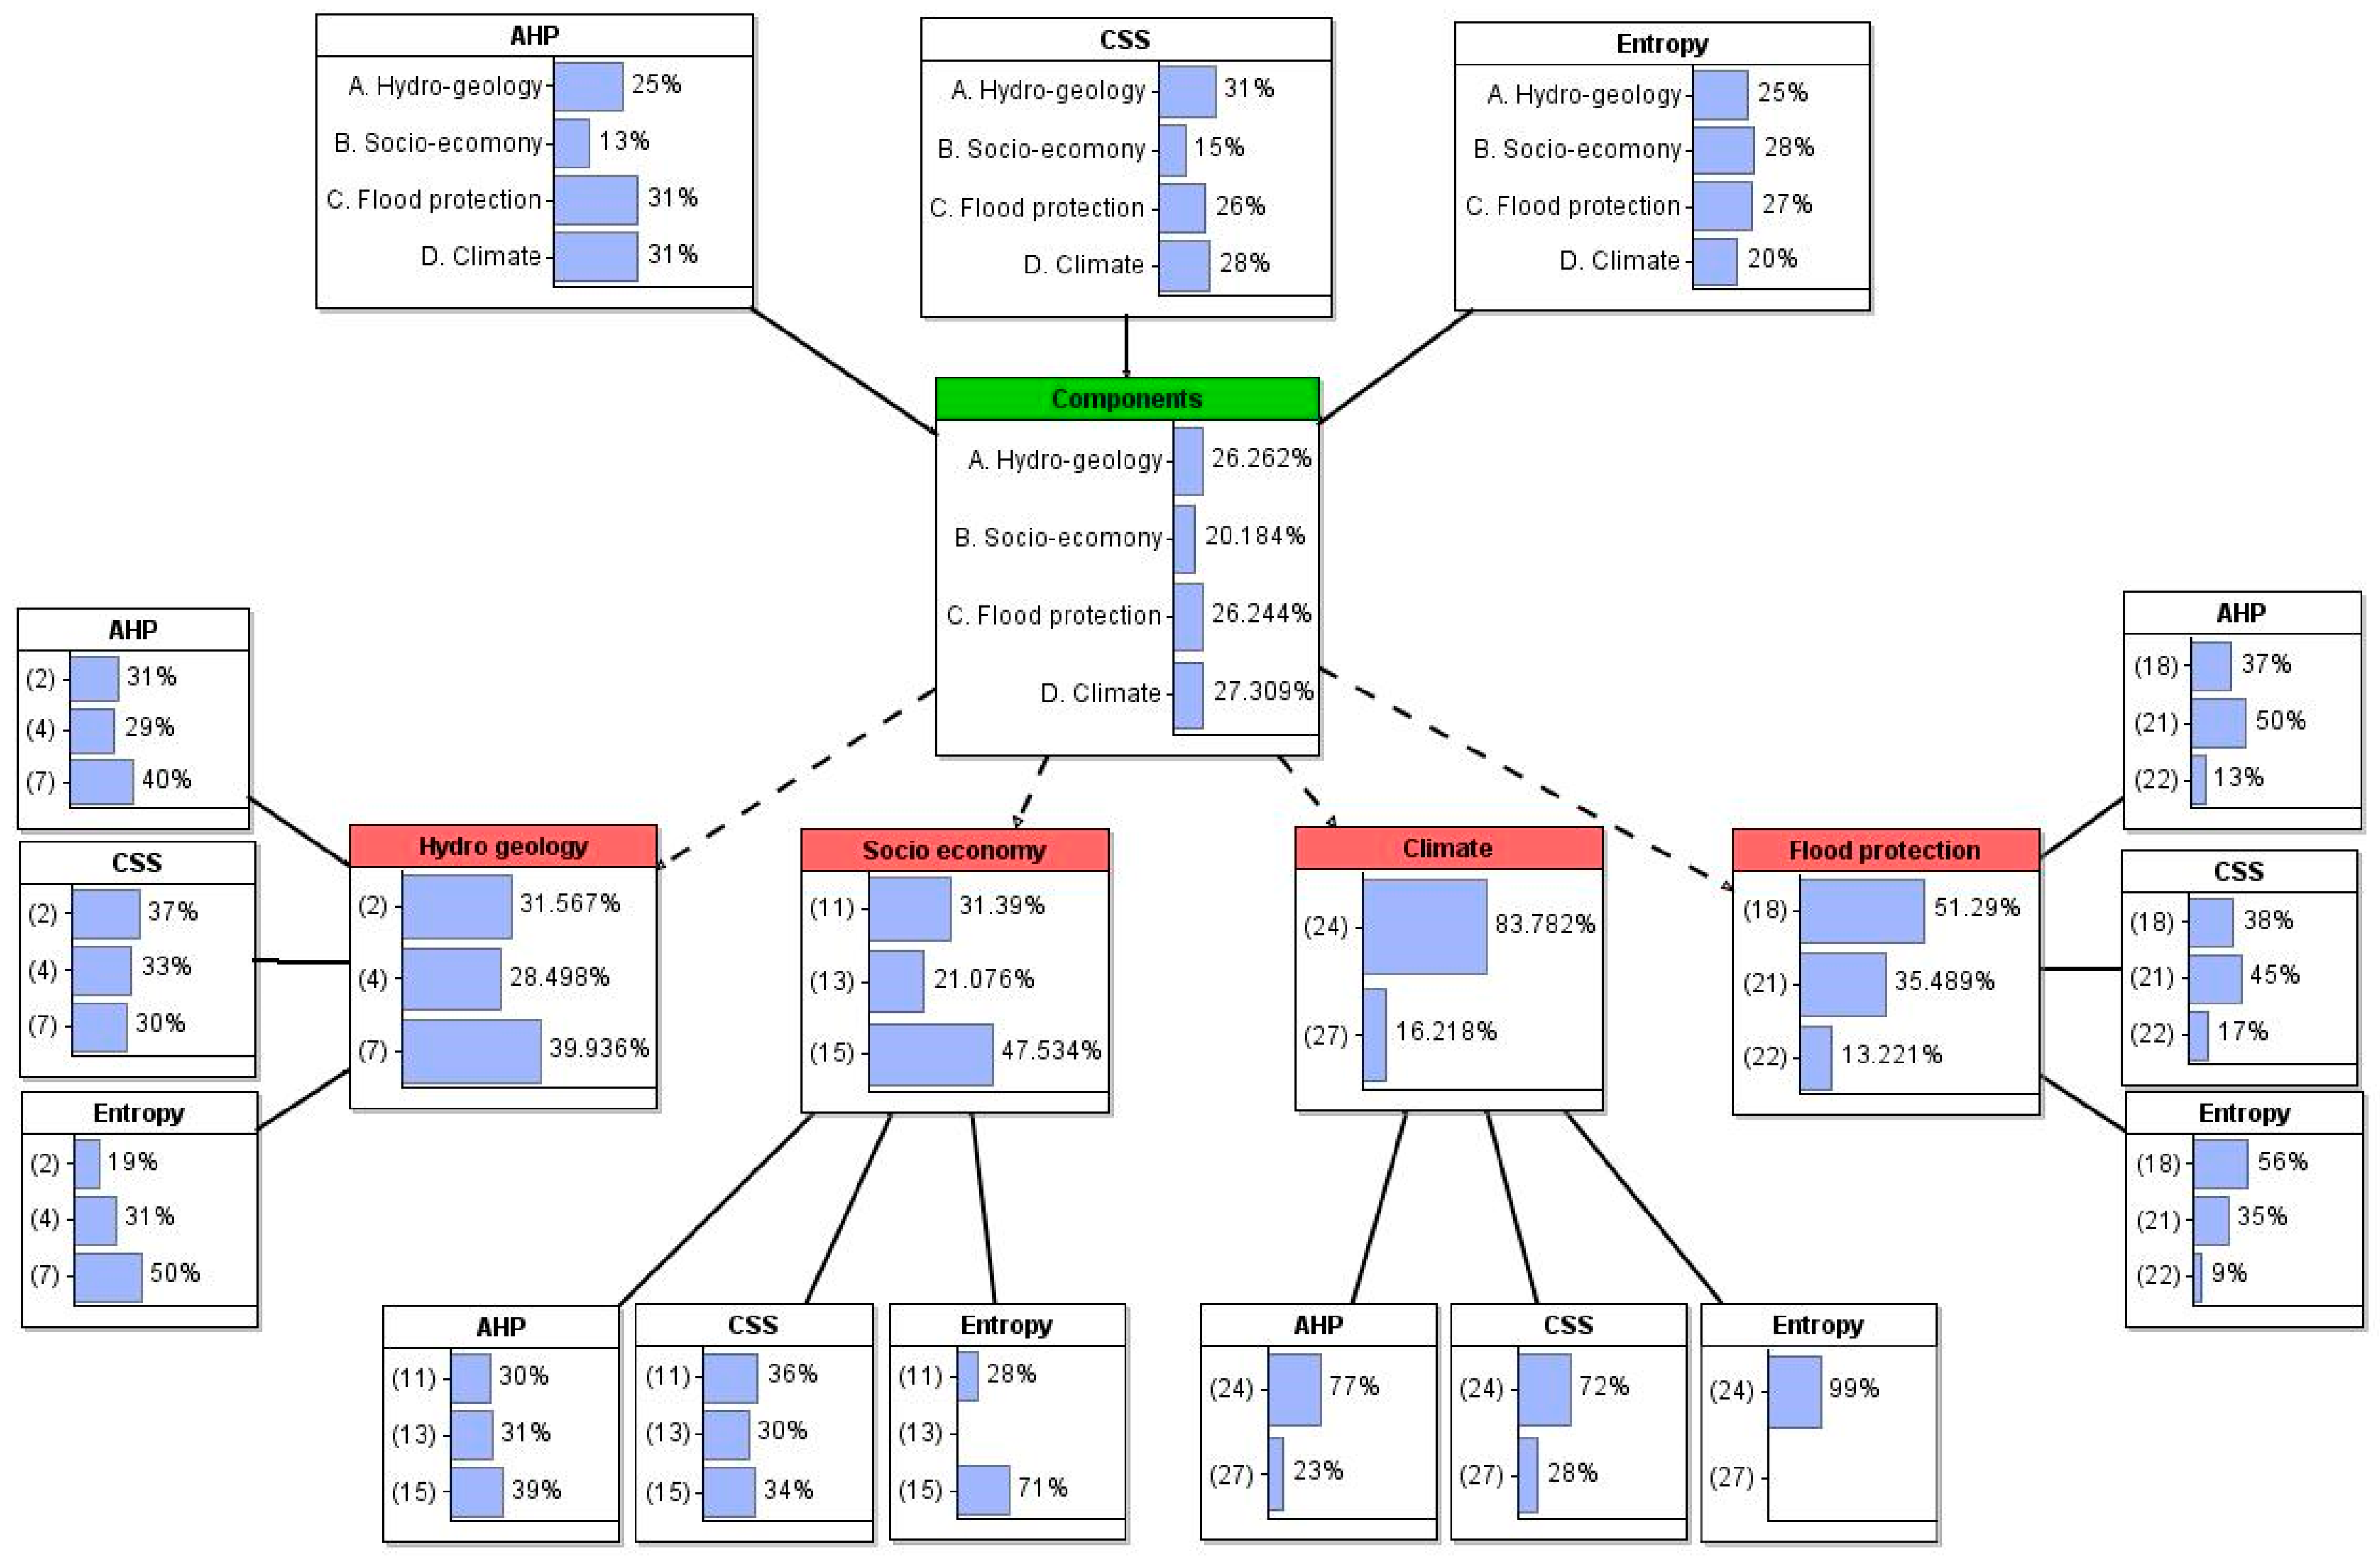
3.3. Weight Assignment by Method and Calculation of Integrated Weights

3.3.1. Weight Assignment by Method

The factors selected are expressed as normalized values between 0 and 1, and each indicator is estimated using the assigned weights. The flood risk index can be quantified using the weight of each indicator. To this end, weights can be assigned by various methods, and three weight assignment methods were applied, as described in Section 2.3. For the AHP, a survey was conducted with 30 respondents from academia and research. The survey was constructed in such a way that the importance of each indicator was compared in pairs. The terms of each indicator were defined and presented in the questionnaire to improve the accessibility for the respondents. The first-level hierarchy consists of four upper-level assessment components (hydro-geology, socio-economics, flood protection, and climate), and the second-level hierarchy consists of 11 lower-level assessment indicators.
For the CSS, a survey was conducted with 21 experts who have experience in work related to flood or wind damage and did not participate in the AHP survey. The questionnaire was structured in such a way that the sum of the four components presented and the sum of indicators for each component was 10. A sufficient explanation of the survey method was provided to supplement the questionnaire so that the respondents would not be confused.
For entropy weighting, Equations (1)–(6) from Section 2.3 were used based on the data collected for each component. The weights are shown in Table 3 and Figure 4. In summary, the weights for the socio-economic component were low in the survey methods, while they were high in the entropy weight method. In particular, the weights were evenly distributed among the rest of the components other than the socio-economic component and thus gave a relatively identical position concerning importance.
The indicators within a component showed a different aspect in the survey and entropy methods: the entropy method showed higher weight values for specific indicators, while the surveys showed relatively similar weight values for the indicators. This was due to the unique characteristics of entropy, which increases when deviations between alternatives are low. Moreover, the deviations between the normalized values of the indicators were small. However, the number of public servants per resident indicator of the flood protection component and the annual precipitation indicator of the climate component were low, and divisions in indicators between regions were high, which resulted in low entropy weights.

3.3.2. Integrated Weight Assignment Using Bayesian Networks (BNs)

The estimated weights affect the outcome of the estimated flood risk. It is not easy to determine the weights for each component and indicator, particularly when the entropy weight is higher than the other weights, such as for the total number of houses in Table 4. Thus, the BN method was used to estimate the combined weights while considering causal relationships between weights obtained from the AHP, CSS, and entropy techniques. First, a BN with 20 nodes and 19 links was constructed with AgenaRisk 10, as shown in Figure 5. The BN was constructed in consideration of the relationships between the components and indicators. The pre-probability assigned to each higher node can be inferred directly from the conditional probability, and the deviation of the probability determines the post-probability of the lower nodes. That is, the post-probability (the integrated weights) can be derived from pre-weights (the current weights), the conditional probability of each component (hydro-geology, socio-econometrics, flooding protection, and climate), and its indicators. As each component was weighted separately, it will not affect its indicators and can be expressed as dotted-line links that have indirect influences. Table 4 shows all of the probabilities (weights) of each component and indicator obtained from the configuration in Figure 5 and the post-probabilities (integrated weights).
The estimated weight of each component was relatively uniform in the range of 0.20–0.28. The weight of the socio-economic component was low in the survey method but increased significantly in the entropy method. This indicates that the entropy weight contributed to conditional probabilities as a prior probability. Similarly, the other indicators within each component were adjusted adequately by prior and conditional probabilities. For example, the drainage capacity indicator of the flood protection component was weighted as 0.50 and 0.45 in two surveys, respectively, while it was weighted as 0.35 in the entropy method, and its integrated weight became 0.36.
Moreover, the annual precipitation of the climate component was weighted with a small value of 0.01 in the entropy method, but the integrated weight was 0.06 because it was weighted with 0.23 and 0.28 in the two surveys. The BN model has an effective and optimal decision-making capability to integrate different knowledge and data [36,37]. Thus, BNs are expected to be a new alternative in assigning weights between indicators.

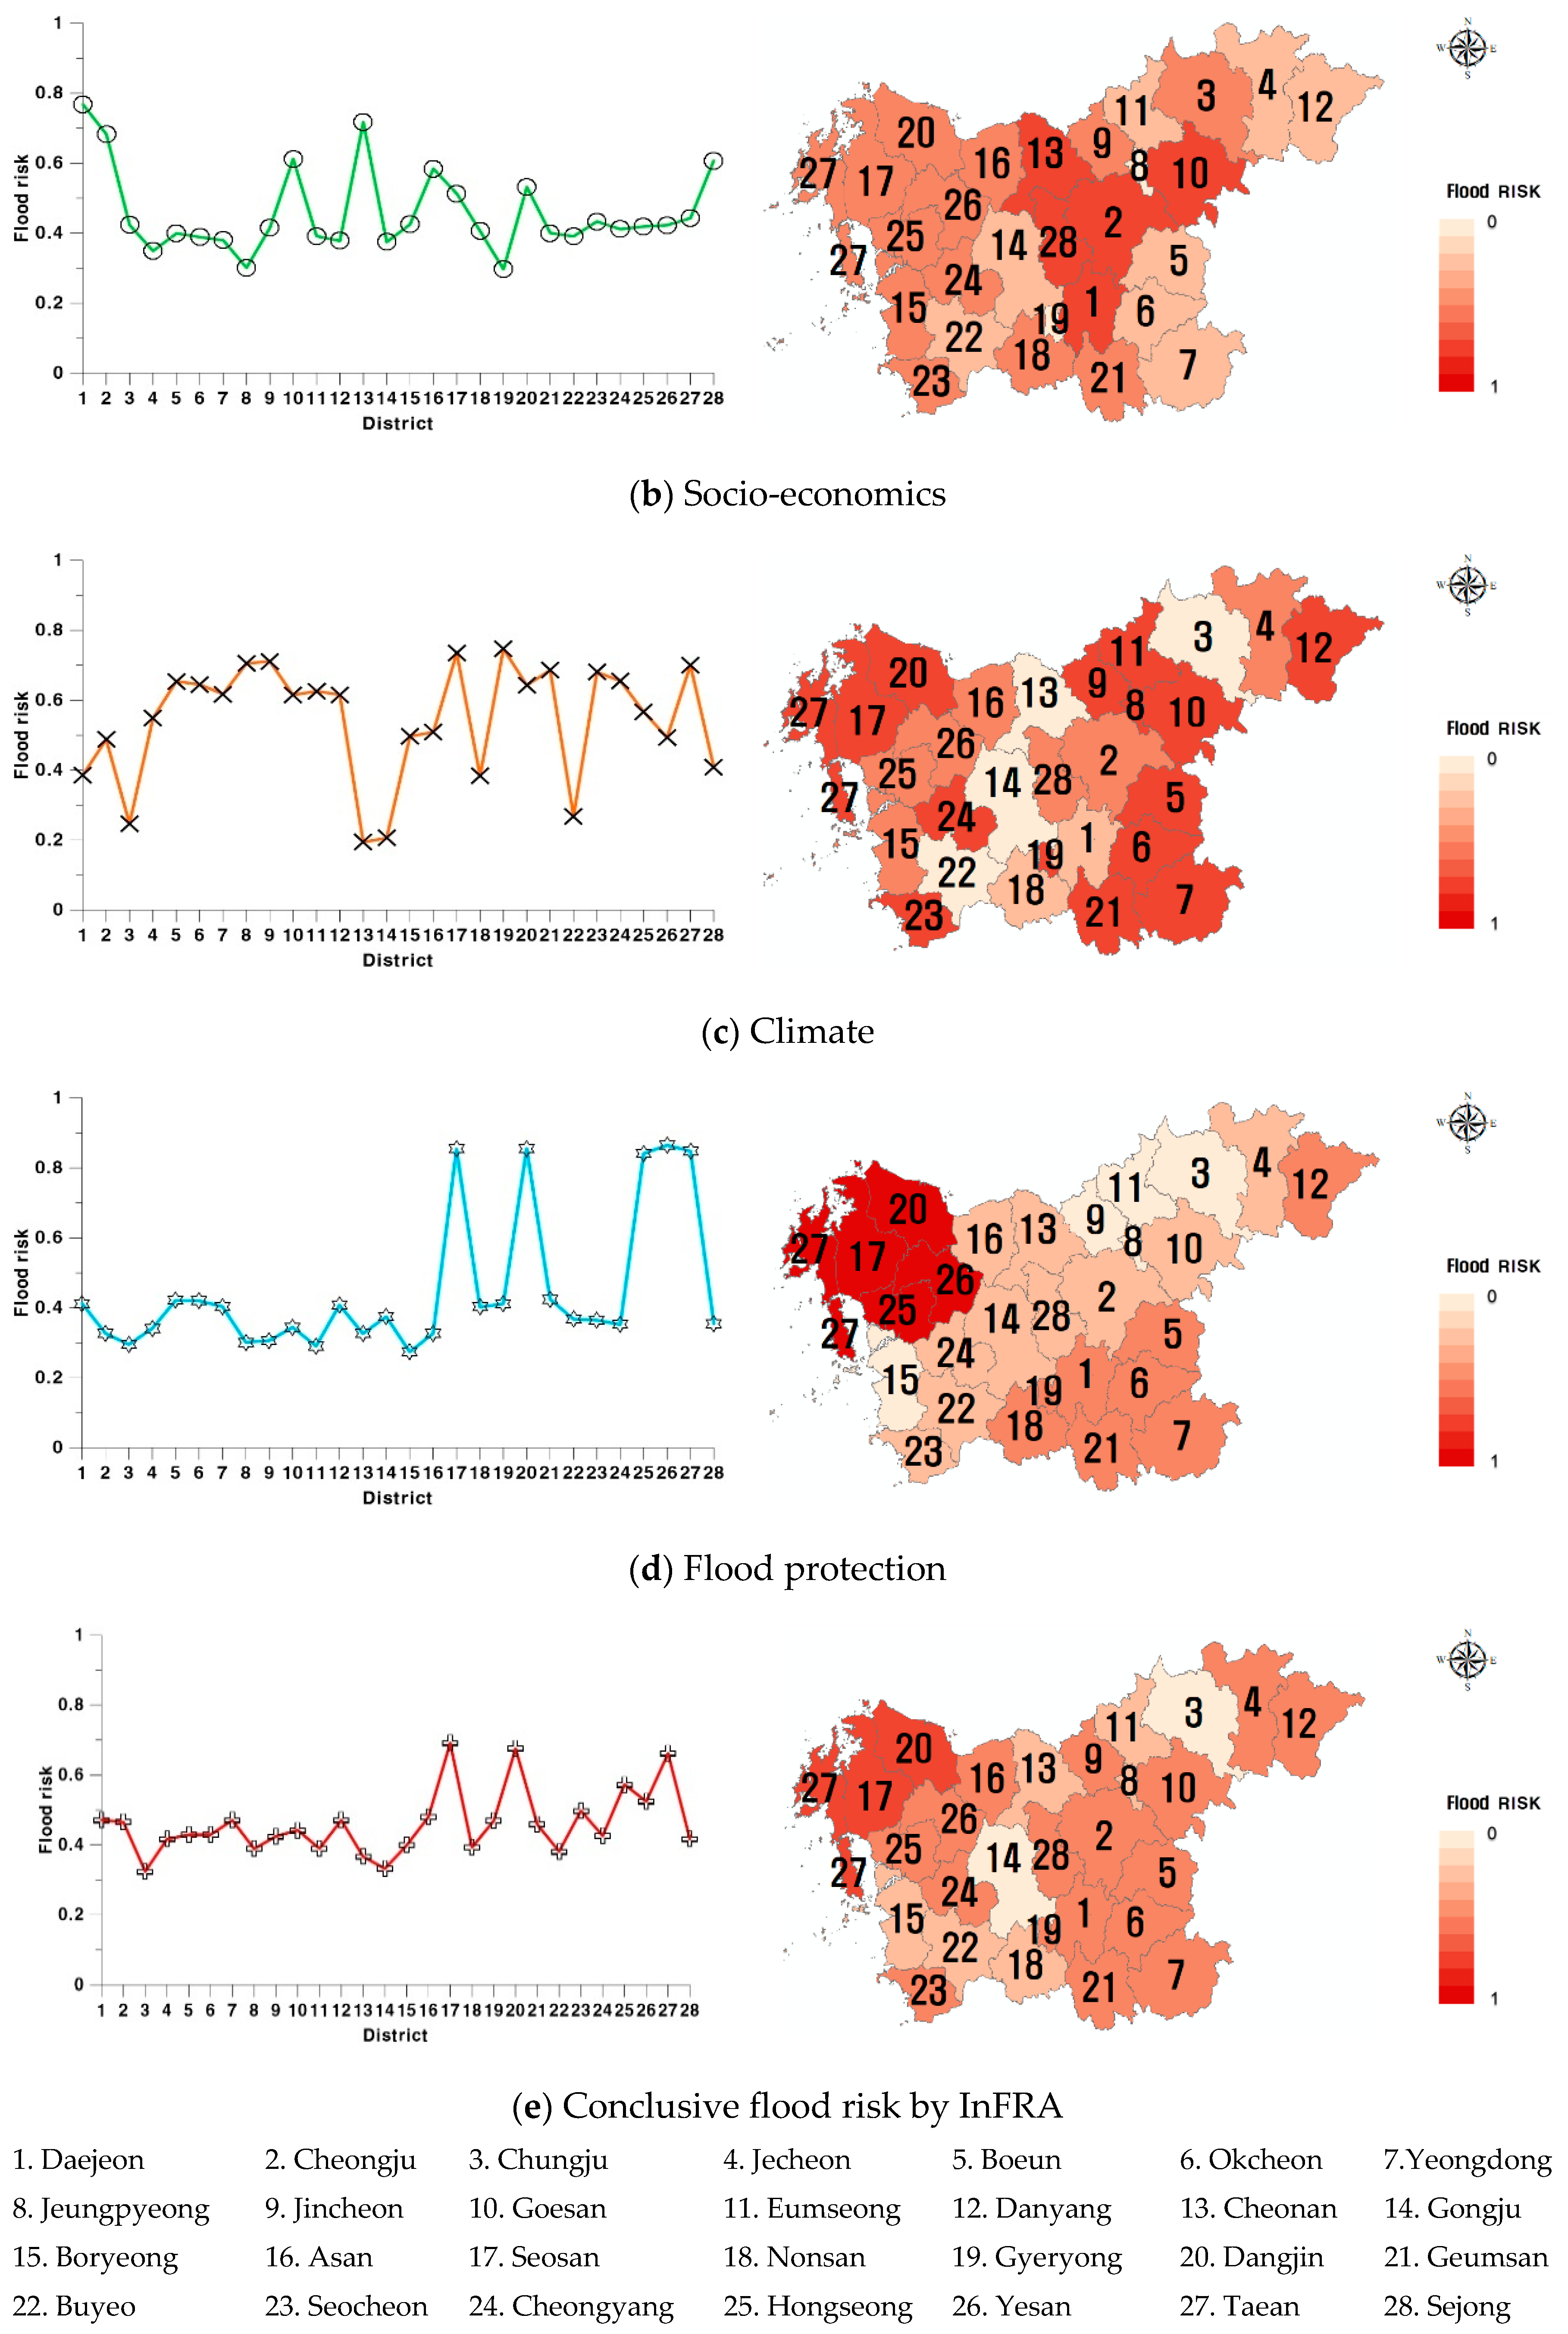
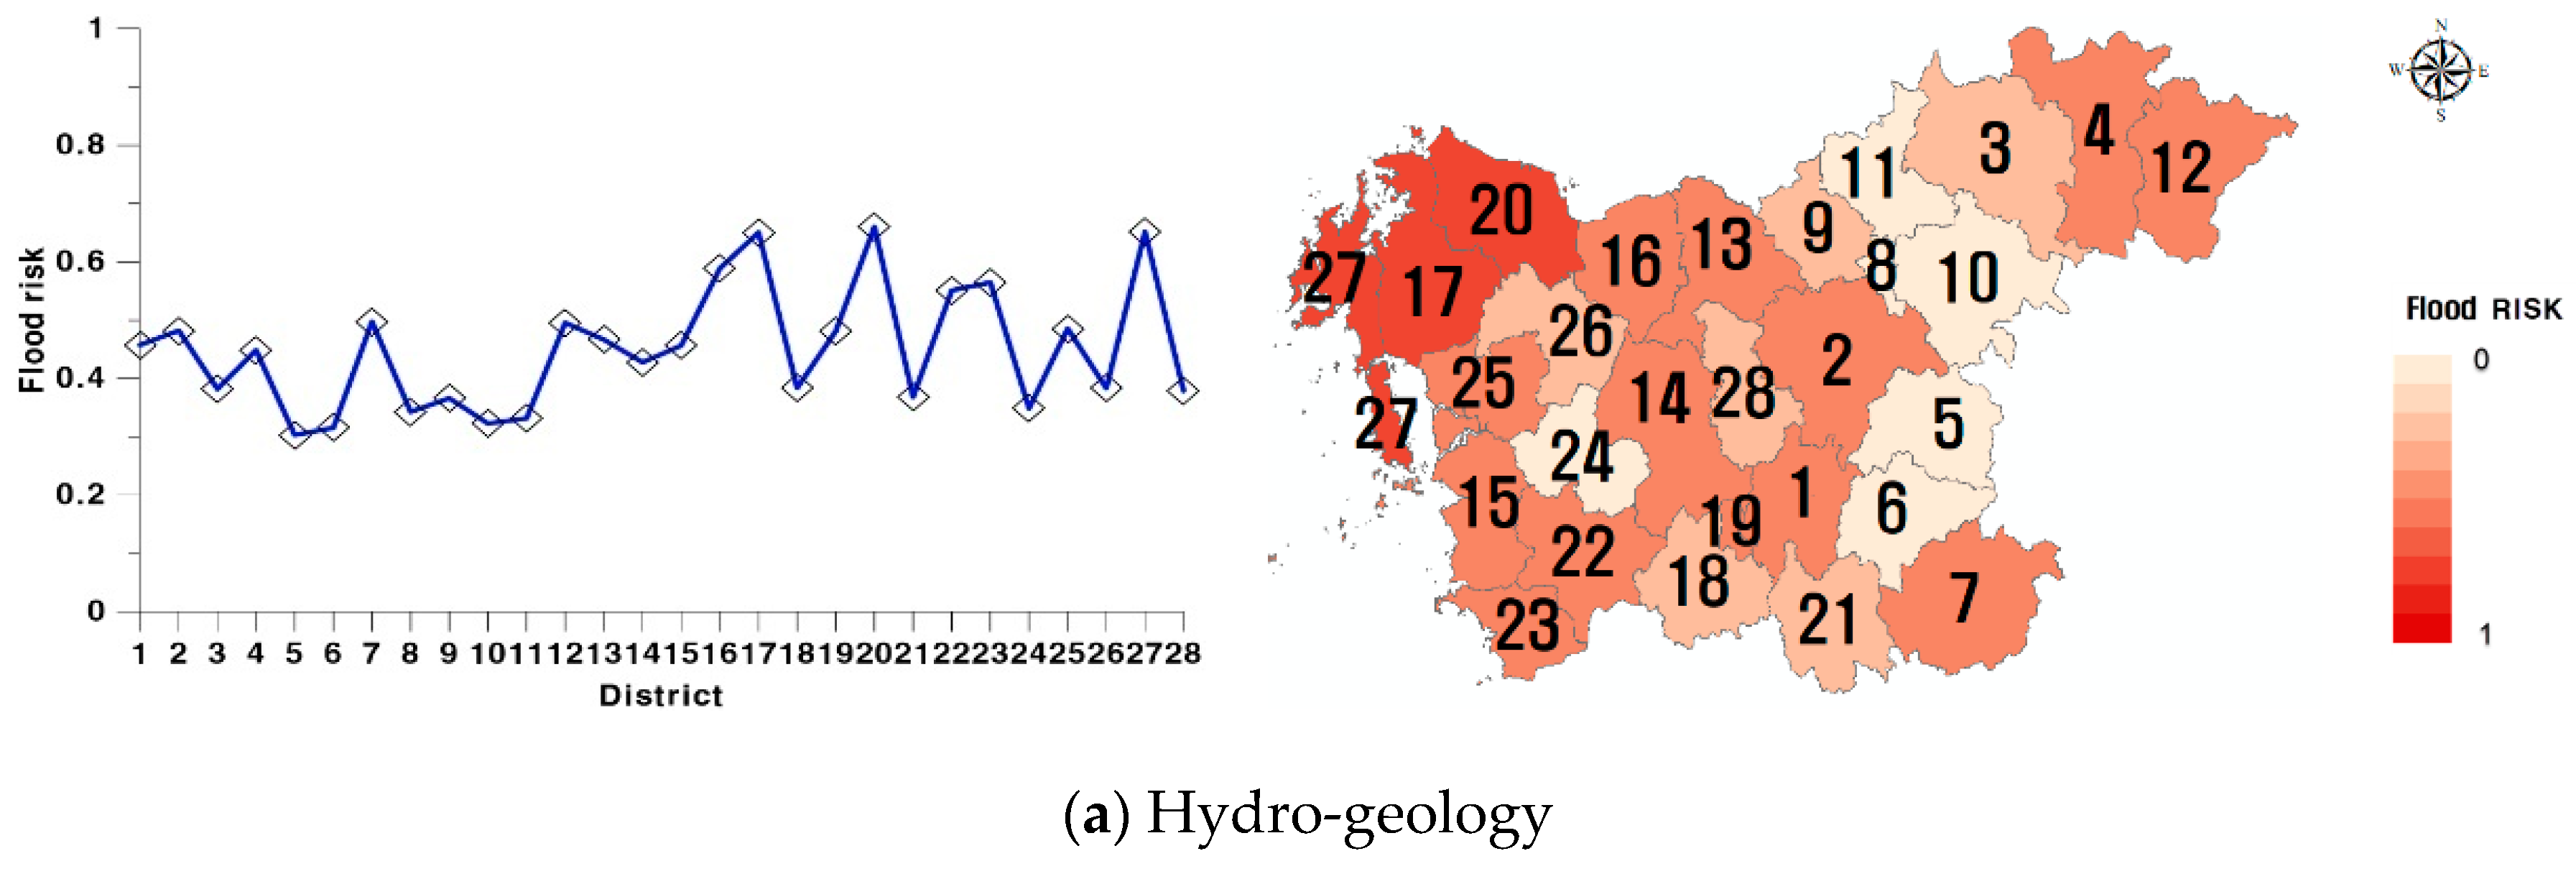
3.4. Results of Calculation with InFRA

The final InFRA was estimated for hydro-geology, socio-economics, flood protection, and climate components in 28 cities in the Chungcheong Province using several formulas (see Figure 4). As a result, InFRA did not show a significant gap between regions except for some areas and showed a flood risk of 0.3–0.5 in most places. The resulting values for Seosan (17), Dangjin (20), and Taean (27) were close to 0.7, despite their low risk from the socio-economic component. This occurred because the risk from the other components was high. Some village areas including Jeungpyeong (8) and Jincheon (9) showed a low InFRA level because they had a low level of flood protection and other components. The risk related to the hydro-geology component was high in the countryside because these areas are more influenced by flood damage, and there are more lowland areas than urban areas. In the socio-economic component, the indicators of the total number of houses and financial independence rate showed a high risk in large cities, followed by some villages that have a high dependent population.
In the flood protection component, large and medium cities showed a high level of protection, whereas villages showed a low level of protection because they lack flood protection systems. The flood protection component shown in Figure 6 is expressed in the concept of “1-flood protection,” so it is interpreted accordingly. In the climate component, the basins were clustered in a continuous pattern and showed a constant flood risk, particularly in coastal areas according to the consistent measurement of the measurement stations in the Thiessen network along the coastal cities. This is attributed to the high frequency of intense rainfall in coastal areas, and thus, the frequency of intensive rainfall indicator is weighted higher than the annual precipitation indicator.

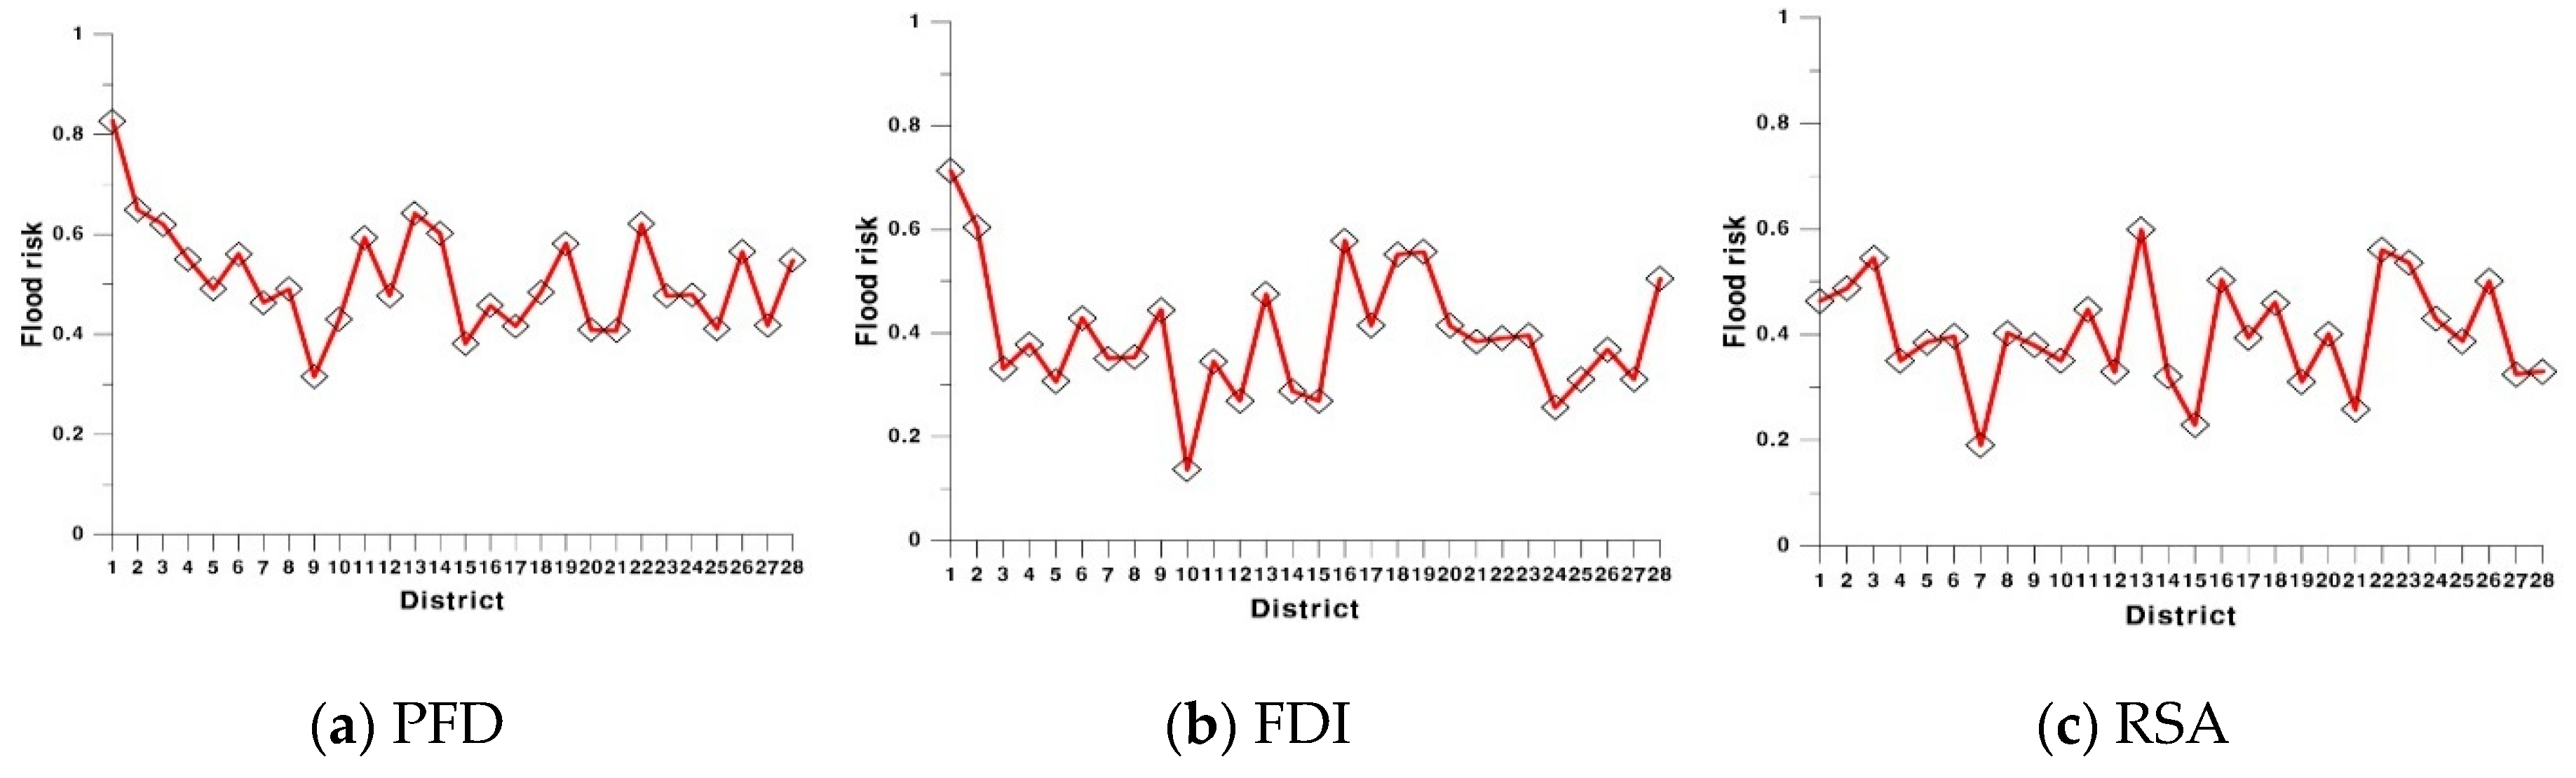
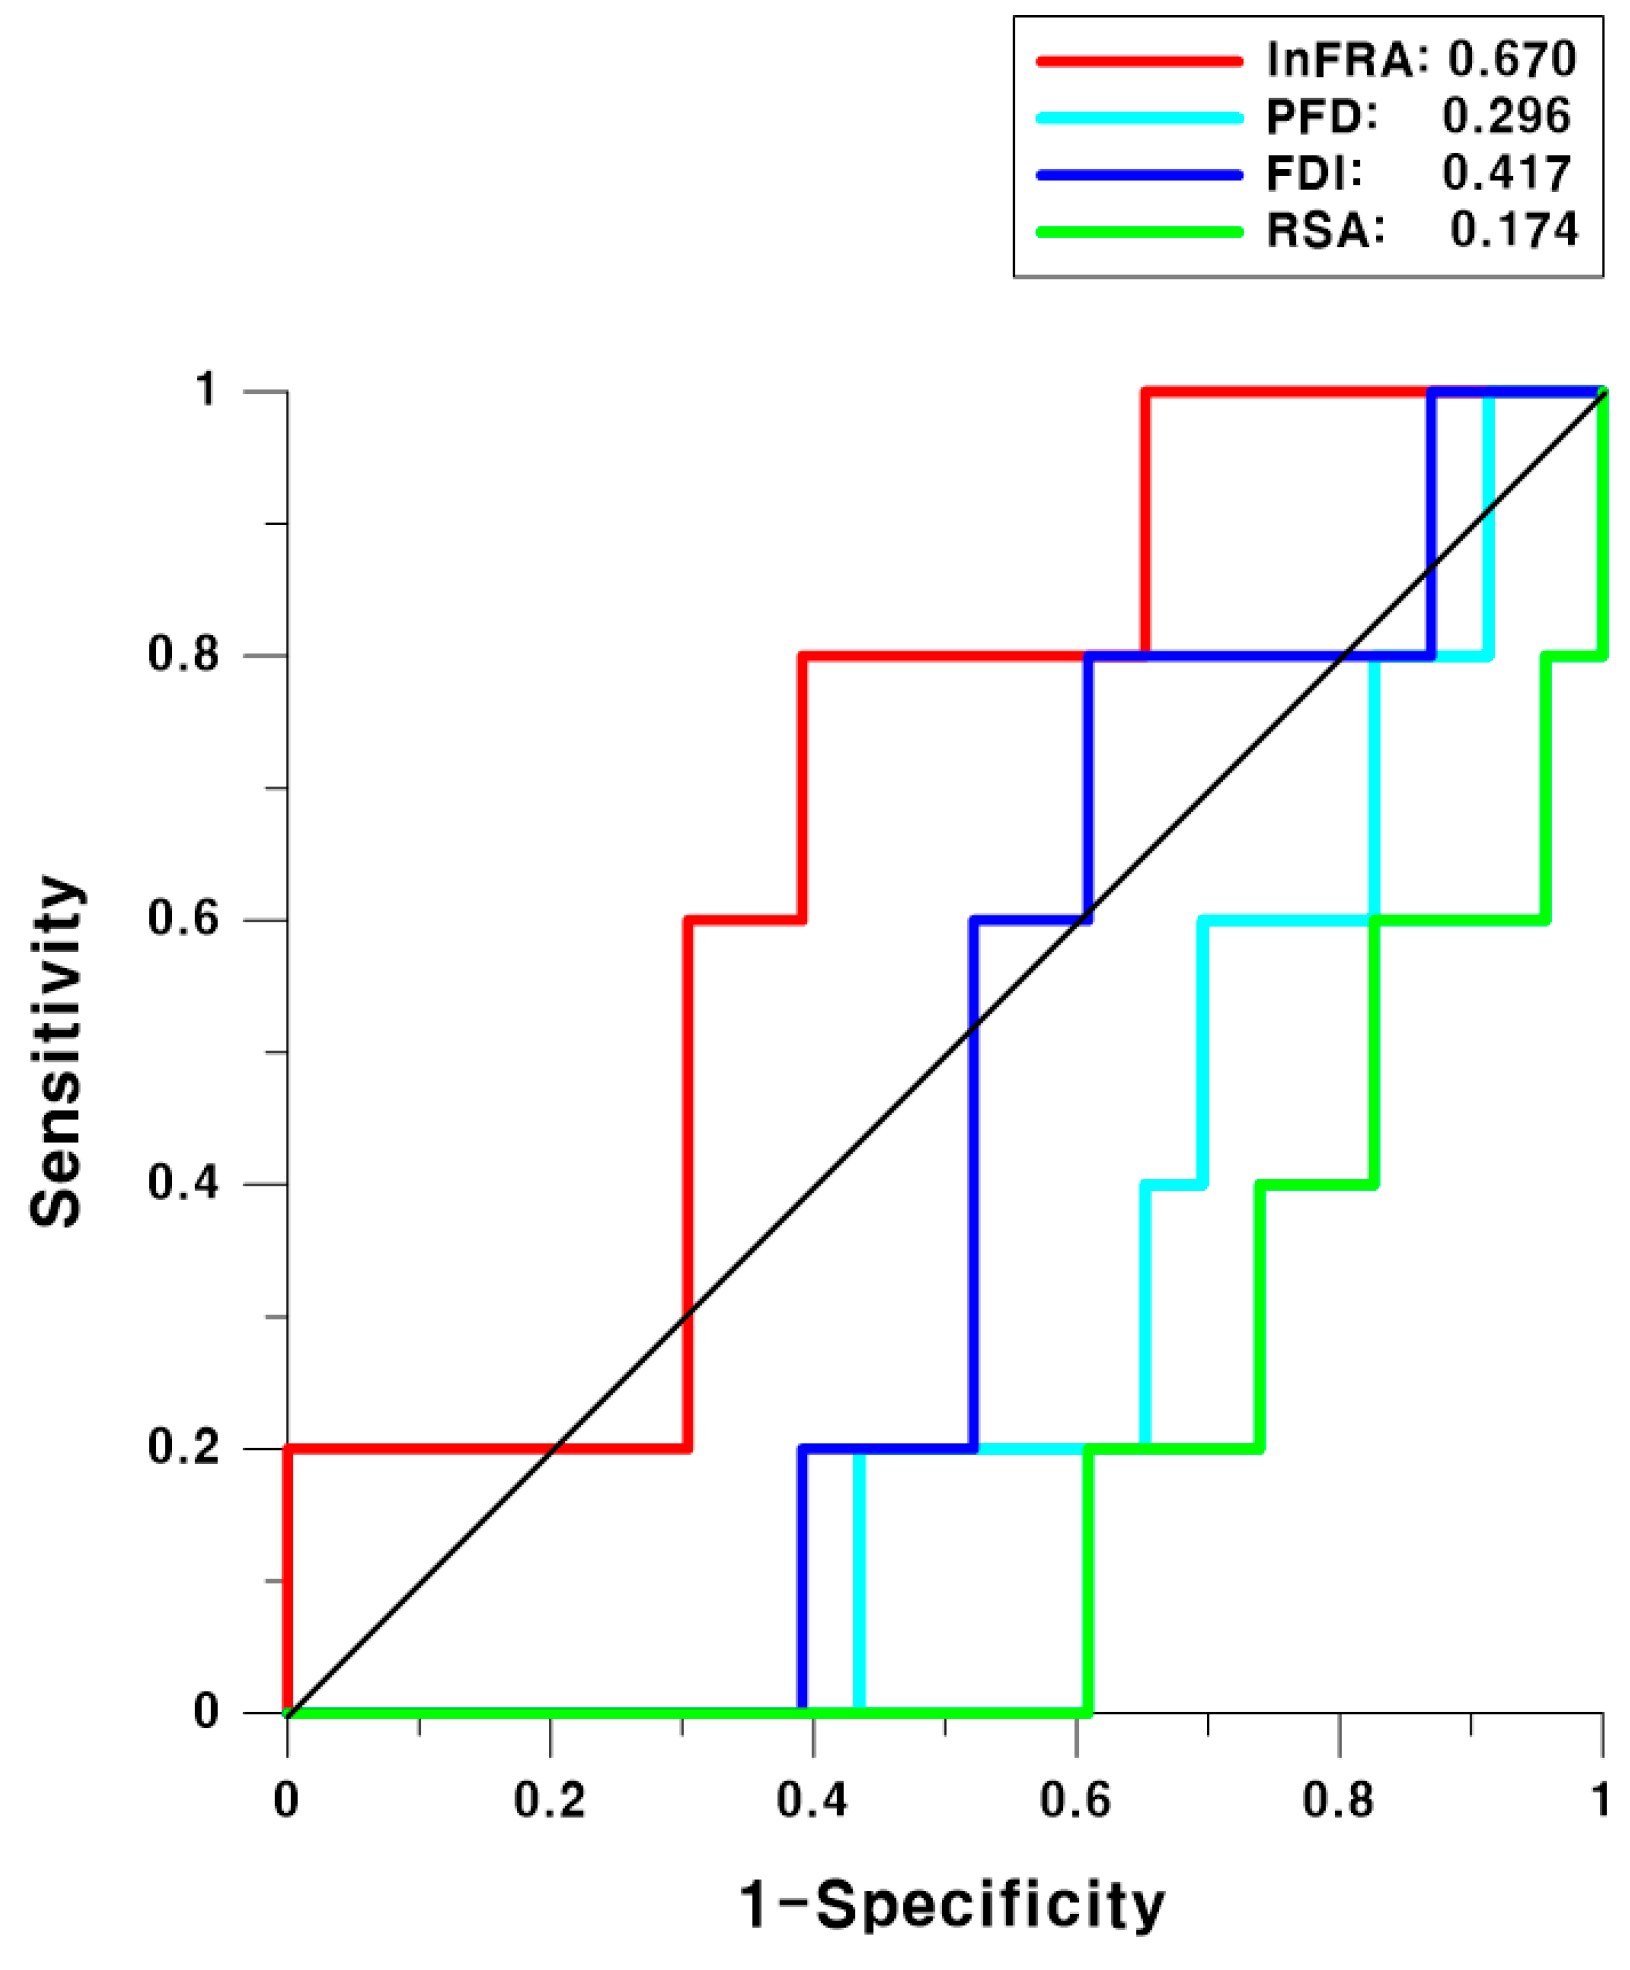
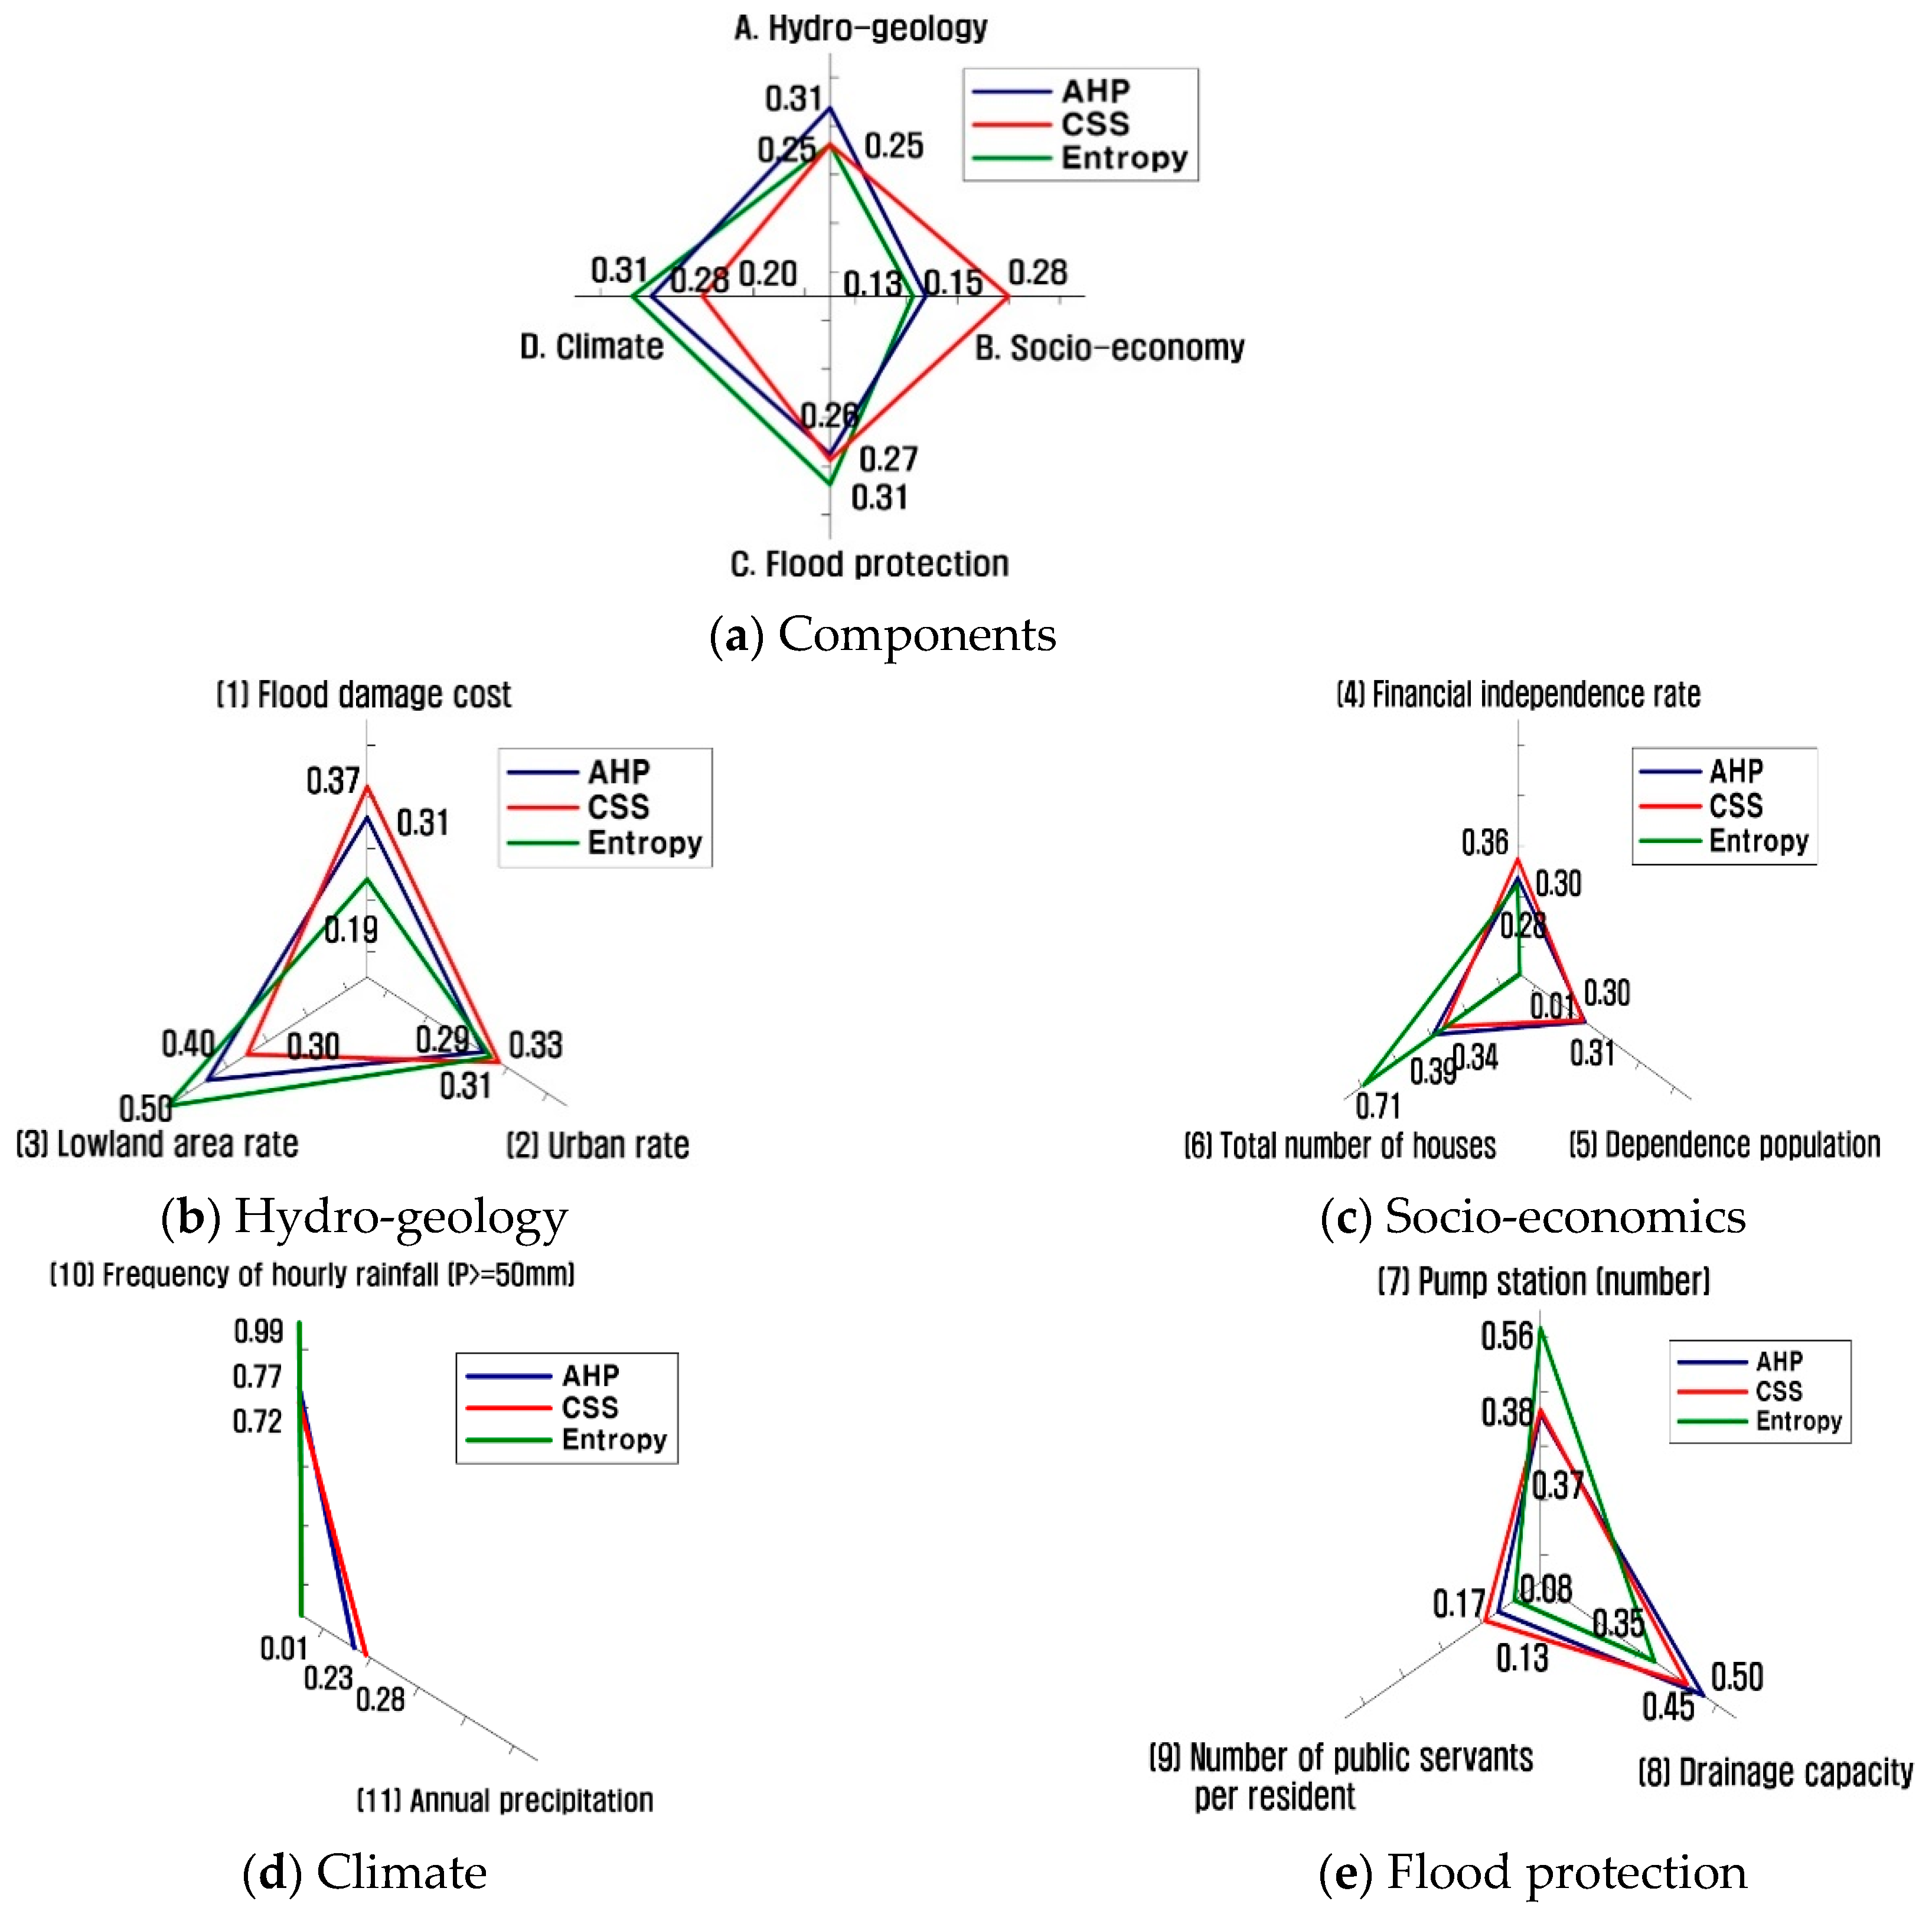
3.5. Comparison with Other Methods and Discussion

The proposed method was compared with other three methods used to assess flood risk: PFD, FDI, and RSA [15,17,21]. The three methods are the most popular in a practical field because they are easy to collect data and simple to apply. These methods are briefly explained in Table 5. However, the same assessment criteria must be used to compare the two sets of methods. The other assessment methods use various criteria with grades (1–5) or groups (A–D), and thus, comparing the methods using the same set of criteria is not appropriate. Therefore, they were compared in an alternative way using risk values between 0 and 1 instead of using grades or groups for a consistent comparison. In all the assessment methods, the risk of flood increased when the risk value was closer to 1, indicating that appropriate measures need to be taken for flood mitigation.
The other assessment methods generally showed high flood risk in cities and low risk in villages. In particular, flood risks were high in Daejeon, Cheongju, Chungju, and Cheonan but low in Yeongdong, Jincheon, Goesan, and Geumsan. The other assessment methods were polarized in urban and rural areas and showed large regional variations compared to InFRA (see Figure 7). It seems that the duplicated meaning in the construction of indicators and the insufficient level of flood protection in cities are major reasons for such results. Nevertheless, indicators such as population, financial independence rate, and infrastructure are typically high in urban areas. Thus, the other risk assessment methods are considered to have produced somewhat overestimated values because they use a system that would inevitably estimate large flood risk in large cities.
This comparison was qualitative, and a quantitative comparison is necessary. Therefore, the methods were validated by analyzing the area under the curve (AUC) of the receiver operating characteristic (ROC) curve. The ROC curve is a graph where the x-axis shows the specificity, which indicates the probability of the estimated value being false. The y-axis shows the sensitivity, which indicates the probability of the estimated value being true. That is, the evaluation method is better if the risk assessment is more likely to be correct and has a lower false probability rate. A higher AUC indicates higher accuracy of the prediction, and the accuracy of the results increases as AUC approaches 1.
The limit of this validation is that the factors to be compared must be considered to evaluate the accuracy of each method, but the assessment factors are already included as indicators, and there is no suitable criterion to apply. As the best alternative, data from [38] were used, and total flood damage costs were derived, including injuries and flooding of farmland and cities, for the flood damage cost for public facilities (see Table 6). Then, the integrated sums were normalized. If the value is 0.5 or higher, the corresponding region is considered to have high damage cost. The ROC analysis was then conducted.
According to the AUC of the ROC, the accuracy of InFRA was 0.67, while that of PFD, FDI, and RSA was less than 0.5 (0.296, 0.417 and 0.174, respectively). Thus, they were withdrawn from the assessment of flood damage cost (see Figure 8). In other words, the other risk assessment methods were revealed to be inappropriate for assessing flood damage costs. The evaluation showed that InFRA is better than the classic methods for assessing flood risk and could thus be applicable in the field.

4. Conclusions

Numerous methods have been developed to assess flood risk. In this study, a methodology was proposed for use in decision-making by integrating existing methods rather than developing another flood risk assessment method. First, previous flood risk assessment methods were evaluated (PFD, EFVI, FDRRI, FVA, FDI, and RSA), and four components and 28 indicators were extracted. Factor analysis and PCA were carried out, and 11 of the 28 indicators were selected as a result. Then, the weights of each component and indicator were estimated by the AHP, CSS, and entropy methods, and the results of each method differed from one another. Therefore, BNs that integrate the conventional weight assignment methods were structured to estimate integrated weights.
The BN-based InFRA was applied to target regions to estimate the flood risk of each region. The result of both qualitative and quantitative comparisons between InFRA and the conventional methods demonstrated the excellent applicability of InFRA. The InFRA methodology can integrate various other flood risk assessment methods and it could be used as a useful tool in decision-making for flood risk management.

Author Contributions

Conceptualization and methodology, H.J. and S.K.; statistical analysis, C.C., J.K. and D.K.; writing-original draft preparation, H.J.; Final review, H.S.K.; supervision, S.K. and H.S.K.

Funding

This research was supported by a grant [MOIS-DP-2015-05] through the Disaster and Safety Management Institute funded by Ministry of the Interior and Safety of Korean government.

Conflicts of Interest

The authors declare no conflicts of interest.

References

  1. Luo, P.; Mu, D.; Xue, H.; Duc, T.N.; Dinh, K.D.; Takara, K.; Nover, D.; Schladow, S.G. Flood inundation assessment for the Hanoi Central Area, Vietnam under historical and extreme rainfall conditions. Sci. Rep. (Nat.) 2018, 8, 12623. [Google Scholar] [CrossRef] [PubMed]
  2. Luo, P.; He, B.; Takara, K.; Xiong, Y.E.; Nover, D.; Duan, W.; Fukushi, K. Historical Assessment of Chinese and Japanese Flood Management Policies and Implications for Managing Future Floods. Environ. Sci. Policy 2015, 48, 265–277. [Google Scholar] [CrossRef]
  3. Federal Emergency Management Agency. Flood Information Tool User Manual (Rev. 7); FEMA: Washington, DC, USA, 2003.
  4. National Oceanic and Atmospheric Administration. Risk Vulnerability Assessment Tool; NOAA: Washington, DC, USA, 2007.
  5. Annual Report 2004: Advancing Innovation; Munich Re Group: München, Germany, 2004.
  6. Tyndall Centre. Vulnerability, Risk and Adaptation: A Conceptual Framework, Tyndall Centre for Climate Change Research; Tyndall Centre: Norwich, Norfolk, UK, 2003. [Google Scholar]
  7. Rygel, L.; O’Sullivan, D.; Yarnal, B. A method for constructing a social vulnerability index: An application to hurricane storm surges in a developed country. Mitig. Adapt. Strateg. Glob. Chang. 2006, 11, 741–764. [Google Scholar] [CrossRef]
  8. Chang, L.F.; Huang, S.L. Assessing urban flooding vulnerability with an emergy approach. Landsc. Urban Plan 2015, 143, 11–24. [Google Scholar] [CrossRef]
  9. Kablan, M.K.A.; Dongo, K.; Coulibaly, M. Assessment of social vulnerability to flood in urban Côte d’Ivoire using the MOVE Framework. Water 2017, 9, 292. [Google Scholar] [CrossRef]
  10. Luo, P.; Zhou, M.; Deng, H.; Lyu, J.; Cao, W.; Takara, K.; Nover, D.; Schladow, S.G. Impact of forest maintenance on water shortages: Hydrologic modeling and effects of climate change. Sci. Total Environ. 2018, 615, 1355–1363. [Google Scholar] [CrossRef] [PubMed]
  11. Luo, P.; He, B.; Duan, W.; Takara, K.; Nover, D. Impact assessment of rainfall scenarios and land-use change on hydrologic response using synthetic Area IDF curves. J. Flood Risk Manag. 2015, 11, S84–S97. [Google Scholar] [CrossRef]
  12. Environment Agency. Catchment Flood Management Plans: CFMP Guidelines Volume 1 Consultant Report; EA: Almondsbury, Bristol, UK, 2004.
  13. Jeollabuk-do Total Human Institute National of Korea. Improv. Flood Plans Against Clim. Chang. Jeollabuk-do 2010, 107, 1415–1419.
  14. Korea Institute of Civil Engineering and Building Technology. Strengthen Facility Standards Against Excess Climate; KICT: Ilsan, Gyeonggi, Korea, 2009. [Google Scholar]
  15. Korea Research Institute for Human Settlements. Analysis of Flood Damage Characteristics and Development of Flood Damage Index; KRIHS: Sejong, Korea, 2005. [Google Scholar]
  16. Korea Environment Institute. Development and Introduction of Indicators to Assess Vulnerability of Climate Change; KEI: Sejong, Korea, 2008.
  17. Ministry of Land, Transport and Maritime Affairs. National Water Resource Plan; MOLTMA: Sejong, Korea, 2001.
  18. Ministry of Land, Transport and Maritime Affairs. National Water Resource Plan (2010–2020); MOLTMA: Sejong, Korea, 2010.
  19. National Disaster Management Research Institute. Development of Assessment System for Flood Vulnerability Index; NDMI: Ulsan, Korea, 2012.
  20. National Institute for Land and Infrastructure Management. Flood Vulnerability Index; NIMIL: Tsukuba, Asahi, Japan, 2009.
  21. Seoul Institute. Development of the Regional Safety Assessment Model in Seoul–Focusing on Flood; SI: Seoul, Korea, 2006. [Google Scholar]
  22. World Meteorological Organization (WMO). Guide to Hydrological Practices, 5th ed.; WMO: Geneva, Switzerland, 2008. [Google Scholar]
  23. Rummel, R.J. Applied Factor Analysis, 1st ed.; Northwestern University: Illinois, IL, USA, 1988. [Google Scholar]
  24. Shlens, J. A Tutorial on Principal Component Analysis. Cornell Univ. 2014, 1404, 1101. [Google Scholar]
  25. Fischhoff, B. Value elicitation: Is there anything in there. Am. Psychol. 1991, 46, 835–847. [Google Scholar] [CrossRef]
  26. Keeny, R.L.; von Winterfeldt, D.V.; Eppel, T. Eliciting public values for complex policy decisions. Manag. Sci. 1990, 36, 1011–1030. [Google Scholar] [CrossRef]
  27. Joo, H.J.; Kim, S.J.; Lee, M.J.; Kim, H.S. A study on determination of investment priority of flood control considering flood vulnerability. J. Korean Soc. Hazard Mitig. 2017, 18, 417–429. [Google Scholar] [CrossRef]
  28. Saaty, R.W. The Analytic Hierarchy Process–What It Is and How It Is Used. Math. Model. 1987, 9, 161–176. [Google Scholar] [CrossRef]
  29. Dudek, F.J.; Baker, K.E. The constant method applied to scaling subjective dimensions. Am. J. Psychol. 1956, 69, 616–624. [Google Scholar] [CrossRef] [PubMed]
  30. Ozkul, S.; Harmancioglu, N.B.; Singh, V.P. Entropy-based assessment of water quality monitoring networks. J. Hydrol. Eng. 2000, 5, 90–100. [Google Scholar] [CrossRef]
  31. Jensen, F.V. An Introduction to Bayesian Networks; Springer: New York, NY, USA, 1966. [Google Scholar]
  32. Kim, S.J.; Rarhi, P.; Jun, H.D.; Lee, J.H. Evaluation of drought severity with a Bayesian network analysis of multiple drought indices. J. Water Resour. Manag. 2017, 144, 1–10. [Google Scholar] [CrossRef]
  33. Pearl, J. Probabilistic Reasoning in Intelligent Systems: Networks of Plausible Inference; Elsevier: San Francisco, CA, USA, 2014. [Google Scholar]
  34. Kaiser, H.F. An index of factorial simplicity. Psychometrika 1974, 39, 31–36. [Google Scholar] [CrossRef]
  35. Bartlett, M.S. Properties of sufficiency and statistical tests. Proc. R. Soc. Lond. Ser. A 1937, 160, 268–282. [Google Scholar]
  36. Castelletti, A.; Soncini-Sessa, R. Bayesian networks and participatory modelling in water resource management. Environ. Model. Softw. 2007, 22, 1075–1088. [Google Scholar] [CrossRef]
  37. Henriksen, H.J.; Barlebo, H.C. Reflections on the use of Bayesian belief networks for adaptive management. J. Environ. Manag. 2008, 88, 1025–1036. [Google Scholar] [CrossRef] [PubMed]
  38. Ministry of the Interior and Safety. Natural Disaster Investigation and Recovery Planning Guidelines; MOIS: Sejong, Korea, 2017.
Figure 1. Overview of factor analysis and principal component analysis (PCA).
Sustainability 11 03733 g001
Figure 2. Example of a Bayesian network.
Sustainability 11 03733 g002
Figure 3. Target area (Chungnam and Chungbuk Provinces).
Sustainability 11 03733 g003
Figure 4. Weight distribution.
Sustainability 11 03733 g004
Figure 5. BN configuration for integrated weight assignment.
Sustainability 11 03733 g005
Figure 6. Integrated Index for Flood Risk Assessment (InFRA) estimation.
Sustainability 11 03733 g006aSustainability 11 03733 g006b
Figure 7. Results of previous flood risk assessment methods.
Sustainability 11 03733 g007
Figure 8. Validation of flood risk assessment methods using receiver operating characteristic (ROC)-area under curve (AUC) analysis.
Sustainability 11 03733 g008
Table 1. Classification of components and indicators using six assessment methods.
ClassificationMOLTMANDMIJTHINKKRIHSSI
ComponentsIndicatorsEFVIPFDFDRRIFVAFDIRSA
A. Hydro-geology (1) Flood hazard area
(2) Flood damage cost for public facilities
(3) Imperviousness
(4) Urban rate
(5) Curve number (CN)
(6) Basin slope
(7) Lowland area rate
(8) Stream density
B. Socio-economy(9) Population density
(10) Asset (reference land price)
(11) Financial independence rate
(12) Infrastructure
(13) Dependence population
(14) Manufacturing output in value
(15) Total number of houses
C. Climate(16) Frequency of hourly rainfall (P ≥ 50 mm)
(17) Frequency of intensive rainfall per day (P ≥ 150 mm)
(18) Maximum hourly rainfall
(19) Annual precipitation
(20) Probability rainfall
D. Flood Protection(21) Levee maintenance
(22) Levee length
(23) Pump station (number)
(24) Pump station (capacity)
(25) Dam and reservoir
(26) Drainage capacity
(27) Number of public servants per resident
(28) Index of damage reduction ability
Table 2. Grouping and selection of representative indicators by PCA and factor analysis.
ClassificationComponent Points (Selected: ◎)EigenvalueKMOBarlett’s Test of Sphericity
Comp-OnentsIndic-AtorsGroupFactorChi-Squaredf(p)
123123
1. Hydro-geology(1)0.420 −0.168 0.751 4.431.961.340.75128.336(0)
(2)−0.479 −0.518 0.951
(3)0.351 0.674 0.055
(4)−0.229 0.895−0.092
(5)0.658 0.096 −0.080
(6)−0.237 −0.172 0.378
(7)0.850−0.096 −0.042
(8)−0.333 0.124 0.627
2. Socio-economy(9)0.764 0.286 0.198 4.351.541.010.67164.721(0)
(10)0.694 0.088 0.001
(11)0.147 0.9570.237
(12)0.595 0.216 0.150
(13)−0.412 −0.326 0.523
(14)0.144 0.351 0.010
(15)0.9020.354 0.158
3. Climate(16)0.827−0.018 - 2.301.18-0.6527.210(0)
(17)−0.572 0.580
(18)0.628 −0.500
(19)0.108 0.903
(20)−0.342 0.776
4. Flood protection(21)0.802 −0.030 −0.32 2.871.461.250.5478.728(0)
(22)0.610 0.562 −0.045
(23)0.9280.096 −0.119
(24)0.522 −0.042 0.024
(25)0.372 0.398 0.526
(26)0.199 0.862−0.071
(27)−0.216 −0.349 0.667
(28)0.103 0.624 0.073
Table 3. Weight assignment for the representative indicators.
ComponentsWeight 1 (AHP)Weight 2 (CSS)Weight 3 (Entropy)IndicatorsWeight 1 (AHP)Weight 2 (CSS)Weight 3 (Entropy)
A. Hydro-geology 0.250.310.25(2) Flood damage cost for public facilities0.310.370.19
(4) Urban rate0.290.330.31
(7) Lowland area rate0.400.300.50
B. Socio-economy0.130.150.28(11) Financial independence rate0.300.360.28
(13) Dependent population0.310.300.01
(15) Total number of houses0.390.340.71
C. Climate0.310.280.20(16) Frequency of hourly rainfall (P ≥ 50 mm)0.770.720.99
(19) Annual precipitation0.230.280.01
D. Flood Protection0.310.260.27(23) Pump station (number)0.370.380.56
(26) Drainage capacity0.500.450.35
(27) Number of public servants per resident0.130.170.08
Table 4. Resulting integrated weights.
ComponentsWeights Using Bayesian Networks (AHP, CSS, and Entropy)IndicatorsWeights Using Bayesian Networks (AHP, CSS, and Entropy)
A. Hydro-geology 0.26(2) Flood damage cost0.32
(4) Urban rate0.28
(7) Lowland area rate0.40
B. Socio-economy0.20(11) Financial independence rate0.31
(13) Dependent population0.21
(15) Total number of houses0.48
C. Climate0.26(16) Frequency of hourly rainfall (P ≥ 50 mm)0.84
(19) Annual precipitation0.16
D. Flood protection0.28(23) Pump station (number)0.51
(26) Drainage capacity0.36
(27) Number of public servants per resident0.13
Table 5. Basic information on other flood risk assessment methods.
Other MethodsMethod for Selecting IndicatorsMethod for Assigning WeightsFormula
PFDSelected based on the subjective judgment of the researchersAssigned based on the subjective judgment of the researchers PFD = P o t e n t i a l a 1 × R i s k a 2
FDISelected based on the subjective judgment of the researchersCSS FDI = j = 1 n ( W j × Z i j )
RSASelected based on the subjective judgment of the researchersCSS RSA = α × R i s k × R e d u c t i o n
Table 6. Estimated total flood damage cost by district.
DistrictPeriod: 2007–2016 (Units: Thousand KRW)DistrictPeriod: 2007–2016 (Units: Thousand KRW)
Flood Damage Cost for Public FacilitiesTotal Flood Damage CostFlood Damage Cost for Public FacilitiesTotal Flood Damage Cost
Daejeon28,904,38847,212,788Boryeong32,401,71083,801,710
Cheongju91,359,48892,472,688Asan48,656,59873,920,798
Chungju104,137,429131,245,429Seosan114,830,315190,237,515
Jecheon186,090,075246,660,075Nonsan47,680,08396,512,883
Boeun71,415,56491,802,764Gyeryong51,490,99161,412,991
Okcheon52,452,80976,211,609Dangjin90,928,932102,690,132
Yeongdong538,481,881559,584,281Geumsan116,518,336248,099,536
Jeungpyeong47,680,08368,518,883Buyeo84,734,079103,852,079
Jincheon110,242,303135,001,103Seocheon27,608,99188,375,991
Goesan93,072,362130,146,762Cheongyang34,453,31590,744,515
Eumseong80,755,77585,305,375Hongseong46,091,10159,817,901
Danyang310,987,567332,961,167Yesan39,018,18251,444,182
Cheonan47,680,08355,908,083Taean106,713,297140,302,897
Gongju90,773,723128,253,723Sejong18,198,89434,950,094

