1. Introduction
Over the past 35 years, the public sector has undergone major changes. This can mainly be attributed to the liberalisation policy that was implemented in most Western countries in the 1980s. Under the influence of the economic crisis, the emergence of market thinking and the new public management philosophy, in which an increase in the productivity and efficacy of the public sector took central place, the aim of the policy was to reduce the role of government in society. Remote administration, the reduction and simplification of rules, greater autonomy for public and semi-public organisations, the consolidation of organisations and, where possible, the introduction of market forces and privatisation were the main contributions of the liberalisation policy.
This policy focused primarily on the network sectors, such as the energy sector, the railways and the drinking water sector, which at the time were referred to as the utility sectors due to the overall usefulness of the goods and services provided by the companies in these sectors. Apart from their provision of utility services, these network sectors also differ from other economic sectors due to their considerable external impacts on the environment, public health and safety, and the fact that goods or services are delivered by means of a permanent physical infrastructure. A related issue is the fact that the network sectors are also characterised by high sunk costs and economies of scale in production, which means that duplication of a network is socially inefficient, thus bringing about a monopolistic situation. In the past, these characteristics were important reasons for putting the production of goods and services in the hands of the government. The aim of the liberalisation policy was to return some of this control to the market. Improving efficiency was by far the most important goal of this policy. As a result, the prices of products and services would fall, whilst simultaneously improving their quality [
1].
In order to realise this efficiency-enhancing policy, the government has a number of instruments at its disposal. They vary from changes in funding, consolidation of organisations, organisational improvements, downsizing bureaucratic procedures and protocols, and introducing forms of new public management (yardstick competition, extending accountability). These policy instruments can be subdivided into four categories, coinciding with four basic control options to influence the behaviour of the actors involved: funding, ownership, market organisation and external instruments [
1]. The last-mentioned refers to instruments that affect demand-side behaviour. Policymakers in the drinking water industry have primarily focused on two types of market organisation reform: consolidation of the industry by stimulating mergers and the introduction of yardstick competition by applying benchmarks.
The question we ask here is whether these two instruments have improved productivity. It is therefore important to have an insight into productivity change and how productivity change can be influenced. Therefore, the following two research questions can be derived:
What is the productivity change in the drinking water sector in the past four decades?
Has productivity change been influenced by government policy, in particular by industry consolidation and yardstick competition?
We answer these two questions by presenting a historical analysis of the productivity change of the drinking water sector in the Netherlands. Using an econometric time series analysis of inputs and outputs of the drinking water sector, sector productivity is estimated for the period 1980–2016. The observed productivity development is then linked to the two policy reforms that took place during that period. Whereas consolidation was imposed over a long period—namely between 1980 and 2005—yardstick competition was introduced in 1999 on a voluntary basis and made mandatory through legislation in 2011. We test the hypotheses that economies of scale exist and that the drinking water industry under yardstick competition performs better than it did in the period before the introduction of yardstick competition. In other words, we test whether the average productivity of the drinking water sector in different periods of time differs, and whether these differences are related to the main policy reforms in those periods of time.
2. Literature
To improve public sector performance, governments around the globe have tried a wide range of management reforms, such as the contracting out of services and the privatisation of organisations, and with respect to public service delivery, obligatory benchmarking to create a simulated competitive market environment [
2]. Benchmarking is a management instrument for comparing the performance of organisations that originate from the private sector [
3]. Since the rise of the ‘new public management’ [
4], public organisations are often managed in a business-like manner; consequently, the use of benchmarking in the public sector has increased. Blank et al. [
5] and Andersen et al. [
6] claim that nowadays performance is possibly the most important concept in public administration and the improvement of public services; the productivity of public organisations and the quality of their services are considered as the central responsibilities of government [
7].
Performance measurement is the process of quantifying the effectiveness and efficiency of actions [
8]. Neely et al. [
9] define a performance measurement system as a set of measures used to quantify the effectiveness and efficiency of these actions. They explain that from a corporative perspective, effectiveness is understood as the level of service achieved in relation to consumer needs, while efficiency refers to the economic use of company resources to provide consumers with a certain level of satisfaction. Linking performance measurement to benchmarking Andersen and Fagerhaug [
10] assert that the benchmarking has several main objectives, namely to support decision making, to change behaviour and increase motivation, to monitor performance trends, to state priority and actions, to verify the effectiveness of optimisation measures already implemented, to aid the dissemination of organisational results via marketing, and to aid benchmarking processes.
Benchmarking is seen as a powerful instrument for quality improvement in the public sector [
11], but not only for quality improvement. Benchmarking in the public and the private sector is a similar process, although the objectives may be slightly different [
2]. Benchmarking in the public sector, for instance, is not only focused on productivity improvement; rather, it is presented as a tool for collaborative learning among public sector organisations to promote organisational learning and to enhance transparency [
12]. Transparency is crucial for government control of public services, while the benchmark in itself creates a kind of managed competition, which may lead to quality improvement [
13,
14].
Zairi and Leonard [
15] already expressed that performance measurement, if only internally focused, may have great limitations because it could be considered as focusing on effectiveness rather than competitiveness. Benchmarking, in contrast, ensures that performance establishes competitiveness and best practice through doing the right things right in the eyes of the end customer. Best practice in efficiency is particularly important in that respect. In many countries, increasing efficiency was therefore an important motive for introducing benchmarking into public sectors, including the drinking water sector.
In recent decades, a large number of studies have been carried out into the efficiency of drinking water services. An overview of this can be found in different articles [
16,
17,
18]. These and various other studies suggest that benchmarking often has a positive effect on the efficiency of the drinking water industry. The Dutch drinking water sector is commonly cited as having one of the best practices in that regard. The Dutch benchmarking scheme is one of the oldest in Europe and several studies have shown that since the introduction of the Dutch benchmarking scheme at the end of the 1990s, the performance of the drinking water companies has steadily increased [
19]. Dijkgraaf et al. [
20] estimate the total efficiency gain in the period 1997–2002 at around 8–12%. Schmitz and Dane [
21] claim a 23% efficiency improvement in the period 1997–2006. Other studies also show a strong increase in efficiency following the introduction of the benchmark [
1,
22].
The Dutch drinking water sector also performs well in comparison with the drinking water sector in other countries. De Witte and Marques [
23], for example, calculate from 2004 data that the Dutch drinking water industry operates more efficiently than the privatised English/Welsh sectors, the strict regulatory industry of Australia, and the municipal provision companies in Belgium and Portugal.
Although most studies assume that the Dutch efficiency gain is due to the introduction of the benchmark scheme, other factors may have influenced this. In particular, the industry consolidation may be considered in that respect. As discussed in the introduction, from 1980 onwards, Dutch policy with regard to the drinking water sector put a lot of emphasis on stimulating consolidation by encouraging mergers. Over the decades, this policy has resulted in a huge reduction in the number of drinking water companies and a proportional growth in the size of the remaining ones. The consolidation policy was largely motivated by the idea that operating at a larger scale increases the efficiency due to economies of scale. However, hard evidence for these benefits is lacking. Many studies have been conducted to assess the effects of scale on the efficiency of drinking water provision; see for instance the overviews given by different authors [
17,
24,
25,
26,
27]. These overviews show that there is little empirical evidence on the efficiency impact of mergers in the drinking water industry. De Witte and Dijkgraaf [
28] study the effects of mergers in the Dutch drinking water sector and come to the same conclusion. They note that although very small companies enjoy scale economies, larger utilities are not producing at lower cost. In their paper, they point in particular to the absence of the two underlying mechanisms of merger economies, namely scale economies and increased incentives to combat inefficiencies. As a result, only a negative efficiency effect of mergers remains: there are fewer opportunities for an effective benchmark. For an effective benchmarking, a minimum number of companies is required. A smaller number of companies potentially decreases the power of benchmarking; as a result, the efficiency gains will also decrease.
From the above studies it can be concluded that consolidation does not seem to be the decisive factor contributing to the efficiency of the drinking water sector. Benchmarking may be of greater significance, as the developments in the Dutch drinking water sector seem to show [
29]. In this article, we examine whether this is true.
3. Policy Reforms in the Dutch Drinking Water Supply Sector
The production and supply of drinking water in the Netherlands is currently handled by 10 drinking water companies, each with its own geographical supply area. The drinking water organisations are public limited companies whose shareholders are public parties, that is, municipalities and provinces. The companies are managed by a board of directors and are supervised by a non-executive board, an independent accountant and the Human Environment and Transport Inspectorate, which is part of the Ministry of Infrastructure and Water Management.
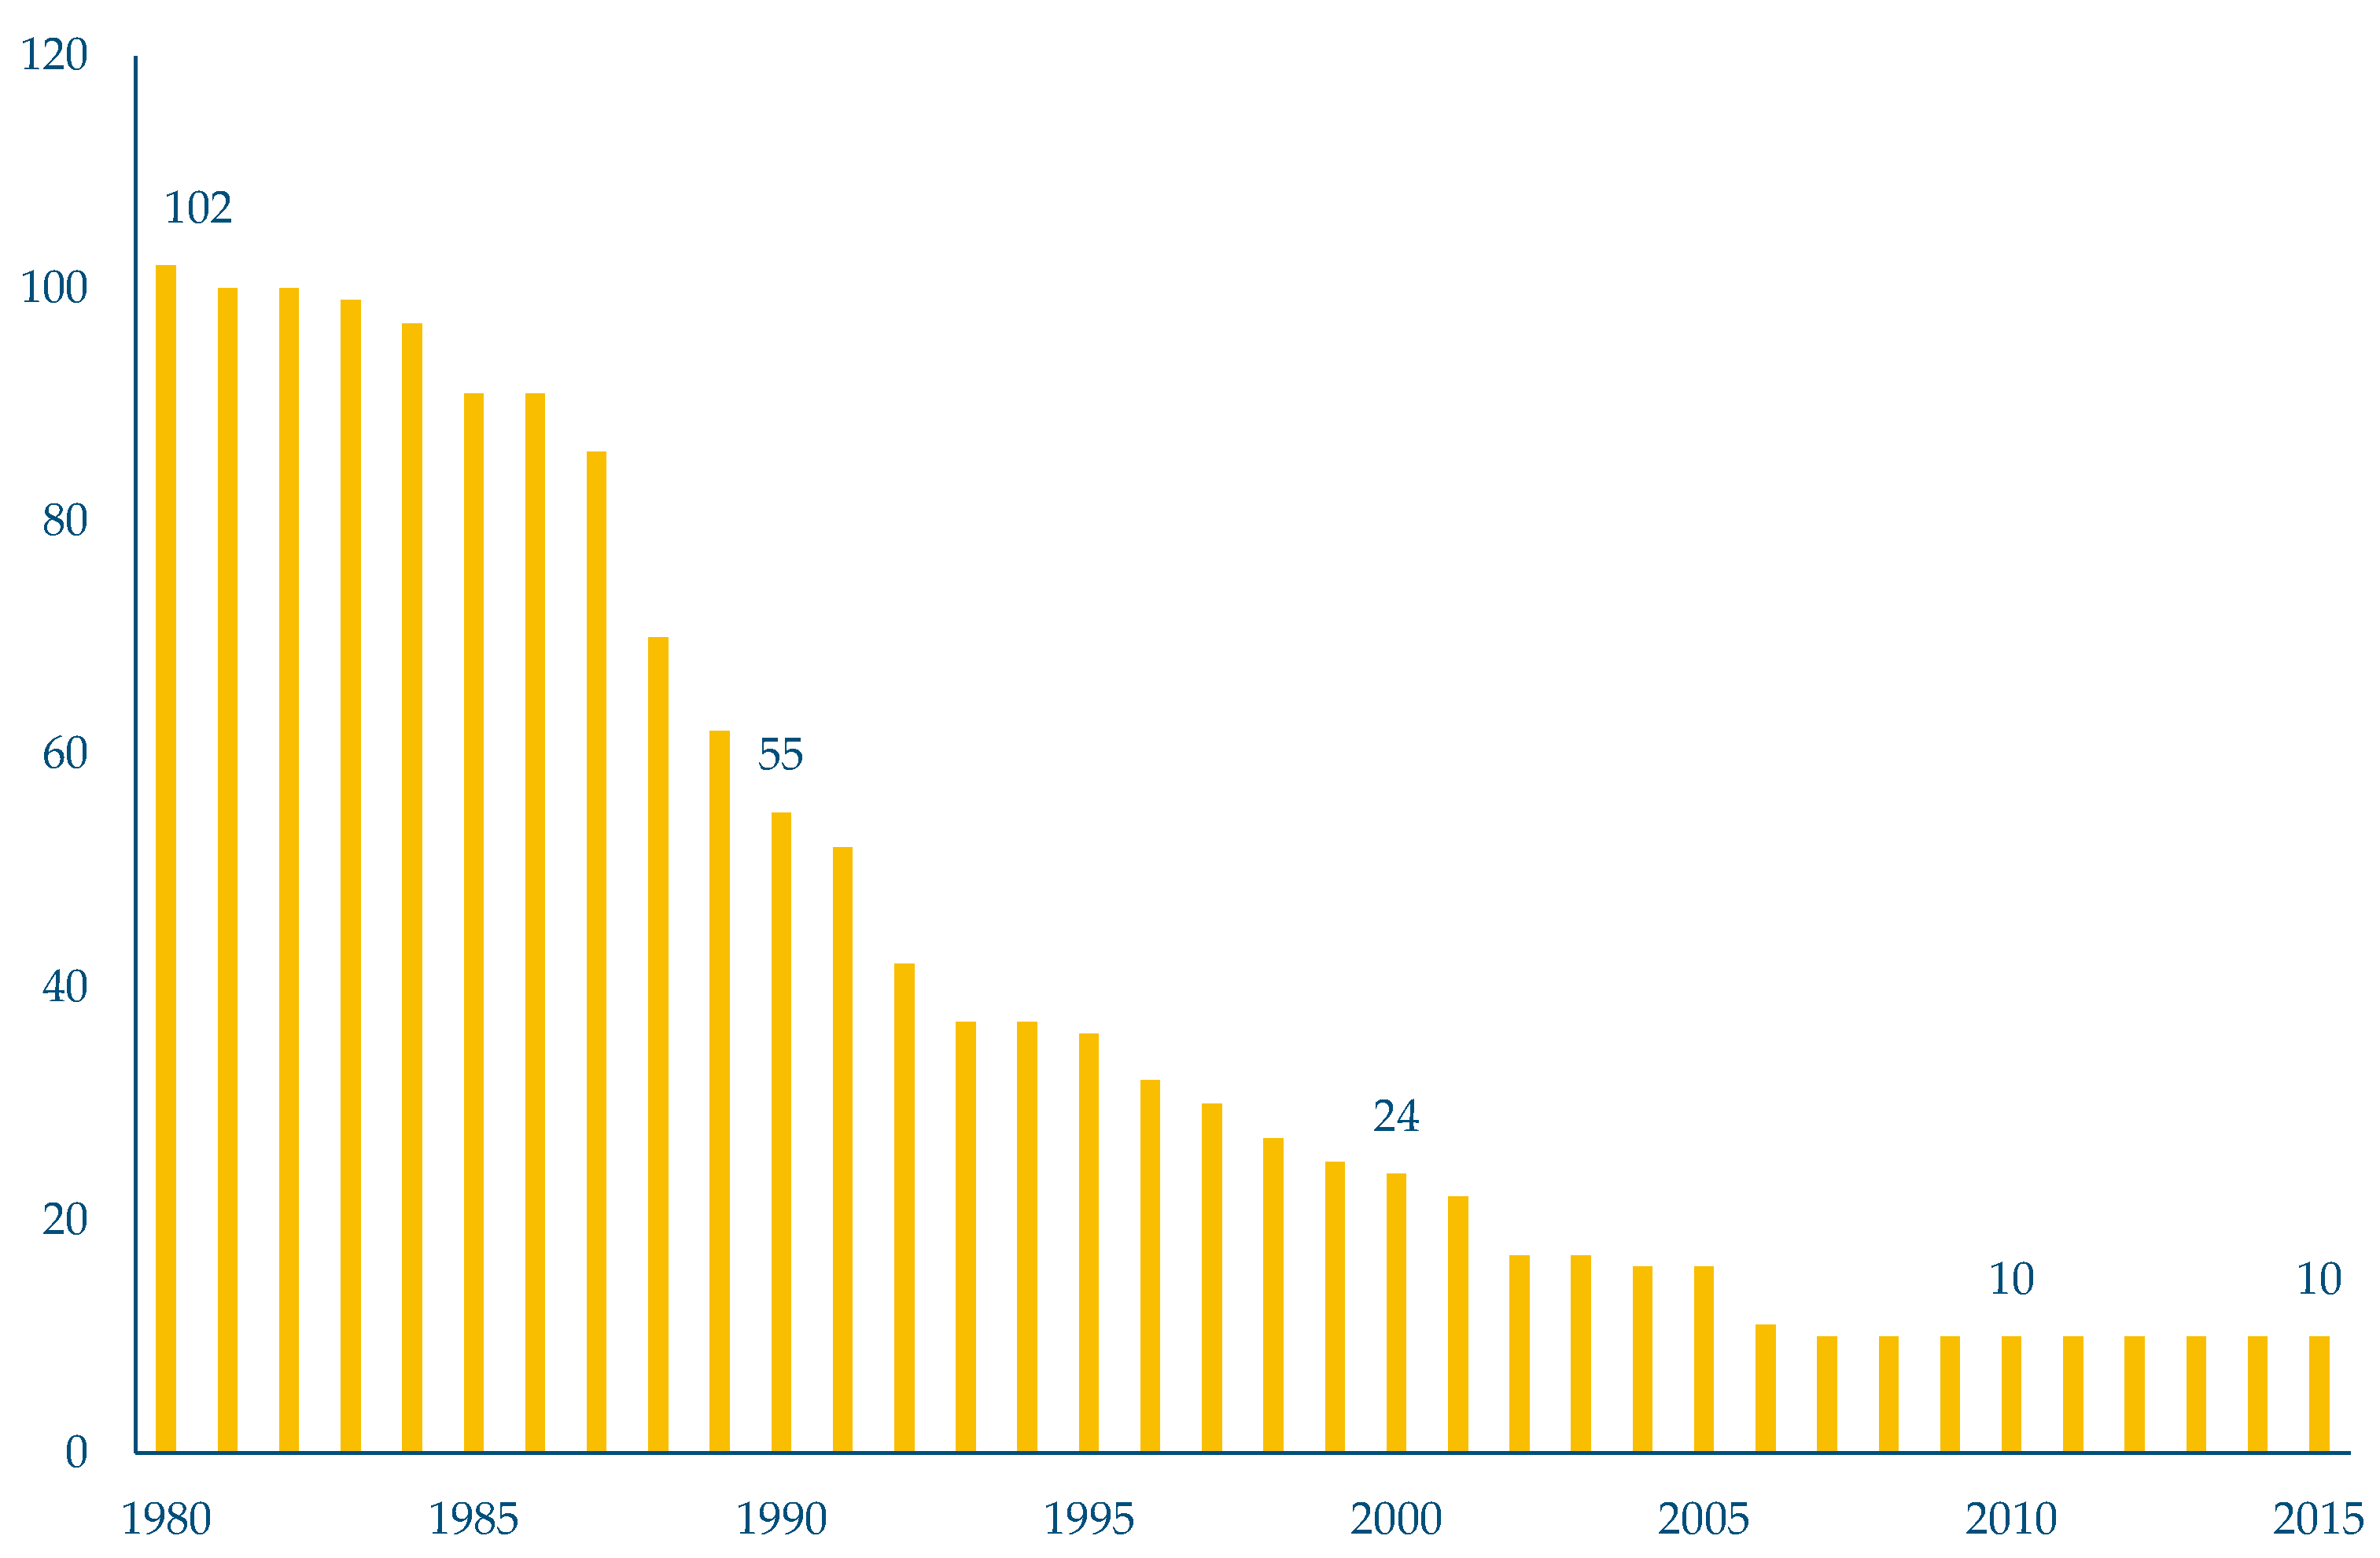
The current number of drinking water companies is only one tenth of the number of companies that were active at the start of the research period. This is the result of the policy that has been pursued in recent decades. As discussed, from 1980 onwards, Dutch policy encouraged mergers in the drinking water sector. This policy had already been implemented in previous decades, but had had insufficient effect, according to the Dutch government. To change that, and be able to meet future supply challenges and to improve drinking water quality and efficiency, in the 1970s adjustments were made to the first Drinking Supply Act (dating from 1957). An important adjustment was the 1971 amendment that restricted operating licenses to drinking water companies with more than 100,000 customer households. A subsequent change was made in 1975 allowing provincial governments to force companies to merge [
30,
31].
This policy started to bear fruit in the 1980s. Whereas in 1980 there were more than 100 drinking water companies, by 1990 that number had almost halved. In the following years, this consolidation process continued, although the pace was slightly slower. While the wave of mergers in the 1980s had been driven by government policy, the mergers in the 1990s were usually supported by the drinking water companies themselves. Efficiency improvement was now at the forefront more than it had been in the preceding period. Significant economies of scale were envisaged, especially through the use of IT, outsourcing and customer management. In addition, it was argued that the companies were too small to react adequately to new technological developments in the provision of drinking water services. Developing new water treatment technologies required considerable investments and the drinking water companies would be too small to cover these costs themselves [
32].
The desire to become bigger therefore continued and the number of drinking water companies decreased further, even after the turn of the century. In 2007, the number of companies fell to ten, which is the current number.
Figure 1 shows the development of the number of drinking water companies since 1980.
During the second wave of mergers, the sector also became the subject of the liberalisation debate that was taking place in many Western countries at the time. The debate was spurred in 1997 when a Ministry of Economic Affairs report concluded that privatisation could reduce water tariffs by 10% [
32,
33]. The drinking water supply sector strongly opposed privatisation, as did the Dutch parliament. A motion to prevent it received broad support in parliament [
31]. For the drinking water companies, however, the debate was an incentive to provide more insight into their functioning. To counter the arguments about efficiency and other alleged benefits of privatisation, in around 1998 the association of Dutch water companies (Vewin) started preparations for the development of a public drinking water benchmark.
Although the benchmark was developed primarily to meet the desire for greater efficiency in the drinking water sector [
34], performance was also compared on other aspects. In addition to financial performance, product quality and customer satisfaction, the environmental performance of the drinking water companies was also compared. This seems an obvious thing to have done, because one of the arguments against privatisation was that less attention would be paid to sustainable management [
31]. In the environmental performance measurement, energy use was a dominant issue. Companies using energy that was generated with renewable sources (e.g., solar energy, geothermal energy, biogas, hydropower, wind and renewable biomass energy) got a good score, an outcome that encouraged many other companies to think about green energy too [
31]. If that is true, it would indicate that the benchmark may have played an important role in making the sector more sustainable. Further, with regard to the use of renewable energy, the sector is indeed performing well: the proportion of sustainably generated energy used by the sector was only 4% in 1997, whereas since 2012 the figure has been 100% [
35].
In addition to sustainability, progress has also been made on other benchmark themes. Blank and Van Heezik [
1] observe that drinking water quality has increased considerably since the introduction of the benchmark. This also applies to customer satisfaction. However, it should be noted that this is not a result of benchmarking alone: laws and other regulations have also made an important contribution to this.
After the first benchmark (reference year 1997), a new one was performed every three years. Detailed protocols have been developed and refined over the years for each of the four themes. Although the benchmark is voluntary, the vast majority of companies participate in the scheme [
36]. All companies participated in the 2006 benchmark, with the exception of one very small drinking water company. Nevertheless, the new Drinking Water Act, which came into force in 2011, requires a mandatory benchmark [
36] that is carried out by the Ministry of Infrastructure and Water Management (the Human Environment and Transport Inspectorate) rather than by the sector itself. One of the reasons for introducing a mandatory system was to improve the accuracy and reliability of the data and the quality of the comparison [
32]. Another reason was that the introduction of mandatory improvement plans has given the government an instrument to promote performance improvement. Blokland and Schwartz [
32] note that the mandatory benchmark is also the main barrier to the further upscaling of the Dutch water services sector, as benchmarking requires a minimum number of companies in order to allow useful performance comparison. The current number of 10 drinking water companies seems to be close to the required minimum.
4. Data
4.1. Data Description
The empirical analyses performed for this study are based on a set of time series variables of the Dutch drinking water sector. The data are derived from a unique, interactive and user-friendly publicly accessible database on public sector trends from 1980 to the present, which also includes figures on productivity change. This database—Trends in the Public Sector (TiPS)—is developed by IPSE Studies and contains information on various public sector services in the Netherlands, including safety and justice, education, healthcare and infrastructure. Here, variables on production, costs and the use of resources for the Dutch drinking water sector are used.
The variables describe the Dutch drinking water sector as a whole, meaning that differences in efficiency between the individual drinking water companies are not taken into account. The data cover the period 1979–2015. Thus, there are 37 observations. Note that we “lose” one observation in the analysis due to the use of a production growth variable (a lagged variable).
Table 1 presents the data used in the analyses.
Three resources are distinguished: personnel, material supplies and capital inputs. The price of personnel is computed as the personnel costs per working hour. The price of material supplies is set at the consumer price index published by Statistics Netherlands. Finally, the price of capital inputs is computed by dividing the capital costs by the volume of capital inputs. The volume of capital inputs is derived from data on depreciation and investments in the drinking water industry, using the perpetual inventory method [
37]. According to this method, the actual input of capital is equal to an aggregate of the historical flow of investments, taking into account the depreciation of capital and the price of investment goods.
Production is measured by the amount of drinking water delivered and the number of connections. Drinking water quality in the Netherlands has been high over time. Nevertheless, some measures have been taken to improve the quality of drinking water and of the production process and the sustainability thereof (see the discussion in
Section 3). Since we do not have enough clear data on these quality aspects, we are obliged to ignore these aspects in the analysis. Since we know from various statistics and inspection reports that there has been a significant increase in quality in the last two decades, we must assume that production is being undervalued and productivity is therefore underestimated.
4.2. Historical Trends
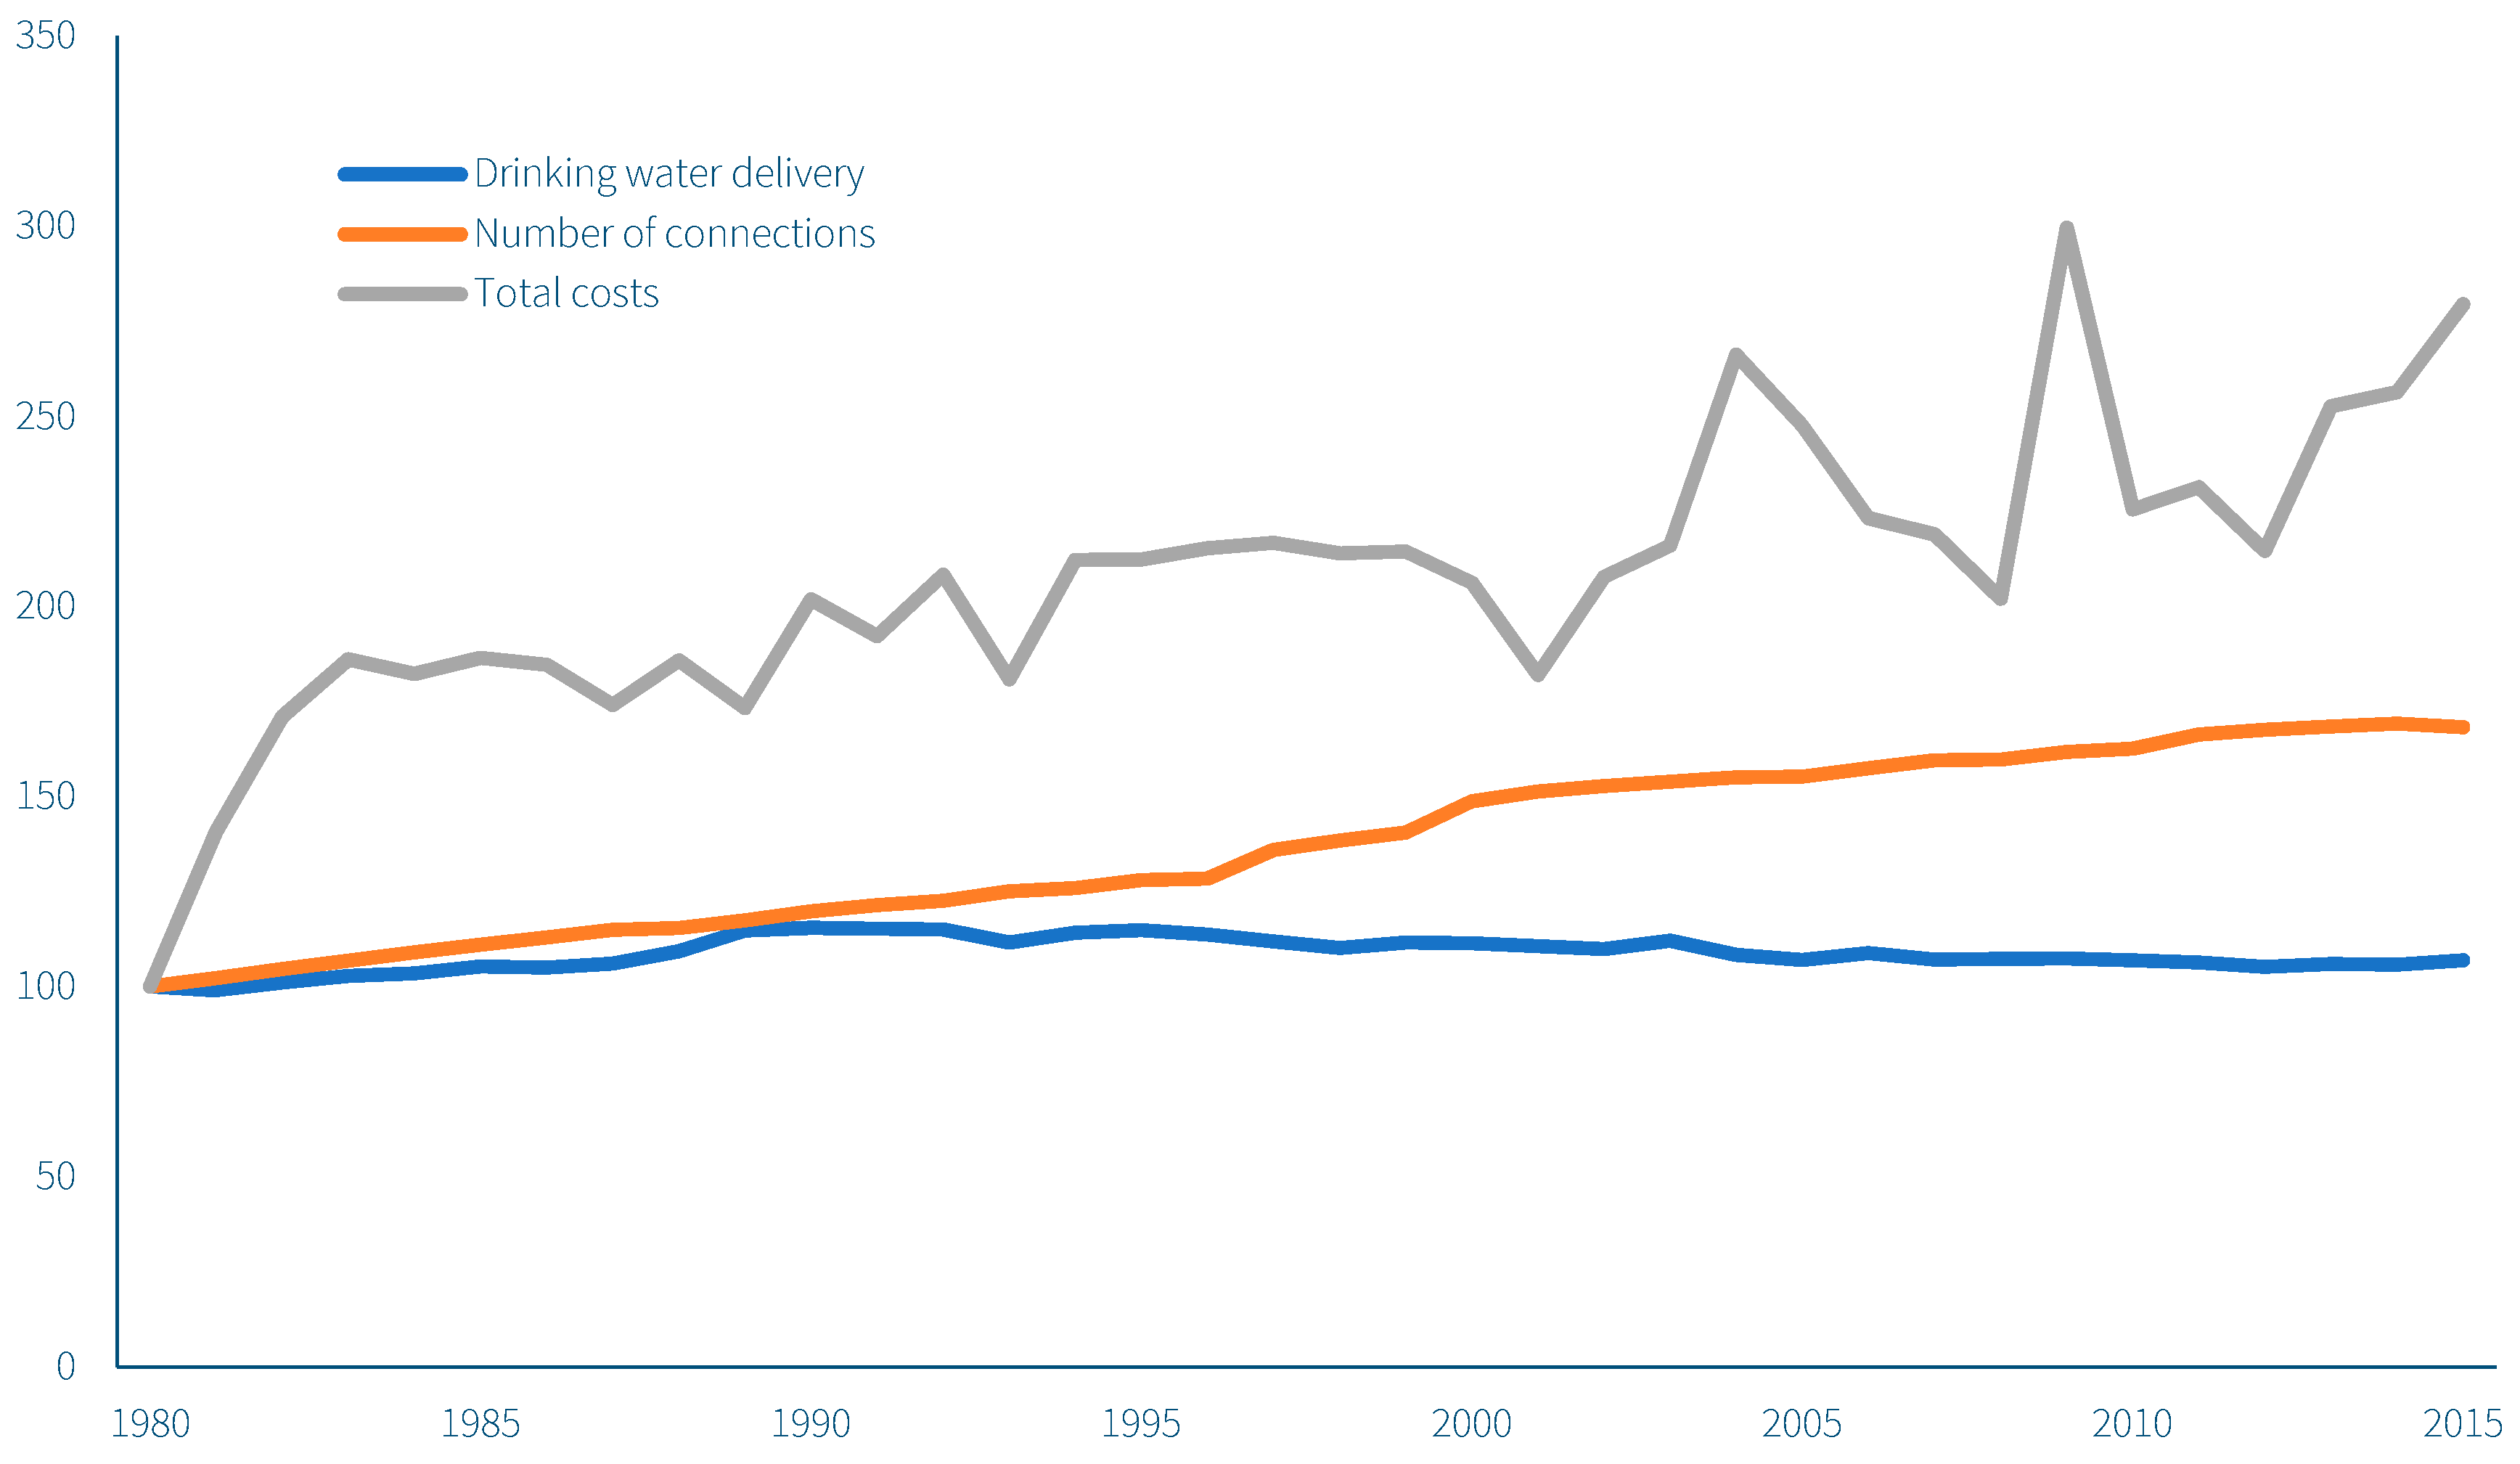
Figure 2 shows the production of drinking water in the period 1980–2015, expressed in terms of water delivery and the number of connections.
Figure 2 shows that the production of drinking water has undergone a modest development. The volume of drinking water has risen by 7% in 35 years. The growth took place almost entirely in the 1980s. Since 1992, there has been an almost constant decline. This means that less water is used per capita in the Netherlands. The number of connections, on the other hand, has grown considerably (i.e., by around +70%). The total costs increased by a factor of 2.8 between 1980 and 2015. Most of the increase is attributable to material costs (growth factor of 3.8). The volatile course of the total costs is mainly due to the capital costs, which fluctuate considerably over time.
5. Model Specification and Estimation
5.1. The Cost Function Model
Productivity changes are derived from an estimated cost function. The productivity changes are measured at the national level, taking the drinking water system as the unit of observation. The cost function assumes a relationship between resources and services delivered. A cost function model allows for a multiple-resources multiple-services analysis that is suitable for studying complex sectors such as the drinking water industry. From the cost function, cost share equations can be derived that describe the demand for resources [
38].
A translog cost function [
39] is used here, but in a hybrid form since most of the second-order terms are excluded. The translog function is a rather flexible form that allows for varying economies of scale, varying resource substitution and varying technical change that comes from varying production levels, varying resource prices and from different points in time. However, since the number of parameters would be too large for our dataset, which consists of 37 observations (note: there is one lagged variable), we have to restrict the flexibility to some extent by using a hybrid form. Due to a lack of variation in the output variables, second-order terms including output variables are excluded.
The cost equation also includes a first-order lag operator representing the dynamics of the system. A production change usually does not immediately lead to an equivalent change in cost, as the existing capacity will initially allow for an extension of production. Hiring staff and (especially) increasing capital inputs will lag behind. In this case, the estimated effects will therefore describe short-term reactions rather than long-term relationships. However, the production change may also cause a more sustainable change due to innovative behaviour. This is known as Verdoorn’s law [
40,
41]. In order to capture this effect, an additional term is added to the model to reflect production growth. In the case of the drinking water industry, a sudden increase in production may be interpreted as an increase in the occupancy rate of the drinking water industry capacity. The expected sign of this variable is negative.
The model also includes a measure for average scale, namely total production divided by the number of institutions. Since scale effects can be negative, absent or positive, no clear hypothesis can be formulated beforehand. Because policy is aimed at increasing productivity through consolidation, it is interesting to test the hypothesis that the corresponding estimate is negative (i.e., increasing scale leads to lower costs).
The time trend is derived from two splines. We have divided the time span into two sub-periods allowing for different time trends in the sub-periods. This enables us to test whether annual productivity growth differs between the periods before and after the introduction of the benchmark in 1997.
In general, econometric frameworks also include an error term reflecting specification errors and measurement errors. The possible specification errors also include some incidental changes in productivity (e.g., due to a change in legislation). Whereas in regular multivariate regression analysis, residuals are interpreted just as a stochastic component depending on measurement errors and misspecifications of the model, in this case they may reveal slightly more than a stochastic outcome. In particular, due to applying the autocorrelated regression method, the corrected residuals show a non-normal pattern and reveal incidental shocks that may be interpreted as an incidental change in productivity. We therefore also present these uncorrected residuals. This leads to the following cost function model:
where:
= production service m (m = 1, …, M);
Δln() = relative change in production service m (m = 1, …, M);
= resource price n (n = 1, …, N);
t = time;
Tp = last year of period p;
T0 = first year of analysis;
u = error term.
bm, cn, , jn, a1, aap and parameters to be estimated.
The term divides the period of analysis into different time periods, in which different speeds of technical change may occur. They can be regarded as a set of splines, which allows for more erratic patterns than in the case of specifications with linear, square or cubic terms. We have chosen to fix the cut-off points at 1997.
The corresponding cost share equations can be derived by using Shephard’s lemma and are given by:
where:
Sn = cost share of resource n
For the parameters of resource prices there is a homogeneity restriction (of degree 1). This means that a generic price increase leads to a proportional cost increase. In terms of parameter restrictions, this yields:
The cost function must be non-decreasing in resource prices (a price increase cannot lead to a cost decrease). The cost function is non-decreasing if all predicted cost shares based on the estimated parameters are positive. The cost function also must be concave in resource prices (a 1% increase of an input price does not increase cost by more than 1% times the cost share of that resource). As usual, these requirements are examined after the estimation. The concavity is checked by testing whether the price elasticities of demand are negative (a price increase leads to a decrease in the quantity demanded). The specific price elasticities of demand for resource
n are given by:
where:
ηn = elasticity of demand for input n.
Further, we impose constant returns to scale. This seems to be a reasonable assumption when working at a national level. Note that this is not a contradiction with the possibility of the existence of possible scale effects at the institution level, which will be reflected in the scale variable. Here, it means that an increase in production leads to a proportional increase in costs:
As mentioned, productivity can be derived from the cost function. We define productivity as the ratio between an aggregated output indicator and an aggregated input indicator:
For we take the geometric mean of the distinct outputs, whereas the weights depend on the shares of output values in a certain base year. Since output prices are lacking here, the output values are based on the costs that are involved in producing this output. Because of the functional form of the cost function, these output value shares coincide with the bm parameters.
For the aggregated output indicator we take actual costs deflated for price increases. The applied deflator here is also a geometric mean of input prices, where weights are based on cost shares in a certain base year. In this case the cost shares coincide with the cn parameters.
Equation (3) can therefore be written as:
With Equation (4) we have a one-to-one correspondence between the productivity measure and the cost function. By estimating the parameters of the cost function, we can also calculate the productivity measure.
5.2. Estimation Method
The cost function model includes a large number of parameters, especially if all the various resources and services are included. In particular, in a time series (as is the case here), estimating a large number of parameters leads to econometric problems. This is because, firstly, time series usually have relatively few observations, leading to a limited number of degrees of freedom. Secondly, most time series are non-stationary, implying that the use of ordinary least squares would lead to spurious correlation. The strong correlation between observations would also lead to multicollinearity, yielding non-efficient estimators. The strong coherence between explanatory variables makes it impossible to attribute the variation in the endogenous variable to individual explanatory variables.
Econometrics offers several solutions to this problem. The simplest and most widely used one is to allow for autocorrelation by applying an autoregressive transformation to all the variables in the model. This means that the estimation deals with changes in variables rather than the levels themselves. Thus each variable f in the model is transformed as follows: f-ρf(−1). The parameter ρ is also estimated. The trend and the corresponding correlation are then eliminated from the model. Multicollinearity can only be avoided by including additional information, such as fixing certain parameters beforehand, based on values found in earlier research, or by imposing theoretical restrictions.
Since the cost function model consists of a system of equations with parameter restrictions between equations, the method of nonlinear least squares is adopted, based on the Davidon–Fletcher–Powell algorithm.
6. Estimation Results
Table 2 shows the estimates, standard errors and
t-values of the parameters (for each of the equations).
In
Table 2 the results of the model neatly represent the costs of the drinking water industry, given that a large majority of parameters are statistically significant at the 5% level. Additional statistical tests indicate that the hypothesis that the model does not satisfy the concavity requirement is rejected. All elasticity parameters are not significantly different from zero, even at the 10% level. Monotonicity of input prices is also met: all input price parameters are positive. The explained variances of costs and cost shares are very high (due to the autocorrelation parameter).
One very interesting estimated effect concerns the production change variable (b0 = −0.446), which indicates that production change itself leads to reduced costs (and thus increased productivity) due to the lagged responses of drinking water firms to the permanently growing services. Since drinking water production, and in particular the number of connections, has been growing consistently over the years, this variable explains the general increase in overall productivity. This is the so-called Verdoorn effect.
Price changes have not led to substitution between the inputs as reflected by the elasticities of substitution. The estimates of the price coefficients indicate that the inputs are not substitutes: all elasticities of substitution are not significantly different from zero (even at the 10% level).
Nevertheless, we observe some substitution in time. The estimates of the technological change parameters (j11 < 0, j12 = 0, j13 > 0) indicate that through time personnel have been replaced by capital inputs. Thus, technical change has been input biased rather than Hicksian neutral. On average, the share of capital inputs increased by 0.2% point annually at the expense of the share of personnel.
The estimates of technical change differ substantially between the first time period (year ≤ 1997) and the second time period (year > 1997). The difference between the corresponding parameters equals 1.3% (0.7% and −0.6%) and is statistically significant (
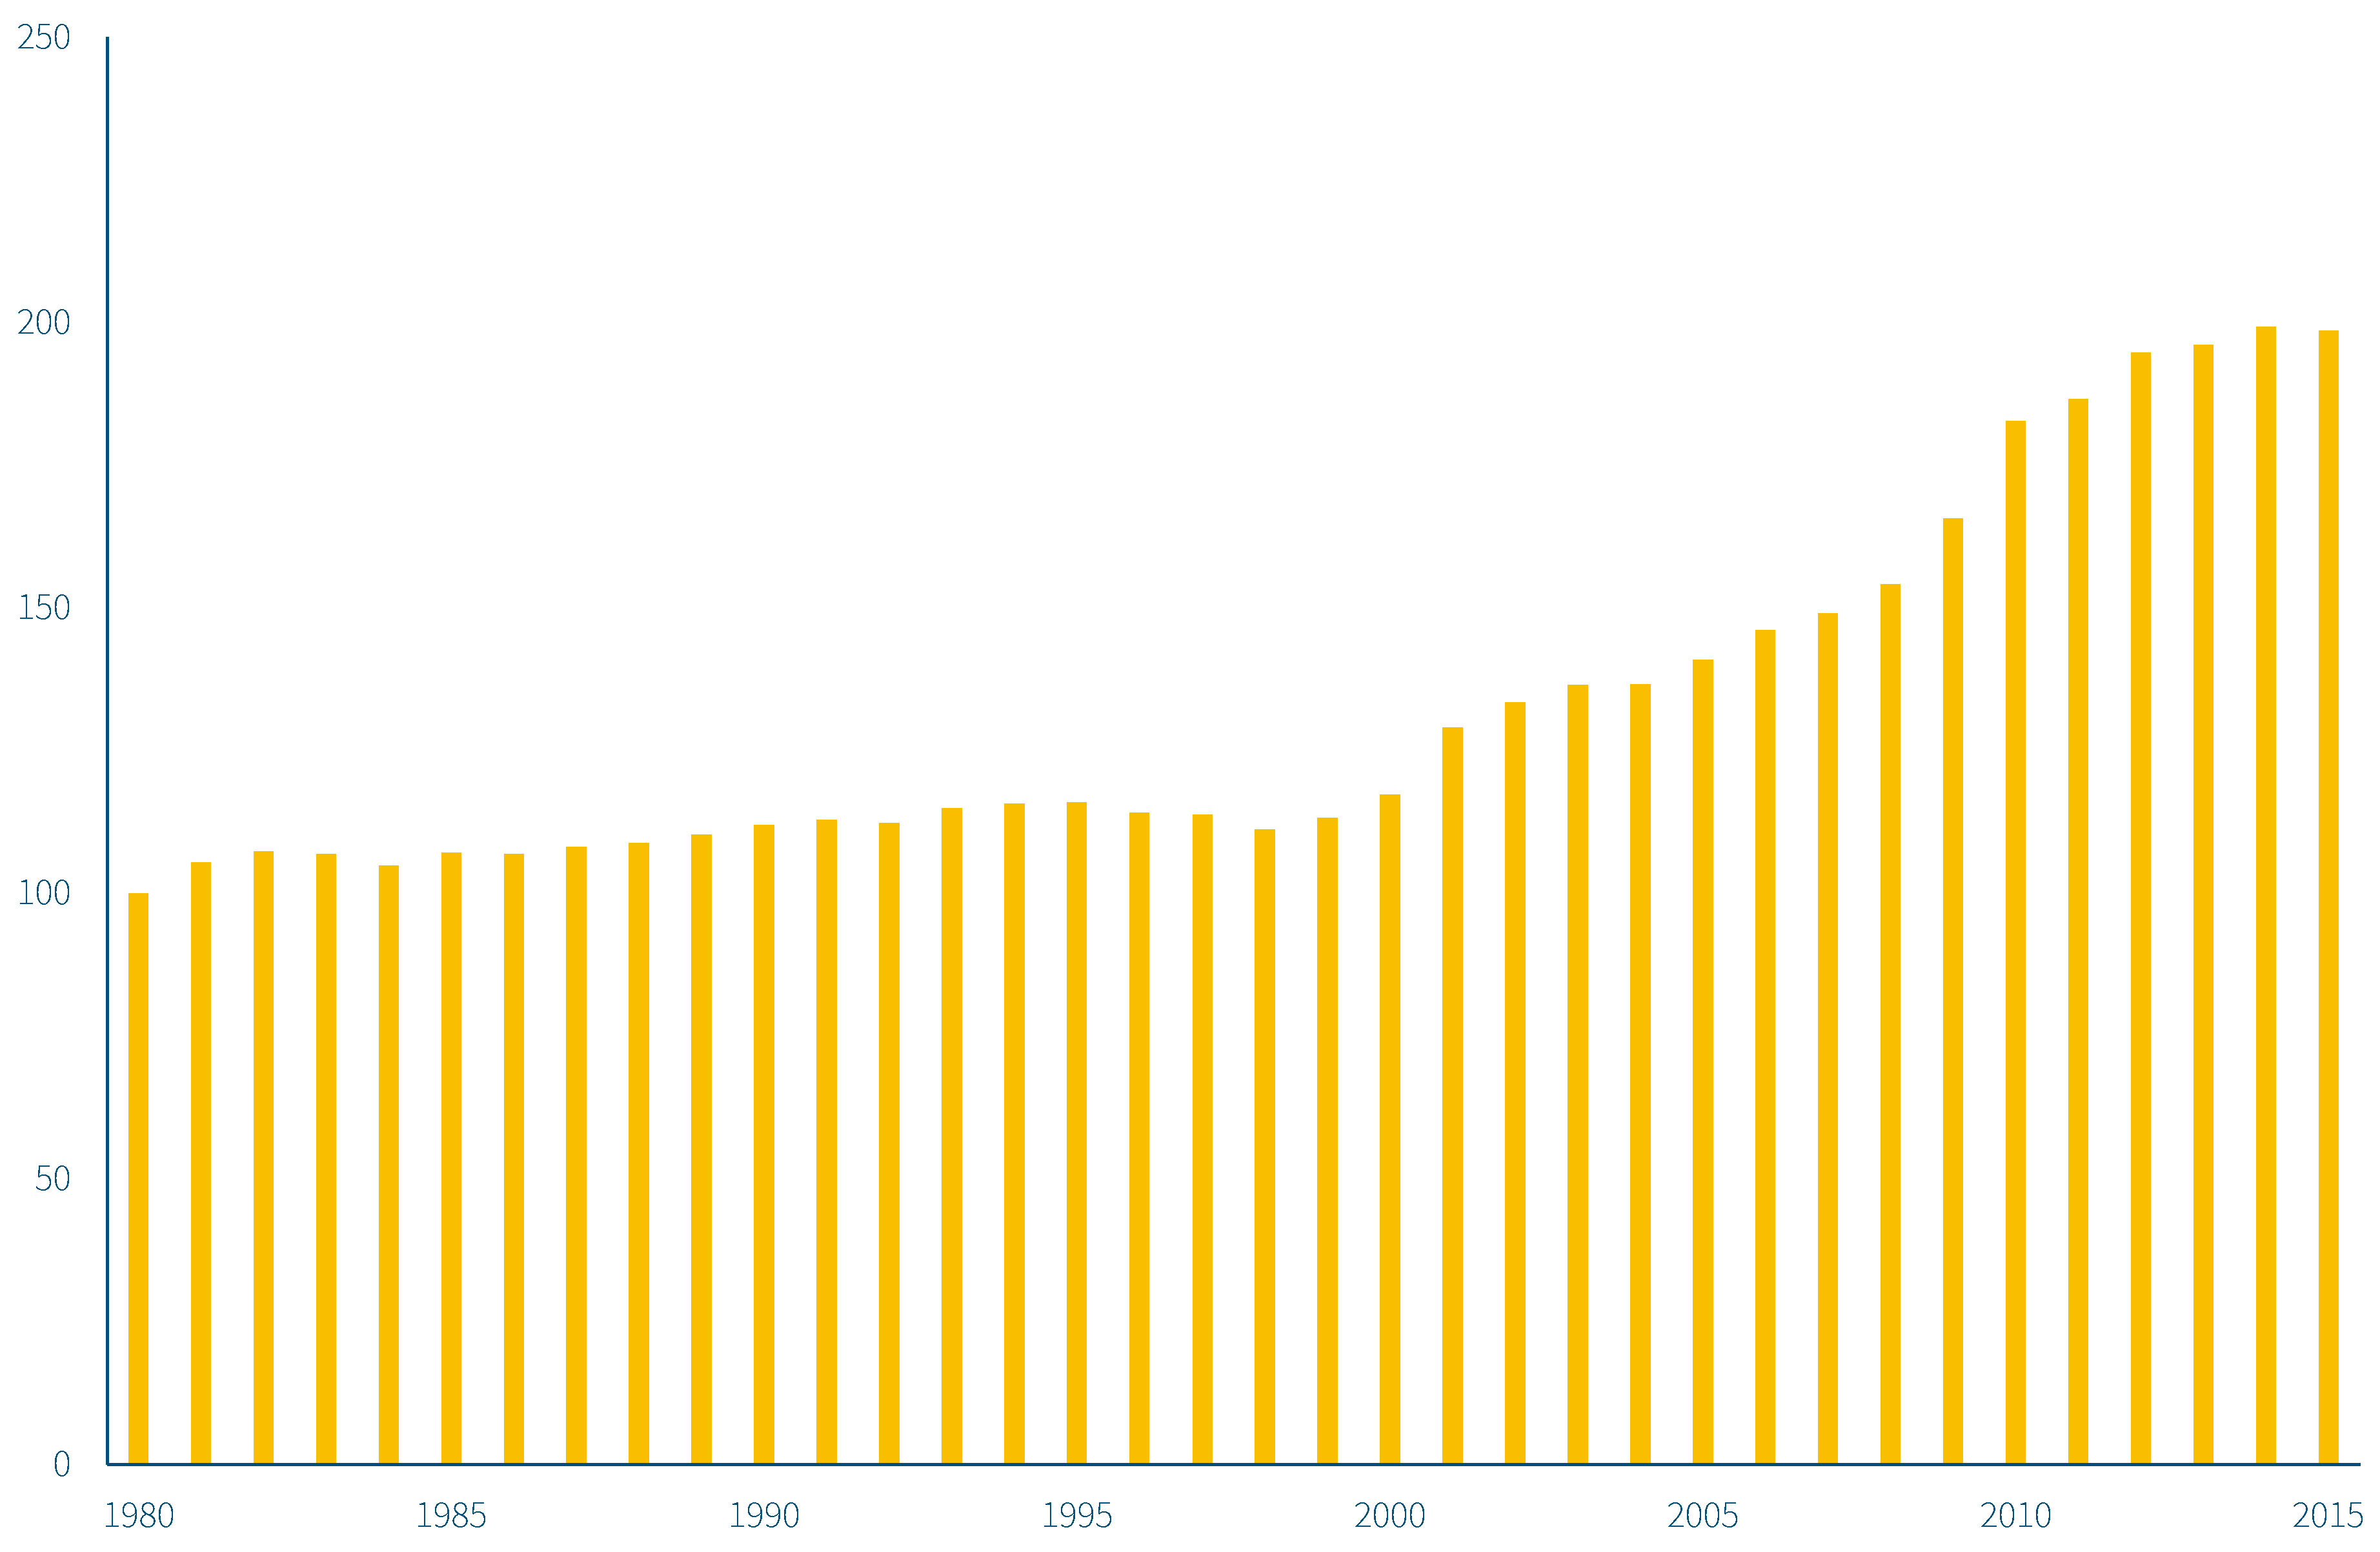
t-value = 3.262). This outcome indicates that since the introduction of the benchmark in 1997, annual productivity growth has increased by 1.3% on average. To illustrate this outcome,
Figure 3 presents the total factor productivity.
According to
Figure 3, productivity is more or less stable in the pre-benchmark period. The year 1998 obviously is a turning point. From then on, productivity growths substantially. The figure also indicates that we might be witnessing another turning point in the most recent years. Since 2013, productivity growth has stagnated. Unfortunately, this period is too short to conclude that the benchmarking has become ineffective. However, other studies do indicate a reduced benchmark effect in the Dutch drinking water sector in recent years [
36].
The scale parameter (BEOS) is very small and not significantly different from zero, implying that the hypothesis that economies of scale do not prevail, could not be rejected (at either the 5% or the 10% level). This does not imply that economies of scale do not exist in this industry. At a micro level, there is much more variation between drinking water companies, and economies/diseconomies of scale could be identified for small or large firms. At a macro level, we are not able to establish economies of scale due to a lack of variation in the scale variable (aggregation bias).
7. Concluding Remarks
Since 1980, the Dutch drinking water industry has undergone two major policy reforms: consolidation of the industry by stimulating mergers and the introduction of yardstick competition by applying benchmarks. Both measures were part of large-scale policy reforms in the network industries aimed at improving their performance.
This paper addresses the question whether these two instruments have improved productivity. Two research questions are raised:
What is the productivity change in the Dutch drinking water sector in the past four decades?
Has productivity change been influenced by government policy, in particular by industry consolidation and yardstick competition?
Industry consolidation has taken place over a long period of time. The number of drinking water firms declined from 102 in 1980 to 10 in 2007 (and has remained stable since then). Yardstick competition was introduced in 1997 on a voluntary basis. Since 2011, the benchmark has been mandatory due to legislation (the new Drinking Water Act). The effects of both measures are empirically tested in this paper.
Productivity changes are derived from an estimated cost function. The productivity changes are measured at the national level, taking the drinking water industry as the unit of observation. Estimation is conducted on the basis of time series data in the period 1980–2015.
The estimation shows that total factor productivity was rather stable in the period 1980–1997. Since 1998, annual productivity growth has been substantial (about 0.6% on average). There was an obvious break point in 1998, providing clear evidence that the introduction of the benchmark instrument has positively affected productivity change. Moreover, there are various indications that benchmarking has also contributed to improving quality and sustainability. However, there are also indications that the effect has been diminishing in the most recent years. The length of this period is too short to provide clear evidence for the assertion that the benchmark instrument has lost its effect but it does suggest that a threshold value is being reached and further productivity gains can only be made through high investments and innovation. Further research and more recent data added to the time series might shed light on the question if indeed a threshold has been reached; to stimulate innovation new deviant indicators might be needed.
We could not find any empirical evidence for the hypothesis that consolidation of the industry has improved productivity. From literature we know that economies of scale prevail for small firms, but their weight in the total drinking water supply at a national level is so modest that no effect could be established.
While no evidence has been found for a positive impact of consolidation on productivity, there are indications of the opposite effect of the ever-increasing mergers. The literature indicates that for an effective benchmarking, a minimum number of organizations is required. A sharp decrease in the number of participating organizations will considerably reduce the productivity incentives of the instrument. Moreover, it is a well-known fact that the scale of organizations can become so large that scale disadvantages arise, with negative productivity effects as a result. It looks very likely that both situations apply to the current Dutch drinking water companies.
Although small drinking water companies in other countries may still be able to become more productive through scaling up, developments in the Dutch drinking water sector demonstrate that consolidation is limited by boundaries.


