Evaluation of Watershed Scale Aquatic Ecosystem Health by SWAT Modeling and Random Forest Technique


Abstract
1. Introduction
2. Materials and Methods
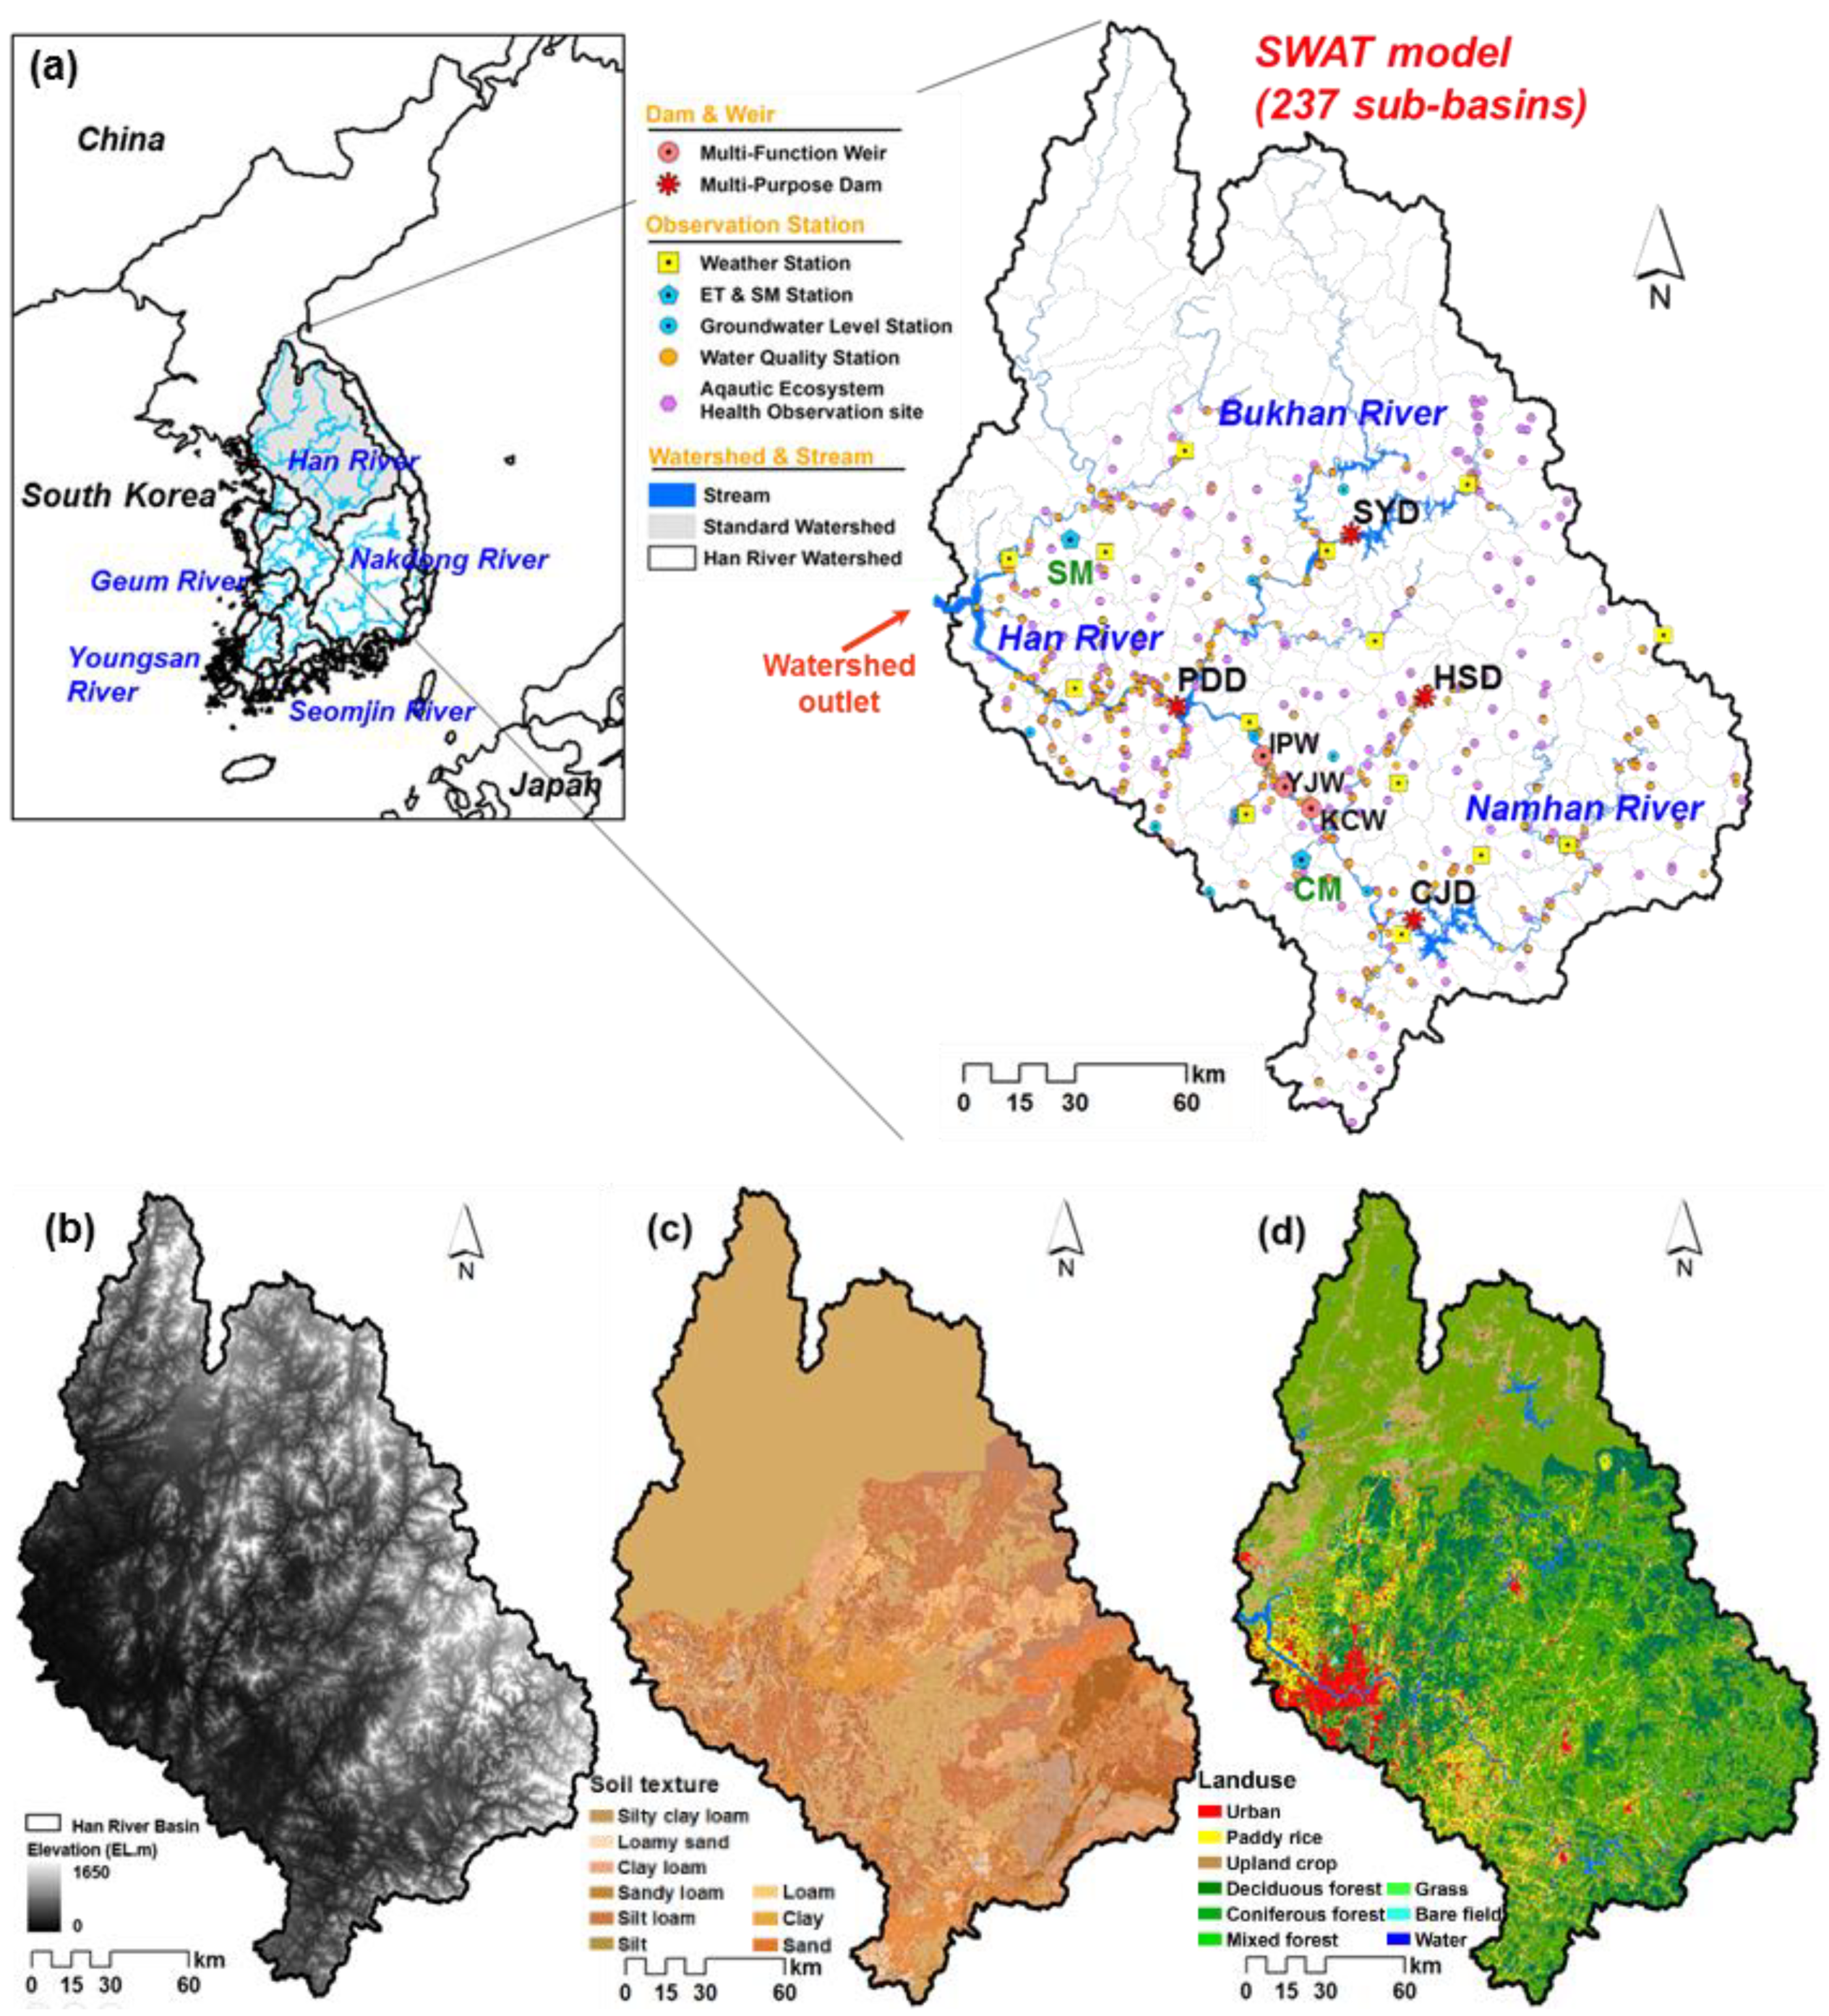
2.1. Description of the Study Area
2.2. Aquatic Ecosystem Health Index
2.3. SWAT Model
2.4. Random Forest Algorithm
3. Results and Discussion
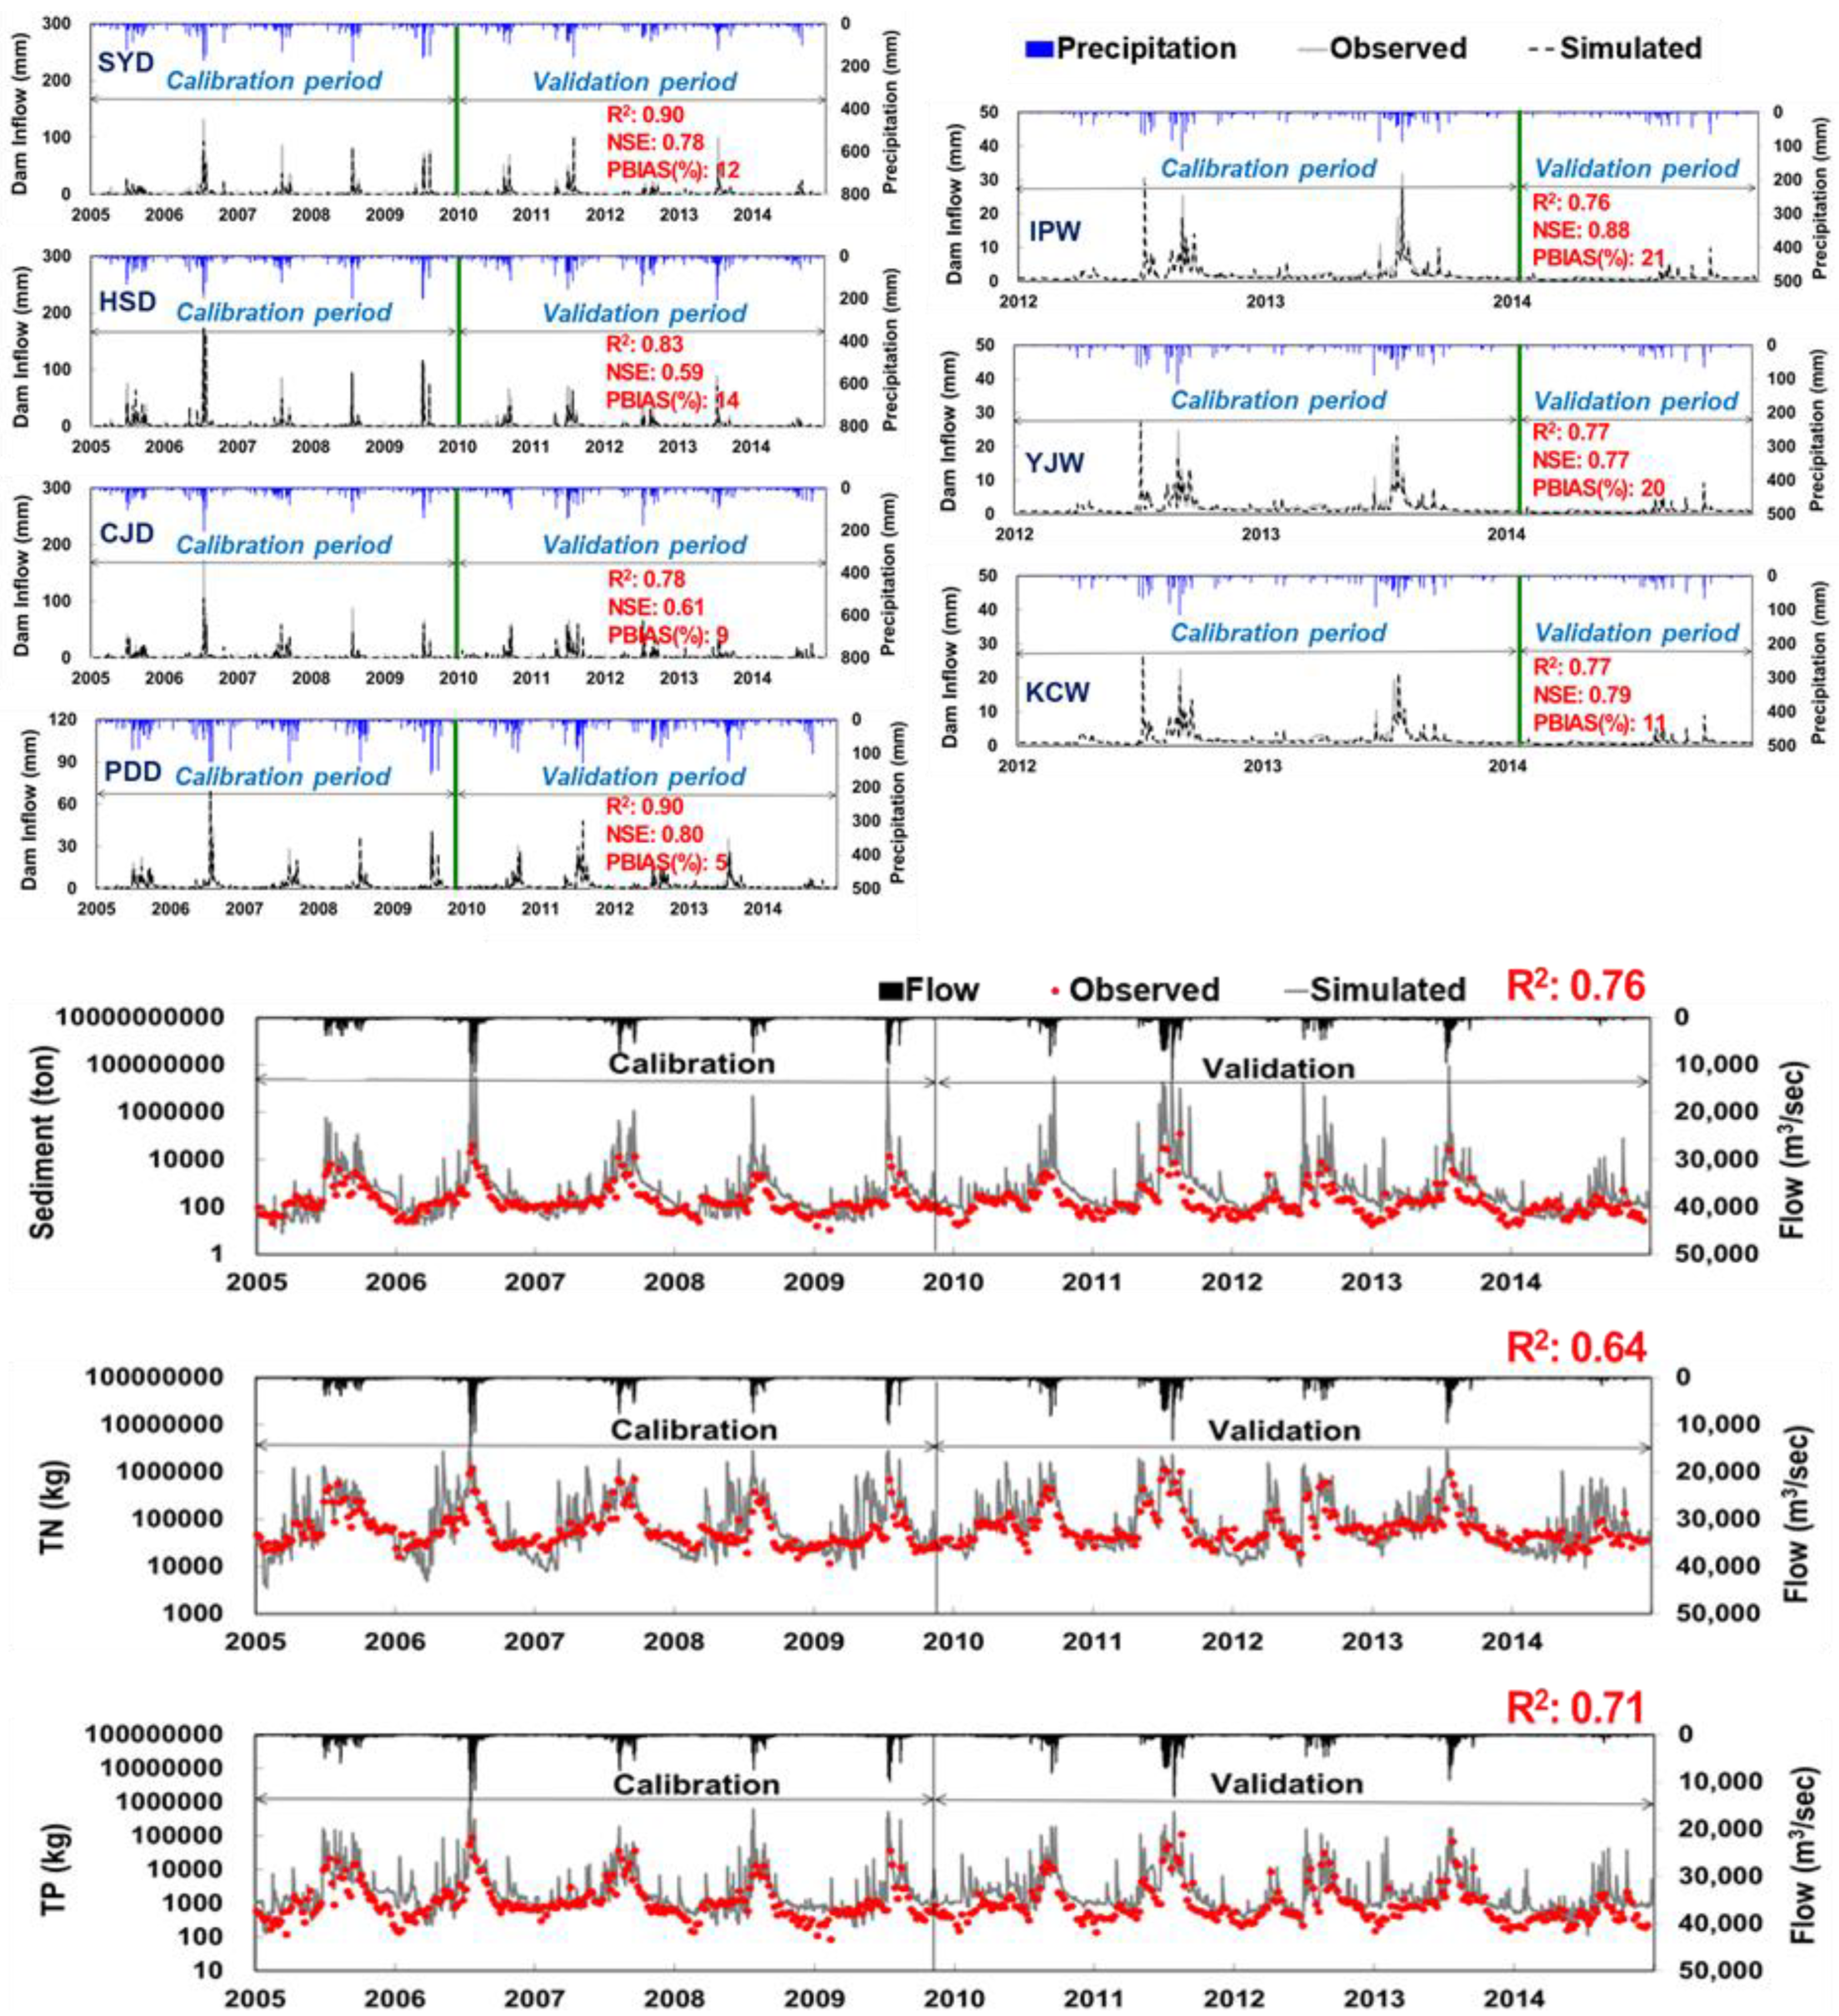
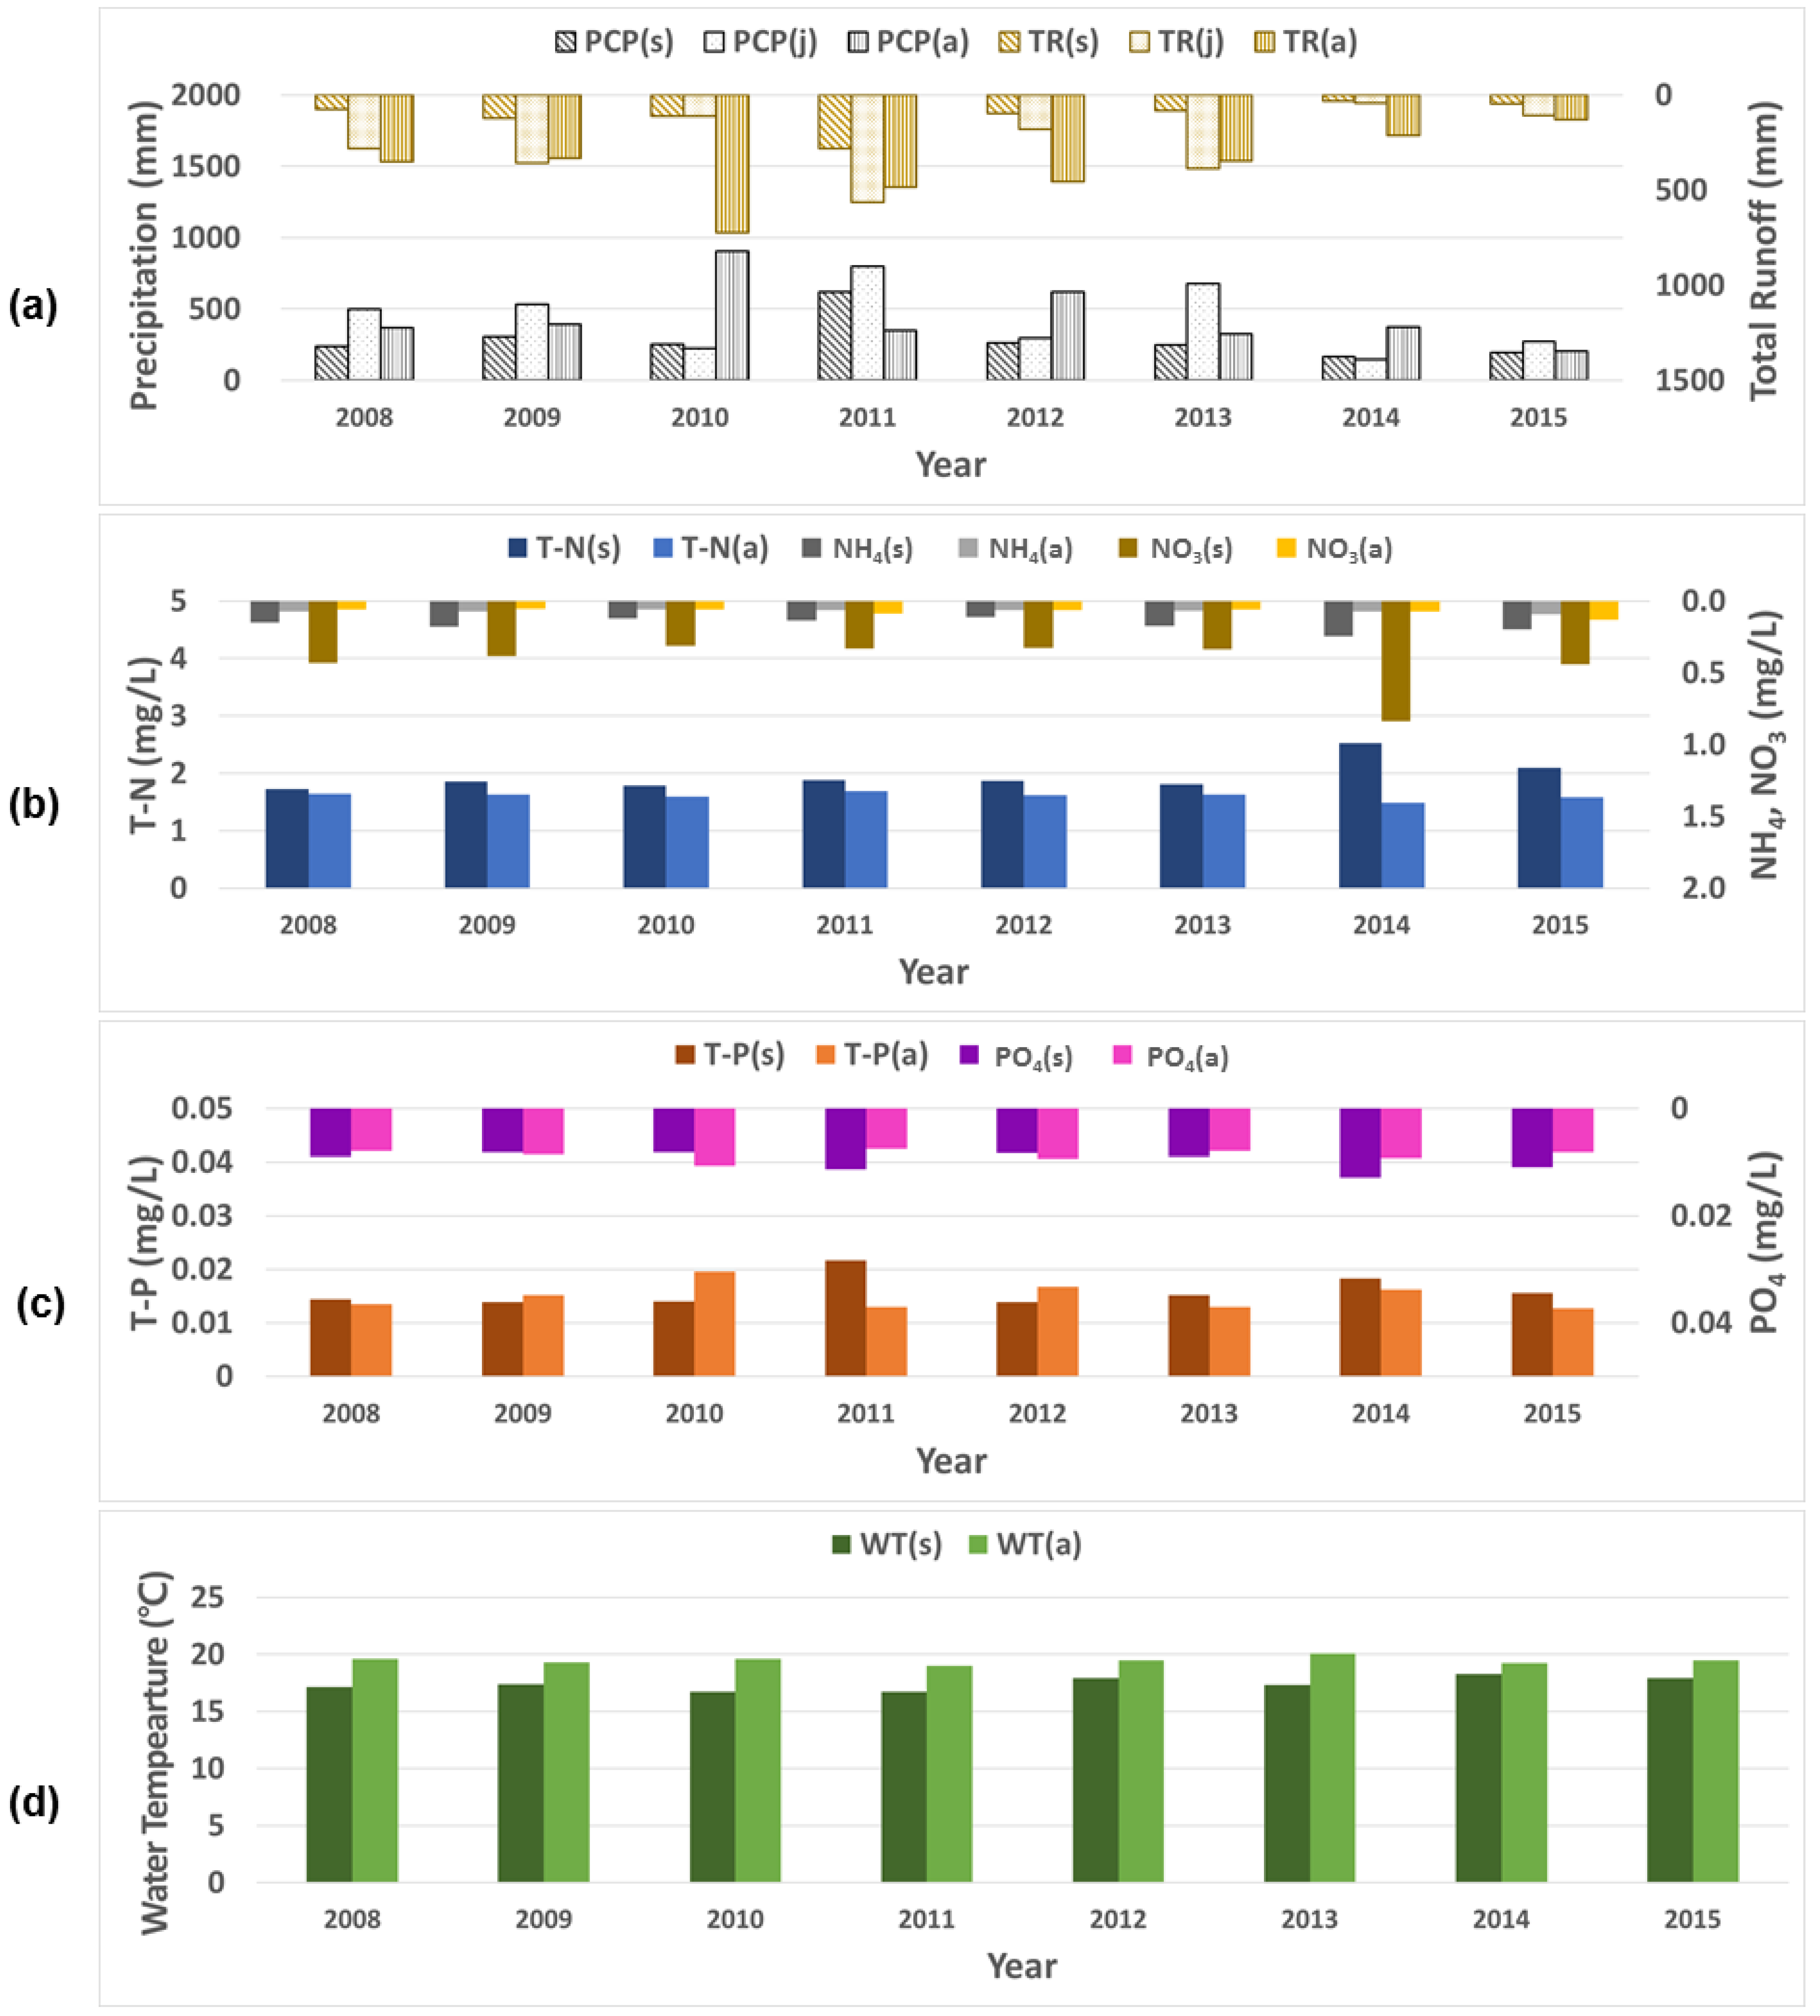
3.1. The Stream Water Quality and Temperature Simulated by SWAT
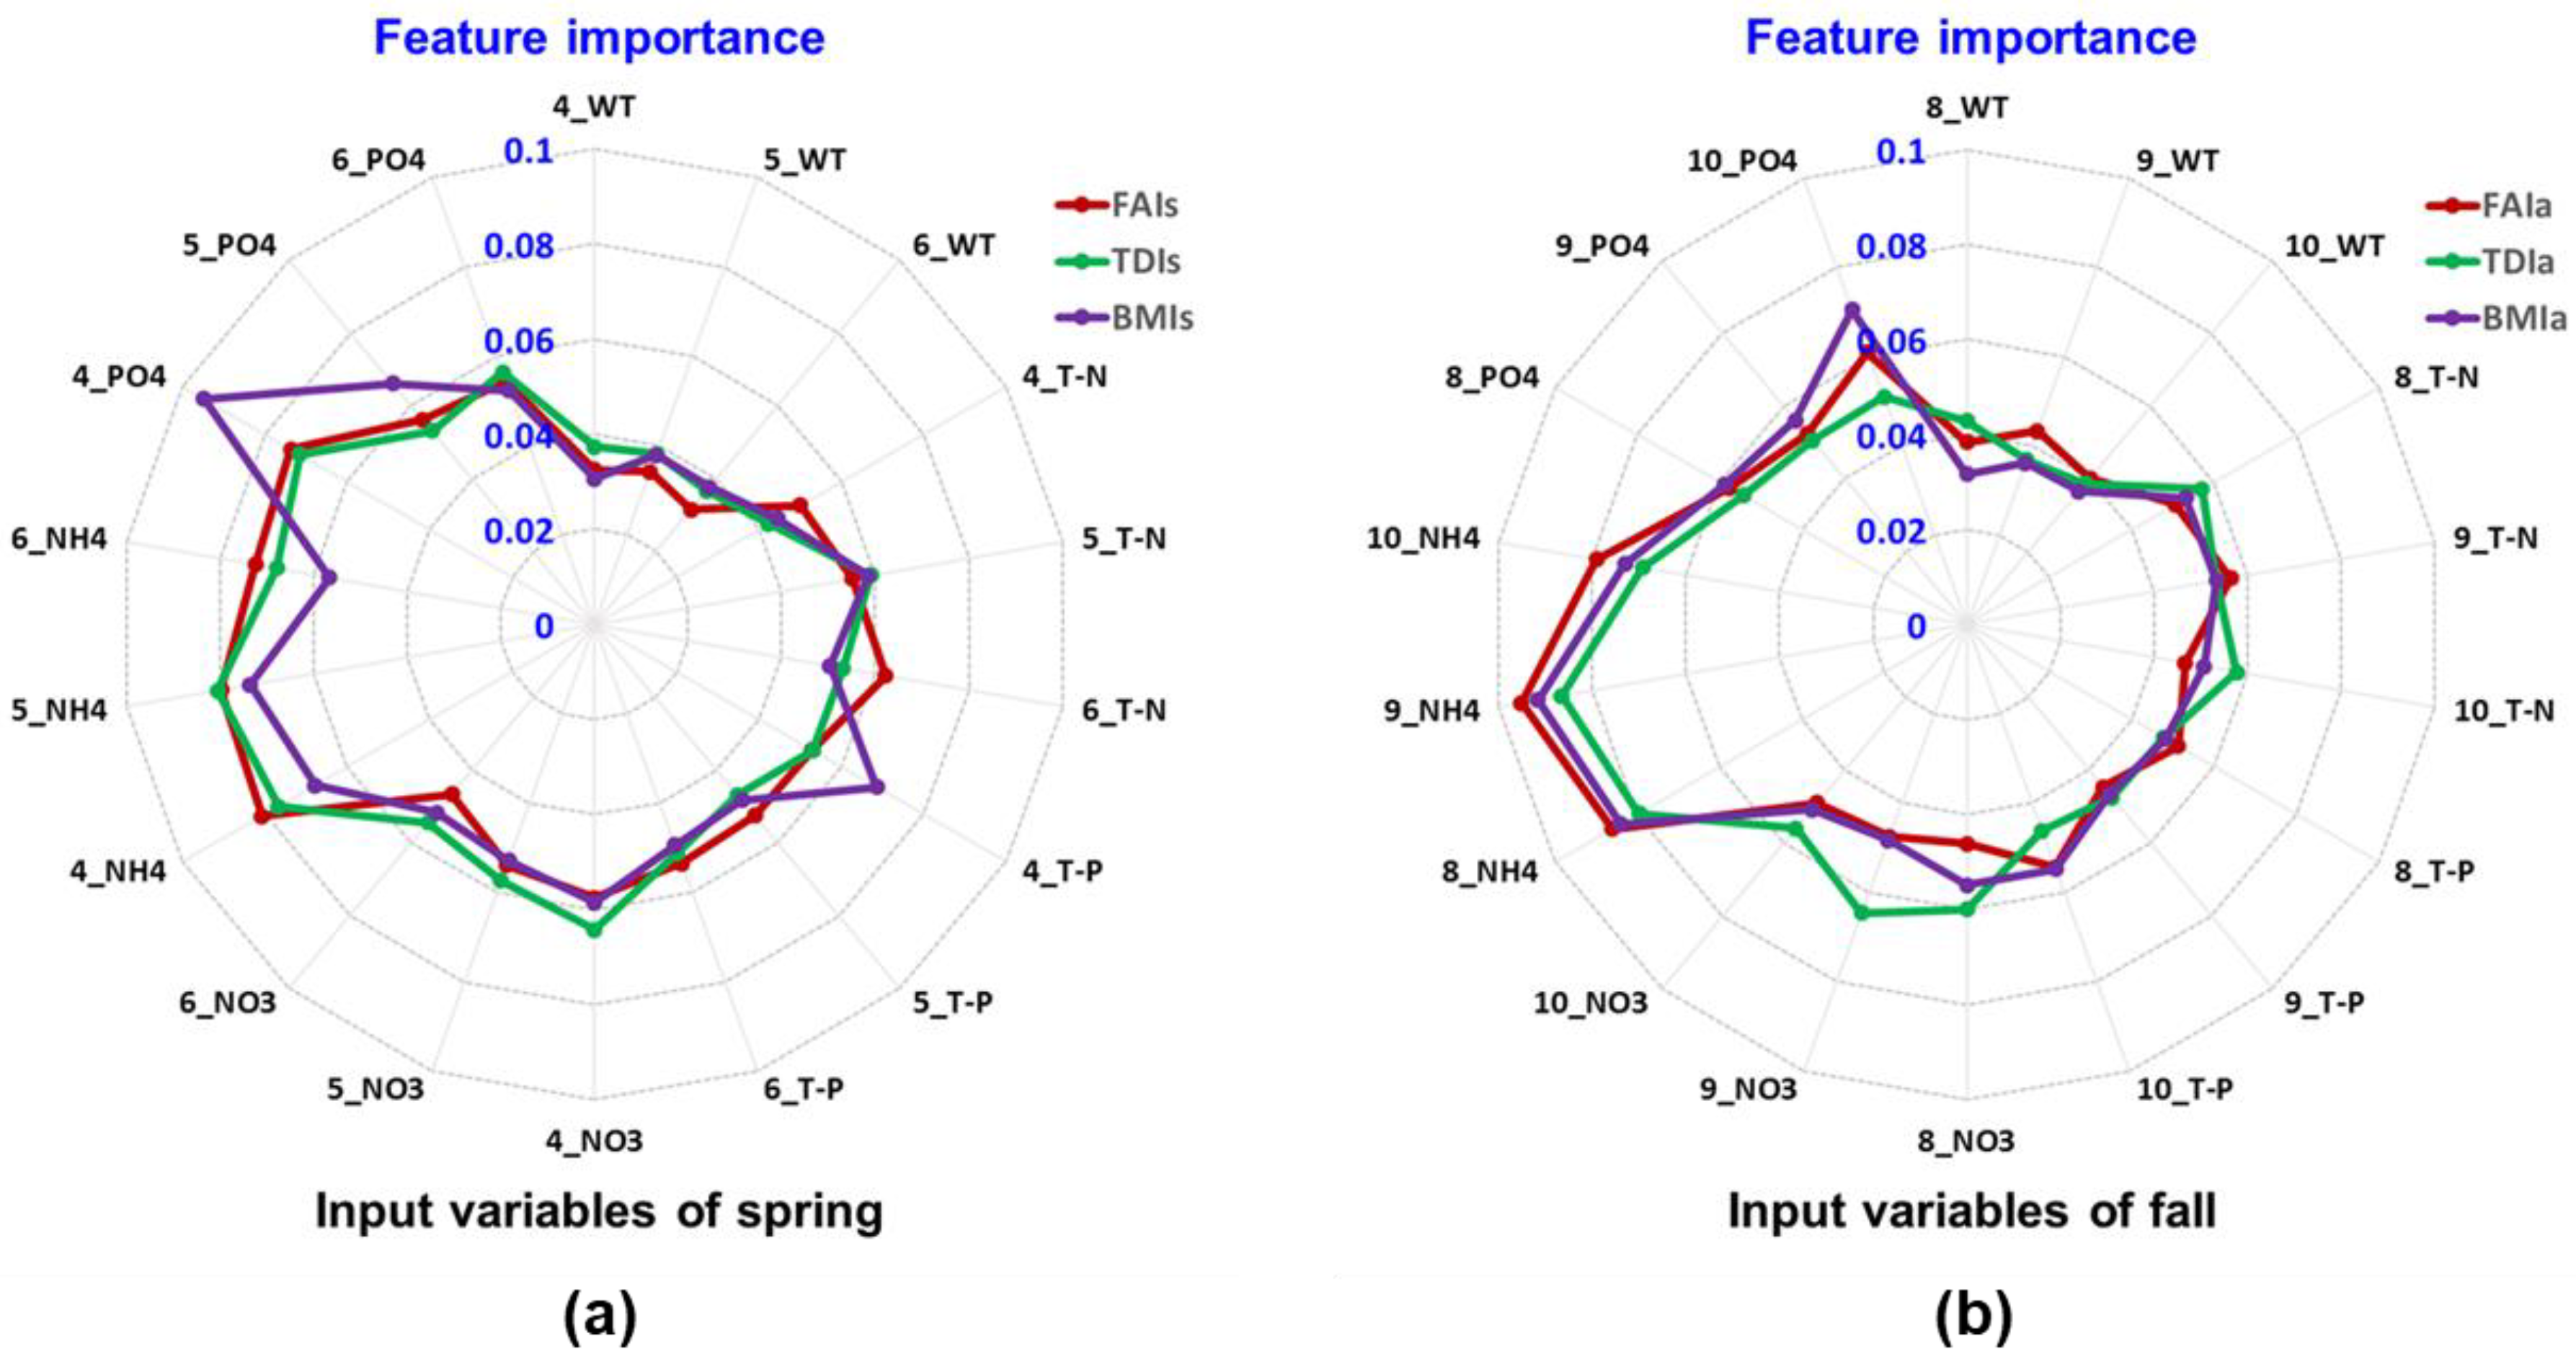
3.2. Performance of Random Forest Classification Algorithm
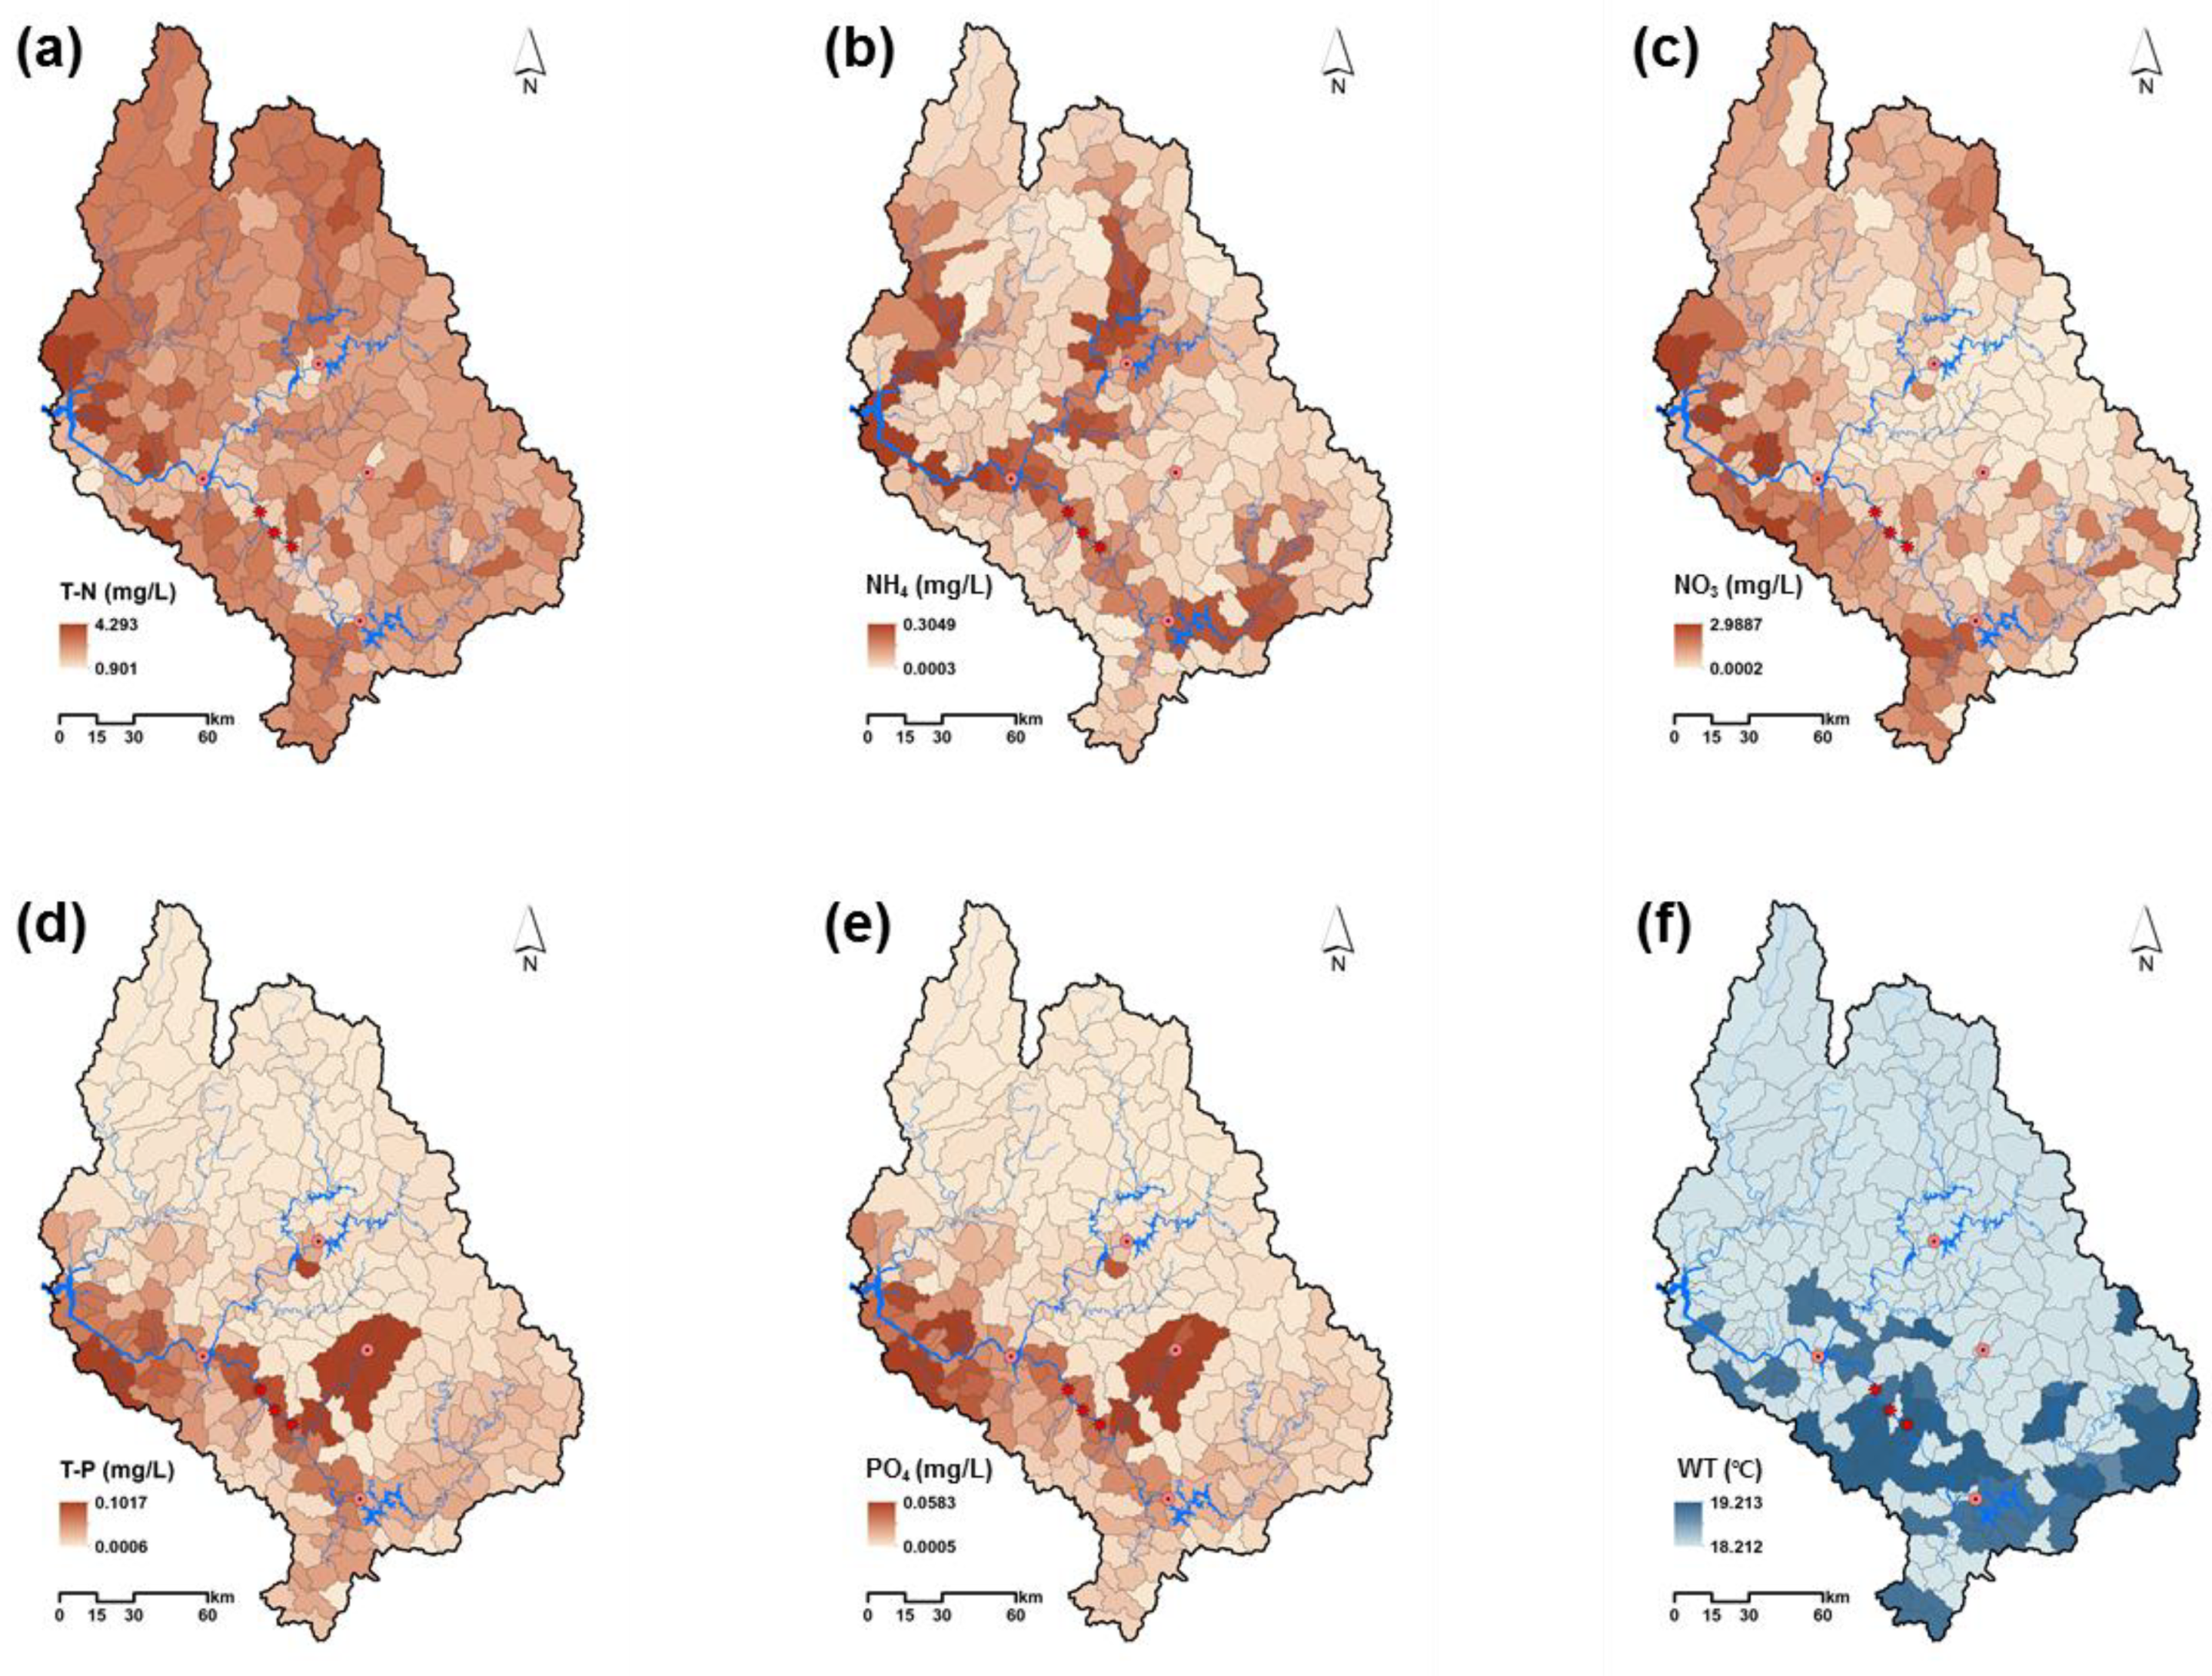
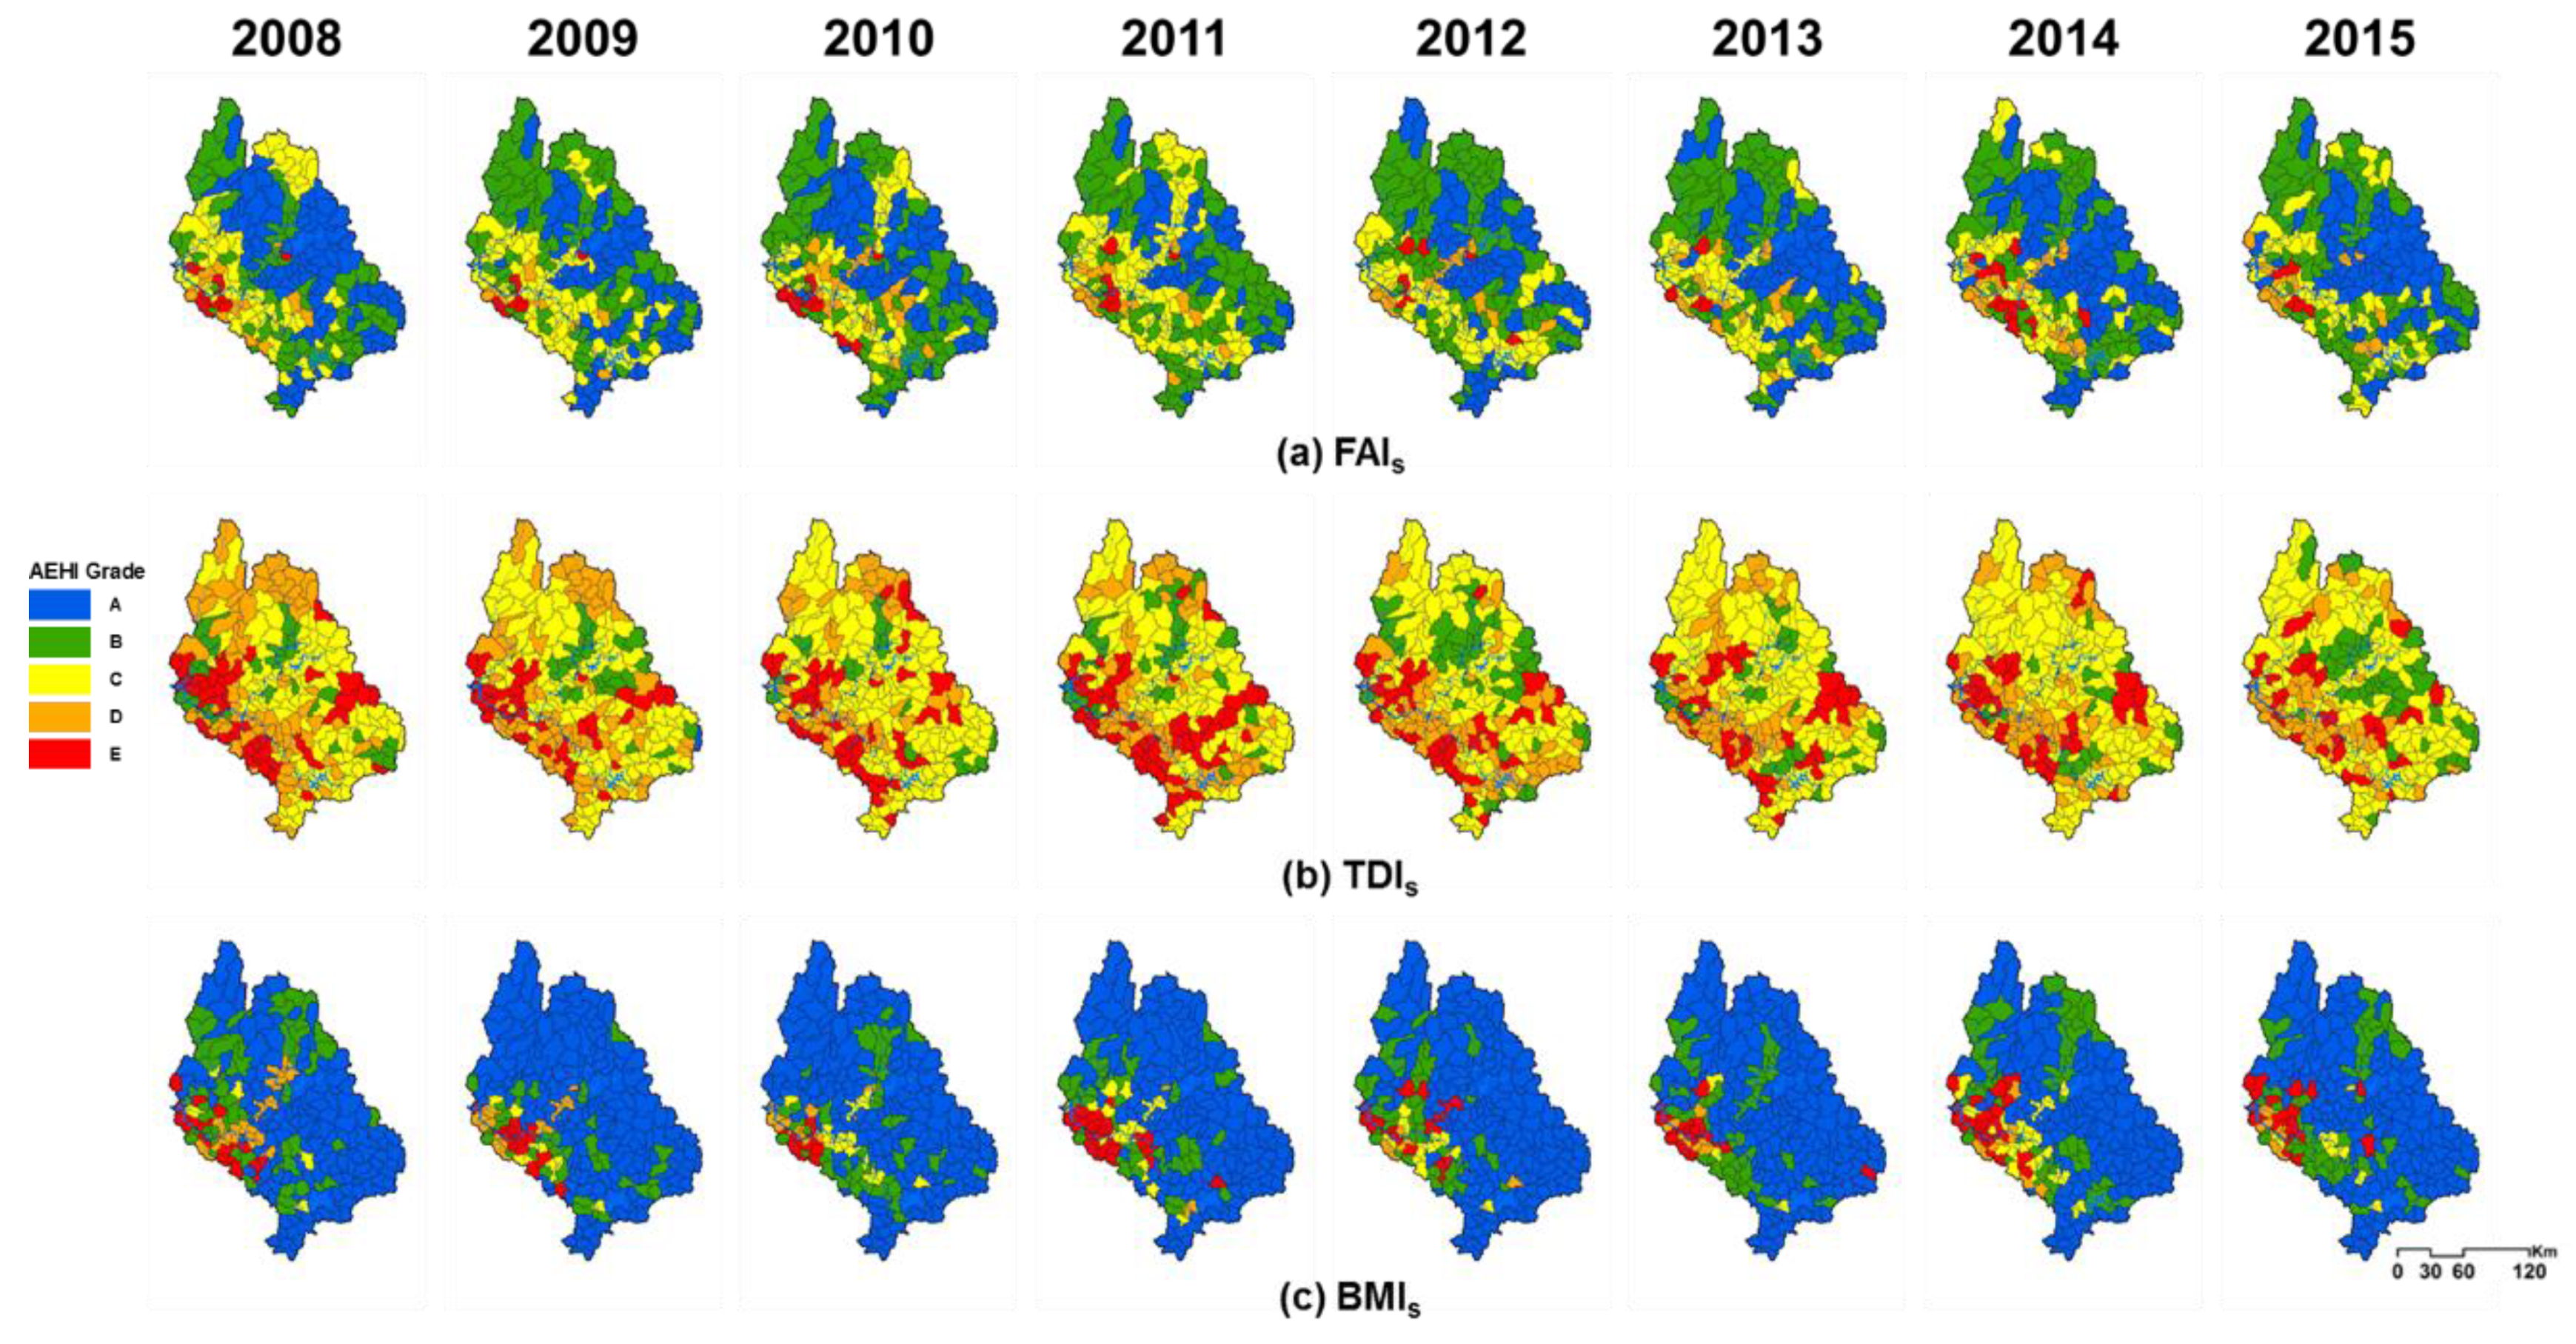
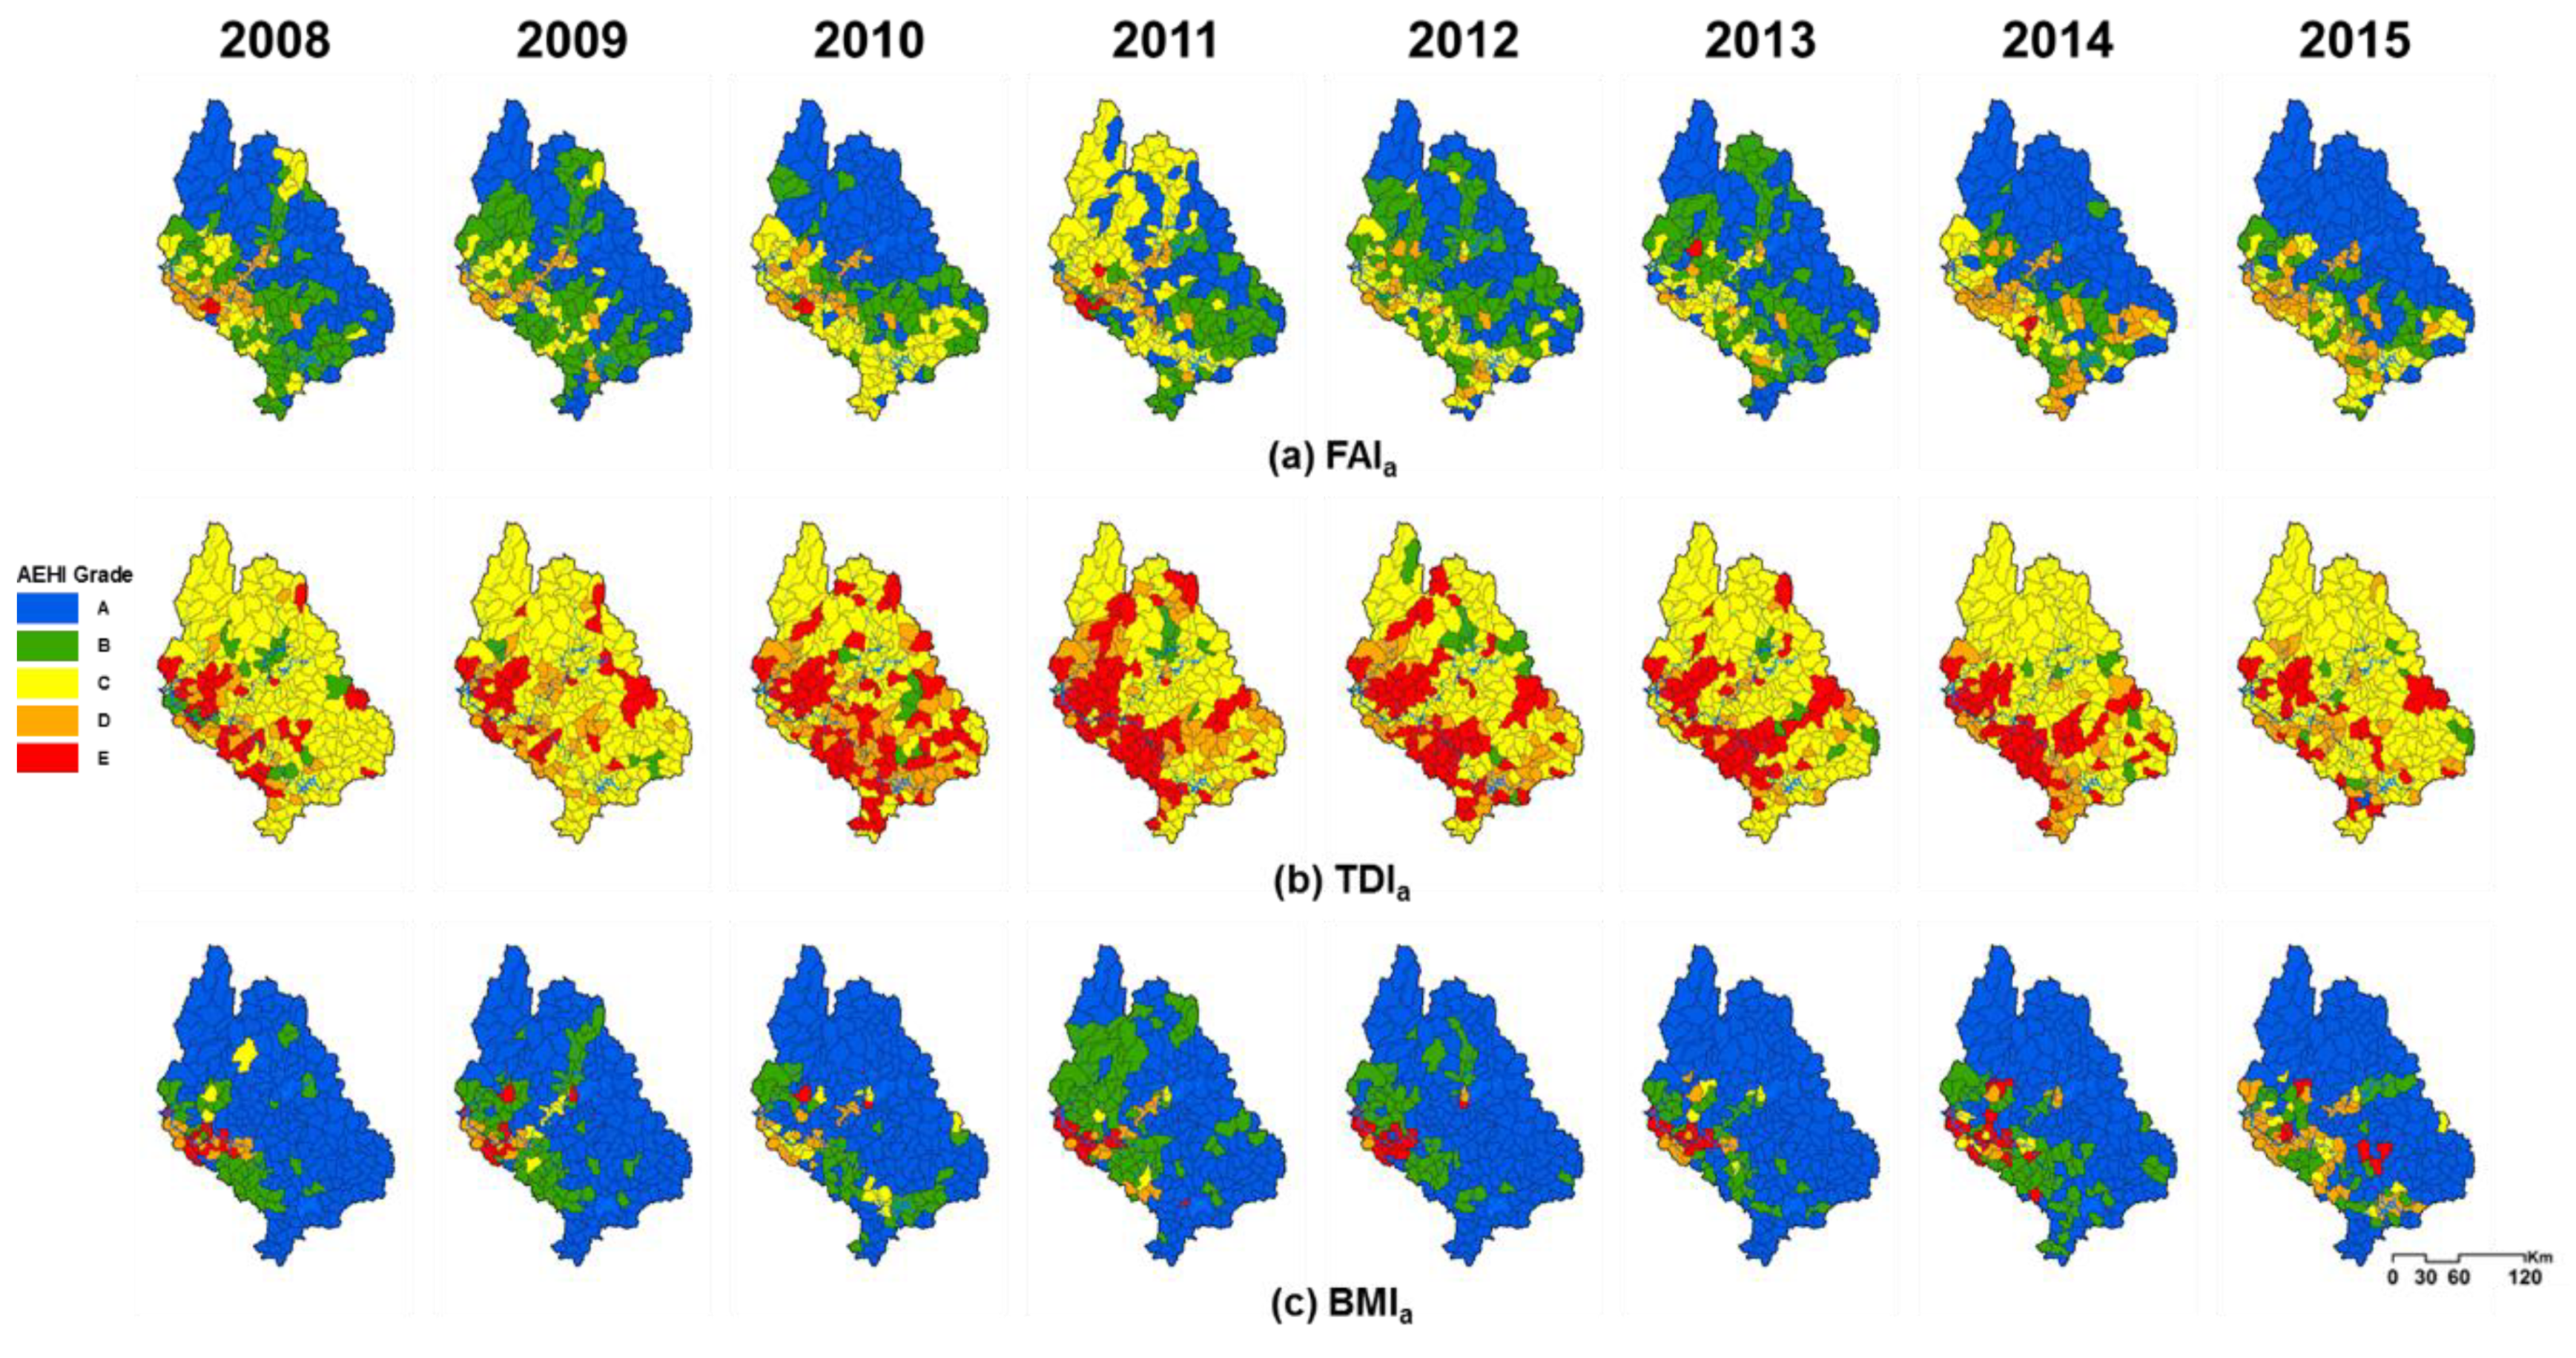
3.3. Evaluation of the AEH Index to the Whole Watershed Streams
4. Summary and Conclusions
Author Contributions
Funding
Acknowledgments
Conflicts of Interest
References
- Faber, M.; Rapport, D. Ecosystem Health: New Goals for Environmental Management, 1st ed.; Island Press: Washington, DC, USA, 1992; pp. 239–256. [Google Scholar]
- Vörösmarty, C.J.; McIntyre, P.B.; Gessner, M.O.; Dudgeon, D.; Prusevich, A.; Green, P.; Glidden, S.; Bunn, S.E.; Sullivan, C.A.; Liermann, C.R.; et al. Global threats to human water security and river biodiversity. Nature 2010, 467, 555–561. [Google Scholar] [CrossRef] [PubMed]
- Kelly, M.G.; Whitton, B.A. The trophic diatom index: A new index for monitoring eutrophication in rivers. J. Appl. Phycol. 1995, 7, 433–444. [Google Scholar] [CrossRef]
- Hering, D.; Johnson, R.K.; Kramm, S.; Schmutz, S.; Szoszkiewicz, K.; Verdonschot, P.F. Assessment of European streams with diatoms, macrophytes, macroinvertebrates and fish: A comparative metric-based analysis of organism response to stress. Freshw. Biol. 2006, 51, 1757–1785. [Google Scholar] [CrossRef]
- Johnson, R.K.; Furse, M.T.; Hering, D.; Sandin, L. Ecological relationships between stream communities and spatial scale: Implications for designing catchment-level monitoring programmes. Freshw. Biol. 2007, 52, 939–958. [Google Scholar] [CrossRef]
- Stoddard, J.L.; Herlihy, A.T.; Peck, D.V.; Hughes, R.M.; Whittier, T.R.; Tarquinio, E. A process for creating multimetric indices for large-scale aquatic surveys. J. N. Am. Benthol. Soc. 2008, 27, 878–891. [Google Scholar] [CrossRef]
- Mathuriau, C.; Silva, N.M.; Lyons, J.; Rivera, L.M.M. Fish and macroinvertebrates as freshwater ecosystem bioindicators in Mexico: Current state and perspectives. In Water Resources in Mexico; Springer: Berlin/Heidelberg, Germany, 2012; Volume 7, pp. 251–261. [Google Scholar] [CrossRef]
- Cheimonopoulou, M.T.; Bobori, D.C.; Theocharopoulos, I.; Lazaridou, M. Assessing ecological water quality with macroinvertebrates and fish: A case study from a small Mediterranean river. Environ. Manag. 2011, 47, 279–290. [Google Scholar] [CrossRef] [PubMed]
- Schultz, R.; Dibble, E. Effects of invasive macrophytes on freshwater fish and macroinvertebrate communities: The role of invasive plant traits. Hydrobiologia 2012, 684, 1–14. [Google Scholar] [CrossRef]
- Aazami, J.; Esmaili-Sari, A.; Abdoli, A.; Sohrabi, H.; Van den Brink, P.J. Monitoring and assessment of water health quality in the Tajan River, Iran using physicochemical, fish and macroinvertebrates indices. J. Environ. Health Sci. Eng. 2015, 13, 29. [Google Scholar] [CrossRef]
- Round, F.E. Diatoms in river water-monitoring studies. J. Appl. Phycol. 1991, 3, 129–145. [Google Scholar] [CrossRef]
- Leland, H.V. Distribution of phytobenthos in the Yakima River basin, Washington, in relation to geology, land use and other environmental factors. Can. J. Fish. Aquat. Sci. 1995, 52, 1108–1129. [Google Scholar] [CrossRef]
- Hill, B.H.; Stevenson, R.J.; Pan, Y.; Herlihy, A.T.; Kaufmann, P.R.; Johnson, C.B. Comparison of correlations between environmental characteristics and stream diatom assemblages characterized at genus and species levels. J. North Am. Benthol. Soc. 2001, 20, 299–310. [Google Scholar] [CrossRef]
- Lee, S.W.; Hwang, S.J.; Lee, J.K.; Jung, D.I.; Park, Y.J.; Kim, J.T. Overview and application of the national aquatic ecological monitoring program (NAEMP) in Korea. Ann. Limnol. Int. J. Limnol. 2011, 47, S3–S14. [Google Scholar] [CrossRef]
- KMA (Korea Meteorological Administration). Climate Change Status and Response Plan Report; KMA: Seoul, Korea, 2008; p. 2.
- Arnold, J.G.; Srinivasan, R.; Muttiah, R.S.; Williams, J.R. Large area hydrologic modeling and assessment part I: Model development 1. JAWRA J. Am. Water Resour. Assoc. 1998, 34, 73–89. [Google Scholar] [CrossRef]
- Kim, J.G.; Park, Y.; Yoo, D.; Kim, N.W.; Engel, B.A.; Kim, S.J.; Kim, K.S.; Lim, K.J. Development of a SWAT Patch for Better Estimation of Sediment Yield in Steep Sloping Watersheds 1. JAWRA J. Am. Water Resour. Assoc. 2009, 45, 963–972. [Google Scholar] [CrossRef]
- Lee, M.; Park, G.; Park, M.; Park, J.; Lee, J.; Kim, S. Evaluation of non-point source pollution reduction by applying Best Management Practices using a SWAT model and QuickBird high resolution satellite imagery. J. Environ. Sci. 2010, 22, 826–833. [Google Scholar] [CrossRef]
- Ahn, S.R.; Jeong, J.H.; Kim, S.J. Assessing drought threats to agricultural water supplies under climate change by combining the SWAT and MODSIM models for the Geum River basin, Korea. Hydrol. Sci. J. 2016, 61, 2740–2753. [Google Scholar] [CrossRef]
- Townsend, C.R.; Hildrew, A.G.; Francis, J. Community structure in some southern English streams: The influence of physicochemical factors. Freshw. Biol. 1983, 13, 521–544. [Google Scholar] [CrossRef]
- Winterbourn, M.J.; Collier, K.J. Distribution of benthic invertebrates in acid, brown water streams in the South Island of New Zealand. Hydrobiologia 1987, 153, 277–286. [Google Scholar] [CrossRef]
- Blinn, D.W. Diatom community structure along physicochemical gradients in saline lakes. Ecology 1993, 74, 1246–1263. [Google Scholar] [CrossRef]
- Dodds, W.K.; Jones, J.R.; Welch, E.B. Suggested classification of stream trophic state: Distributions of temperate stream types by chlorophyll, total nitrogen, and phosphorus. Water Res. 1998, 32, 1455–1462. [Google Scholar] [CrossRef]
- Shahnawaz, A.; Venkateshwarlu, M.; Somashekar, D.S.; Santosh, K. Fish diversity with relation to water quality of Bhadra River of Western Ghats (India). Environ. Monit. Assess. 2010, 161, 83–91. [Google Scholar] [CrossRef] [PubMed]
- Breiman, L. Random forests. Mach. Learn. 2001, 45, 5–32. [Google Scholar] [CrossRef]
- Gislason, P.O.; Benediktsson, J.A.; Sveinsson, J.R. Random forests for land cover classification. Pattern Recognit. Lett. 2006, 27, 294–300. [Google Scholar] [CrossRef]
- Prasad, A.M.; Iverson, L.R.; Liaw, A. Newer classification and regression tree techniques: Bagging and random forests for ecological prediction. Ecosystems 2006, 9, 181–199. [Google Scholar] [CrossRef]
- Chan, J.C.W.; Paelinckx, D. Evaluation of Random Forest and Adaboost tree-based ensemble classification and spectral band selection for ecotope mapping using airborne hyperspectral imagery. Remote Sens. Environ. 2008, 112, 2999–3011. [Google Scholar] [CrossRef]
- Grossmann, E.; Ohmann, J.; Kagan, J.; May, H.; Gregory, M. Mapping ecological systems with a random forest model: Tradeoffs between errors and bias. Gap Anal. Bull. 2010, 17, 16–22. [Google Scholar]
- Vincenzi, S.; Zucchetta, M.; Franzoi, P.; Pellizzato, M.; Pranovi, F.; De Leo, G.A.; Torricelli, P. Application of a Random Forest algorithm to predict spatial distribution of the potential yield of Ruditapes philippinarum in the Venice lagoon, Italy. Ecol. Model. 2011, 222, 1471–1478. [Google Scholar] [CrossRef]
- Granata, F. Evapotranspiration evaluation models based on machine learning algorithms—A comparative study. Agric. Water Manag. 2019, 217, 303–315. [Google Scholar] [CrossRef]
- Kamińska, J.A. A random forest partition model for predicting NO2 concentrations from traffic flow and meteorological conditions. Sci. Total Environ. 2019, 651, 475–483. [Google Scholar] [CrossRef]
- Silveira, E.M.; Silva, S.H.G.; Acerbi-Junior, F.W.; Carvalho, M.C.; Carvalho, L.M.T.; Scolforo, J.R.S.; Wulder, M.A. Object-based random forest modelling of aboveground forest biomass outperforms a pixel-based approach in a heterogeneous and mountain tropical environment. Int. J. Appl. Earth Obs. Geoinf. 2019, 78, 175–188. [Google Scholar] [CrossRef]
- Ministry of Environment. Nationwide Aquatic Ecological Monitoring Program; National Institute of Environmental Research: Incheon, Korea, 2015.
- Arnold, J.G.; Williams, J.R.; Srinivasan, R.; King, K.W. SWAT Manual; USDA. Agricultural Research Service and Black land Research Center: Temple, TX, USA, 1996.
- Neitsch, S.L.; Arnold, J.G.; Kiniry, J.R.; Williams, J.R. Soil and Water Assessment Tool Theoretical Documentation Version 2009; Texas Water Resources Institute: Temple, TX, USA, 2011. [Google Scholar]
- Nash, J.E.; Sutcliffe, J.V. River flow forecasting through conceptual models part I—A discussion of principles. J. Hydrol. 1970, 10, 282–290. [Google Scholar] [CrossRef]
- Moriasi, D.N.; Arnold, J.G.; Van Liew, M.W.; Bingner, R.L.; Harmel, R.D.; Veith, T.L. Model evaluation guidelines for systematic quantification of accuracy in watershed simulations. Trans. ASABE 2007, 50, 885–900. [Google Scholar] [CrossRef]
- Santhi, C.; Arnold, J.G.; Williams, J.R.; Dugas, W.A.; Srinivasan, R.; Hauck, L.M. Validation of the swat model on a large river basin with point and nonpoint sources 1. JAWRA J. Am. Water Resour. Assoc. 2001, 37, 1169–1188. [Google Scholar] [CrossRef]
- Ahn, S.R.; Kim, S.J. Assessment of Climate Change Impacts on the Future Hydrologic Cycle of the Han River Basin in Korea Using a Grid-Based Distributed Model. Irrig. Drain. 2016, 65, 11–21. [Google Scholar] [CrossRef]
- Ahn, S.R.; Kim, S.J. Assessment of integrated watershed health based on the natural environment, hydrology, water quality, and aquatic ecology. Hydrol. Earth Syst. Sci. 2017, 21, 5583–5602. [Google Scholar] [CrossRef]
- Ahn, S.R.; Lee, J.W.; Jang, S.S.; Kim, S.J. Large Scale SWAT Watershed Modeling Considering Multi-Purpose Dams and Multi-Function Weirs Operation-For Namhan River Basin. J. Korean Soc. Agric. Eng. 2016, 58, 21–35. (In Korean) [Google Scholar] [CrossRef]
- Ahn, S.R. Physically-Based Watershed Health and Resilience Assessment Considering Climate Change. Ph.D. Thesis, Graduate School of Konkuk University, Seoul, Korea, 2016. [Google Scholar]
- Langley, P.; Simon, H.A. Applications of machine learning and rule induction. Commun. ACM 1995, 38, 54–64. [Google Scholar] [CrossRef]
- Pal, M. Random forest classifier for remote sensing classification. Int. J. Remote Sens. 2005, 26, 217–222. [Google Scholar] [CrossRef]
- Fernández-Delgado, M.; Cernadas, E.; Barro, S.; Amorim, D. Do we need hundreds of classifiers to solve real world classification problems? J. Mach. Learn. Res. 2014, 15, 3133–3181. [Google Scholar]
- Probst, P.; Bischl, B.; Boulesteix, A.L. Tunability: Importance of hyperparameters of machine learning algorithms. arXiv 2018, arXiv:1802.09596. [Google Scholar]
- Woo, S.Y.; Jung, C.G.; Kim, J.U.; Kim, S.J. Assessment of climate change impact on aquatic ecology health indices in Han river basin using SWAT and random forest. J. Korea Water Resour. Assoc. 2018, 51, 863–874. (In Korean) [Google Scholar] [CrossRef]
- Goutte, C.; Gaussier, E. A probabilistic interpretation of precision, recall and F-score, with implication for evaluation. In Proceedings of the European Conference on Information Retrieval, Santiago de Compostela, Spain, 21–23 March 2005; Springer: Berlin/Heidelberg, Germany, 2005; pp. 345–359. [Google Scholar] [CrossRef]
- Benediktsson, J.A.; Swain, P.H.; Ersoy, O.K. Neural network approaches versus statistical methods in classification of multisource remote sensing data. IEEE Trans. Geosci. Remote Sens. 1990, 28, 540–552. [Google Scholar] [CrossRef]
- Congalton, R.G. A review of assessing the accuracy of classifications of remotely sensed data. Remote Sens. Environ. 1991, 37, 35–46. [Google Scholar] [CrossRef]


| Index | A (Very Good) | B (Good) | C (Fair) | D (Poor) | E (Very Poor) |
|---|---|---|---|---|---|
| FAI | |||||
| TDI | |||||
| BMI |
| Grade | FAI | TDI | BMI | ||||||||||
|---|---|---|---|---|---|---|---|---|---|---|---|---|---|
| P | R | F1 | S | P | R | F1 | S | P | R | F1 | S | ||
| Spring | A | 0.63 | 0.62 | 0.63 | 61 | - | - | - | 0 | 0.80 | 0.90 | 0.85 | 164 |
| B | 0.35 | 0.50 | 0.41 | 50 | 0.48 | 0.39 | 0.43 | 41 | 0.35 | 0.31 | 0.33 | 45 | |
| C | 0.33 | 0.35 | 0.34 | 52 | 0.45 | 0.67 | 0.54 | 82 | 0.33 | 0.16 | 0.22 | 25 | |
| D | 0.33 | 0.10 | 0.15 | 30 | 0.44 | 0.34 | 0.38 | 83 | 0 | 0 | 0 | 20 | |
| E | 0.50 | 0.38 | 0.43 | 8 | 0.60 | 0.49 | 0.54 | 69 | 0.34 | 0.59 | 0.43 | 17 | |
| Avg | 0.43 | 0.43 | 0.42 | 201 | 0.49 | 0.48 | 0.48 | 275 | 0.60 | 0.65 | 0.62 | 271 | |
| Fall | A | 0.61 | 0.68 | 0.65 | 60 | - | - | - | 0 | 0.76 | 0.92 | 0.83 | 153 |
| B | 0.43 | 0.53 | 0.47 | 55 | 0.20 | 0.04 | 0.07 | 25 | 0.41 | 0.34 | 0.37 | 64 | |
| C | 0.37 | 0.33 | 0.35 | 57 | 0.45 | 0.65 | 0.53 | 92 | 0.17 | 0.04 | 0.06 | 26 | |
| D | 0.36 | 0.20 | 0.26 | 25 | 0.59 | 0.17 | 0.22 | 80 | 0.10 | 0.06 | 0.07 | 17 | |
| E | 0 | 0 | 0 | 4 | 0.51 | 0.58 | 0.50 | 78 | 0.22 | 0.31 | 0.26 | 13 | |
| Avg | 0.45 | 0.47 | 0.45 | 201 | 0.40 | 0.44 | 0.40 | 275 | 0.56 | 0.62 | 0.58 | 273 | |
| Grade | FAI | TDI | BMI | |||||||||||||
|---|---|---|---|---|---|---|---|---|---|---|---|---|---|---|---|---|
| A | B | C | D | E | A | B | C | D | E | A | B | C | D | E | ||
| Spring | A | 38 | 15 | 7 | 1 | 0 | 0 | 0 | 0 | 0 | 0 | 148 | 14 | 1 | 1 | 0 |
| B | 11 | 25 | 13 | 1 | 0 | 0 | 16 | 20 | 2 | 3 | 24 | 14 | 4 | 0 | 3 | |
| C | 8 | 23 | 18 | 3 | 0 | 0 | 7 | 55 | 13 | 7 | 4 | 5 | 4 | 1 | 11 | |
| D | 3 | 8 | 13 | 3 | 3 | 0 | 3 | 39 | 28 | 13 | 7 | 5 | 3 | 0 | 5 | |
| E | 0 | 1 | 3 | 1 | 3 | 0 | 7 | 7 | 21 | 34 | 1 | 2 | 0 | 4 | 10 | |
| Fall | A | 41 | 11 | 7 | 1 | 0 | 0 | 0 | 0 | 0 | 0 | 141 | 11 | 1 | 0 | 0 |
| B | 15 | 29 | 11 | 0 | 0 | 0 | 1 | 18 | 4 | 2 | 29 | 22 | 4 | 4 | 5 | |
| C | 7 | 24 | 19 | 7 | 0 | 0 | 3 | 60 | 19 | 10 | 5 | 13 | 1 | 3 | 4 | |
| D | 4 | 4 | 12 | 5 | 0 | 0 | 1 | 33 | 14 | 32 | 6 | 5 | 0 | 1 | 5 | |
| E | 0 | 0 | 3 | 1 | 0 | 0 | 0 | 22 | 11 | 45 | 4 | 3 | 0 | 2 | 4 | |
| Index | Grade | 2008 | 2009 | 2010 | 2011 | 2012 | 2013 | 2014 | 2015 | ||||||||
|---|---|---|---|---|---|---|---|---|---|---|---|---|---|---|---|---|---|
| FAIs | A | 88 | (37%) | 73 | (31%) | 73 | (31%) | 45 | (19%) | 73 | (31%) | 78 | (33%) | 86 | (36%) | 82 | (35%) |
| B | 67 | (28%) | 81 | (34%) | 86 | (36%) | 93 | (39%) | 88 | (37%) | 87 | (37%) | 74 | (31%) | 83 | (35%) | |
| C | 62 | (26%) | 70 | (30%) | 49 | (21%) | 79 | (33%) | 56 | (24%) | 53 | (22%) | 45 | (19%) | 53 | (22%) | |
| D | 13 | (6%) | 8 | (3%) | 19 | (8%) | 14 | (6%) | 14 | (6%) | 14 | (6%) | 19 | (8%) | 14 | (6%) | |
| E | 7 | (3%) | 5 | (2%) | 10 | (4%) | 6 | (3%) | 6 | (2%) | 5 | (2%) | 13 | (6%) | 5 | (2%) | |
| TDIs | A | 0 | (0%) | 1 | (0%) | 0 | (0%) | 0 | (0%) | 0 | (0%) | 0 | (0%) | 0 | (0%) | 0 | (0%) |
| B | 31 | (13%) | 24 | (10%) | 18 | (8%) | 30 | (13%) | 42 | (18%) | 27 | (13%) | 21 | (9%) | 43 | (18%) | |
| C | 90 | (38%) | 109 | (46%) | 133 | (56%) | 97 | (41%) | 102 | (43%) | 119 | (50%) | 122 | (52%) | 120 | (51%) | |
| D | 71 | (30%) | 64 | (27%) | 41 | (17%) | 52 | (22%) | 54 | (23%) | 53 | (22%) | 60 | (25%) | 46 | (19%) | |
| E | 45 | (19%) | 39 | (17%) | 45 | (19%) | 58 | (24%) | 39 | (16%) | 38 | (16%) | 34 | (14%) | 28 | (12%) | |
| BMIs | A | 143 | (61%) | 170 | (72%) | 161 | (68%) | 159 | (67%) | 166 | (70%) | 169 | (72%) | 137 | (58%) | 155 | (65%) |
| B | 57 | (24%) | 35 | (15%) | 44 | (19%) | 37 | (16%) | 39 | (16%) | 43 | (18%) | 50 | (21%) | 50 | (21%) | |
| C | 5 | (2%) | 8 | (3%) | 15 | (6%) | 15 | (6%) | 11 | (5%) | 3 | (1%) | 22 | (9%) | 8 | (3%) | |
| D | 17 | (7%) | 10 | (4%) | 10 | (4%) | 4 | (2%) | 4 | (2%) | 5 | (2%) | 6 | (3%) | 6 | (3%) | |
| E | 15 | (6%) | 14 | (6%) | 7 | (3%) | 22 | (9%) | 17 | (7%) | 17 | (7%) | 22 | (9%) | 18 | (8%) | |
| Index | Grade | 2008 | 2009 | 2010 | 2011 | 2012 | 2013 | 2014 | 2015 | ||||||||
|---|---|---|---|---|---|---|---|---|---|---|---|---|---|---|---|---|---|
| FAIa | Ν | 96 | (40%) | 94 | (40%) | 91 | (38%) | 66 | (28%) | 80 | (34%) | 101 | (42%) | 110 | (46%) | 116 | (49%) |
| B | 75 | (32%) | 85 | (36%) | 52 | (22%) | 58 | (24%) | 91 | (38%) | 87 | (37%) | 37 | (16%) | 39 | (17%) | |
| C | 36 | (15%) | 37 | (15%) | 71 | (30%) | 87 | (37%) | 49 | (21%) | 39 | (16%) | 40 | (17%) | 41 | (17%) | |
| D | 28 | (12%) | 21 | (9%) | 21 | (9%) | 22 | (9%) | 17 | (7%) | 9 | (4%) | 48 | (20%) | 41 | (17%) | |
| E | 2 | (1%) | 0 | (0%) | 2 | (1%) | 4 | (2%) | 0 | (0%) | 1 | (1%) | 2 | (1%) | 0 | (0%) | |
| TDIa | A | 0 | (0%) | 0 | (0%) | 0 | (0%) | 0 | (0%) | 0 | (0%) | 0 | (0%) | 0 | (0%) | 2 | (1%) |
| B | 19 | (8%) | 5 | (2%) | 6 | (3%) | 7 | (3%) | 10 | (4%) | 9 | (4%) | 7 | (3%) | 9 | (4%) | |
| C | 156 | (66%) | 158 | (66%) | 90 | (38%) | 108 | (45%) | 115 | (49%) | 143 | (60%) | 136 | (57%) | 160 | (67%) | |
| D | 24 | (10%) | 37 | (16%) | 55 | (23%) | 42 | (18%) | 34 | (14%) | 22 | (9%) | 33 | (14%) | 31 | (13%) | |
| E | 38 | (16%) | 37 | (16%) | 86 | (36%) | 80 | (34%) | 78 | (33%) | 63 | (27%) | 61 | (26%) | 35 | (15%) | |
| BMIa | A | 175 | (74%) | 155 | (65%) | 164 | (69%) | 134 | (57%) | 173 | (73%) | 175 | (74%) | 146 | (62%) | 153 | (65%) |
| B | 38 | (16%) | 57 | (24%) | 38 | (16%) | 74 | (31%) | 46 | (20%) | 35 | (15%) | 60 | (25%) | 32 | (13%) | |
| C | 3 | (1%) | 6 | (3%) | 18 | (8%) | 3 | (1%) | 0 | (0%) | 5 | (2%) | 6 | (2%) | 12 | (5%) | |
| D | 12 | (5%) | 12 | (5%) | 15 | (6%) | 12 | (5%) | 3 | (1%) | 10 | (4%) | 7 | (3%) | 34 | (14%) | |
| E | 9 | (4%) | 7 | (3%) | 2 | (1%) | 14 | (6%) | 15 | (6%) | 12 | (5%) | 18 | (8%) | 6 | (3%) | |
© 2019 by the authors. Licensee MDPI, Basel, Switzerland. This article is an open access article distributed under the terms and conditions of the Creative Commons Attribution (CC BY) license (http://creativecommons.org/licenses/by/4.0/).
Share and Cite
Woo, S.Y.; Jung, C.G.; Lee, J.W.; Kim, S.J. Evaluation of Watershed Scale Aquatic Ecosystem Health by SWAT Modeling and Random Forest Technique. Sustainability 2019, 11, 3397. https://doi.org/10.3390/su11123397
Woo SY, Jung CG, Lee JW, Kim SJ. Evaluation of Watershed Scale Aquatic Ecosystem Health by SWAT Modeling and Random Forest Technique. Sustainability. 2019; 11(12):3397. https://doi.org/10.3390/su11123397
Chicago/Turabian StyleWoo, So Young, Chung Gil Jung, Ji Wan Lee, and Seong Joon Kim. 2019. "Evaluation of Watershed Scale Aquatic Ecosystem Health by SWAT Modeling and Random Forest Technique" Sustainability 11, no. 12: 3397. https://doi.org/10.3390/su11123397
APA StyleWoo, S. Y., Jung, C. G., Lee, J. W., & Kim, S. J. (2019). Evaluation of Watershed Scale Aquatic Ecosystem Health by SWAT Modeling and Random Forest Technique. Sustainability, 11(12), 3397. https://doi.org/10.3390/su11123397