Pro-Environmental Behaviours and Value-Belief-Norm Theory: Assessing Unobserved Heterogeneity of Two Ethnic Groups


Abstract
1. Introduction
- ▪
- To investigate disparities in interrelationships between Malay and Chinese ethnic groups via the VBN model (i.e., values, beliefs and personal norms);
- ▪
- To examine differences in PEB between Malay and Chinese ethnic groups, based on the extended VBN model (i.e., social norms) and personal norms; and
- ▪
- To explore the multidimensional structure of PEB among Malay and Chinese ethnic groups.
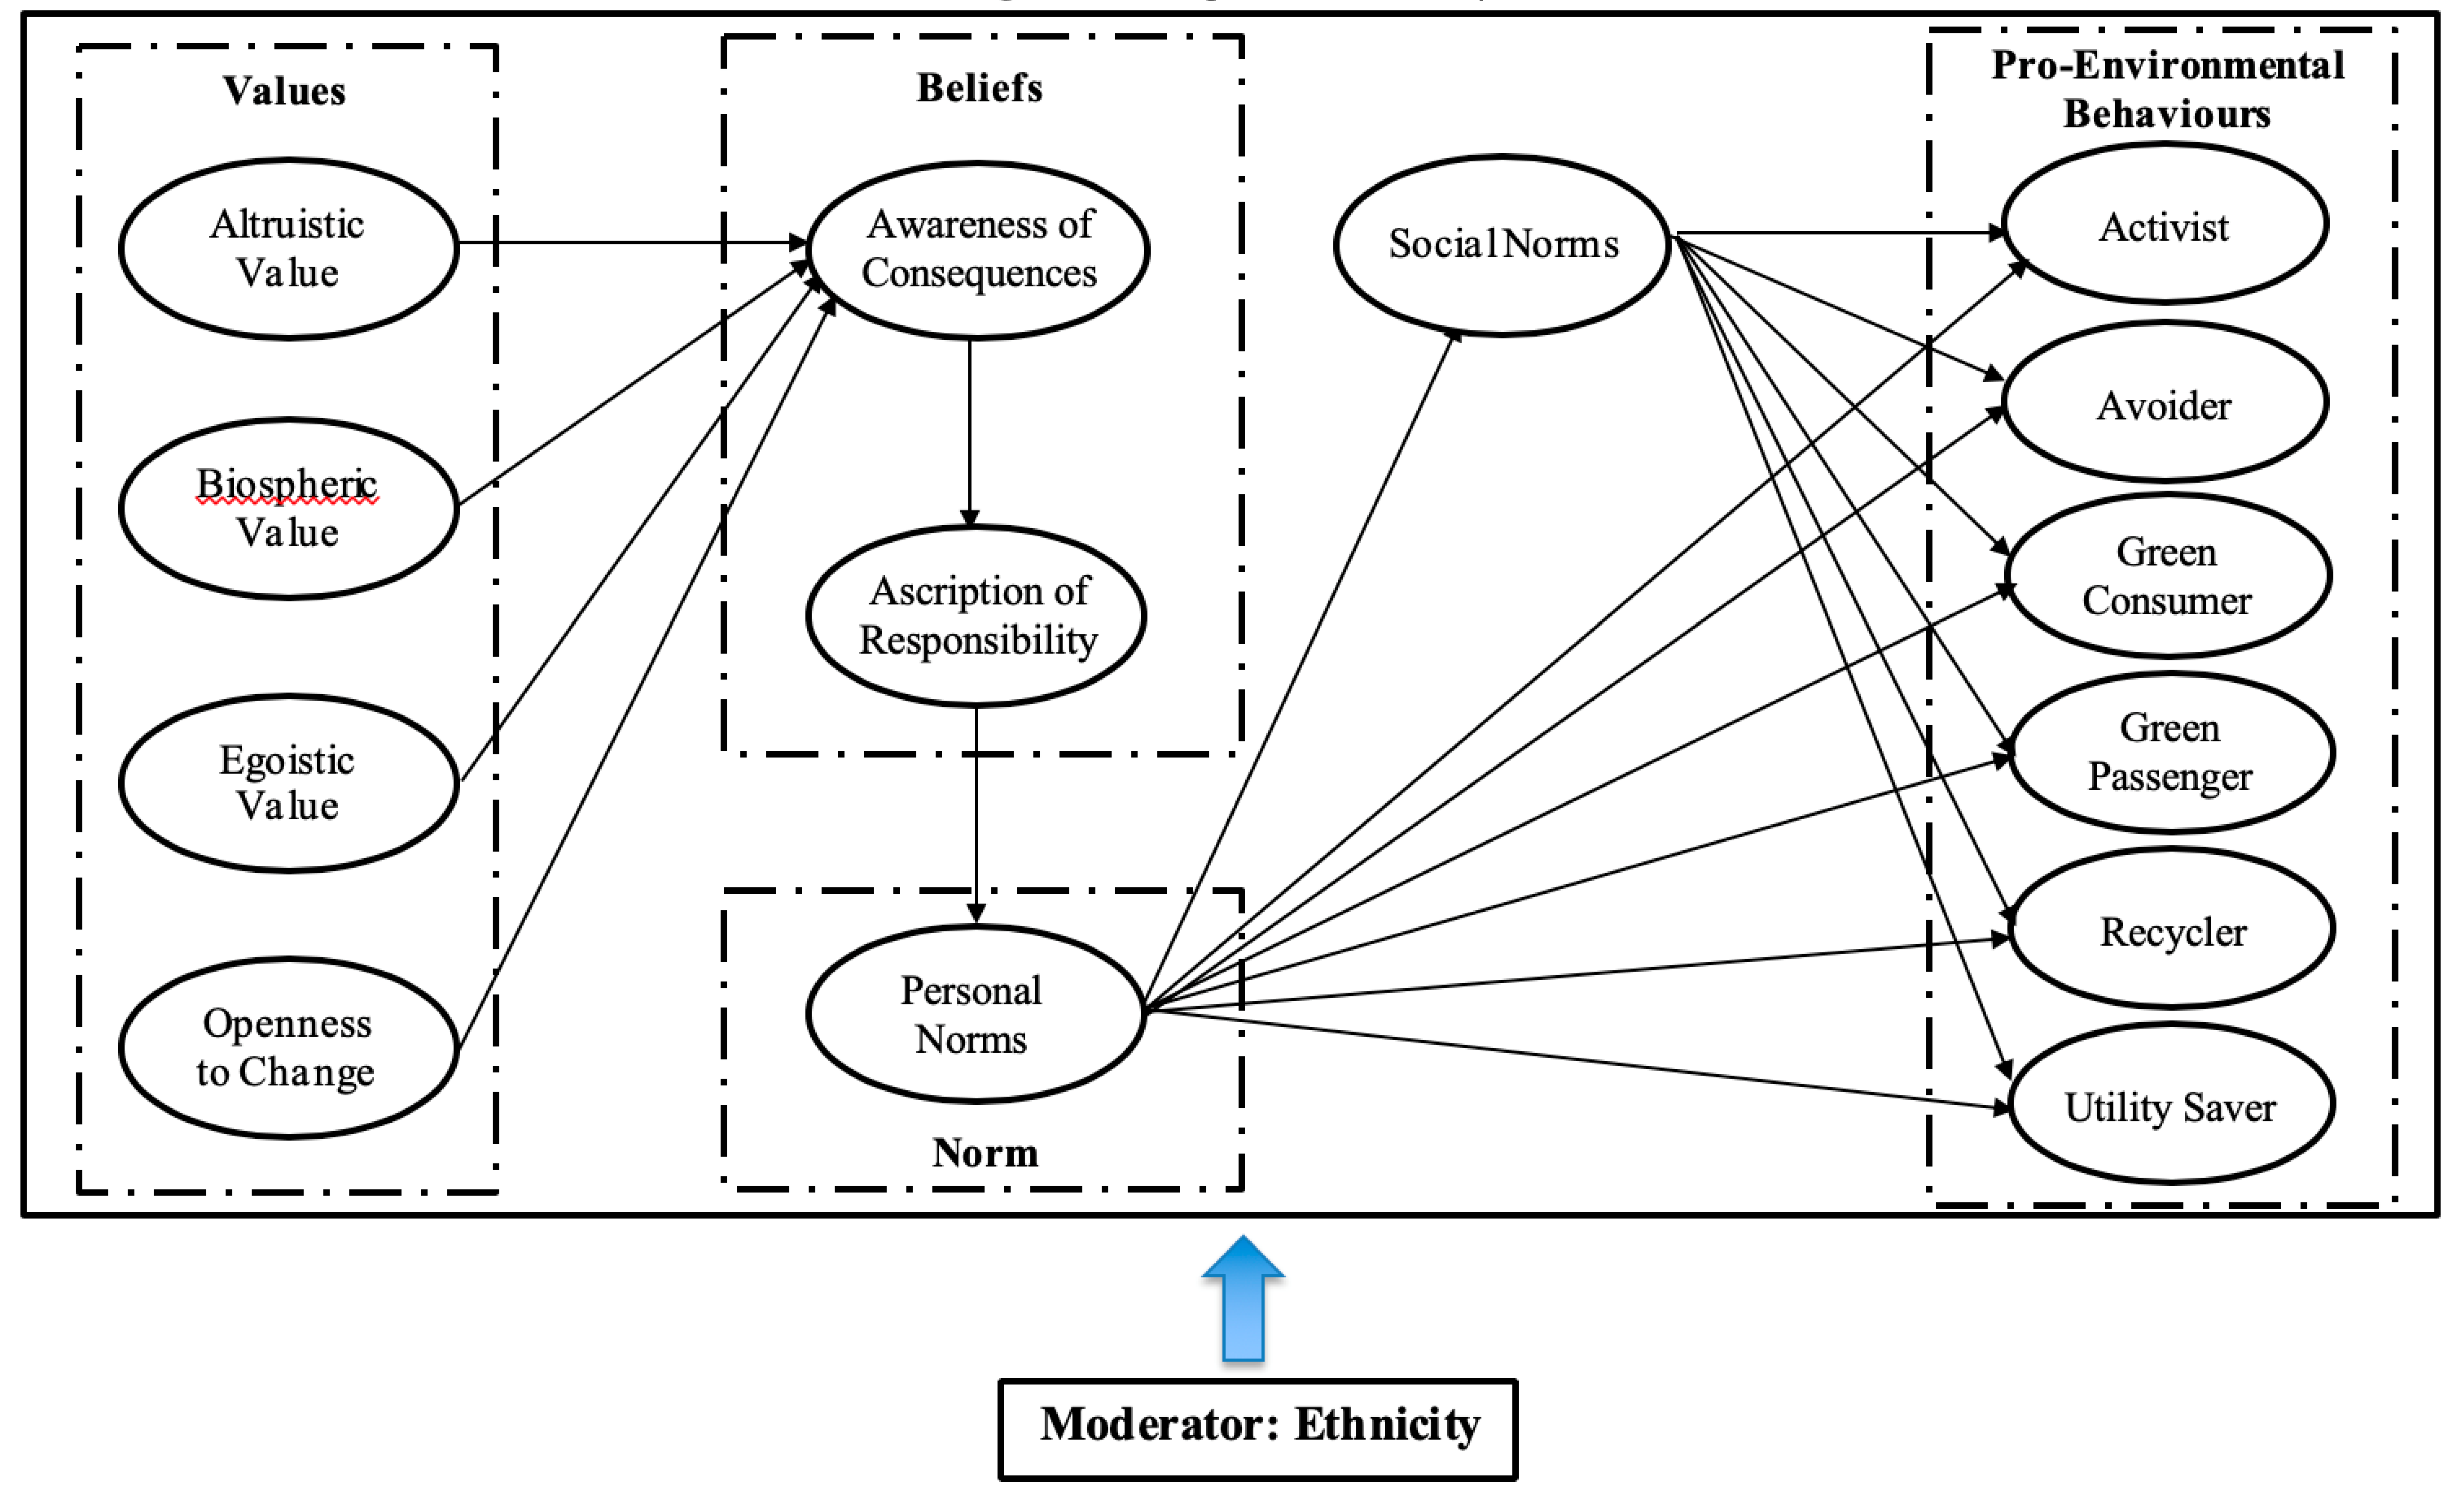
2. Theoretical Background and Hypothesis Development
2.1. Pro-Environmental Behaviours
2.2. Socio-Demographic Variable—Malay Vs. Chinese Ethnic Groups
2.3. Value-Belief-Norm Theory
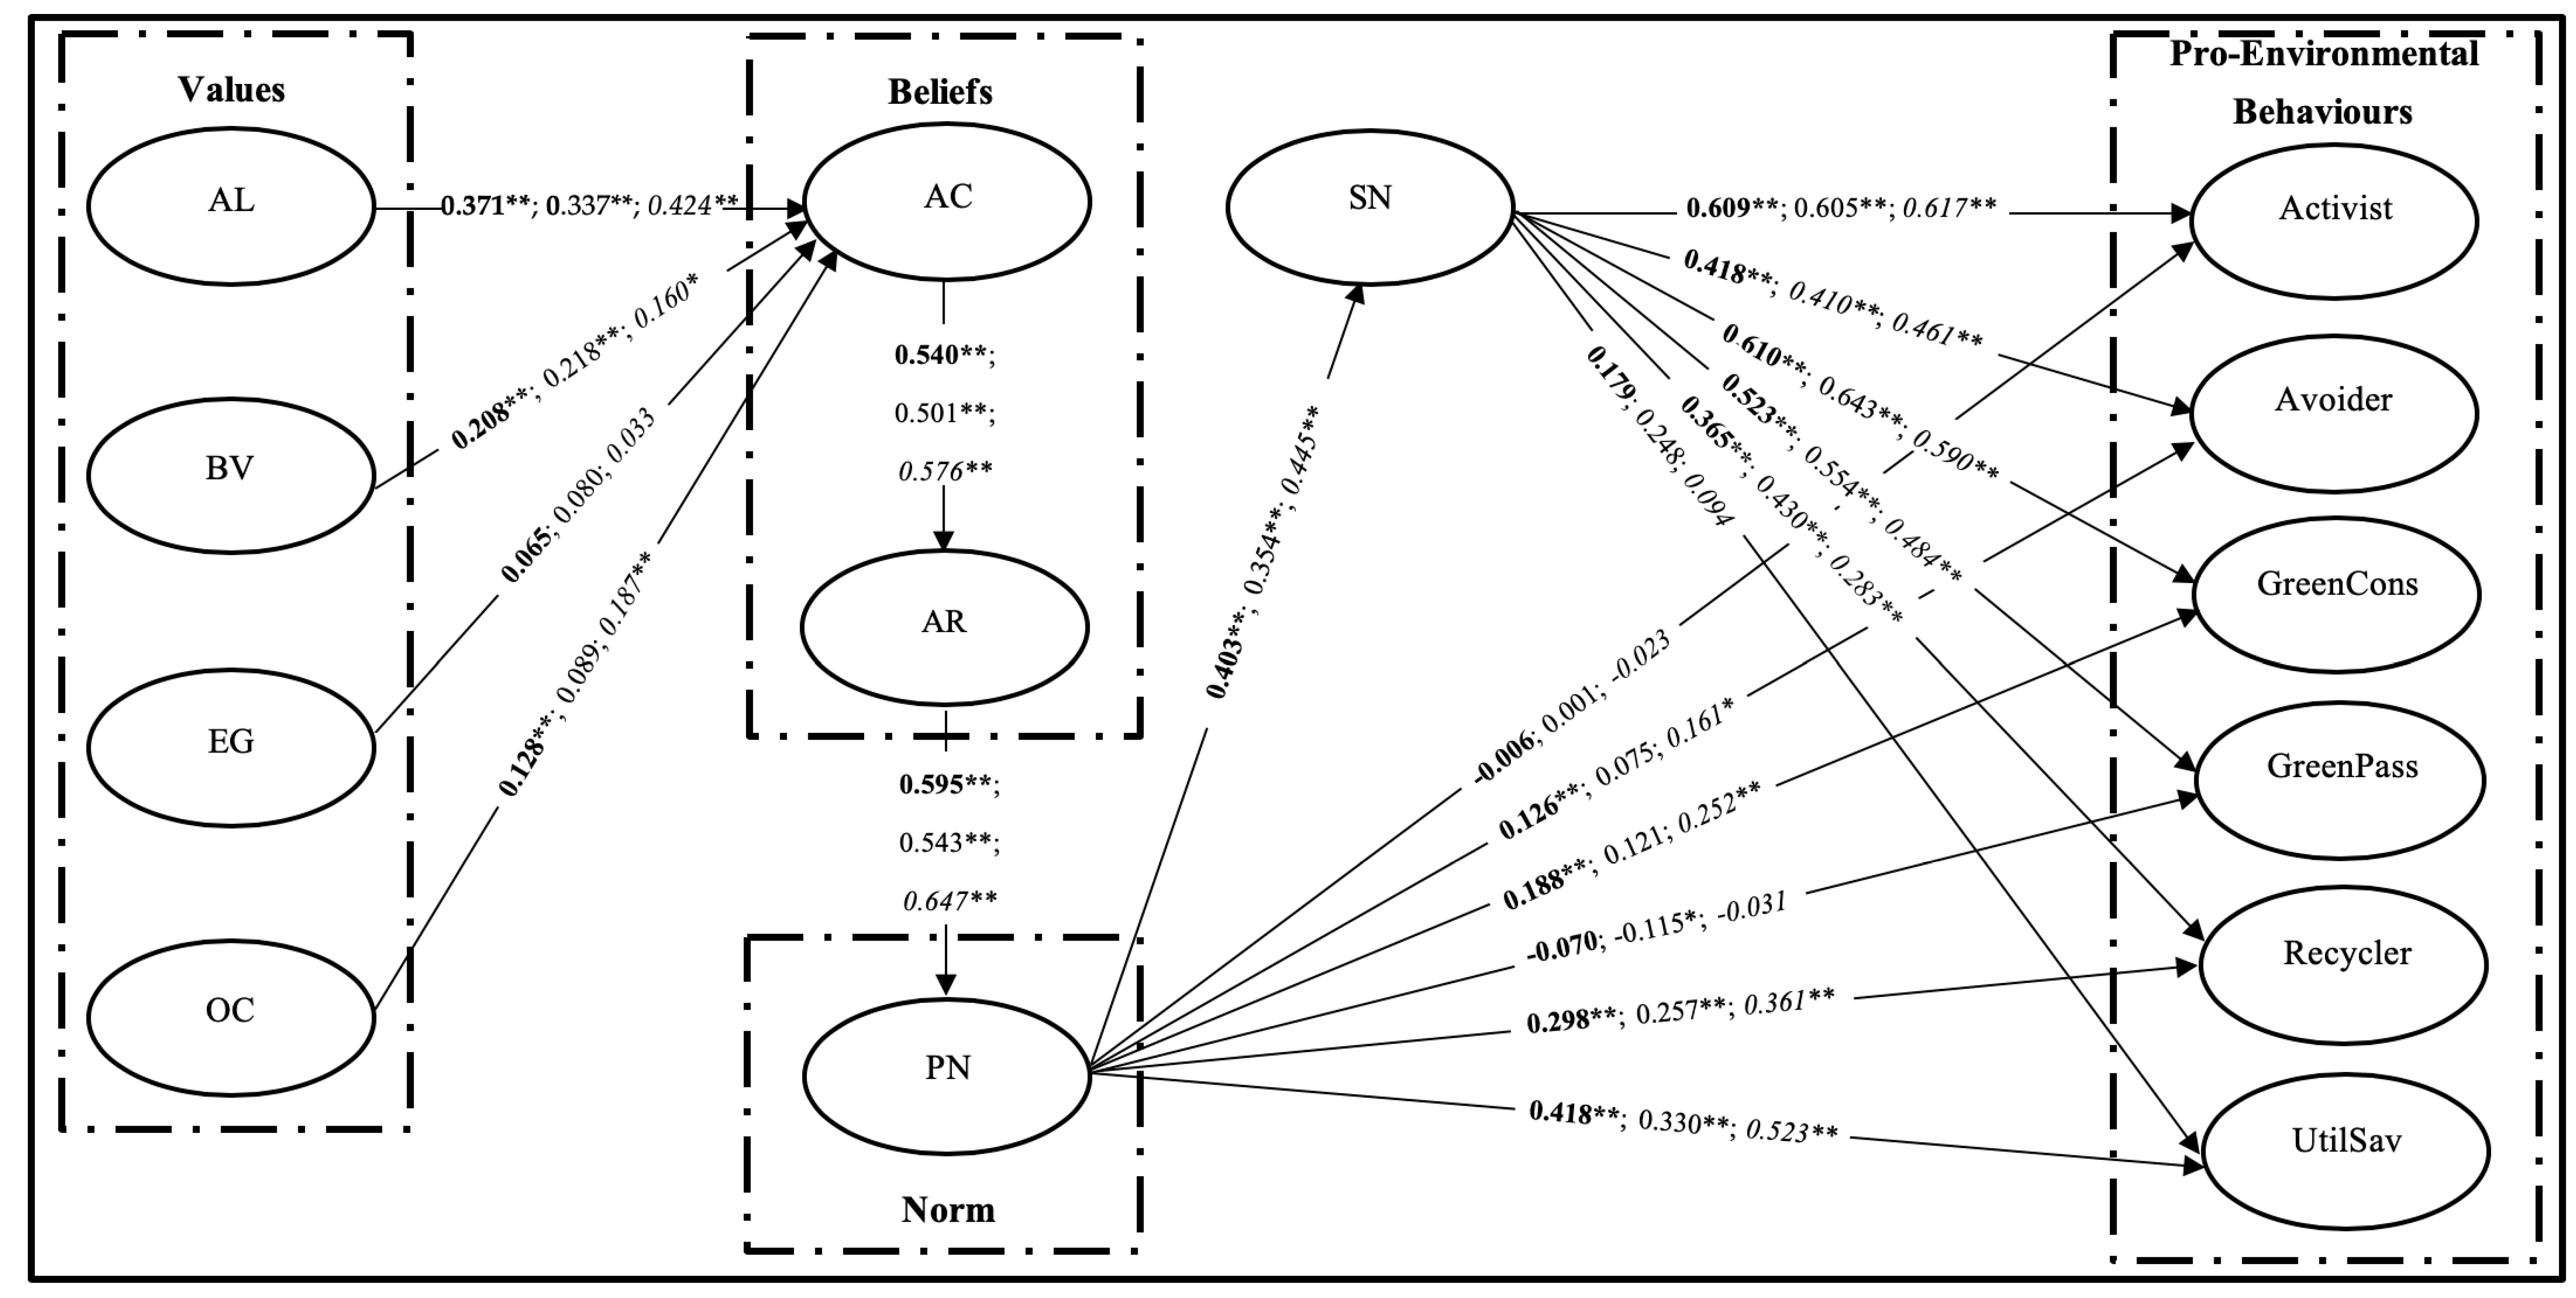
- H1a,b: The strength of the relations between altruistic value and awareness of consequences is different between Malays and Chinese.
- H2a,b: The strength of the relations between biospheric value and awareness of consequences is different between Malays and Chinese.
- H3a,b: The strength of the relations between egoistic value and awareness of consequences is different between Malays and Chinese.
- H4a,b: The strength of the relations between openness to change and awareness of consequences is different between Malays and Chinese.
- H5a,b: The strength of the relations between awareness of consequences and ascription of responsibility is different between Malays and Chinese.
- H6a,b: The strength of the relations between ascription of responsibility and personal norms is different between Malays and Chinese.
- H7a,b to H12a,b: The strength of the relations between personal norms and PEBs (i.e., Activist, Avoider, Green Consumer, Green Passenger, Recycler and Utility Saver) is different between Malay and Chinese.
2.4. Extended Value-Belief-Norm Theory
- H13a,b: The strength of the relations between personal norms and social norms is different between Malay and Chinese.
- H14a,b to H19a,b: The strength of the relations between social norms and PEBs (i.e., Activist, Avoider, Green Consumer, Green Passenger, Recycler and Utility Saver) is different between Malay and Chinese.
3. Methodology
3.1. Respondent and Data Collection Procedure
3.2. Construct Measurement Development
3.3. Data Analysis
4. Results
4.1. Descriptive Analysis
4.2. Measurement Model Evaluation
4.2.1. Formative Constructs
4.2.2. Reflective Constructs
4.3. Discriminant Validity
4.4. Structural Model Evaluation and Hypothesis Testing
4.5. Multi-Group Analysis
5. Discussion and Implications
5.1. Theoretical Implications
5.2. Practical Implications
6. Conclusions
Limitations and Future Research
Author Contributions
Funding
Conflicts of Interest
Appendix A


References
- Kiatkawsin, K.; Han, H. Young travelers’ intention to behave pro-environmentally: Merging the value-belief-norm theory and the expectancy theory. Tour. Manag. 2017, 59, 76–88. [Google Scholar] [CrossRef]
- Hu, J.; Yang, Y.; Jing, F.; Nguyen, B. Awe, spirituality and conspicuous consumer behavior. Int. J. Consum. Stud. 2018, 42, 829–839. [Google Scholar] [CrossRef]
- Yang, Y.; Hu, J.; Jing, F.; Nguyen, B. From Awe to Ecological Behavior: The Mediating Role of Connectedness to Nature. Sustainability 2018, 10, 2477. [Google Scholar] [CrossRef]
- Ghazali, E.M.; Mutum, D.S.; Ariswibowo, N. Impact of religious values and habit on an extended green purchase behaviour model. Int. J. Consum. Stud. 2018, 42, 639–654. [Google Scholar] [CrossRef]
- Arisbowo, N.; Ghazali, E. Green purchase behaviours of Muslim consumers: An examination of religious value and environmental knowledge. J. Organ. Stud. Innov. 2017, 4, 39–56. [Google Scholar]
- Ghazali, E.; Soon, P.C.; Mutum, D.S.; Nguyen, B. Health and cosmetics: Investigating consumers’ values for buying organic personal care products. J. Retail. Consum. Serv. 2017, 39, 154–163. [Google Scholar] [CrossRef]
- Stern, P.C. Toward a Coherent Theory of Environmentally Significant Behavior. J. Soc. Issues 2000, 56, 407–424. [Google Scholar] [CrossRef]
- Chan, R.Y.K. Determinants of Chinese Consumers’ Green Purchase Behavior. Psychol. Mark. 2001, 18, 389–413. [Google Scholar] [CrossRef]
- Huang, H. Media use, environmental beliefs, self-efficacy, and pro-environmental behavior. J. Bus. Res. 2016, 69, 2206–2212. [Google Scholar] [CrossRef]
- Biswas, A.; Roy, M. Leveraging factors for sustained green consumption behavior based on consumption value perceptions: testing the structural model. J. Clean. Prod. 2015, 95, 332–340. [Google Scholar] [CrossRef]
- Biswas, A.; Licata, J.W.; McKee, D.; Pullig, C.; Daughtridge, C. The Recycling Cycle: An Empirical Examination of Consumer Waste Recycling and Recycling Shopping Behaviors. J. Public Policy Mark. 2000, 19, 93–105. [Google Scholar] [CrossRef]
- Gilg, A.; Barr, S.; Ford, N. Green consumption or sustainable lifestyles? Identifying the sustainable consumer. Futures 2005, 37, 481–504. [Google Scholar] [CrossRef]
- Lee, Y.; Kim, S.; Kim, M.; Choi, J. Antecedents and interrelationships of three types of pro-environmental behavior. J. Bus. Res. 2014, 67, 2097–2105. [Google Scholar] [CrossRef]
- Cleveland, M.; Kalamas, M.; Laroche, M. “It’s not Easy Being Green”: Exploring Green Creeds, Green Deeds, and Internal Environmental Locus of Control. Psychol. Mark. 2012, 29, 293–305. [Google Scholar] [CrossRef]
- Jansson, J.; Marell, A.; Nordlund, A. Exploring consumer adoption of a high involvement eco-innovation using value-belief-norm theory. J. Consum. Behav. 2011, 10, 51–60. [Google Scholar] [CrossRef]
- Choi, H.; Jang, J.; Kandampully, J. Application of the extended VBN theory to understand consumers’ decisions about green hotels. Int. J. Hosp. Manag. 2015, 51, 87–95. [Google Scholar] [CrossRef]
- De Groot, J.I.M.; Steg, L. Mean or green: which values can promote stable pro-environmental behavior? Conserv. Lett. 2009, 2, 61–66. [Google Scholar] [CrossRef]
- Steg, L.; Vlek, C. Encouraging pro-environmental behaviour: An integrative review and research agenda. J. Environ. Psychol. 2009, 29, 309–317. [Google Scholar] [CrossRef]
- Ajzen, I. The theory of planned behavior. Organ. Behav. Hum. Decis. Process. 1991, 50, 179–211. [Google Scholar] [CrossRef]
- Han, H.; Hwang, J. Norm-based loyalty model (NLM): Investigating delegates’ loyalty formation for environmentally responsible conventions. Int. J. Hosp. Manag. 2015, 46, 1–14. [Google Scholar] [CrossRef]
- Stern, P.C.; Dietz, T.; Abel, T.; Guagnano, G.A.; Kalof, L. A value-belief-norm theory of support for social movements: The case of environmentalism. Hum. Ecol. Rev. 1999, 6, 81–97. [Google Scholar]
- Department of Statistics. Press Release: Current Population Estimates, Malaysia, 2014-2016; The Office of Chief Statistician, Department of Statistics: Putrajaya, Malaysia, 2016.
- Department of Statistics Population & Demography. Available online: https://www.dosm.gov.my/v1/index.php?r=column/ctwoByCat&parent_id=115&menu_id=L0pheU43NWJwRWVSZklWdzQ4TlhUUT09 (accessed on 28 May 2019).
- Goh, Y.N.; Wahid, N.A. A review on green purchase behaviour trend of Malaysian consumers. Asian Soc. Sci. 2015, 11, 103–110. [Google Scholar] [CrossRef]
- Suhaimee, S.; Ibrahim, I.Z.; Abd-Wahab, M.A.M. Organic Agriculture in Malaysia. Available online: http://ap.fftc.agnet.org/ap_db.php?id=579&print=1 (accessed on 10 June 2019).
- Hofstede, G. Cultures and Organizations: Software of the Mind; McGraw-Hill: London, UK, 1991. [Google Scholar]
- Hofstede, G. Culture’s Consequences: International Differences in Work-Related Values; Sage Publication: Beverly Hills, CA, USA, 1980. [Google Scholar]
- Hofstede, G. Dimensionalizing Cultures: The Hofstede Model in Context. Online Readings Psychol. Cult. 2011, 2. [Google Scholar] [CrossRef]
- Putit, L.; Arnott, D.C. Micro-culture and consumers adoption of technology: A need to re-evaluate the concept of national culture. Acad. Mark. Sci. Rev. 2007, 2007, 1–15. [Google Scholar]
- Putit, L.; Muhammad, N.S. Predictors of web-based transactions: Examining key variations within an intra-national culture. Adv. Sci. Lett. 2015, 21, 2068–2072. [Google Scholar] [CrossRef]
- Fontaine, R.; Richardson, S. Cultural values in Malaysia: Chinese, Malays and Indians compared. Cross Cult. Manag. An Int. J. 2005, 12, 63–77. [Google Scholar] [CrossRef]
- Lai, F.S.F.; Chong, S.S.C.; Sia, B.B.K.; Ooi, B.B.C. Culture and Consumer Behavior: Comparisons between Malays and Chinese in Malaysia. Int. J. Innov. Manag. Technol. 2010, 1, 180–185. [Google Scholar]
- Wan-Husin, W.N. Cultural Clash between the Malays and Chinese in Malaysia: An Analysis on the Formation and Implementation of National Cultural Policy. In Proceedings of the International Conference on Humanity, History and Society, Sarajevo, Bosnia and Herzegovina, 27 June–1 July 2012; IACSIT Press: Singapore, 2012; Volume 34, pp. 1–6. [Google Scholar]
- Richardson, C.; Yaapar, M.S.; Abdullah, N.F.L. Understanding Malay and Chinese work ethics in Malaysia through proverbs. Int. J. Cross Cult. Manag. 2017, 17, 365–377. [Google Scholar] [CrossRef]
- Mastor, K.A.; Jin, P.; Cooper, M. Malay Culture and Personality. Am. Behav. Sci. 2000, 44, 95–111. [Google Scholar] [CrossRef]
- Othman, N.; Ghazali, E.; Cheng, O.C. Demographics and personal characteristics of urban Malaysian entrepreneurs: an ethnic comparison. Int. J. Entrep. Innov. Manag. 2005, 5, 421–440. [Google Scholar] [CrossRef]
- Lee, E. lin The Chinese Malaysians’ selfish mentality and behaviors: Rationalizing from the native perspectives. China Media Res. 2007, 3, 91–101. [Google Scholar]
- Ho, J.A.; Rashid, M.Z.A. Perceptions of Business Ethics in a Multicultural Community: The Case of Malaysia. J. Bus. Ethics 2003, 43, 75–87. [Google Scholar]
- Jung, K.; Kau, A.K. Culture’s Influence on Consumer Behaviors: Differences Among Ethnic Groups in a Multiracial Asian Country. In Proceedings of the Advances in Consumer Research; Kahn, B.E., Luce, M.F., Eds.; Association for Consumer Research: Valdosta, GA, USA, 2004; Volume 31, pp. 366–372. [Google Scholar]
- Idris, A. Uncertainty avoidance and innovative differences in a multi-ethnic society: A female perspective. Asian J. Soc. Sci. 2011, 39, 275–295. [Google Scholar] [CrossRef]
- Cheung, S.F.; Cheung, F.M.; Howard, R.; Lim, Y.H. Personality across the ethnic divide in Singapore: Are “Chinese Traits” uniquely Chinese? Pers. Individ. Dif. 2006, 41, 467–477. [Google Scholar] [CrossRef]
- Richardson, C.; Yaapar, M.S.; Amir, S. Budi and Malay workplace ethics. J. Asia Bus. Stud. 2016, 10, 78–92. [Google Scholar] [CrossRef]
- Rashid, M.Z.; Ibrahim, S. The effect of culture and religiosity on business ethics: A cross-cultural comparison. J. Bus. Ethics 2008, 82, 907–917. [Google Scholar] [CrossRef]
- Storz, M.L. Malay and chinese values underlying the malaysian business culture. Int. J. Intercult. Relations 1999, 23, 117–131. [Google Scholar] [CrossRef]
- Syed Azizi, W.; Saufi, R.A.; Chong, K.F. Family Ties, Hard Work, Politics and Their Relationship with the Career Success of Executives in Local Chinese Companies. Malaysian Manag. Rev. 2003, 38, 1–9. [Google Scholar]
- Idris, A. Ethnicity and Cultural Values: An empirical study of Malay and Chinese Entrepreneurs in Peninsular Malaysia. Sarjana 2011, 26, 22–40. [Google Scholar]
- Schwartz, S.H. Universals in the Content and Structure of Values: Theoretical Advances and Empirical Tests in 20 Countries. Adv. Exp. Soc. Psychol. 1992, 25, 1–65. [Google Scholar]
- Schwartz, S.H. Elicitation of Moral Obligation. J. Pers. Soc. Psychol. 1970, 15, 283–293. [Google Scholar] [CrossRef] [PubMed]
- Schwartz, S.H. Value Priorities and Behaviour: Applying a theory of Integrated Value Systems. Psychol. Values 1996, 8, 119–144. [Google Scholar]
- Parks-Leduc, L.; Feldman, G.; Bardi, A. Personality Traits and Personal Values: A Meta-Analysis. Personal. Soc. Psychol. Rev. 2015, 19, 3–29. [Google Scholar] [CrossRef] [PubMed]
- Sánchez, M.; López-Mosquera, N.; Lera-López, F.; Faulin, J. An Extended Planned Behavior Model to Explain the Willingness to Pay to Reduce Noise Pollution in Road Transportation. J. Clean. Prod. 2018, 177, 144–154. [Google Scholar] [CrossRef]
- Davari, A.; Strutton, D. Marketing mix strategies for closing the gap between green consumers’ pro-environmental beliefs and behaviors. J. Strateg. Mark. 2014, 22, 563–586. [Google Scholar] [CrossRef]
- Tanner, C.; Wölfing Kast, S. Promoting Sustainable Consumption: Determinants of Green Purchases by Swiss Consumers. Psychol. Mark. 2003, 20, 883–902. [Google Scholar] [CrossRef]
- Han, H. Travelers’ pro-environmental behavior in a green lodging context: Converging value-belief-norm theory and the theory of planned behavior. Tour. Manag. 2015, 47, 164–177. [Google Scholar] [CrossRef]
- Steinhorst, J.; Klöckner, C.A.; Matthies, E. Saving electricity – For the money or the environment? Risks of limiting pro-environmental spillover when using monetary framing. J. Environ. Psychol. 2015, 43, 125–135. [Google Scholar] [CrossRef]
- Harland, P.; Staats, H.; Wilke, H.A.M. Situational and Personality Factors as Direct or Personal Norm Mediated Predictors of Pro-environmental Behavior: Questions Derived from Norm-activation Theory. Basic Appl. Soc. Psych. 2007, 29, 323–334. [Google Scholar] [CrossRef]
- Khare, A. Antecedents to green buying behaviour: a study on consumers in an emerging economy. Mark. Intell. Plan. 2015, 33, 309–329. [Google Scholar] [CrossRef]
- Ghazali, E.; Othman, M.N. Demographic and Psychographic Profile of Active and Passive Investors of KLSE: A Discriminant Analysis. Asia Pacific Manag. Rev. 2004, 9, 391–413. [Google Scholar]
- Alves, C.A.; Stefanini, C.J.; Silva, L.A. da Chapter 9 The Effect of High and Low Environmental Consciousness Regarding Brazilian Restaurants: A Multigroup Analysis Using PLS. In Applying Partial Least Squares in Tourism and Hospitality Research; Emerald Publishing Limited: Bingley, UK, 2018; pp. 185–209. ISBN 9781787566996. [Google Scholar]
- Yadav, R. Altruistic or egoistic: Which value promotes organic food consumption among young consumers? A study in the context of a developing nation. J. Retail. Consum. Serv. 2016, 33, 92–97. [Google Scholar] [CrossRef]
- Yadav, R.; Pathak, G.S. Young consumers’ intention towards buying green products in a developing nation: Extending the theory of planned behavior. J. Clean. Prod. 2016, 135, 732–739. [Google Scholar] [CrossRef]
- Yadav, R.; Pathak, G.S. Determinants of Consumers’ Green Purchase Behavior in a Developing Nation: Applying and Extending the Theory of Planned Behavior. Ecol. Econ. 2017, 134, 114–122. [Google Scholar] [CrossRef]
- Ghazali, E.M.; Mutum, D.S.; Woon, M.-Y. Multiple sequential mediation in an extended uses and gratifications model of augmented reality game Pokémon Go. Internet Res. 2019. [Google Scholar] [CrossRef]
- Englis, B.G.; Phillips, D. Does Innovativeness Drive Environmentally Conscious Consumer Behavior? Psychol. Mark. 2013, 30, 160–172. [Google Scholar] [CrossRef]
- Gabler, C.B.; Butler, T.D.; Adams, F.G. The environmental belief-behaviour gap: Exploring barriers to green consumerism. J. Cust. Behav. 2013, 12, 159–176. [Google Scholar] [CrossRef]
- Kumar, B.; Manrai, A.K.; Manrai, L.A. Purchasing behaviour for environmentally sustainable products: A conceptual framework and empirical study. J. Retail. Consum. Serv. 2017, 34, 1–9. [Google Scholar] [CrossRef]
- Etikan, I. Comparison of Convenience Sampling and Purposive Sampling. Am. J. Theor. Appl. Stat. 2016, 5, 1–4. [Google Scholar] [CrossRef]
- Sax, L.J.; Gilmartin, S.K.; Bryant, A.N. Assessing Response Rates and Nonresponse Bias in Web. High. Educ. 2011, 44, 409–432. [Google Scholar] [CrossRef]
- Lindell, M.K.; Whitney, D.J. Accounting for common method variance in cross-sectional research designs. J. Appl. Psychol. 2001, 86, 114–121. [Google Scholar] [CrossRef] [PubMed]
- Chin, W.W.; Thatcher, J.B.; Wright, R.T. Doug Steel Controlling for Common Method Variance in PLS Analysis: The Measured Latent Marker Variable Approach. Springer Proc. Math. Stat. 2013, 56, 231–239. [Google Scholar]
- Leung, S.O. A comparison of psychometric properties and normality in 4-, 5-, 6-, and 11-point likert scales. J. Soc. Serv. Res. 2011, 37, 412–421. [Google Scholar] [CrossRef]
- Gordon-Wilson, S.; Modi, P. Personality and older consumers’ green behaviour in the UK. Futures 2015, 71, 1–10. [Google Scholar] [CrossRef]
- Onwezen, M.C.; Antonides, G.; Bartels, J. The Norm Activation Model: An exploration of the functions of anticipated pride and guilt in pro-environmental behaviour. J. Econ. Psychol. 2013, 39, 141–153. [Google Scholar] [CrossRef]
- Gleim, M.R.; Smith, J.S.; Andrews, D.; Cronin, J.J. Against the Green: A Multi-method Examination of the Barriers to Green Consumption. J. Retail. 2013, 89, 44–61. [Google Scholar] [CrossRef]
- Kalamas, M.; Cleveland, M.; Laroche, M. Pro-environmental behaviors for thee but not for me: Green giants, green Gods, and external environmental locus of control. J. Bus. Res. 2014, 67, 12–22. [Google Scholar] [CrossRef]
- Ringle, C.M.; Wende, S.; Becker, J.-M. SmartPLS 3; SmartPLS GmbH: Boenningstedt, Germany, 2015. [Google Scholar]
- Henseler, J.; Hubona, G.; Ray, P.A. Using PLS path modeling in new technology research: updated guidelines. Ind. Manag. Data Syst. 2016, 116, 2–20. [Google Scholar] [CrossRef]
- Hair, J.F.J.; Hult, G.T.M.; Ringle, C.M.; Sarstedt, M. A Primer on Partial Least Squares Structural Equation Modeling (PLS-SEM), 2nd ed.; SAGE Publications, Inc.: Thousand Oaks, CA, USA, 2017; ISBN 9781483377445. [Google Scholar]
- Chin, W.W.; Kim, Y.J.; Lee, G. Testing the Differential Impact of Structural Paths in PLS Analysis: A Bootstrapping Approach. In New Perspectives in Partial Least Squares and Related Methods; Abdi, H., Chin, W.W., Vinzi, V.E., Russolillo, G., Trinchera, L., Eds.; Springer Proceedings in Mathematics & Statistics: New York, NY, USA, 2013; Volume 56, pp. 221–228. [Google Scholar]
- Reinartz, W.; Haenlein, M.; Henseler, J. An empirical comparison of the efficacy of covariance-based and variance-based SEM. Int. J. Res. Mark. 2009, 26, 332–344. [Google Scholar] [CrossRef]
- Roberts, J.A. Green consumers in the 1990s: Profile and implications for advertising. J. Bus. Res. 1996, 36, 217–231. [Google Scholar] [CrossRef]
- Mackenzie, S.B.; Podsakoff, P.M.; Podsakoff, N.P. Construct Measurement and Validation Procedures in MIS and Behavioral Research: Integrating new and existing techniques. MIS Q. 2011, 35, 293–334. [Google Scholar] [CrossRef]
- Franke, G.; Sarstedt, M. Heuristics Versus Statistics in Discriminant Validity Testing: A Comparison of Four Procedures. Available online: https://doi.org/10.1108/IntR-12-2017-0515 (accessed on 10 June 2019).
- Henseler, J.; Ringle, C.M.; Sarstedt, M. A new criterion for assessing discriminant validity in variance-based structural equation modeling. J. Acad. Mark. Sci. 2015, 43, 115–135. [Google Scholar] [CrossRef]
- Cohen, J. A Power Primer. Psychol. Bull. 1992, 112, 155–159. [Google Scholar] [CrossRef] [PubMed]
- Khemlani, D.M.; Dumanig, F.P. National Unity in Multi-Ethnic Malaysia: A Critical Discourse Analysis of Tun Dr. Mahathir’s Political Speeches. J. Chem. Inf. Model. 2013, 53, 1689–1699. [Google Scholar]
- Khor, S. Study: KL Has One of The World’s Least Reliable Public Transportation Systems. Available online: http://says.com/my/news/study-kuala-lumpur-s-public-transportation-system-is-one-of-the-worst-in-the-world (accessed on 10 June 2019).
- Delcea, C.; Cotfas, L.-A.; Trică, C.; Crăciun, L.; Molanescu, A. Modeling the Consumers Opinion Influence in Online Social Media in the Case of Eco-friendly Products. Sustainability 2019, 11, 1796. [Google Scholar] [CrossRef]
- Bedard, S.A.N.; Tolmie, C.R. Millennials’ green consumption behaviour: Exploring the role of social media. Corp. Soc. Responsib. Environ. Manag. 2018, 25, 1388–1396. [Google Scholar] [CrossRef]


| PEB | Description |
|---|---|
| Activist | Activist refers to any public action intended to influence larger populations while protecting the environment, such as involvement in environmental demonstrations and supporting environmental organisations [21]. |
| Avoider | Avoider refers to the boycotting of products that are harmful to the environment and living species, such as avoiding the purchasing of environmentally harmful packaging and avoiding the use of products derived from threatened animal species [14]. |
| Green Consumer | Green Consumer is an ideal citizen who works towards low-profile sustainable development, guided and motivated by moral ethics and confident of making a difference [14]. This type of behaviour includes awareness of and concern for environmental degradation related to the purchase of eco-friendly goods or service [13]. Green Consumers are willing to purchase green products at a premium rather than conventional goods [5,6]. Green Consumers buy green products because they strongly value the environment and believe in the effectiveness of such actions in solving environmental problems. Therefore, Green Consumers always reinforce environmental friendliness as a purchase consideration. |
| Green Passenger | A Green Passenger refers to people who are willing to take public transportation (e.g., buses, KTM, monorails, etc.) and/or reduce the use of passenger vehicles (e.g., carpooling) because they realize the negative impact of greenhouse gas emissions on the environment [14]. This behaviour is engaged in both for personal reasons (e.g., taking the bus to save on petrol costs for a personal car) and public reasons (e.g., taking a monorail to protect the environment from greenhouse gas emissions). The motives of Green Passengers usually include public reasons, which require them to make some type of sacrifice (e.g., convenience). |
| Recycler | Recycler refers to individual who made any effort to deal with recycled or recyclable products [14]. The literature suggests that past recycling behaviours increase recycling knowledge and in turn increase the likelihood of future recycling and shopping behaviours regarding recycled products [14]. Despite past recycling behaviours, this type of behaviour might be influenced by social norms [14]. |
| Utility Saver | Utility Saver refers to individual who performed any action that minimises the use of utilities, such as turning off all lights before leaving home and saving water while washing dishes to preserve the environment [14]. The willingness of individuals to strengthen their effort to save utilities (e.g., electricity) relates positively to their awareness of environmental consequences. |
| Constructs and Sources | Description | Items | Measurement Items |
|---|---|---|---|
| Altruistic Values [1,21,72] | Concerns other people and other living species | AL1 | Equality (Equal opportunity for all) |
| AL2 | A World at Peace (Free of war/conflict) | ||
| AL3 | Social Justice (Correcting injustice, Care for the weak) | ||
| AL4 | Helpful (Helping others) | ||
| AL5 | Loyalty (Faithful to my friends) | ||
| AL6 | Honouring Parents and Elders (Showing respect)) | ||
| Biospheric Values [1] | Concerns the biosphere, environment, and ecosystem | BV1 | Preventing Pollution (Conserving natural resources) |
| BV2 | Respecting the Earth (Harmony with other species) | ||
| BV3 | Unity with Nature (Fitting into nature) | ||
| BV4 | Protecting the Environment (Preserving nature) | ||
| EgoisticValues [1,12,47,49,50] | Promotes short-term desires and long-term interests | EG1 | Influential (Having an impact on people and events) |
| EG2 | Social Power (Control over others, Dominance) | ||
| EG3 | Wealth (Material possessions, Money) | ||
| EG4 | Authority (The right to lead or command) | ||
| Openness to Change [12,21,47,50] | Intermittently and inconsistently so, in a variety of fields related to behaviours | OC1 | Freedom (Freedom of action and thought) |
| OC2 | Creativity (Uniqueness, Imagination) | ||
| OC3 | Independent (Self-reliant, Self-sufficient) | ||
| OC4 | Choosing Own Goals (Selecting one’s own purposes) | ||
| OC5 | Curious (Interested in everything, Exploring) | ||
| OC6 | Self-Respect (Belief in one’s own worth) | ||
| OC7 | An Exciting Life (Stimulating experiences) | ||
| OC8 | A Varied Life (Filled with challenge, novelty, and change) | ||
| OC9 | Daring (Seeking adventure, Risk) | ||
| Awareness of Consequences [16] | One’s consciousness of adverse environmental consequences of certain behaviours and efforts | AC1 | It is certain that global warming is a real problem. |
| AC2 | Global warming is a problem for society. | ||
| AC3 | Energy savings help reduce global warming. | ||
| AC4 | The exhaustion of fossil fuels (i.e., coal, crude oil, natural gas) is a problem. | ||
| AC5 | The exhaustion of energy sources is a problem. | ||
| Ascription of Responsibility [16,73] | One’s own sense of responsibility to minimise negative environmental consequences | AR1 | I feel jointly responsible for the energy problems. |
| AR2 | I feel jointly responsible for the exhaustion of energy sources. | ||
| AR3 | I feel jointly responsible for global warming. | ||
| Personal Norms [73,74] | Feelings of moral obligation for environmental preservation | PN1 | I feel an obligation to buy green products where possible. |
| PN2 | I feel a strong personal obligation to use energy wisely. | ||
| PN3 | I feel a moral obligation to protect the environment. | ||
| PN4 | I feel that I should protect the environment. | ||
| PN5 | I feel it is important that people in general protect the environment. | ||
| PN6 | I feel I must do something to help future generations. | ||
| PN7 | Because of my own values/principles, I feel an obligation to behave in an environmentally friendly way. | ||
| PN8 | I should do what I can to conserve natural resources. | ||
| Social Norms [16,62,74] | Social pressures that an individual experience from significant others or from society at large to engage in a specific behaviour | SN1 | People I know buy green products. |
| SN2 | People I know are concerned about issues related to the environment. | ||
| SN3 | People I know think it is important to buy green products. | ||
| SN4 | People I know recycle those items that can be recycled. | ||
| SN5 | Most people who are important to me think I should purchase green products in place of conventional, non-green products. | ||
| SN6 | Most people who are important to me would want me to purchase green products in place of conventional non-green products. | ||
| SN7 | People whose opinions I value would prefer that I purchase green products in place of conventional non-green products. | ||
| Activist [14,75] | Any public action intended to influence larger populations while protecting the environment | AT1 | Donated money to charities involved in environmental causes (e.g., to protect wild animals)? |
| AT2 | Boycotted products or companies based on their environmental record? | ||
| AT3 | Joined a group that advocates environmental protection? | ||
| AT4 | Signed a petition about an environmental issue? | ||
| AT5 | Took part in a protest or demonstration about an environmental issue? | ||
| AT6 | Volunteered your time for pro-environmental activities? | ||
| AT7 | Ever practiced making own fertilizer at home? | ||
| Avoider [14,75] | Boycotts products that are harmful to the environment and living species | AV1 | It came in an aerosol container? |
| AV2 | It was tested on animals? | ||
| AV3 | It used materials derived from threatened animal species? | ||
| AV4 | Because it causes damage to the environment? | ||
| AV5 | It had environmentally harmful packaging? | ||
| AV6 | It was treated with pesticides? | ||
| Green Consumer [14,75] | Works toward low-profile, sustainable development, guided and motivated by moral principles and with the confidence of making a difference | GC1 | Buy products that come in a refillable container? |
| GC2 | Buy products that are packaged in or made from recycled materials? | ||
| GC3 | Buy products that are certified as being environmentally safe? | ||
| GC4 | Use energy-efficient light bulbs? | ||
| GC5 | Buy food that is organically grown (without pesticides or chemicals)? | ||
| GC6 | Buy products that are biodegradable or that have biodegradable packaging? | ||
| GC7 | Buy products that are produced by environmentally responsible companies? | ||
| GC8 | Use less air-conditioning to save energy? | ||
| GC9 | Purchase energy-efficient home appliances? | ||
| GC10 | I use phosphate-free soaps and detergents. | ||
| GC11 | I use biodegradable soaps/detergents at home. | ||
| GC12 | I reuse office paper (e.g., for notes or printing drafts). | ||
| GC13 | I use biodegradable plastic garbage bags at home. | ||
| GC14 | I never use Styrofoam packaging. | ||
| Green Passenger [14,75] | Willing to take public transportation and/or reduce the use of passenger vehicles | GP1 | Public transportation, such as the bus. |
| GP2 | Public transportation, such as the train (KTM/LRT/MRT/Monorail). | ||
| GP3 | Drive alone to work or school. (R) | ||
| GP4 | Ride your bicycle to work or school. | ||
| GP5 | Carpool (i.e., share a ride with others). | ||
| Recycler [14,75] | Any effort made to deal with recycled or recyclable products | RC1 | Recycle paper and paper products/cardboard? |
| RC2 | Recycle plastic bottles and containers/glass bottles and containers? | ||
| RC3 | Recycle aluminium/tin cans and containers? | ||
| RC4 | Recycle used batteries (i.e., car battery, phone battery, etc.)? | ||
| RC5 | Sort trash for recycling purposes? | ||
| Utility Saver [14,75] | Any action that minimises the use of utilities | US1 | I do not let the water tap run unnecessarily. |
| US2 | I am careful not to waste electricity in my daily activities. | ||
| US3 | I save water when washing my dishes. | ||
| US4 | I save water when I take a bath or a shower. | ||
| US5 | I save water when I wash my hands. | ||
| US6 | I turn off all lights before leaving the house or when they are not needed. |
| Malays (N1 = 307) | Chinese (N2 = 274) | |
|---|---|---|
| Gender | ||
| Male | 88 (28.7%) | 112 (40.9%) |
| Female | 219 (71.3%) | 162 (59.1%) |
| Age | ||
| 18–35 | 241 (78.5%) | 239 (87.2%) |
| 36–56 | 49 (16%) | 34 (12.4%) |
| ≥57 | 17 (5.5%) | 1 (0.4%) |
| Marital Status | ||
| Single | 199 (64.8%) | 206 (75.2%) |
| Married | 108 (35.2%) | 68 (24.8%) |
| Religion | ||
| Muslim | 307 (100%) | 0 |
| Buddhist | 0 | 219 (79.9%) |
| Christian | 0 | 52 (19%) |
| Hindu | 0 | 3 (1.1%) |
| Education | ||
| Diploma/Certificate or lower | 53 (17.3%) | 50 (18.3%) |
| Bachelor’s degree | 224 (73%) | 184 (67.2%) |
| Master’s Degree and/or Doctorate/PhD | 30 (9.8%) | 40 (14.6%) |
| Occupation | ||
| Clerical | 27 (8.8%) | 20 (7.3%) |
| Supervisory | 38 (12.4%) | 26 (9.5%) |
| Management | 81 (26.4%) | 59 (21.5%) |
| Professional | 66 (21.5%) | 90 (32.8%) |
| Self-Employed/Own Business | 34 (11.1%) | 28 (10.2%) |
| Not Working/Retired | 41 (13.4%) | 31 (11.3%) |
| Others | 20 (6.5%) | 20 (7.3%) |
| Monthly Household Income | ||
| <RM4999 | 78 (25.4%) | 152 (55.4%) |
| RM5000–RM10,999 | 140 (45.6%) | 95 (34.7%) |
| RM11,000–RM16,999 | 54 (17.6%) | 19 (6.9%) |
| >RM17,000 | 35 (11.4%) | 8 (2.9%) |
| Pro-Environ-mental Behaviour Formative Constructs | Items | Full sample (n = 581) | Malays (n = 307) | Chinese (n = 274) | ||||||
|---|---|---|---|---|---|---|---|---|---|---|
| Outer Weights (Outer Loadings) | VIF | t-Value | Outer Weights (Outer Loadings) | VIF | t-Value | Outer Weights (Outer Loadings) | VIF | t-Value | ||
| Activist | AT1 | 0.260 (0.730) | 1.68 | 15.09 ** | 0.257 (0.716) | 1.76 | 10.49 ** | 0.268 (0.735) | 1.60 | 10.51 ** |
| AT2 | 0.237 (0.807) | 2.22 | 18.66 ** | 0.214 (0.797) | 2.34 | 13.54 ** | 0.254 (0.810) | 2.11 | 12.86 ** | |
| AT3 | 0.168 (0.841) | 4.03 | 22.09 ** | 0.186 (0.840) | 4.19 | 14.89 ** | 0.158 (0.835) | 3.86 | 15.37 ** | |
| AT4 | −0.178 (0.661) | 2.84 | 11.31 ** | −0.249 (0.626) | 2.76 | 7.47 ** | −0.101 (0.687) | 2.96 | 8.15 ** | |
| AT5 | 0.119 (0.825) | 3.49 | 21.86 ** | 0.095 (0.814) | 3.37 | 13.90 ** | 0.149 (0.835) | 3.65 | 16.04 ** | |
| AT6 | 0.210 (0.860) | 3.61 | 23.29 ** | 0.262 (0.867) | 3.46 | 16.08 ** | 0.133 (0.845) | 3.83 | 15.18 ** | |
| AT7 | 0.369 (0.860) | 2.18 | 24.74 ** | 0.391 (0.869) | 2.28 | 18.64 ** | 0.352 (0.847) | 2.08 | 15.80 ** | |
| Avoider | AV1 | 0.689 (0.928) | 2.32 | 31.74 ** | 0.664 (0.877) | 2.50 | 14.92 ** | 0.689 (0.940) | 2.15 | 22.04 ** |
| AV2 | −0.110 (0.669) | 3.38 | 9.78 ** | −0.331 (0.566) | 3.60 | 5.18 ** | 0.091 (0.735) | 3.18 | 8.37 ** | |
| AV3 | −0.033 (0.679) | 3.94 | 10.20 ** | −0.024 (0.587) | 4.04 | 5.19 ** | −0.098 (0.718) | 3.86 | 8.69 ** | |
| AV4 | 0.668 (0.862) | 4.44 | 21.15 ** | 0.756 (0.821) | 4.13 | 12.36 ** | 0.549 (0.857) | 4.89 | 14.29 ** | |
| AV5 | −0.306 (0.713) | 4.95 | 12.07 ** | −0.546 (0.618) | 4.40 | 6.17 ** | −0.025 (0.765) | 4.85 | 10.44 ** | |
| AV6 | 0.127 (0.777) | 3.79 | 15.11 ** | 0.423 (0.795) | 3.72 | 10.15 ** | −0.131 (0.731) | 3.98 | 9.81 ** | |
| Green Consumer | GC1 | 0.032 (0.597) | 1.67 | 12.70 ** | 0.091 (0.559) | 1.66 | 7.56 ** | −0.032 (0.600) | 1.75 | 9.66 ** |
| GC2 | 0.229 (0.833) | 2.59 | 30.11 ** | 0.138 (0.805) | 2.68 | 19.67 ** | 0.317 (0.839) | 2.62 | 21.24 ** | |
| GC3 | 0.350 (0.880) | 2.77 | 34.97 ** | 0.412 (0.884) | 2.86 | 21.89 ** | 0.263 (0.845) | 2.74 | 22.43 ** | |
| GC4 | 0.032 (0.517) | 1.51 | 9.42 ** | −0.094 (0.471) | 1.64 | 6.01 ** | 0.140 (0.540) | 1.46 | 7.71 ** | |
| GC5 | 0.160 (0.758) | 2.48 | 20.81 ** | 0.228 (0.761) | 2.42 | 14.83 ** | 0.065 (7260) | 2.59 | 12.93 ** | |
| GC7 | 0.004 (0.802) | 3.14 | 24.78 ** | −0.067 (0.768) | 3.02 | 15.27 ** | 0.046 (0.799) | 3.29 | 17.22 ** | |
| GC8 | 0.072 (0.552) | 1.46 | 11.57 ** | 0.137 (0.582) | 1.50 | 8.91 ** | 0.007 (0.510) | 1.49 | 7.16 ** | |
| GC10 | 0.060 (0.694) | 2.64 | 15.20 ** | 0.060 (0.729) | 2.70 | 12.56 ** | 0.080 (0.639) | 2.62 | 9.64 ** | |
| GC11 | 0.065 (0.688) | 2.70 | 16.14 ** | 0.191 (0.754) | 2.98 | 13.39 ** | −0.046 (0.603) | 2.47 | 9.38 ** | |
| GC13 | 0.124 (0.696) | 1.91 | 15.70 ** | 0.126 (0.652) | 2.09 | 8.98 ** | 0.179 (0.721) | 1.87 | 14.00 ** | |
| GC14 | 0.204 (0.635) | 1.63 | 13.62 ** | 0.079 (0.584) | 1.90 | 7.99 ** | 0.320 (0.673) | 1.45 | 11.87 ** | |
| Green Passenger | GP1 | 0.398 (0.714) | 4.00 | 12.63 ** | 0.362 (0.637) | 3.67 | 7.30 ** | 0.444 (0.791) | 4.35 | 11.25 ** |
| GP2 | 0.108 (0.595) | 3.61 | 9.06 ** | 0.098 (0.507) | 3.52 | 5.20 ** | 0.121 (0.682) | 3.68 | 7.80 ** | |
| GP4 | 0.511 (0.884) | 1.66 | 24.54 ** | 0.529 (0.893) | 1.67 | 21.26 ** | 0.470 (0.865) | 1.67 | 13.30 ** | |
| GP5 | 0.305 (0.663) | 1.36 | 11.22 ** | 0.308 (0.668) | 1.40 | 8.648 ** | 0.300 (0.652) | 1.31 | 6.83 ** | |
| Recycler | RC1 | 0.203 (0.635) | 2.27 | 10.62 ** | 0.159 (0.585) | 2.37 | 7.02 ** | 0.257 (0.706) | 2.16 | 8.33 ** |
| RC2 | 0.110 (0.711) | 3.10 | 14.07 ** | 0.202 (0.685) | 2.99 | 10.21 ** | −0.026 (0.744) | 3.28 | 9.64 ** | |
| RC3 | −0.049 (0.632) | 2.88 | 11.15 ** | 0.202 (0.556) | 2.78 | 7.42 ** | 0.145 (0.747) | 3.07 | 9.17 ** | |
| RC4 | 0.429 (0.773) | 1.43 | 17.53 ** | 0.480 (0.800) | 1.41 | 15.65 ** | 0.336 (0.73) | 1.47 | 10.27 ** | |
| RC5 | 0.556 (0.886) | 1.59 | 25.26 ** | 0.534 (0.867) | 1.52 | 18.46 ** | 0.548 (0.885) | 1.70 | 14.51 ** | |
| Utility Saver | US1 | −0.247 (0.459) | 2.30 | 6.17 ** | −0.435 (0.347) | 2.13 | 2.80 ** | 0.005 (0.554) | 2.51 | 6.16 ** |
| US2 | 0.201 (0.674) | 2.71 | 11.41 ** | 0.302 (0.648) | 2.45 | 5.96 ** | −0.009 (0.661) | 3.05 | 8.78 ** | |
| US3 | 0.089 (0.697) | 2.09 | 9.34 ** | 0.231 (0.74) | 2.23 | 4.75 ** | 0.014 (0.651) | 1.93 | 6.96 ** | |
| US4 | 0.403 (0.835) | 2.06 | 15.52 ** | 0.388 (0.805) | 2.16 | 6.76 ** | 0.418 (0.842) | 1.97 | 11.86 ** | |
| US5 | 0.439 (0.873) | 2.24 | 22.47 ** | 0.338 (0.823) | 2.31 | 7.77 ** | 0.492 (0.895) | 2.20 | 18.58 ** | |
| US6 | 0.306 (0.642) | 1.32 | 6.93 ** | 0.313 (0.619) | 1.30 | 3.21 ** | 0.303 (0.667) | 1.40 | 6.27 ** | |
| Constructs | Items | Full Sample (n = 581) | Malays (n = 307) | Chinese (n = 274) | ||||||
|---|---|---|---|---|---|---|---|---|---|---|
| Loadings | AVE | CR | Loadings | AVE | CR | Loadings | AVE | CR | ||
| Altruistic Values | AL1 | 0.811 | 0.655 | 0.905 | 0.801 | 0.640 | 0.899 | 0.818 | 0.663 | 0.908 |
| AL2 | 0.783 | 0.791 | 0.771 | |||||||
| AL3 | 0.822 | 0.794 | 0.836 | |||||||
| AL4 | 0.831 | 0.815 | 0.841 | |||||||
| AL5 | 0.799 | 0.796 | 0.804 | |||||||
| Biospheric Values | BV1 | 0.897 | 0.824 | 0.949 | 0.900 | 0.817 | 0.947 | 0.891 | 0.826 | 0.950 |
| BV2 | 0.926 | 0.921 | 0.930 | |||||||
| BV3 | 0.890 | 0.877 | 0.899 | |||||||
| BV4 | 0.917 | 0.915 | 0.915 | |||||||
| Egoistic Values | EG2 | 0.817 | 0.651 | 0.848 | 0.809 | 0.654 | 0.849 | 0.820 | 0.644 | 0.844 |
| EG3 | 0.746 | 0.732 | 0.750 | |||||||
| EG4 | 0.854 | 0.879 | 0.835 | |||||||
| Openness to | OC5 | 0.733 | 0.620 | 0.891 | 0.701 | 0.593 | 0.879 | 0.758 | 0.646 | 0.901 |
| Change | OC6 | 0.754 | 0.779 | 0.738 | ||||||
| OC7 | 0.814 | 0.802 | 0.823 | |||||||
| OC8 | 0.833 | 0.811 | 0.847 | |||||||
| OC9 | 0.800 | 0.751 | 0.845 | |||||||
| Awareness of | AC1 | 0.846 | 0.669 | 0.910 | 0.838 | 0.660 | 0.907 | 0.852 | 0.670 | 0.910 |
| Consequences | AC2 | 0.853 | 0.830 | 0.870 | ||||||
| AC3 | 0.771 | 0.768 | 0.769 | |||||||
| AC4 | 0.797 | 0.796 | 0.793 | |||||||
| AC5 | 0.820 | 0.830 | 0.805 | |||||||
| Ascription of | AR1 | 0.957 | 0.897 | 0.963 | 0.964 | 0.908 | 0.967 | 0.949 | 0.884 | 0.958 |
| Responsibility | AR2 | 0.948 | 0.953 | 0.941 | ||||||
| AR3 | 0.936 | 0.941 | 0.930 | |||||||
| Personal Norms | PN4 | 0.884 | 0.766 | 0.942 | 0.892 | 0.779 | 0.946 | 0.872 | 0.750 | 0.937 |
| PN5 | 0.851 | 0.866 | 0.837 | |||||||
| PN6 | 0.899 | 0.919 | 0.877 | |||||||
| PN7 | 0.856 | 0.847 | 0.859 | |||||||
| PN8 | 0.886 | 0.887 | 0.883 | |||||||
| Social Norms | SN1 | 0.875 | 0.749 | 0.954 | 0.866 | 0.736 | 0.951 | 0.887 | 0.764 | 0.958 |
| SN2 | 0.866 | 0.855 | 0.878 | |||||||
| SN3 | 0.890 | 0.895 | 0.883 | |||||||
| SN4 | 0.755 | 0.758 | 0.748 | |||||||
| SN5 | 0.898 | 0.896 | 0.899 | |||||||
| SN6 | 0.890 | 0.867 | 0.914 | |||||||
| SN7 | 0.879 | 0.862 | 0.898 | |||||||
| Malays (n = 307) | ||||||||||||
| Mean | SD | CR | AVE | 1 | 2 | 3 | 4 | 5 | 6 | 7 | 8 | |
| 1. AC | 4.058 | 0.133 | 0.907 | 0.660 | ||||||||
| 2. AL | 5.249 | 0.614 | 0.899 | 0.640 | 0.756 | |||||||
| 3. AR | 4.549 | 0.648 | 0.967 | 0.908 | 0.635 | 0.475 | ||||||
| 4. BV | 5.195 | 0.714 | 0.947 | 0.817 | 0.657 | 0.868 | 0.483 | |||||
| 5. EG | 4.673 | 0.570 | 0.849 | 0.654 | 0.502 | 0.579 | 0.531 | 0.509 | ||||
| 6. OC | 4.915 | 0.552 | 0.879 | 0.593 | 0.595 | 0.629 | 0.471 | 0.557 | 0.706 | |||
| 7. PN | 4.684 | 0.704 | 0.946 | 0.779 | 0.723 | 0.605 | 0.694 | 0.641 | 0.503 | 0.555 | ||
| 8. SN | 3.912 | 0.971 | 0.951 | 0.736 | 0.244 | 0.250 | 0.495 | 0.313 | 0.408 | 0.408 | 0.475 | |
| Chinese (n = 274) | ||||||||||||
| 1. AC | 4.774 | 0.644 | 0.910 | 0.670 | ||||||||
| 2. AL | 5.069 | 0.701 | 0.908 | 0.663 | 0.615 | |||||||
| 3. AR | 4.339 | 0.603 | 0.958 | 0.884 | 0.548 | 0.353 | ||||||
| 4. BV | 4.981 | 0.773 | 0.950 | 0.826 | 0.527 | 0.703 | 0.391 | |||||
| 5. EG | 4.616 | 0.633 | 0.844 | 0.644 | 0.287 | 0.289 | 0.236 | 0.246 | ||||
| 6. OC | 4.806 | 0.656 | 0.901 | 0.646 | 0.410 | 0.570 | 0.298 | 0.386 | 0.421 | |||
| 7. PN | 4.480 | 0.744 | 0.937 | 0.750 | 0.604 | 0.449 | 0.574 | 0.528 | 0.232 | 0.406 | ||
| 8. SN | 3.783 | 0.981 | 0.958 | 0.764 | 0.244 | 0.209 | 0.398 | 0.289 | 0.298 | 0.320 | 0.373 | |
| Full Sample (n = 581) | Malays (n = 307) | Chinese (n = 274) | ||||||||||||||||||
|---|---|---|---|---|---|---|---|---|---|---|---|---|---|---|---|---|---|---|---|---|
| Hyp. | Path | Std. Beta | SE | t-Value | Q2 | f2 | Hyp. | Std. Beta | SE | t-Value | Q2 | f2 | Decision | Hyp. | Std. Beta | SE | t-Value | Q2 | f2 | Decision |
| H1 | AL → AC | 0.371 | 0.053 | 6.98 ** | 0.265 | 0.102 | H1a | 0.337 | 0.072 | 4.664 ** | 0.207 | 0.089 | Supported | H1b | 0.424 | 0.081 | 5.224 ** | 0.309 | 0.122 | Supported |
| H2 | BV → AC | 0.208 | 0.051 | 4.063 ** | 0.036 | H2a | 0.218 | 0.071 | 3.074 ** | 0.043 | Supported | H2b | 0.160 | 0.076 | 2.097 * | 0.019 | Supported | |||
| H3 | EG → AC | 0.065 | 0.036 | 1.829 * | 0.006 | H3a | 0.080 | 0.051 | 1.577 | 0.008 | Not Supp. | H3b | 0.033 | 0.049 | 0.667 | 0.001 | Not Supp. | |||
| H4 | OC → AC | 0.128 | 0.037 | 3.510 ** | 0.018 | H4a | 0.089 | 0.053 | 1.691 | 0.009 | Not Supp. | H4b | 0.187 | 0.052 | 3.61 ** | 0.039 | Supported | |||
| H5 | AC → AR | 0.540 | 0.028 | 19.081 ** | 0.249 | 0.411 | H5a | 0.501 | 0.039 | 12.83 ** | 0.216 | 0.335 | Supported | H5b | 0.576 | 0.041 | 14.205 ** | 0.278 | 0.497 | Supported |
| H6 | AR → PN | 0.595 | 0.034 | 17.707 ** | 0.257 | 0.549 | H6a | 0.543 | 0.049 | 11.004 ** | 0.212 | 0.418 | Supported | H6b | 0.647 | 0.043 | 15.056 ** | 0.296 | 0.718 | Supported |
| H7 | PN → AT | −0.006 | 0.044 | 0.128 | 0.218 | 0.000 | H7a | 0.001 | 0.059 | 0.0180 | 0.211 | 0.000 | Not Supp. | H7b | −0.023 | 0.069 | 0.334 | 0.216 | 0.001 | Not Supp. |
| H8 | PN → AV | 0.126 | 0.045 | 2.832 ** | 0.125 | 0.017 | H8a | 0.075 | 0.062 | 1.220 | 0.073 | 0.006 | Not Supp. | H8b | 0.161 | 0.072 | 2.233 * | 0.178 | 0.030 | Supported |
| H9 | PN → GC | 0.188 | 0.045 | 4.194 ** | 0.234 | 0.059 | H9a | 0.121 | 0.068 | 1.778 | 0.220 | 0.025 | Not Supp. | H9b | 0.252 | 0.063 | 3.992 ** | 0.242 | 0.112 | Supported |
| H10 | PN → GP | −0.070 | 0.045 | 1.577 ** | 0.096 | 0.006 | H10a | −0.115 | 0.058 | 1.976 * | 0.090 | 0.016 | Supported | H10b | −0.031 | 0.086 | 0.358 | 0.087 | 0.001 | Not Supp. |
| H11 | PN → RC | 0.298 | 0.048 | 6.172 ** | 0.157 | 0.108 | H11a | 0.257 | 0.069 | 3.713** | 0.155 | 0.086 | Supported | H11b | 0.361 | 0.073 | 4.937 ** | 0.162 | 0.150 | Supported |
| H12 | PN → US | 0.418 | 0.062 | 6.750 ** | 0.124 | 0.199 | H12a | 0.330 | 0.127 | 2.594 ** | 0.090 | 0.123 | Supported | H12b | 0.523 | 0.074 | 7.06 ** | 0.159 | 0.326 | Supported |
| H13 | PN → SN | 0.403 | 0.036 | 11.332 ** | 0.115 | 0.194 | H13a | 0.354 | 0.052 | 6.857 ** | 0.086 | 0.143 | Supported | H13b | 0.445 | 0.050 | 8.904 ** | 0.141 | 0.247 | Supported |
| H14 | SN → AT | 0.609 | 0.032 | 19.076 ** | 0.492 | H14a | 0.605 | 0.041 | 14.762 ** | 0.506 | Supported | H14b | 0.617 | 0.047 | 13.08 ** | 0.484 | Supported | |||
| H15 | SN → AV | 0.418 | 0.040 | 10.574 ** | 0.191 | H15a | 0.410 | 0.052 | 7.818 ** | 0.183 | Supported | H15b | 0.461 | 0.062 | 7.444 ** | 0.245 | Supported | |||
| H16 | SN → GC | 0.610 | 0.036 | 16.778 ** | 0.622 | H16a | 0.643 | 0.047 | 13.789 ** | 0.701 | Supported | H16b | 0.590 | 0.052 | 11.266 ** | 0.613 | Supported | |||
| H17 | SN → GP | 0.523 | 0.035 | 15.086 ** | 0.305 | H17a | 0.554 | 0.045 | 12.457 ** | 0.371 | Supported | H17b | 0.484 | 0.057 | 8.458 ** | 0.242 | Supported | |||
| H18 | SN → RC | 0.365 | 0.046 | 7.890 ** | 0.162 | H18a | 0.430 | 0.066 | 6.526 ** | 0.242 | Supported | H18b | 0.283 | 0.073 | 3.89 ** | 0.092 | Supported | |||
| H19 | SN → US | 0.179 | 0.071 | 2.517 | 0.037 | H19a | 0.248 | 0.130 | 1.904 ** | 0.069 | Not Supp. | H19b | 0.094 | 0.090 | 1.049 | 0.011 | Not Supp. | |||
| Constructs | Configural Invariance (Same Algorithms for Both Groups) | Compositional Invariance (Correlation = 1) | Partial Measurement Invariance Established | Equal Mean Value | Equal Variance | Full Measurement Invariance Established | |||
|---|---|---|---|---|---|---|---|---|---|
| C = 1 | Confidence Interval (CIs) | Differences (M-C) | Confidence Interval (CIs)* | Differences (M-C) | Confidence Interval (CIs) | ||||
| AC | Yes | 1 | (0.999, 1) | Yes | 0.270 | (−0.138, 0.138) | −0.174 | (−0.175, 0.173) | No |
| AL | Yes | 1 | (0.999, 1) | Yes | 0.262 | (−0.134, 0.134) | −0.222 | (−0.182, 0.181) | No |
| AR | Yes | 1 | (1, 1) | Yes | 0.169 | (−0.136, 0.137) | 0.058 | (−0.202, 0.199) | No |
| AT | Yes | 0.992 | (0.899, 1) | Yes | 0.162 | (−0.140, 0.138) | 0.065 | (−0.149, 0.152) | No |
| AV | Yes | 0.920 | (0.872, 1) | Yes | 0.090 | (−0.141, 0.137) | 0.121 | (−0.164, 0.170) | Yes |
| BV | Yes | 1 | (1, 1) | Yes | 0.288 | (−0.135, 0.140) | −0.167 | (−0.178, 0.172) | No |
| EG | Yes | 0.997 | (0.986, 1) | Yes | 0.057 | (−0.135, 0.137) | 0.003 | (−0.172, 0.170) | Yes |
| GC | Yes | 0.945 | (0.918, 1) | Yes | 0.187 | (−0.137, 0.137) | −0.058 | (−0.163, 0.165) | No |
| GP | Yes | 0.987 | (0.895, 1) | Yes | 0.131 | (−0.140, 0.135) | 0.026 | (−0.196, 0.197) | No |
| OC | Yes | 0.997 | (0.995, 1) | Yes | 0.150 | (−0.134, 0.133) | −0.207 | (−0.189, 0.191) | No |
| PN | Yes | 1 | (0.999, 1) | Yes | 0.281 | (−0.136, 0.139) | −0.111 | (−0.169, 0.170) | No |
| RC | Yes | 0.973 | (0.916, 1) | Yes | 0.102 | (−0.138, 0.135) | −0.113 | (−0.180, 0.185) | Yes |
| SN | Yes | 1 | (1, 1) | Yes | 0.132 | (−0.141, 0.138) | −0.019 | (−0.176, 0.178) | No |
| US | Yes | 0.949 | (0.841, 1) | Yes | 0.175 | (−0.137, 0.139) | −0.027 | (−0.196, 0.196) | No |
| Hyp | Relationships | M | C | M | C | M | C | M | C | M | C | Path Coefficient Differences | p-Value b* | Supported | Results | |
|---|---|---|---|---|---|---|---|---|---|---|---|---|---|---|---|---|
| Path Coefficients | Standard Error | t-Values | p-Values a | Confidence Interval (90%) | Henseler MGA | Permutation | ||||||||||
| H1 | AL → AC | 0.337 | 0.424 | 0.07 | 0.08 | 4.85 | 5.06 | p < 0.001 | p < 0.001 | (0.245,0.425) | (0.328,0.533) | −0.086 | 0.786 | 0.216 | NO/NO | M=C |
| H2 | BV → AC | 0.218 | 0.160 | 0.07 | 0.08 | 3.11 | 2.07 | 0.002 | 0.039 | (0.119,0.302) | (0.065,0.257) | 0.058 | 0.291 | 0.306 | NO/NO | M=C |
| H3 | EG → AC | 0.080 | 0.033 | 0.05 | 0.05 | 1.59 | 0.67 | 0.113 | 0.500 | (0.016,0.143) | (−0.034,0.092) | 0.047 | 0.256 | 0.251 | NO/NO | M=C |
| H4 | OC → AC | 0.089 | 0.187 | 0.05 | 0.05 | 1.69 | 3.47 | 0.092 | 0.001 | (0.015,0.151) | (0.115,0.253) | −0.097 | 0.900 | 0.098 | YES/YES | M<C |
| H5 | AC → AR | 0.501 | 0.576 | 0.04 | 0.04 | 12.87 | 14.50 | p < 0.001 | p < 0.001 | (0.452,0.552) | (0.527,0.630) | −0.076 | 0.910 | 0.099 | YES/YES | M<C |
| H6 | AR → PN | 0.543 | 0.647 | 0.05 | 0.04 | 11.03 | 15.43 | p < 0.001 | p < 0.001 | (0.479,0.601) | (0.590,0.699) | −0.104 | 0.946 | 0.053 | YES/YES | M<C |
| H7 | PN → AT | 0.001 | −0.023 | 0.06 | 0.07 | 0.02 | 0.32 | 0.985 | 0.746 | (−0.083,0.073) | (−0.108,0.075) | 0.024 | 0.396 | 0.389 | NO/NO | M=C |
| H8 | PN → AV | 0.075 | 0.161 | 0.06 | 0.08 | 1.22 | 2.15 | 0.225 | 0.032 | (−0.005,0.153) | (0.069,0.247) | −0.086 | 0.811 | 0.158 | NO/NO | M=C |
| H9 | PN → GC | 0.121 | 0.252 | 0.07 | 0.06 | 1.75 | 3.96 | 0.080 | p < 0.001 | (0.030,0.209) | (0.172,0.329) | −0.131 | 0.922 | 0.069 | YES/YES | M<C |
| H10 | PN → GP | −0.115 | −0.031 | 0.06 | 0.09 | 1.99 | 0.34 | 0.047 | 0.736 | (−0.188,−0.035) | (−0.150,0.068) | −0.084 | 0.785 | 0.172 | NO/NO | M=C |
| H11 | PN → RC | 0.257 | 0.361 | 0.07 | 0.07 | 3.69 | 5.07 | p < 0.001 | p < 0.001 | (0.156,0.345) | (0.246,0.434) | −0.104 | 0.858 | 0.139 | NO/NO | M=C |
| H12 | PN → US | 0.330 | 0.523 | 0.13 | 0.08 | 2.62 | 7.00 | 0.009 | p < 0.001 | (0.124,0.451) | (0.397,0.590) | −0.193 | 0.927 | 0.057 | YES/YES | M<C |
| H13 | PN → SN | 0.354 | 0.445 | 0.05 | 0.05 | 7.00 | 8.96 | p < 0.001 | p < 0.001 | (0.275,0.413) | (0.377,0.509) | −0.091 | 0.902 | 0.109 | YES/NO | M<C |
| H14 | SN → AT | 0.605 | 0.617 | 0.04 | 0.05 | 14.83 | 13.03 | p < 0.001 | p < 0.001 | (0.532,0.645) | (0.534,0.664) | −0.012 | 0.577 | 0.426 | NO/NO | M=C |
| H15 | SN → AV | 0.410 | 0.461 | 0.05 | 0.06 | 7.84 | 7.62 | p < 0.001 | p < 0.001 | (0.323,0.458) | (0.358,0.525) | −0.051 | 0.737 | 0.271 | NO/NO | M=C |
| H16 | SN → GC | 0.643 | 0.590 | 0.05 | 0.05 | 13.41 | 11.15 | p < 0.001 | p < 0.001 | (0.552,0.681) | (0.497,0.640) | 0.053 | 0.217 | 0.212 | NO/NO | M=C |
| H17 | SN → GP | 0.554 | 0.484 | 0.04 | 0.06 | 13.00 | 8.18 | p < 0.001 | p < 0.001 | (0.486,0.597) | (0.397,0.545) | 0.070 | 0.172 | 0.152 | NO/NO | M=C |
| H18 | SN → RC | 0.430 | 0.283 | 0.07 | 0.07 | 6.54 | 4.01 | p < 0.001 | p < 0.001 | (0.338,0.509) | (0.188,0.381) | 0.147 | 0.066 | 0.055 | YES/YES | M>C |
| H19 | SN → US | 0.248 | 0.094 | 0.14 | 0.09 | 1.81 | 1.01 | 0.070 | 0.312 | (0.070,0.404) | (−0.015,0.214) | 0.153 | 0.168 | 0.139 | NO/NO | M=C |
| Malays < Chinese | Malays > Chinese |
|---|---|
| Openness to Change → Awareness of Consequences | Social Norms → Recyclers |
| Awareness of Consequences → Ascription of Responsibility | |
| Ascription of Responsibility → Personal Norms | |
| Personal Norms → Social Norms | |
| Personal Norms → Green Consumers | |
| Personal Norms → Utility Savers |
© 2019 by the authors. Licensee MDPI, Basel, Switzerland. This article is an open access article distributed under the terms and conditions of the Creative Commons Attribution (CC BY) license (http://creativecommons.org/licenses/by/4.0/).
Share and Cite
Ghazali, E.M.; Nguyen, B.; Mutum, D.S.; Yap, S.-F. Pro-Environmental Behaviours and Value-Belief-Norm Theory: Assessing Unobserved Heterogeneity of Two Ethnic Groups. Sustainability 2019, 11, 3237. https://doi.org/10.3390/su11123237
Ghazali EM, Nguyen B, Mutum DS, Yap S-F. Pro-Environmental Behaviours and Value-Belief-Norm Theory: Assessing Unobserved Heterogeneity of Two Ethnic Groups. Sustainability. 2019; 11(12):3237. https://doi.org/10.3390/su11123237
Chicago/Turabian StyleGhazali, Ezlika M., Bang Nguyen, Dilip S. Mutum, and Su-Fei Yap. 2019. "Pro-Environmental Behaviours and Value-Belief-Norm Theory: Assessing Unobserved Heterogeneity of Two Ethnic Groups" Sustainability 11, no. 12: 3237. https://doi.org/10.3390/su11123237
APA StyleGhazali, E. M., Nguyen, B., Mutum, D. S., & Yap, S.-F. (2019). Pro-Environmental Behaviours and Value-Belief-Norm Theory: Assessing Unobserved Heterogeneity of Two Ethnic Groups. Sustainability, 11(12), 3237. https://doi.org/10.3390/su11123237