Article

A Sensitive Band to Optimize Winter Wheat Crop Residue Cover Estimation by Eliminating Moisture Effect

1
School of Geography and Ocean Science, Nanjing University, Nanjing 210023, China
2
Jiangsu Center for Collaborative Innovation in Geographical Information Resource Development and Application, Nanjing 210023, China
3
Collaborative Innovation Center of South China Sea Studies, Nanjing University, Nanjing 210023, China
4
Jiangsu Provincial Key Laboratory of Geographic Information Science and Technology, Nanjing University, Nanjing 210023, China
5
Department of Civil and Environmental Engineering, Yonsei University, Seoul 100-744, Korea
*
Authors to whom correspondence should be addressed.
Sustainability 2019, 11(11), 3032; https://doi.org/10.3390/su11113032
Submission received: 14 April 2019 / Revised: 14 May 2019 / Accepted: 21 May 2019 / Published: 29 May 2019
(This article belongs to the Section Sustainable Agriculture)

Abstract

:
Crop residues can retain soil moisture and increase soil organic matter. Crop residue cover is also a hot issue in agricultural remote sensing. Crop residue cover can be estimated linearly with cellulose absorption index (CAI), while moisture of crop residues and soil would reduce the accuracy of crop residue cover estimation. Crop residue and soil were used as materials to carry out the laboratory experiment to reveal the impact of moisture on crop residue cover estimation and eliminate said impact. This paper discovered a sensitive band, R2005, which can invert water content of materials to eliminate moisture effect and improve estimation accuracy of crop residue cover. In terms of inverting water content, compared with two ratio water indices proposed in 2016 (R1.6/R1.5, R1.6/R2.0), using R2005 can increase R2 from 0.828 to 0.935 and decline root-mean-square error (RMSE) from 0.12 to 0.07. At the point of results validation, R2 is 0.958 and RMSE is 0.06, indicating R2005 has a high accuracy. Another advantage of R2005 is that it is more suitable to promote to actual production because of simple and efficient band calculation.

1. Introduction

Crop residues refer to the crop stubble in the cultivated land after harvest. Keeping crop residues in the farmland is one of the best agricultural management measures [1]. Besides reducing the economic cost of removing crop residues, this method also has important ecological implications. A large number of studies have shown that soil organic carbon content in farmland is the basis and guarantee for a high yield of crops [2,3,4,5]. Crop residues remaining in cultivated land play an important role in promoting soil carbon sequestration and improving soil fertility. It has been reported that the soil carbon pool will increase by 8%~35.7% in organic carbon content after maintaining crop residues in the crop land [6,7]. In addition, crop residue can also play a “protective film” role. Crop residues covering the surface can effectively reduce the evapotranspiration of surface water and prevent soil erosion [8,9]. There are other studies, which have shown that the more crop residues left on soil surface, the stronger the ability to regulate soil PH values and inhibit crop diseases [10,11]. In general, crop residue cover on farmland is critical to agricultural development.
Accurate estimation of crop residue cover in farmland has always been an agricultural focus. Remote sensing techniques have been widely used to estimate crop residue cover, and many crop residue indices have been constructed. Zheng et al. [12] used multi-temporal Landsat TM and ETM+ imageries to develop minimum normalized difference tillage index (NDTI) to map crop residue cover commendably. Sullivan et al. [13] found that crop residue cover could be well reflected by differentials in blue and near-infrared bands, and they proposed crop residue cover Index 1 (CRC1). Qi et al. [14] proposed the normalized differential senescent vegetation index (NDSVI) that is based on the normalized differential of TM3 and TM5. Gelder et al. [15] introduced the normalized difference residue index (NDRI) based on TM3 and TM7, the effect of which is better than NDTI with the presence of vegetation. At the same time, they [15] proposed a statistical correction method of green vegetation, based on normalized differential vegetation index (NDVI), to improve the accuracy of crop residue cover estimation. Based on the cellulose absorption valley at 2100 nm, Daughtry et al. [16] proposed cellulose absorption index (CAI), and laboratory data confirmed that CAI could separate soil and crop residues well. Then, lignin cellulose absorption index (LCA) and shortwave infrared normalized difference residue index (SINDRI) based on NASA Terra Advanced Spaceborne Thermal Emission and Reflection Radiometer (ASTER) data were introduced [17,18].
The above crop residue indices can improve the estimation accuracy of crop residue cover while remaining very sensitive to soil background. In order to eliminate the influence of soil background, Biard et al. [19] used TM4 and TM5 bands, added soil line, and proposed soil adjusted corn residue index (SACRI) to reflect the information of crop residue information under low coverage. Bannari et al. [20] used two infrared channels to modify SACRI and proposed modified soil adjusted corn residue index (MSACRI). This index does a better job of weakening the soil background effect. Biard and Baret [21] introduced a linear mixture model, crop residue index multiband (CRIM), which is based on the soil and crop residue line. The model can combine any bands and apply to high or low resolution images for uniform land surfaces.
Moisture factors of crop residues and soil will affect the accuracy of crop residue cover estimation. Since water affects the spectral characteristics of crop residue and soil, and thus the estimation of crop residue cover, it is necessary to eliminate the effects of moisture. In the area of this scientific progress, some studies have used spectral water indices and related crop residue indices. Quemada et al. [22] proposed to use spectral water indices to simulate crop residue and soil moisture and explored the influence of moisture on crop residue cover estimation. The results showed that, among the three narrow-band ratio water indices (R1.6/R1.5, R1.6/R2.0, R2.2/R2.0) and two wide-band ratio water indices (SWIR3/SWIR6, OLI6/OLI7), R1.6/R1.5 and R1.6/R2.0 have better simulation effect on water. The specific information of above water indices is shown in Table 1. Quemada et al. [23] used Worldview-3 images to simulate crop residue cover in the field. Partial irrigation of farmland is needed to complete the comparative experiment. First, the ground objects were classified according to the digital photos taken in the field to obtain the coverage of crop residue. NDTI and SINDRI of dry farmland were calculated by bands calculation of satellite images. The relationships between crop residue cover and NDTI, SINDRI were obtained by linear regression analysis of crop residue cover and indices under dry conditions. For the farmland area with irrigation, the moisture correction model including the water index was used to correct the spectral values of the images. After calculating the corrected NDTI and SINDRI, the researchers substituted the corrected NDTI and SINDRI into the model, which is not affected by moisture, to eliminate the effect caused by moisture.
At present, the existing water indices cannot accurately indicate the water content of crop residue and soil, resulting in a large error in study results. Therefore, a sensitive band was found in this paper, which can simulate the true moisture condition with higher accuracy. Our goal was to invert water content of crop residue and soil precisely to further estimate crop residue cover precisely.

2. Materials and Methods

2.1. Laboratory Experiment

2.1.1. Crop Residue

To study and eliminate impact of moisture on crop residue cover estimation, winter wheat residues and soil collected in Liaocheng City of Shandong province, China, were used as materials to carry out the laboratory experiment. Liaocheng City, which belongs to Huang-Huai-Hai Plain, is the main winter wheat producing area in China.
First, five trays of crop residues were dried until they had a constant mass, which is the dry weight of the crop residues. Then, each crop residue sample was soaked in water overnight. After soaking, the crop residues had reached saturation and could not absorb any more water. The excess water in samples was drained and samples were weighed out to calculate water content. This paper selected relative water content (RWC) as the index to measure the water content [24]. RWC was calculated by Formula (1),
RWC = m f r e s h m d r y m m a x m d r y
where m f r e s h is the sample mass at the time of weighing, m d r y is the dry weight of sample, and m m a x is the saturation weight of sample.
Crop residues reflectance spectra were acquired by ASD spectroradiometer over range of 350–2500 nm. The sampling interval was 1 nm. When the spectral data were obtained, each crop residue sample was placed in a black plastic tray with a depth of 2 cm and a diameter of 10 cm. To avoid external influence, the experiment was conducted in a dark room, and the light sources were quartz-halogen lamps that could provide 1000 W parallel light. The light beam was over the samples at a 45° zenith angle and at the height of 50 cm from samples surface. The zenith angle was set 0°, and vertical distance from samples surface was 30 cm, A fiber-optic probe with a view angle of 5° was arranged to acquire samples’ reflectance spectra. The beam angle and view angle were set to minimize shadows and highlight the spectral characteristics of samples. Four spectra of five scans each were required by rotating the sample tray 90° after each measurement to reduce specular reflection that might exist in a laboratory experiment. Before each spectra acquisition, a Spectralon reference panel was needed to be placed in the field of view, illuminated, and measured in the same manner as the samples.
To slow the rate of moisture loss, crop residue samples were placed at room temperature to be dried. The samples were weighed out and the reflectance spectra were acquired at 2 h intervals until the mass of samples was close to dry weight. Before the end of experiment, when the samples were dried to lose all water again, final weighing and reflectance collection were carried out.

2.1.2. Soil

In order to ensure the uniformity of soil particles and prevent the influence of particle size on spectral data, the soil samples should be fully ground before the experiment. In accordance with the crop residues, five trays of soil were prepared as experimental materials. The soil samples were dried to obtain dry weight, then soaked overnight to allow the soil and water to mix well, filtered for excess water, and weighed. When the ASD spectroradiometer was used to obtain spectral data, the soil samples were placed in pure black plastic trays with depth of 2 cm and diameter of 10 cm. The times of soil spectral measurements and weighing were consistent with crop residue. Measurement methods were strictly taken according to crop residue samples data acquisition standards. The flow chart of the laboratory experiment is shown in Figure 1.

2.2. Data Processing

2.2.1. Preprocessing

ViewSpecPro 6.0 software was used to process the spectral data. We visually judged and deleted the spectral curve with the largest difference of each sample datum and took the mean value of the remaining spectral curves. In order to eliminate the noise interference, the Savitzky–Golay filter is used to smooth the graph to get the final result.

2.2.2. Spectra and RWC Data Processing

In practice, the crop residues could not cover all the farmland, so the collected reflectance in the field was affected by both soil reflectance and crop residues reflectance. In this paper, the reflectance of actual crop residues in farmland was simulated by a linear combination of crop residues spectra and soil spectra. The applicated function is shown in Formula (2) [22,25],
ρ ( M , λ ) =   ρ ( S , λ ) ( 1 f R ) + ρ ( R , λ ) ( f R )
where ρ ( M , λ ) is the simulated reflectance of the actual crop residue in farmland in λ band, which can be regarded as the true spectral value; ρ ( S , λ ) is the reflectance of soil in λ band; ρ ( R , λ ) is the reflectance of crop residues in λ band; fR is the assumed value of crop residue cover and can be regarded as true observation value of coverage. fR in this study was acquired randomly by an algorithm.
For RWC data processing, like spectral data, the method of linear combination of the RWC of crop residues and the RWC of soil obtained with weighing method was also adopted to simulate the overall RWC of crop residues in the field. The Formula is (3) [22],
RWC m = RWC S ( 1 f R ) + RWC R ( f R )
where RWCm is the overall water content of crop residues under simulated field condition, which can be regarded as the true value collected in field; RWCS is the RWC of soil; and RWCR is the RWC of crop residues. fR is the assumed value of crop residue cover and can be regarded as true observation value of coverage. In the case of linear combination of spectral reflectance and RWC of crop residues and soil, in order to fully simulate the field conditions, the time of moisture reception and air drying for crop residues and soil should be consistent. Therefore, only the crop residue and soil data measured at the same time should be combined. The fR of Formulas (2) and (3) should be consistent when the spectral data and RWC data acquired are combined linearly.

2.3. Data Analysis Method

2.3.1. Crop Residue Cover Estimation Method

CAI, constructed based on hyperspectral data, was selected to establish the correlation with crop residue cover, and the equation of CAI was expressed as Equation (4) [22],
CAI = 100 ( 0.5 ( R 2.0 + R 2.2 ) R 2.1 )
where R2.0, R2.1 and R2.2 are the reflectance of 10 nm bands centered at 2030 nm, 2100 nm, and 2210 nm, respectively. The relationship between CAI and crop residue cover was determined by unitary regression analysis. The essential function of CAI is to reflect the absorption intensity of crop residues spectra at 2100 nm or to roughly calculate the depth of the absorption valley at 2100 nm, which is the absorption characteristic position caused by the large amount of cellulose in crop residues. Therefore, there was a strong correlation between CAI and crop residue cover. The reason why spectral reflectance at 2000 nm was not selected is that carbon dioxide in the atmosphere has a narrow absorption valley at 2010 nm. Application of spectral data at 2030 nm can minimize the influence of the atmosphere [18].

2.3.2. Improvements to Crop Residue Cover Estimation Model

It had been proved that CAI and crop residue cover were linearly correlated, and crop residue cover can be estimated by a linear model with CAI [18,22,25,26]. But RWC of crop residues and soil influenced the slope and intercept of the function of the model [22,26]. There were different slopes and intercepts under varied RWC. If we want to estimate crop residue cover accurately, slopes and intercepts under varied RWC must be acquired. The relationship between the RWC, the slope, and the intercept of the model were analyzed by regression methods.

2.3.3. Sensitivity Analysis of RWC and Reflectance

This research calculated the sensitivity of the RWCm and the R ( M , λ ) over the range of 350–2500 nm to determine the sensitive band. The reflectance of the sensitive band was affected by moisture and could invert moisture.

2.3.4. RWC Inversion by Water Indices and Sensitive Band

The RWC of the soil and crop residue samples were calculated by weighing method. The simulated field moisture was obtained by linear combination of the RWC of the soil and crop residue samples. However, these methods cannot be extended to the field, so we needed to use remote sensing means to achieve the RWC simulation. A study used ratio water indices to indicate RWC in 2016 [22]. This paper also detected a sensitive band to invert RWC. The water indices proposed in 2016 [22] were compared with the sensitive band to verify the RWC inversion effects of the sensitive band.

2.4. Validation

In order to further verify the accuracy of the model, 70 sample points were selected for model validation in this paper. First, CAI can be calculated by spectral data, and the RWCm of the two kinds of samples was inverted by water indices and the sensitive band. Second, the slope and intercept of crop residue cover estimation model were calculated under different moisture conditions. Finally, the crop residue cover was simulated by the crop residue cover estimation model. The three estimation results, which improved by two water indices and the sensitive band, were compared with the true crop residue cover obtained randomly through the algorithm.

3. Results

3.1. Analysis of Crop Residues and Soil Spectra

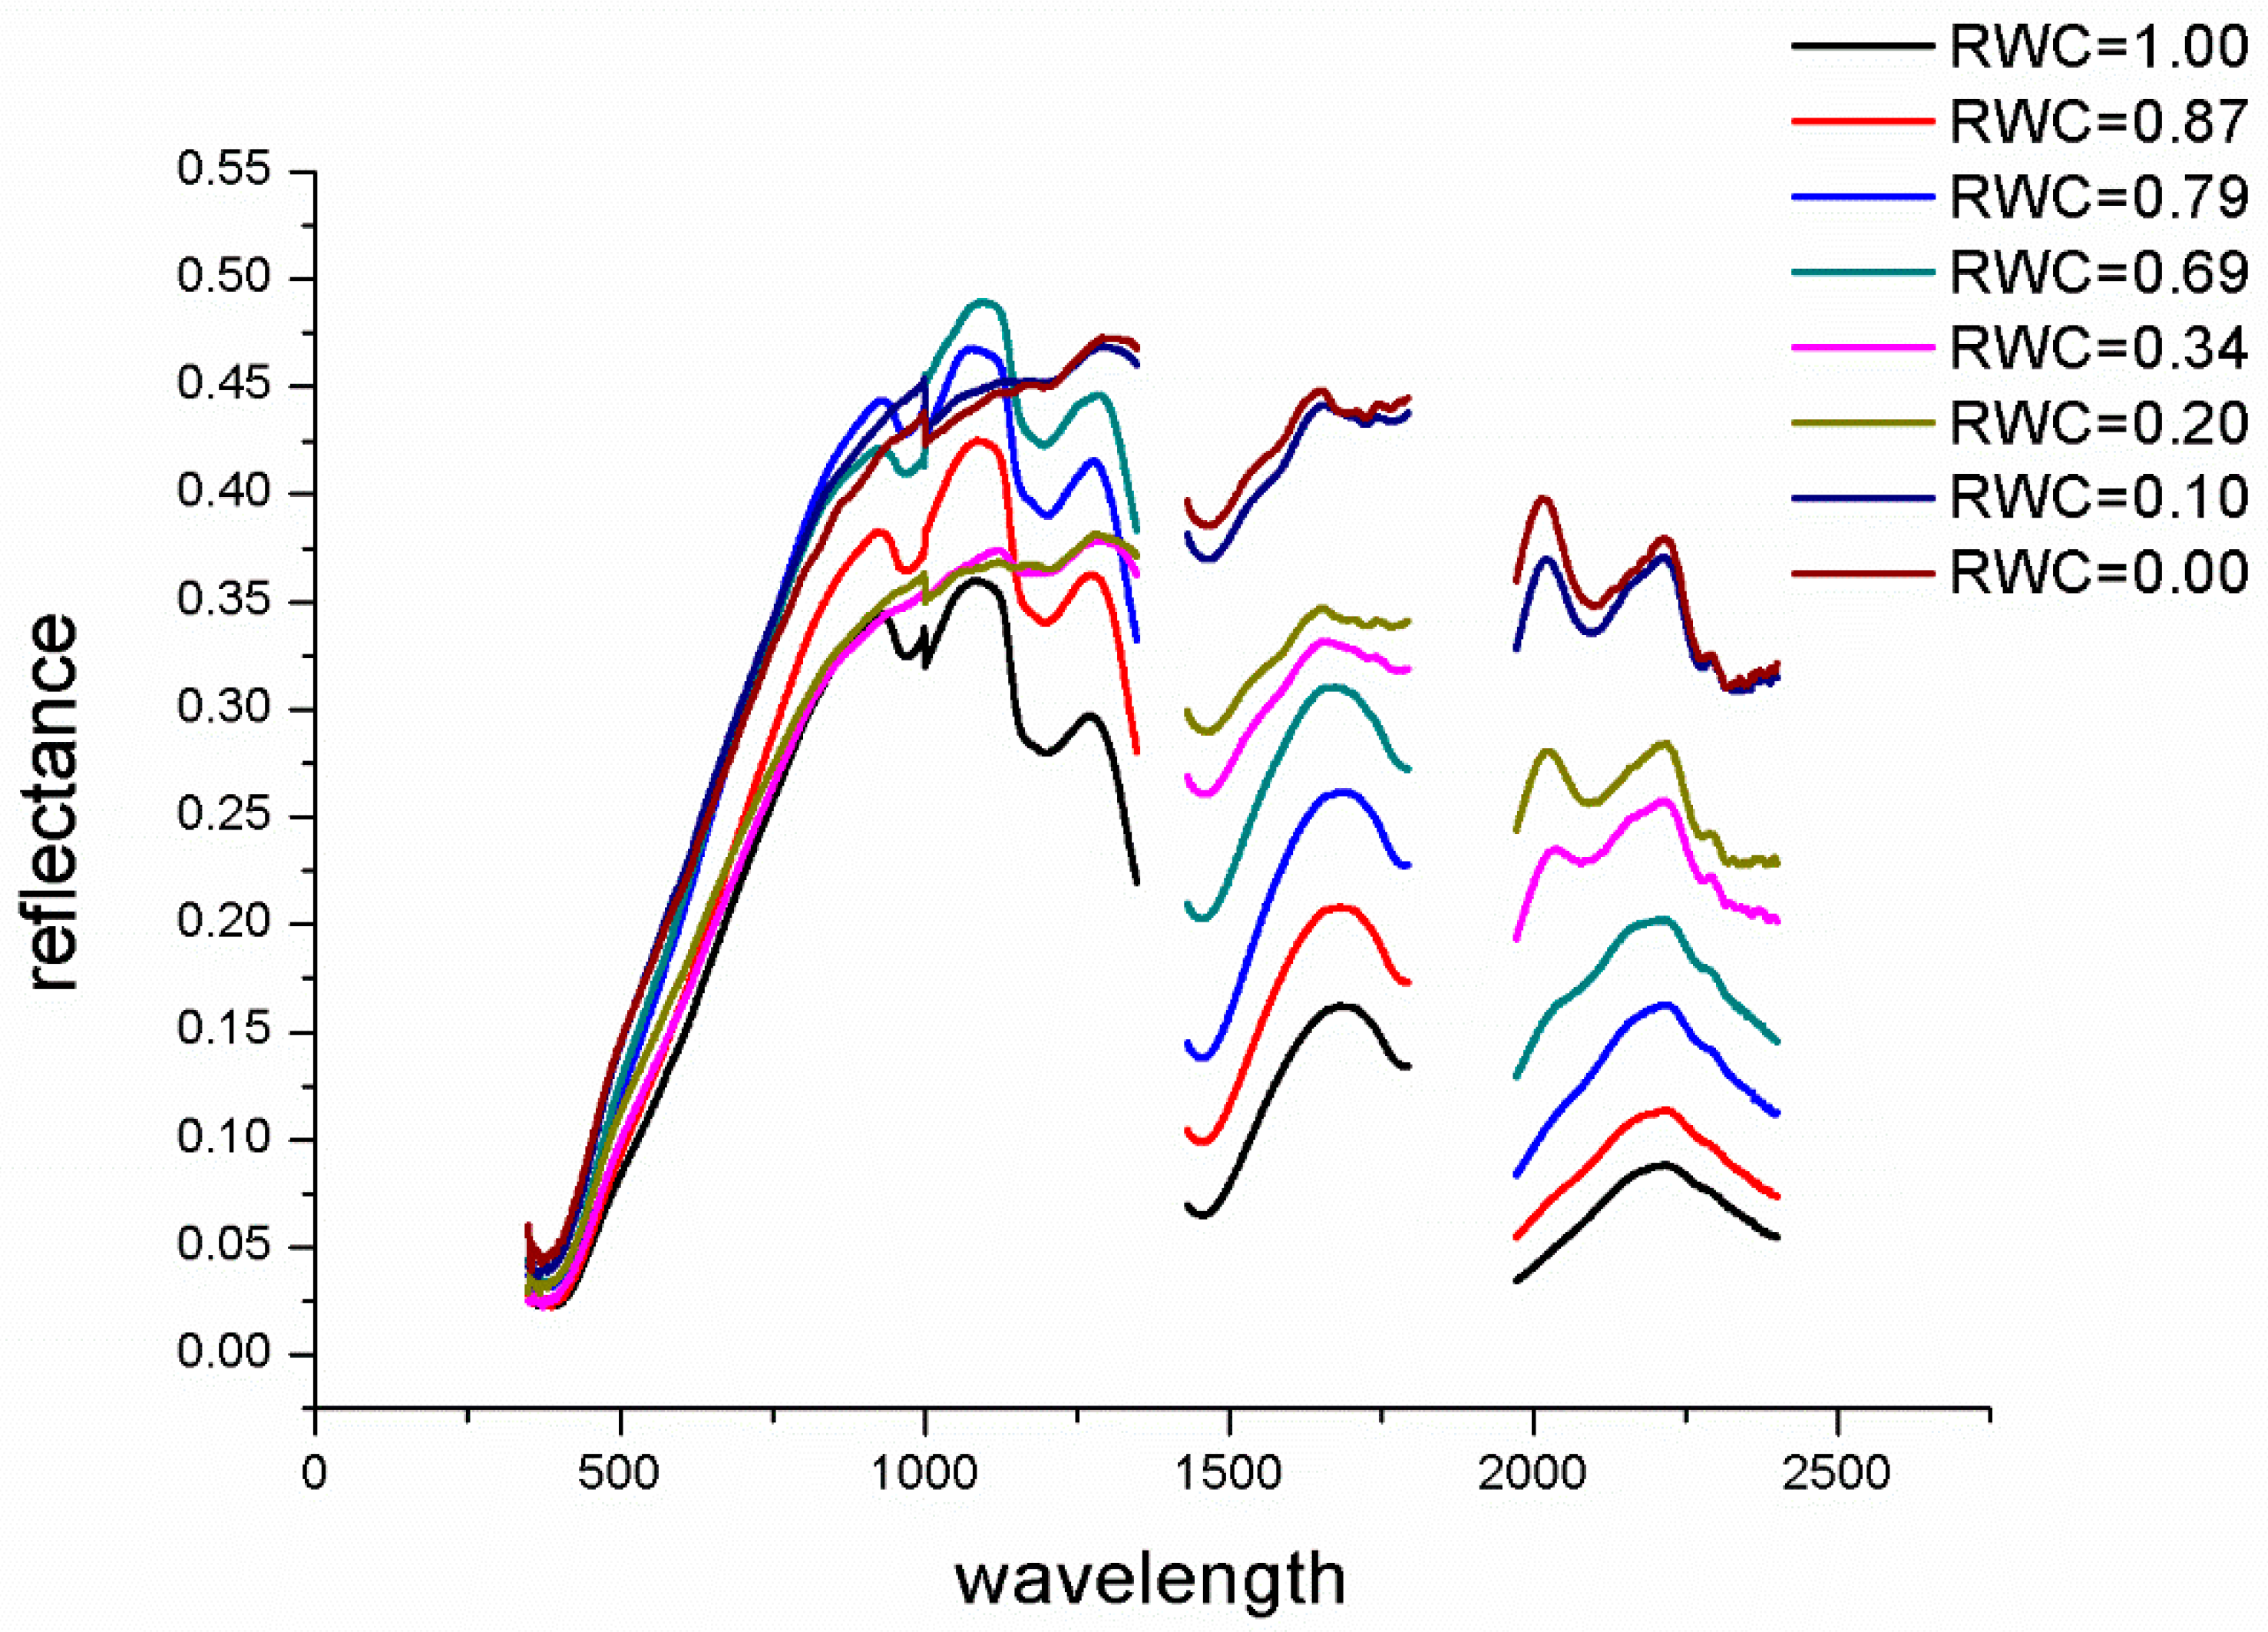
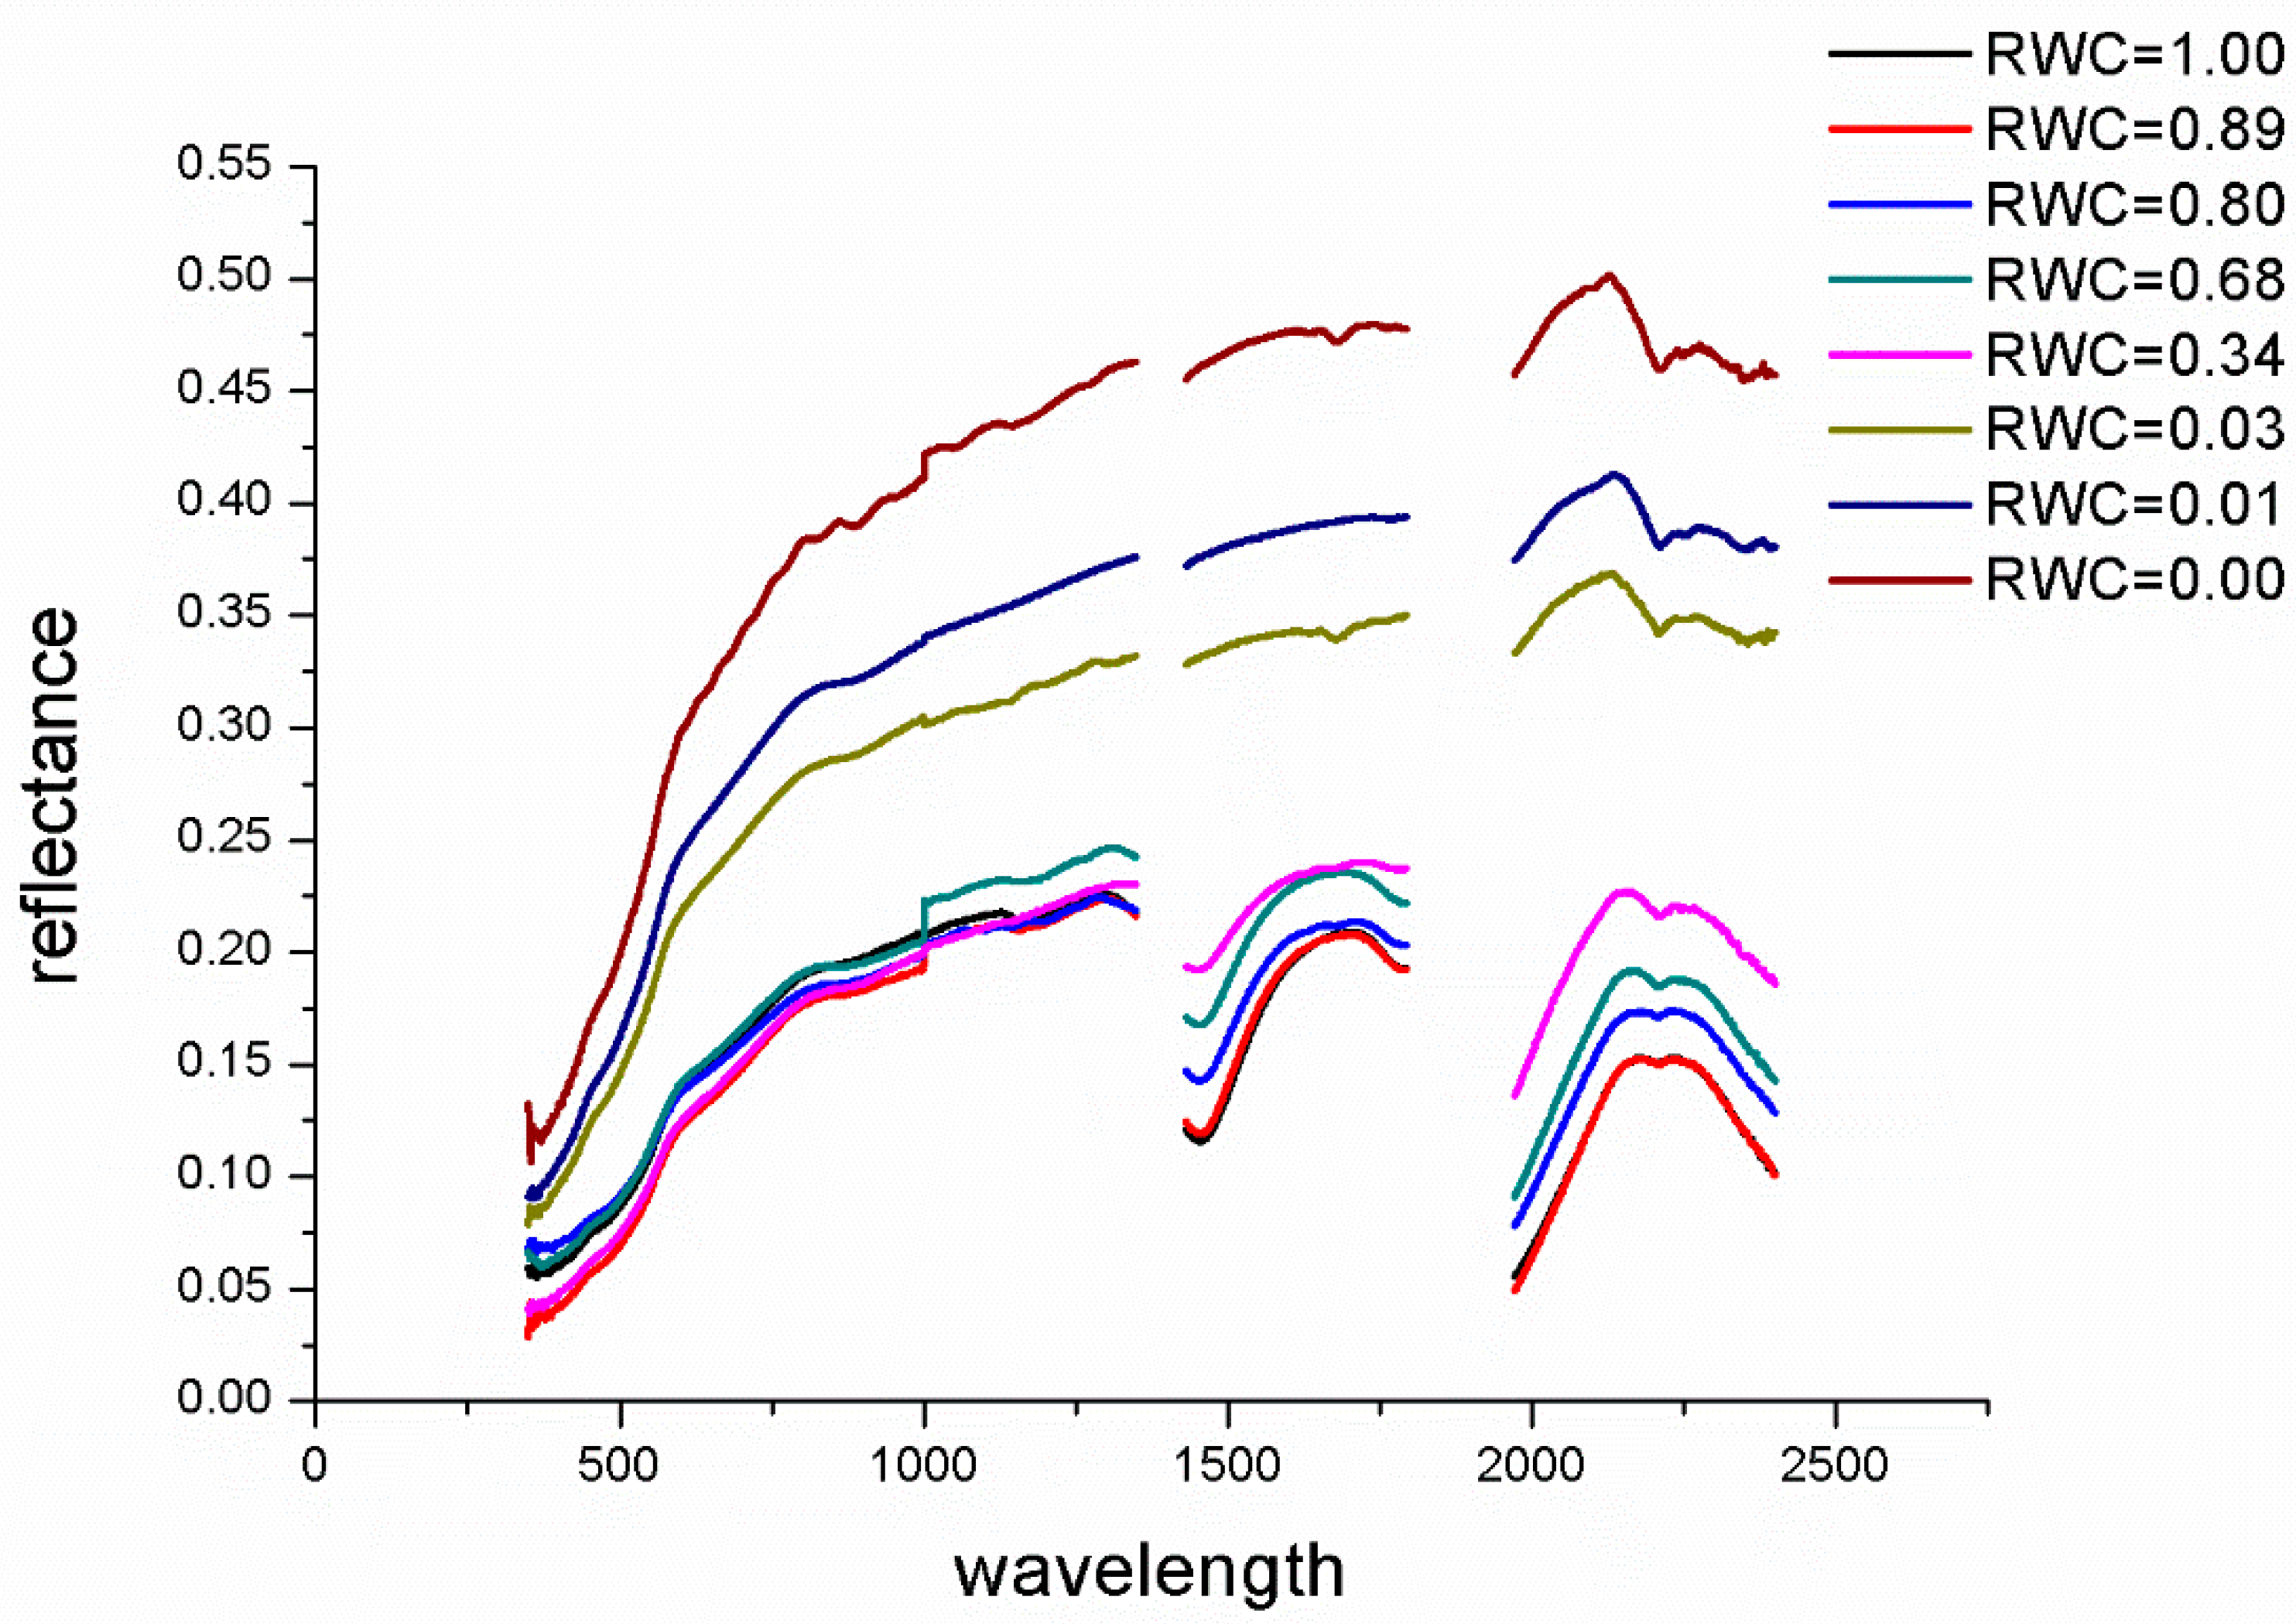
In total, we acquired spectral data eight times under different moisture conditions. The spectra of crop residues and soil samples are shown in Figure 2 and Figure 3. The gaps are spectral reflectance at 1350–1430 nm, 1795–1970 nm and 2400–2500 nm. The spectral values in these three ranges would be affected by the moisture in the air that would produce noise, which would affect the spectral characteristics of the samples. Therefore, these parts of the spectral value were deleted.
As can be seen from Figure 2, the total spectral values of crop residue samples decreased with the increase of moisture. Moreover, as the wavelength increased, the spectral difference caused by moisture increased, which was because the absorption intensity of water in the infrared band is greater than that in the visible bands. When the moisture of crop residue increased, some of its spectral characteristics also disappeared, and the curves became more and more gentle. For example, the absorption intensity of cellulose at 2100 nm gradually weakened and disappeared when the overall spectral reflectance dropped. In the ranges of 1700–1795 nm and 2280–2400 nm, the spectral curves of crop residue with low moisture had zigzag features, while in the case of high moisture, the “zigzag” of the spectral curves disappeared, and smooth spectral features were presented. However, under any moisture condition, the high reflection peaks at 1640 nm and 2210 nm always existed, and the higher the RWC, the more obvious the peak characteristics.
Figure 3 is the spectral characteristic curves of soil samples under different moisture conditions. Similar to crop residues, the higher the RWC, the lower the total spectral reflectance of the soil. Since the crop residue samples and soil samples were weighed and their spectra were collected at the same time, it can be seen that the rate of water evaporation of crop residue and soil were roughly the same when the moisture was high. While at the later stage of drying, the rate of soil water loss was significantly higher than that of crop residues, and a similar situation has occurred in another study [22]. The absorption valley at 2200 nm in the dry soil spectra was caused by the stretching vibration of hydroxyl (−OH) molecule of silicate water [27]. When the RWC increased, the absorption characteristic at 2200 nm became very weak. However, when the RWC increased, the strong absorption characteristics of the water at 1450 nm and 1960 nm will make the soil have a very obvious peak value in the range of short-wave infrared (1600~1780 nm), which can be used as the basis to roughly judge the soil water content [22]. In addition, excessive water also caused a significant single-peak phenomenon in the range of 2100–2330 nm of the soil spectra.

3.2. Crop Residue Cover Estimation Model and Moisture Effect

In this paper, the actual mixed reflectance of crop residues and soil under different coverages were not collected in the field. Instead, the individual spectral reflectance of crop residues and soil were acquired in the laboratory, and the actual spectral values in the field were simulated by linear combination. Under different moisture conditions, the relationships between spectral reflectance and CAI is shown in Figure 4.
In Figure 4, the abscissa is CAI, and the ordinate is the crop residue cover obtained randomly. The legend represented different moisture conditions, and the straight line was the unitary regression line of CAI and crop residue cover. It was clear that CAI and crop residue cover had a significant linear relationship with any moisture. Therefore, a linear model including CAI can be used to simulate crop residue cover. The slope and the intercept remained positive. While the RWC varies, the slope and intercept of the linear model are different. As the RWC increases, the slope and intercept increase, which means that moisture would result in overestimation of crop residue cover. The influence of moisture on crop residue cover estimation can be determined and eliminated by finding the relationships between the RWC, slope, and intercept.

3.3. Inversion of the Slope and Intercept of Model

Obviously, there were different slopes and intercepts under varied RWC. Regression analyses were conducted on the RWC and the slope, the intercept of the model. The results are shown in Figure 5 and Figure 6.
There were definite functional relationships between the RWC, the slope, and the intercept of the model. RWC and slope conformed to a single exponential decay relationship. RWC was linearly dependent on the intercept. The specific functional relationships are shown in Table 2.

3.4. Sensitivity Analysis of RWC and Reflectance

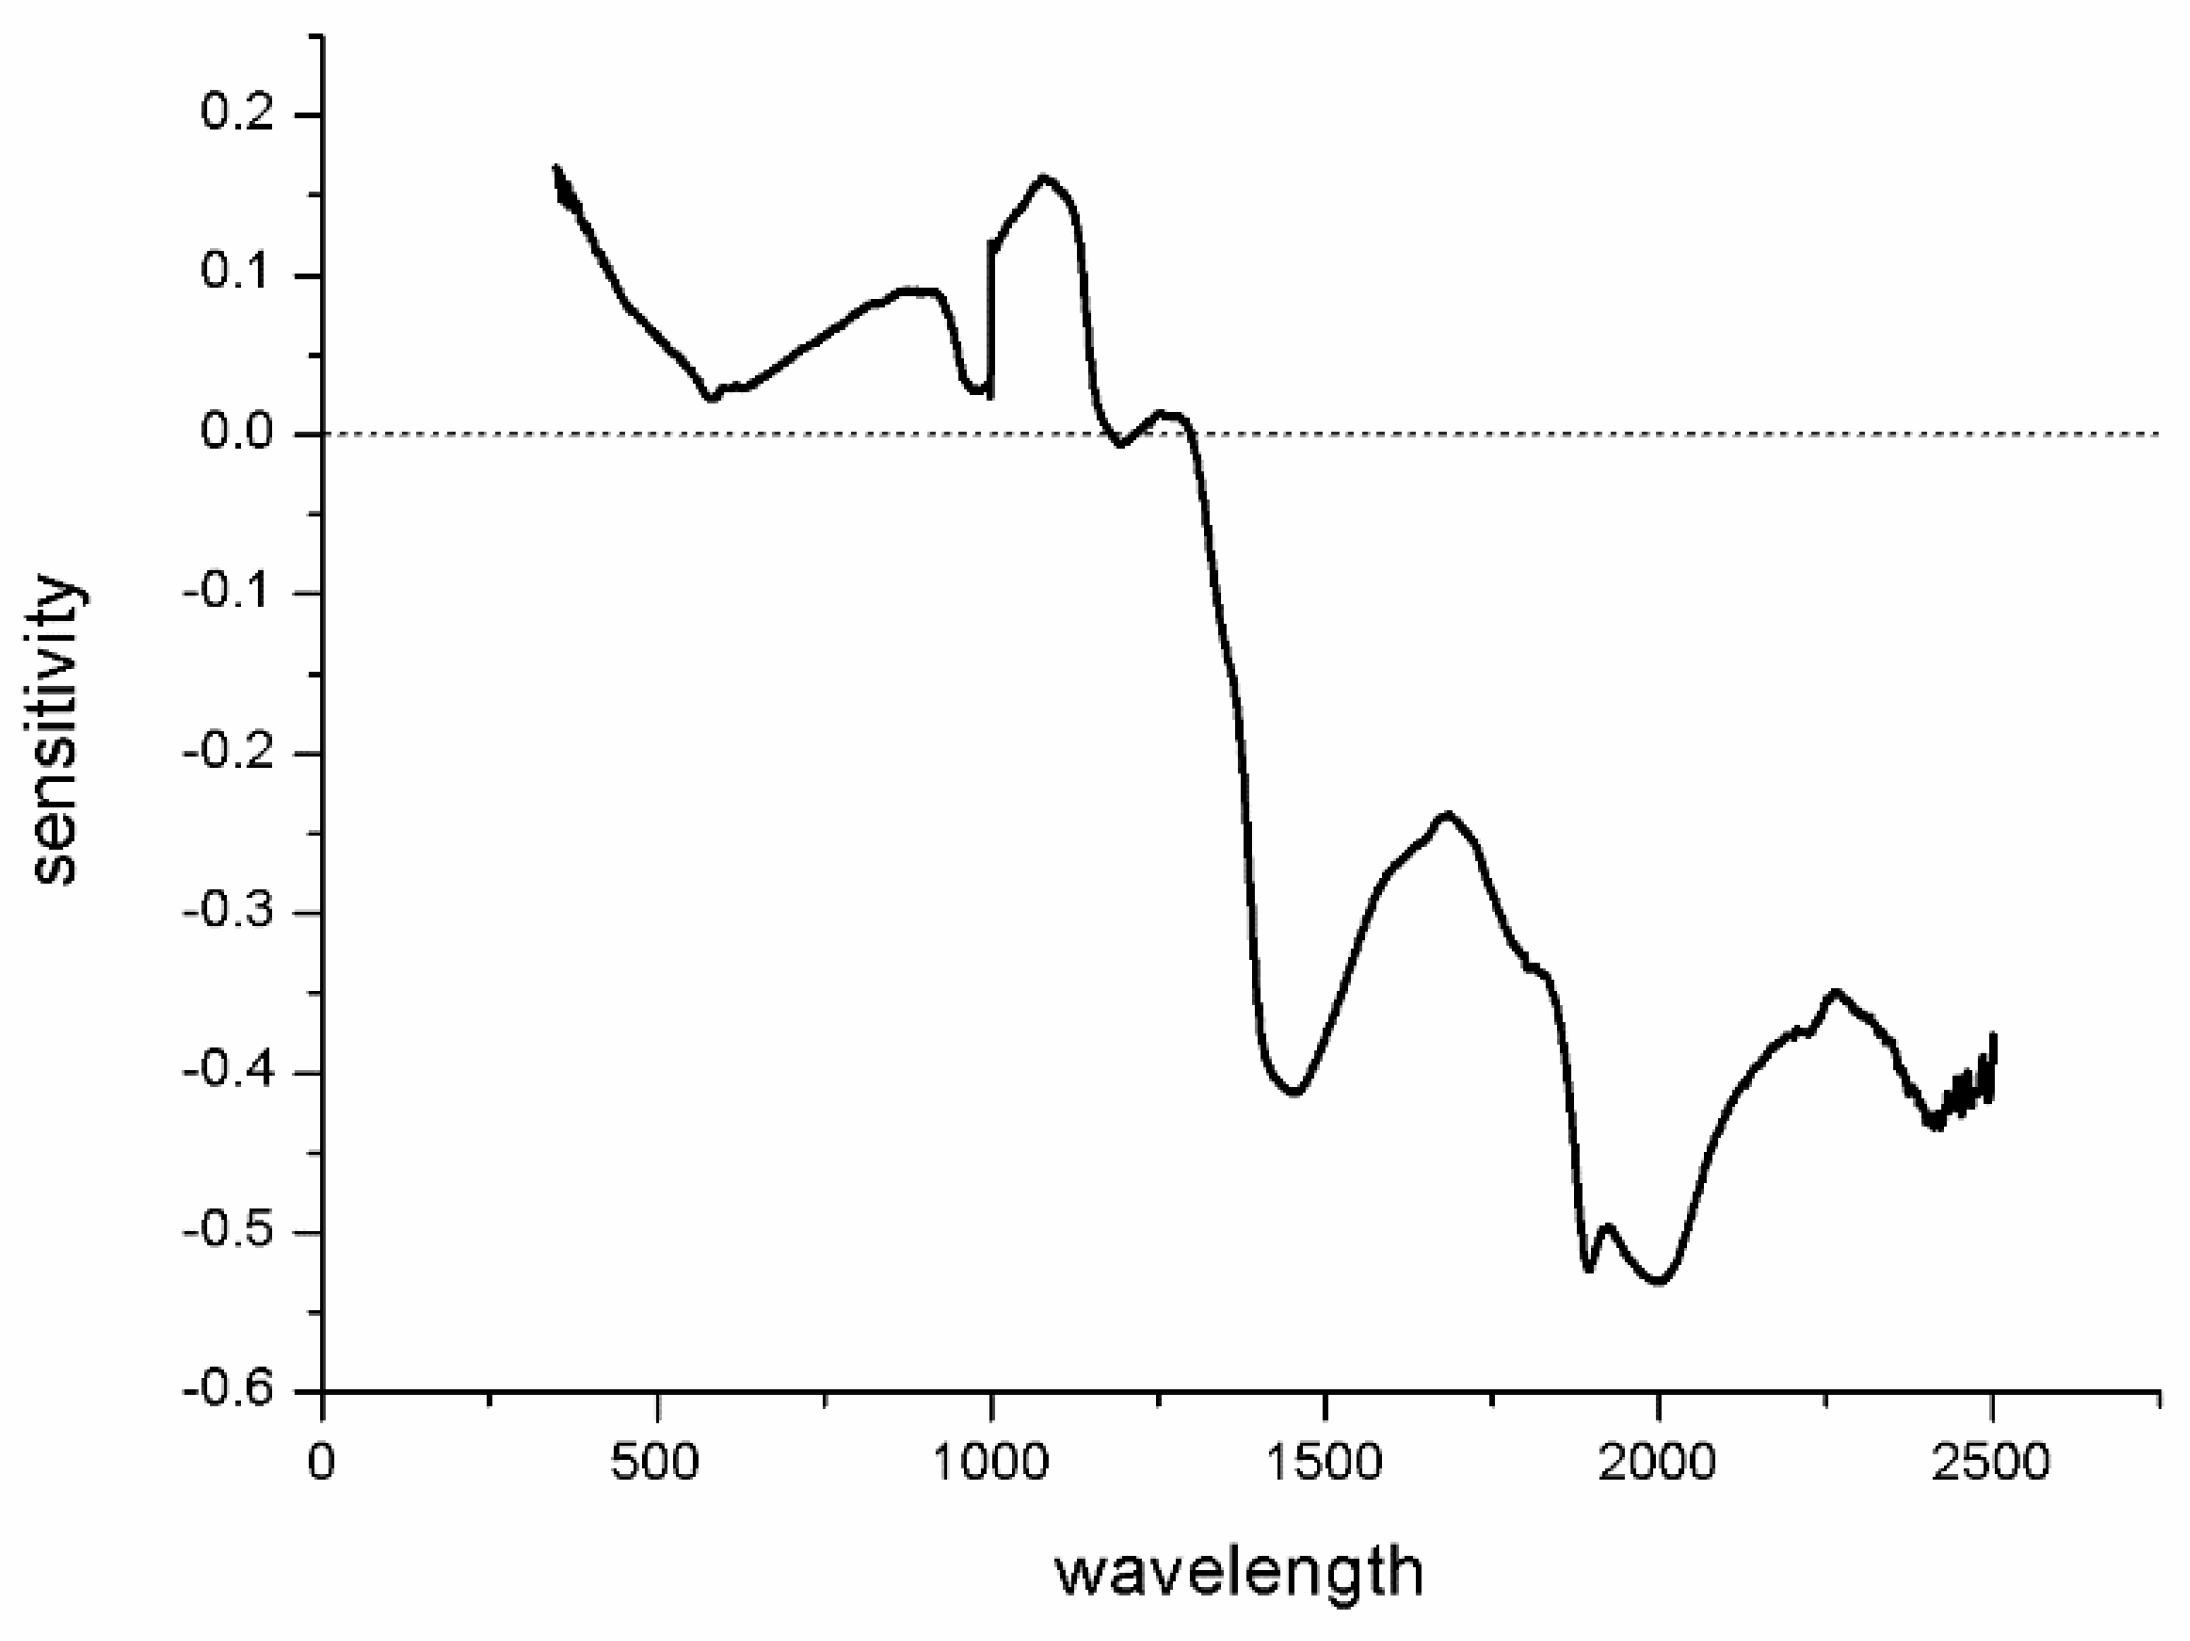
In this paper, correlation analysis was conducted between the RWC and spectral reflectance to determine the sensitive band, and the results are shown in Figure 7.
There was no obvious regular correlation between RWC and spectral values in the whole range. Spectral values of the band range from 350 nm to 1180 nm are positively correlated with RWC, but correlation coefficients, which were less than 0.2, were generally small. The correlation coefficients at 350 nm and 1070 nm were relatively high, and were almost irrelevant around 580 nm. Therefore, the wavelength ranges that were less than 1180 nm had little significance for the inversion of RWC. There were negative correlations between sample reflectance and RWC from 1300 nm to 2500 nm. There were strong correlations at 1460 nm, 1900 nm, 2005 nm, and 2420 nm, and the absolute values of the correlation coefficients were significantly higher than those of the adjacent bands. The spectral reflectance of 2005 nm band is the most correlated, close to 0.6. Therefore, this single-band spectral reflectance was used as the basis for the inversion of RWC. The selected sensitive band was centered at 2005 nm with a 10 nm width (R2005). In order to verify the accuracy of this sensitive band, two proposed water indices were chosen in this paper for reference and comparison. The specific information of each water index and the sensitive band is shown in Table 3.

3.5. Inversion of RWC of Soil and Crop Residue

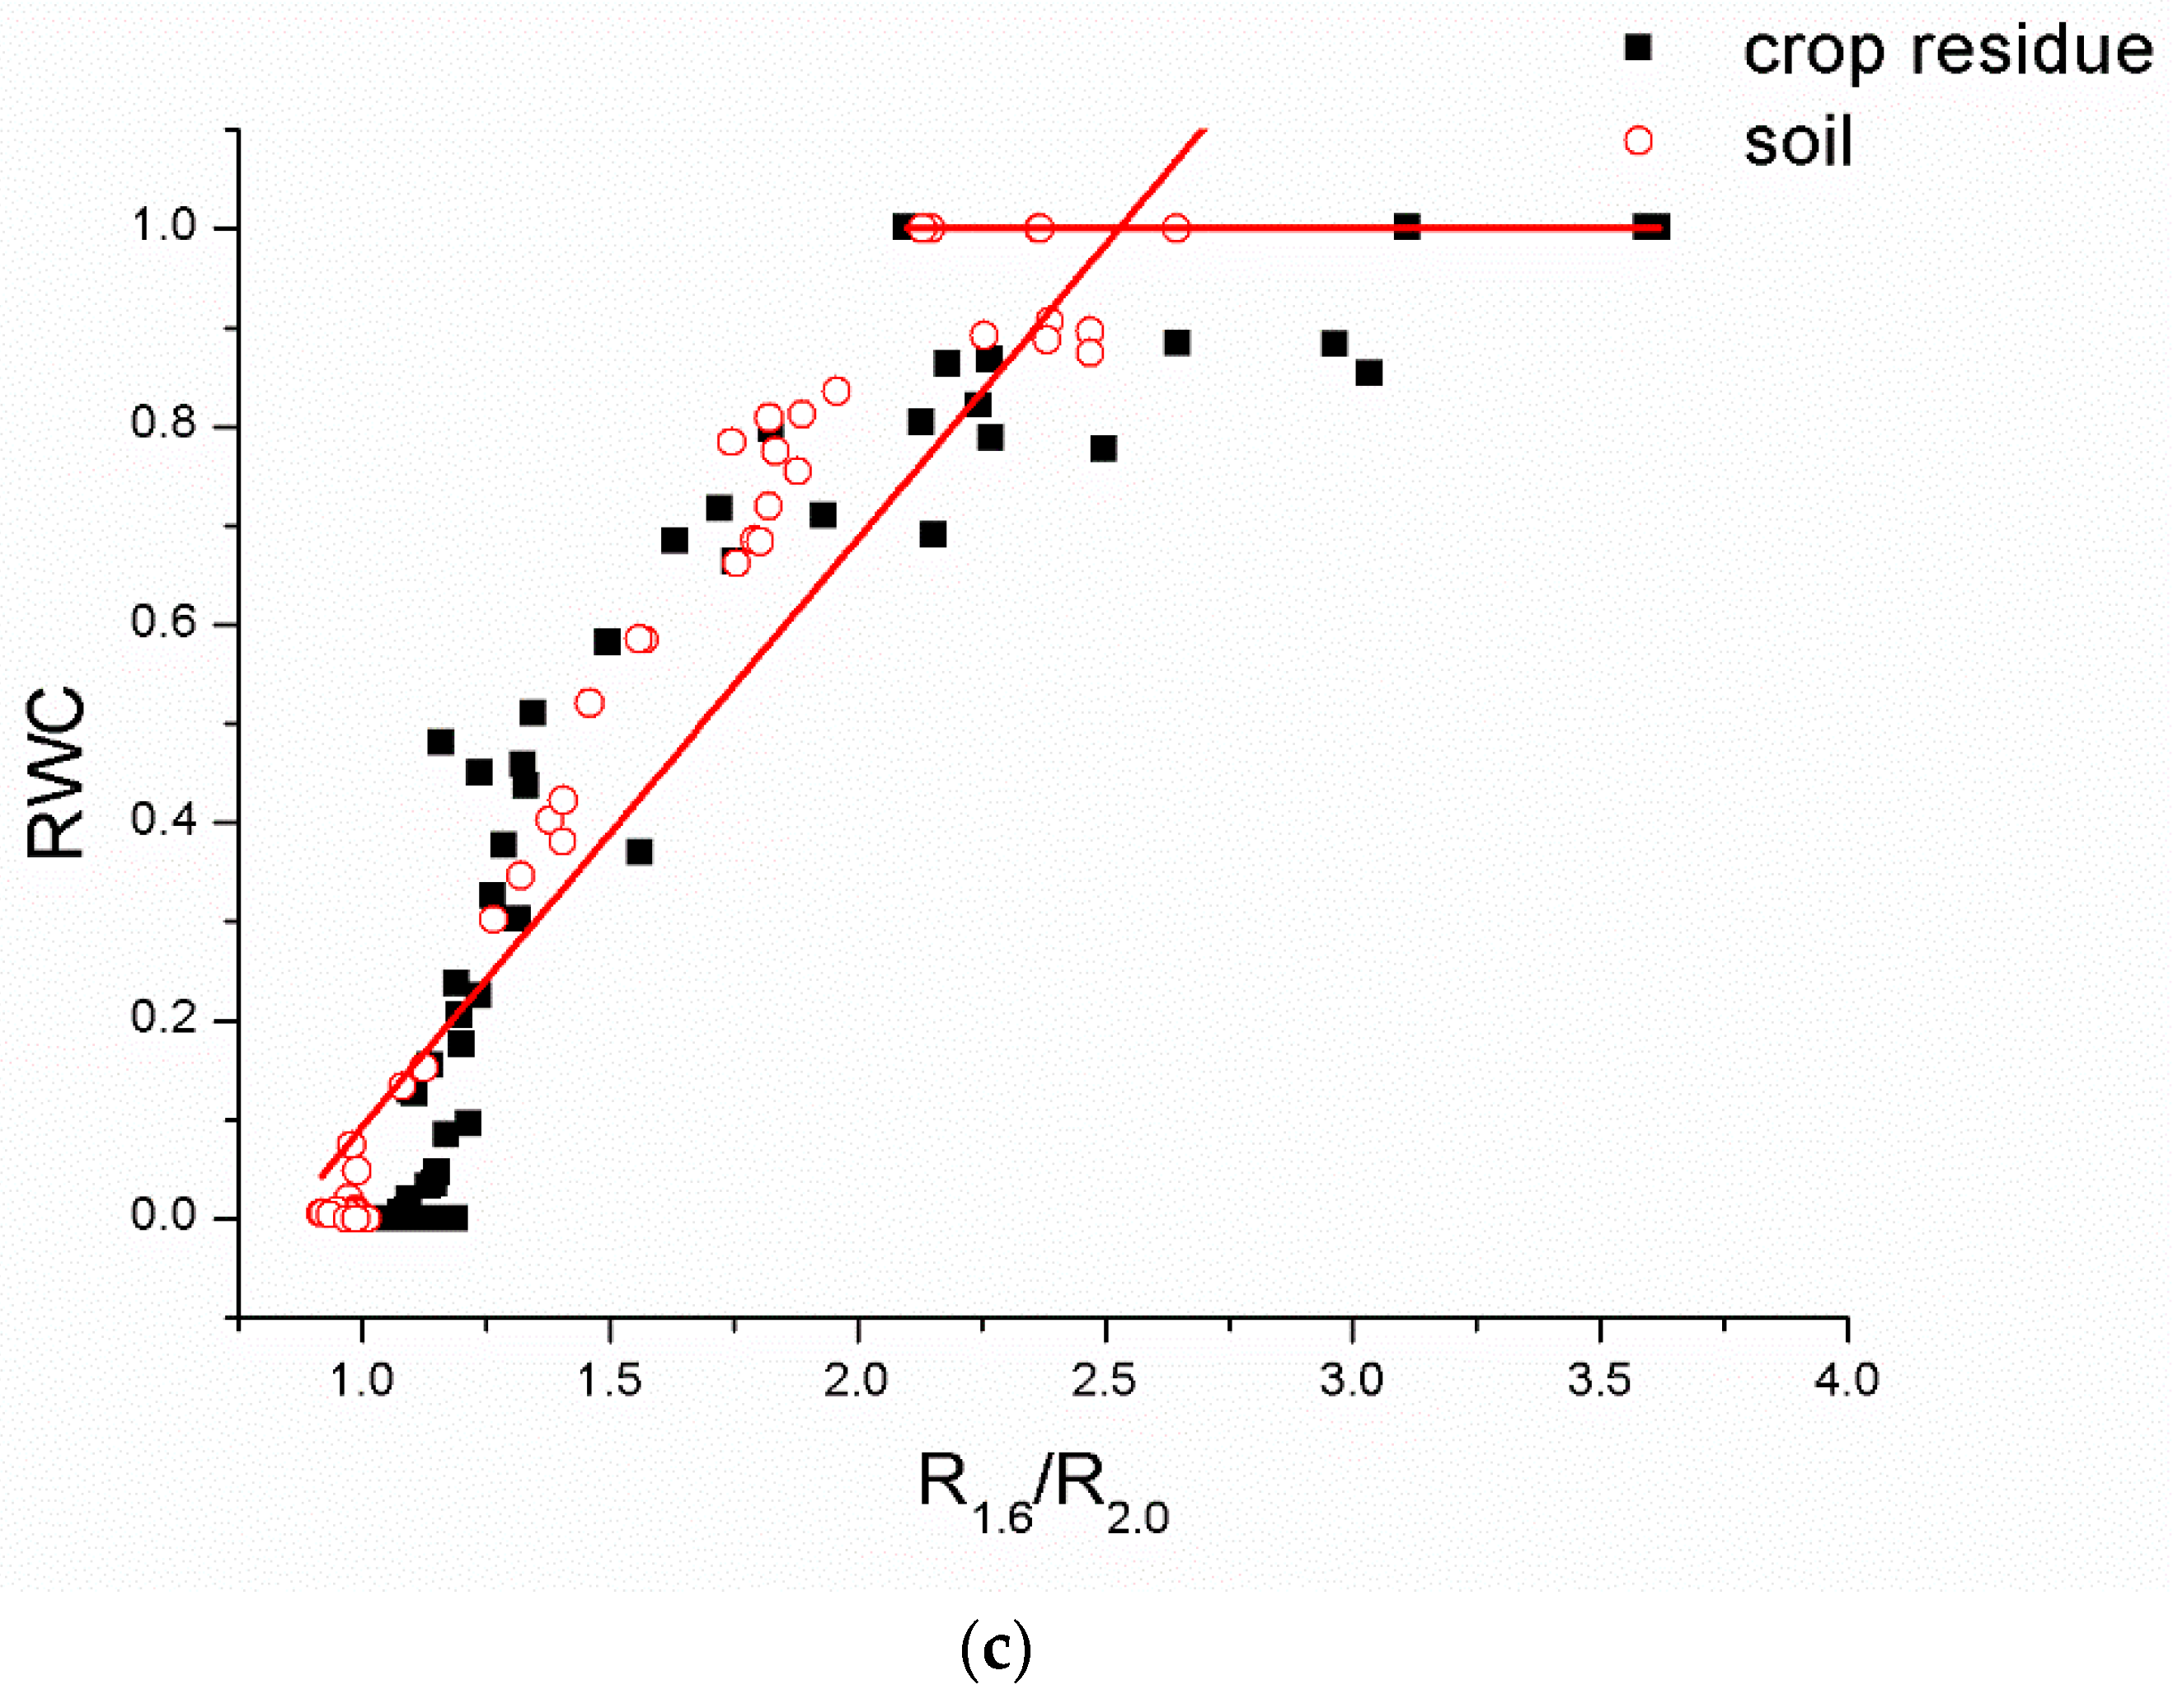
A study proposed three ratio water indices to invert RWC [22]. Since the inversion effect of R2.2/R2.0 was not ideal in the original text, only R1.6/R1.5 and R1.6/R2.0 were selected for comparison with the R2005 in this paper. The results of fitting the individual RWC of soil and crop residue samples with R2005, R1.6/R1.5 and R1.6/R2.0 are shown in Figure 8.
In the case of using R2005, RWC of crop residues and soil can be fitted accurately with the same exponential decay function. R2 = 0.90 and root-mean-square error (RMSE) = 0.12, which indicates that R2005 had similar simulation effects on the RWC of crop residues and soil. Therefore, the R2005 can be used to simulate the RWC of the mixture of crop residue and soil with the same curve. In Figure 8b,c, because the saturation plateau occurred when the RWC was 1, two ratio water indices used piecewise functions to simulate water. When R1.6/R1.5 < 1.54, RWC = 1.76 * (R1.6/R1.5) − 1.72. When R1.6/R1.5 ≥ 1.54. RWC = 1, R2 = 0.75, RMSE = 0.17; similarly, when R1.6/R2.0 < 2.53, RWC = 0.59 * (R1.6/R2.0) − 0.50. When R1.6/R2.0 ≥ 2.53, RWC = 1. R2 = 0.84, RMSE = 0.14.

3.6. Inversion of RWCm

Under actual field conditions, crop residue and soil are mixed together. Therefore, it was necessary to verify the inversion effect of R2005 obtained from laboratory experiments on a field with mixed moisture. Figure 9 shows the fitting results of RWCm and the R2005, R1.6/R1.5, R1.6/R2.0.
It was obvious that R2005 was the best band for inverting RWCm. R2 is 0.935, RMSE is 0.07. Of the two water indices, R1.6/R2.0 was more effective than R1.6/R1.5 in simulating RWCm. Through comparison, it can be seen that the RWCm inversion effect is significantly improved after using the R2005. R2 increased from 0.828 to 0.935 and RMSE declined from 0.12 to 0.07, which shows that the regression fitting degree between the R2005 and the actual RWCm was high, and the gap between the observed values and the true values was small. The use of the R2005 had the advantage of precision in the inversion of RWCm that is moisture mixture of crop residues and soil.

3.7. Validation

The research selected 70 sample points to validate the accuracy of models improved by R2005, R1.6/R1.5 and R1.6/R2.0. The results are shown in Figure 10.
The solid lines were linear equations obtained by regression analysis of simulated and true values of crop residue cover. The dotted lines were the y = x standard lines. Compared with the two ratio water indices, the slope of the simulated and true values of crop residue cover using R2005 is the closest to 1 and intercept was minimum. R2 was 0.958, and RMSE was only 0.06.

4. Discussion

Compared with the two ratio water indices, the R2005 had a number of advantages. Unlike the ratio water indices, which required piecewise fitting functions, the R2005 only needed a curve to be fitted without impact of saturation plateau. In practical application, R2005 was more suitable to be promoted in the field than ratio water indices, due to fewer bands applied and simple and efficient calculation methods. The R2005 can quickly and accurately simulate the moisture condition of farmland, especially when the available bands of satellite images or aerial images in the study area are limited.
Moreover, R2005 had a higher accuracy than ratio water indices in terms of moisture inversion. R2 increased from 0.828 to 0.935, RMSE declined from 0.12 to 0.07 at the point of RWCm inversion. At the point of results verification, the highest R2 with 0.958 and the lowest RMSE with 0.06 indicated that the use of the R2005 can estimate RWC most accurately and effectively to further improve crop residue cover estimation accuracy. The R2005 could minimize the influence of moisture in the estimation process of crop residue cover to a great extent.
Since it is difficult to simulate a realistic varied terrain in a laboratory experiment, the effect of topographic relief was not considered. In fact, studies have shown that topographic fluctuations can affect reflectance [28,29]. When the study area is mountainous, researchers should also consider terrain effect. The experiment samples were collected from Liaocheng City, Huang-Huai-Hai Plain, where the main cultivated soil is the moist soil and the main crop is winter wheat [30,31,32]. Therefore, only one kind of soil and one kind of crop residue were collected for study. When considering alternative study areas, which are not the Huang-Huai-Hai Plain, the type of soil and crop residues may change. The experiment needs to be redesigned for different study areas. The laboratory experiment was carried out under ideal conditions and there are differences in the realistic fields. The incapability of simulating real field conditions is a limitation of laboratory experiments. In addition, soil salinity, PH value, trace element content, and other variables can also become the future research subjects of crop residue cover factors.

5. Conclusions

The influence of water on the estimation of crop residue cover in cultivated land was discussed and eliminated largely. Crop residue cover can be assessed by a linear model with CAI, while moisture would lead to low estimations. A sensitive band, R2005, was proposed in this paper to invert the RWC of crop residues and soil and improve estimation of crop residue cover. The R2005 was compared with two ratio water indices in many aspects. At the point of validation, the result of R 2 was 0.958 and RMSE was only 0.06, proving that the model improved by R2005 had the highest reliability. In addition, unlike the piecewise fitting functions of ratio water indices, the R2005 only needed a single function for accurate fitting. For the promotion to practical application, the R2005 had great advantages, such as simple bands calculation. It could avoid unavailable spectral bands and select appropriate and high-quality data, especially for limited spectral data or spectral channels.

Author Contributions

Y.W. was responsible for data processing, primary analysis, visualization and paper writing. S.Z. was responsible for funding acquisition, supervision and paper revision. W.C. had provided great help in the laboratory experiment and data analysis. J.H. had made great contribution in revision and verbal polish. F.P. had help a lot in the laboratory experiment.

Funding

This research was funded by the Natural Science Foundation of China (41671429), the National Key R&D Program of China (2016YFB0502503), Natural Science Foundation of Jiangsu province, China (BK20181262) and the ISEF program of KFAS.

Acknowledgments

The authors thank for help from Buyun Lei, Huijun Xiao, Yongchao Qu, and Cheng Chen, of School of Geography and Ocean Science, Nanjing University, China for their field measurement work.

Conflicts of Interest

The authors declare no conflict of interest.

References

  1. Delgado, J. Crop residue is key for sustaining maximum food production and for conservation of our biosphere. J. Soil Water Conserv. 2010, 65, 111A–116A. [Google Scholar] [CrossRef]
  2. Jinhua, Z.; Congzhi, Z.; Jiabao, Z. Effect of Straw Returning via Deep Burial Coupled with Application of Fertilizer as Primer on Soil Nutrients and Winter Wheat Yield. Acta Pedol. Sin. 2016, 53, 438–449. [Google Scholar]
  3. Wang, J.; Zhang, L.; Pang, H.; Zhang, J. Returning granulated straw for accelerating decomposition rate and improving soil fertility. Trans. Chin. Soc. Agric. Eng. 2017, 33, 177–183. [Google Scholar]
  4. Zhang, L.; Wang, J.; Pang, H.C.; Zhang, J.T.; Guo, J.J.; Dong, G.H. Effects of short-term granulated straw incorporation on grain yield and soil respiration in a winter wheat-summer maize cropping system. J. Appl. Ecol. 2018, 29, 565–572. [Google Scholar]
  5. Garcia-Franco, N.; Albaladejo, J.; Almagro, M.; Martínez-Mena, M. Beneficial effects of reduced tillage and green manure on soil aggregation and stabilization of organic carbon in a Mediterranean agroecosystem. Soil Tillage Res. 2015, 153, 66–75. [Google Scholar] [CrossRef]
  6. Fei, L.U.; Wang, X.; Han, B.; Ouyang, Z.; Duan, X.; Zheng, H.U.; Miao, H. Soil carbon sequestrations by nitrogen fertilizer application, straw return and no-tillage in China’s cropland. Glob. Chang. Biol. 2009, 15, 281–305. [Google Scholar]
  7. Lal, R. Carbon Management in Agricultural Soils. Mitig. Adapt. Strateg. Glob. Chang. 2007, 12, 303–322. [Google Scholar] [CrossRef]
  8. Tejada, M.; Hernandez, M.T.; Garcia, C. Soil restoration using composted plant residues: Effects on soil properties. Soil Tillage Res. 2009, 102, 109–117. [Google Scholar] [CrossRef]
  9. Blanco-Canqui, H.; Lal, R. Impacts of Long-Term Wheat Straw Management on Soil Hydraulic Properties under No-Tillage. Soil Sci. Soc. Am. J. 2007, 71, 1166. [Google Scholar] [CrossRef]
  10. Guo, X.; Jing, D.; Zhou, R.; Fu, J. Detection of Phenolic Acids in Crop Straw Decomposed Liquid and Their Effect on Pathogen of Northern Leaf Blight of Corn. J. Maize Sci. 2016, 24, 166–172. [Google Scholar]
  11. Zhang, S.; Shi, Z.L.; Yang, S.J.; Gu, K.J.; Dai, T.B.; Wang, F.; Li, X.; Sun, R.H. Effects of nitrogen application rates and straw returning on nutrient balance and grain yield of late sowing wheat in rice-wheat rotation. J. Appl. Ecol. 2015, 26, 2714–2720. [Google Scholar]
  12. Zheng, B.; Campbell, J.B.; Beurs, K.M.D. Remote sensing of crop residue cover using multi-temporal Landsat imagery. Remote Sens. Environ. 2012, 117, 177–183. [Google Scholar] [CrossRef]
  13. Sullivan, D.G.; Truman, C.C.; Schomberg, H.H.; Endale, D.M.; Strickland, T.C. Evaluating Techniques for Determining Tillage Regime in the Southeastern Coastal Plain and Piedmont. Agron. J. 2006, 98, 1236–1246. [Google Scholar] [CrossRef]
  14. Qi, J.; Marsett, R.; Heilman, P.; Bieden-bender, S.; Moran, S.; Goodrich, D.; Weltz, M. RANGES improves satellite-based information and land cover assessments in southwest United States. Eos Trans. Am. Geophys. Union 2002, 83, 601–606. [Google Scholar] [CrossRef]
  15. Gelder, B.K.; Kaleita, A.L.; Cruse, R.M. Estimating Mean Field Residue Cover on Midwestern Soils Using Satellite Imagery. Agron. J. 2009, 101, 635–643. [Google Scholar] [CrossRef]
  16. Daughtry, C.S.T.; Mcmurtrey, J.E.; Chappelle, E.W.; Hunter, W.J.; Steiner, J.L. Measuring crop residue cover using remote sensing techniques. Theor. Appl. Climatol. 1996, 54, 17–26. [Google Scholar] [CrossRef]
  17. Daughtry, C.S.T.; Hunt, E.R.; Doraiswamy, P.C.; McMurtrey, J.E. Remote Sensing the Spatial Distribution of Crop Residues. Agron. J. 2005, 97, 864–871. [Google Scholar] [CrossRef]
  18. Serbin, G.; Hunt, E.R.; Daughtry, C.S.T.; McCarty, G.; Doraiswamy, P. An Improved ASTER Index for Remote Sensing of Crop Residue. J. Med. Virol. 2009, 1, 853–856. [Google Scholar] [CrossRef]
  19. Biard, F.; Bannari, A.; Bonn, F. SACRI (Soil Adjusted Corn Residue Index): Un indice de residus de culture de mais. In Proceedings of the 17th Canadian Symposium on Remote Sensing, Saskatoon, SK, Canada, 13–15 June 1995. [Google Scholar]
  20. Bannari, K.; Haboudane, D.; McNairn, H.; Bonn, F. Modified Soil Adjusted Crop Residue Index (MSACRI): A new index for mapping crop residue. In Proceedings of the IEEE 2000 International Geoscience and Remote Sensing Symposium, Honolulu, HI, USA, 24–28 July 2000. [Google Scholar]
  21. Biard, F.; Baret, F. Crop residue estimation using multiband reflectance. Remote Sens. Environ. 1997, 59, 530–536. [Google Scholar] [CrossRef]
  22. Miguel, Q.; Craig, D. Spectral Indices to Improve Crop Residue Cover Estimation under Varying Moisture Conditions. Remote Sens. 2016, 8, 660. [Google Scholar] [CrossRef]
  23. Quemada, M.; Hively, W.D.; Daughtry, C.S.T.; Lamb, B.T. Improved crop residue cover estimates obtained by coupling spectral indices for residue and moisture. Remote Sens. Environ. 2018, 206, 33–44. [Google Scholar] [CrossRef]
  24. Feng, Z.; Guang-Sheng, Z. Research progress on monitoring vegetation water content by using hyperspectral remote sensing. Chin. J. Plant Ecol. 2018, 42, 517–525. [Google Scholar] [CrossRef]
  25. Daughtry, C.S.T.; Serbin, G.; Reeves, J.B., III; Doraiswamy, P.; Hunt, E.R. Spectral Reflectance of Wheat Residue during Decomposition and Remotely Sensed Estimates of Residue Cover. Remote Sens. 2010, 2, 416–431. [Google Scholar] [CrossRef] [Green Version]
  26. Daughtry, C.S.T.; Hunt, E.R. Mitigating the effects of soil and residue water contents on remotely sensed estimates of crop residue cover. Remote Sens. Environ. 2008, 112, 1647–1657. [Google Scholar] [CrossRef]
  27. Chang, C.W. Near infrared reflectance spectroscopy-Principal components regression analyses of soil properties. Soil Sci. Soc. Am. J. 2001, 65, 480–490. [Google Scholar] [CrossRef]
  28. Fan, W.; Chen, J.M.; Ju, W.; Zhu, G. GOST: A Geometric-Optical Model for Sloping Terrains. Ieee Trans. Geosci. Remote Sens. 2014, 52, 5469–5482. [Google Scholar]
  29. Li, A.; Wang, Q.; Bian, J.; Lei, G. An Improved Physics-Based Model for Topographic Correction of Landsat TM Images. Remote Sens. 2015, 7, 6296–6319. [Google Scholar] [CrossRef] [Green Version]
  30. Li, H.J.; Liu, Z.H.; Qu, S.G.; Dong, Y.M.; Song, G.L.; Li, Z.J. Dezhou Soil Fertility Change and Analysis. Chin. Agric. Sci. Bull. 2009, 25, 134–137. [Google Scholar]
  31. Li, F. Succession of Upland Soil Microbial Structure under Long-Term Fertilization in Huang-Huai-Hai Plain. Ph.D. Thesis, Henan Agricultural University, Zhengzhou, China, 2018. [Google Scholar]
  32. Liu, M.; He, B.; Lü, A.; Zhou, L.; Wu, J. Parameters sensitivity analysis for a crop growth model applied to winter wheat in the Huanghuaihai Plain in China. Geosci. Model Dev. Discuss. 2014, 7, 3867–3888. [Google Scholar] [CrossRef]
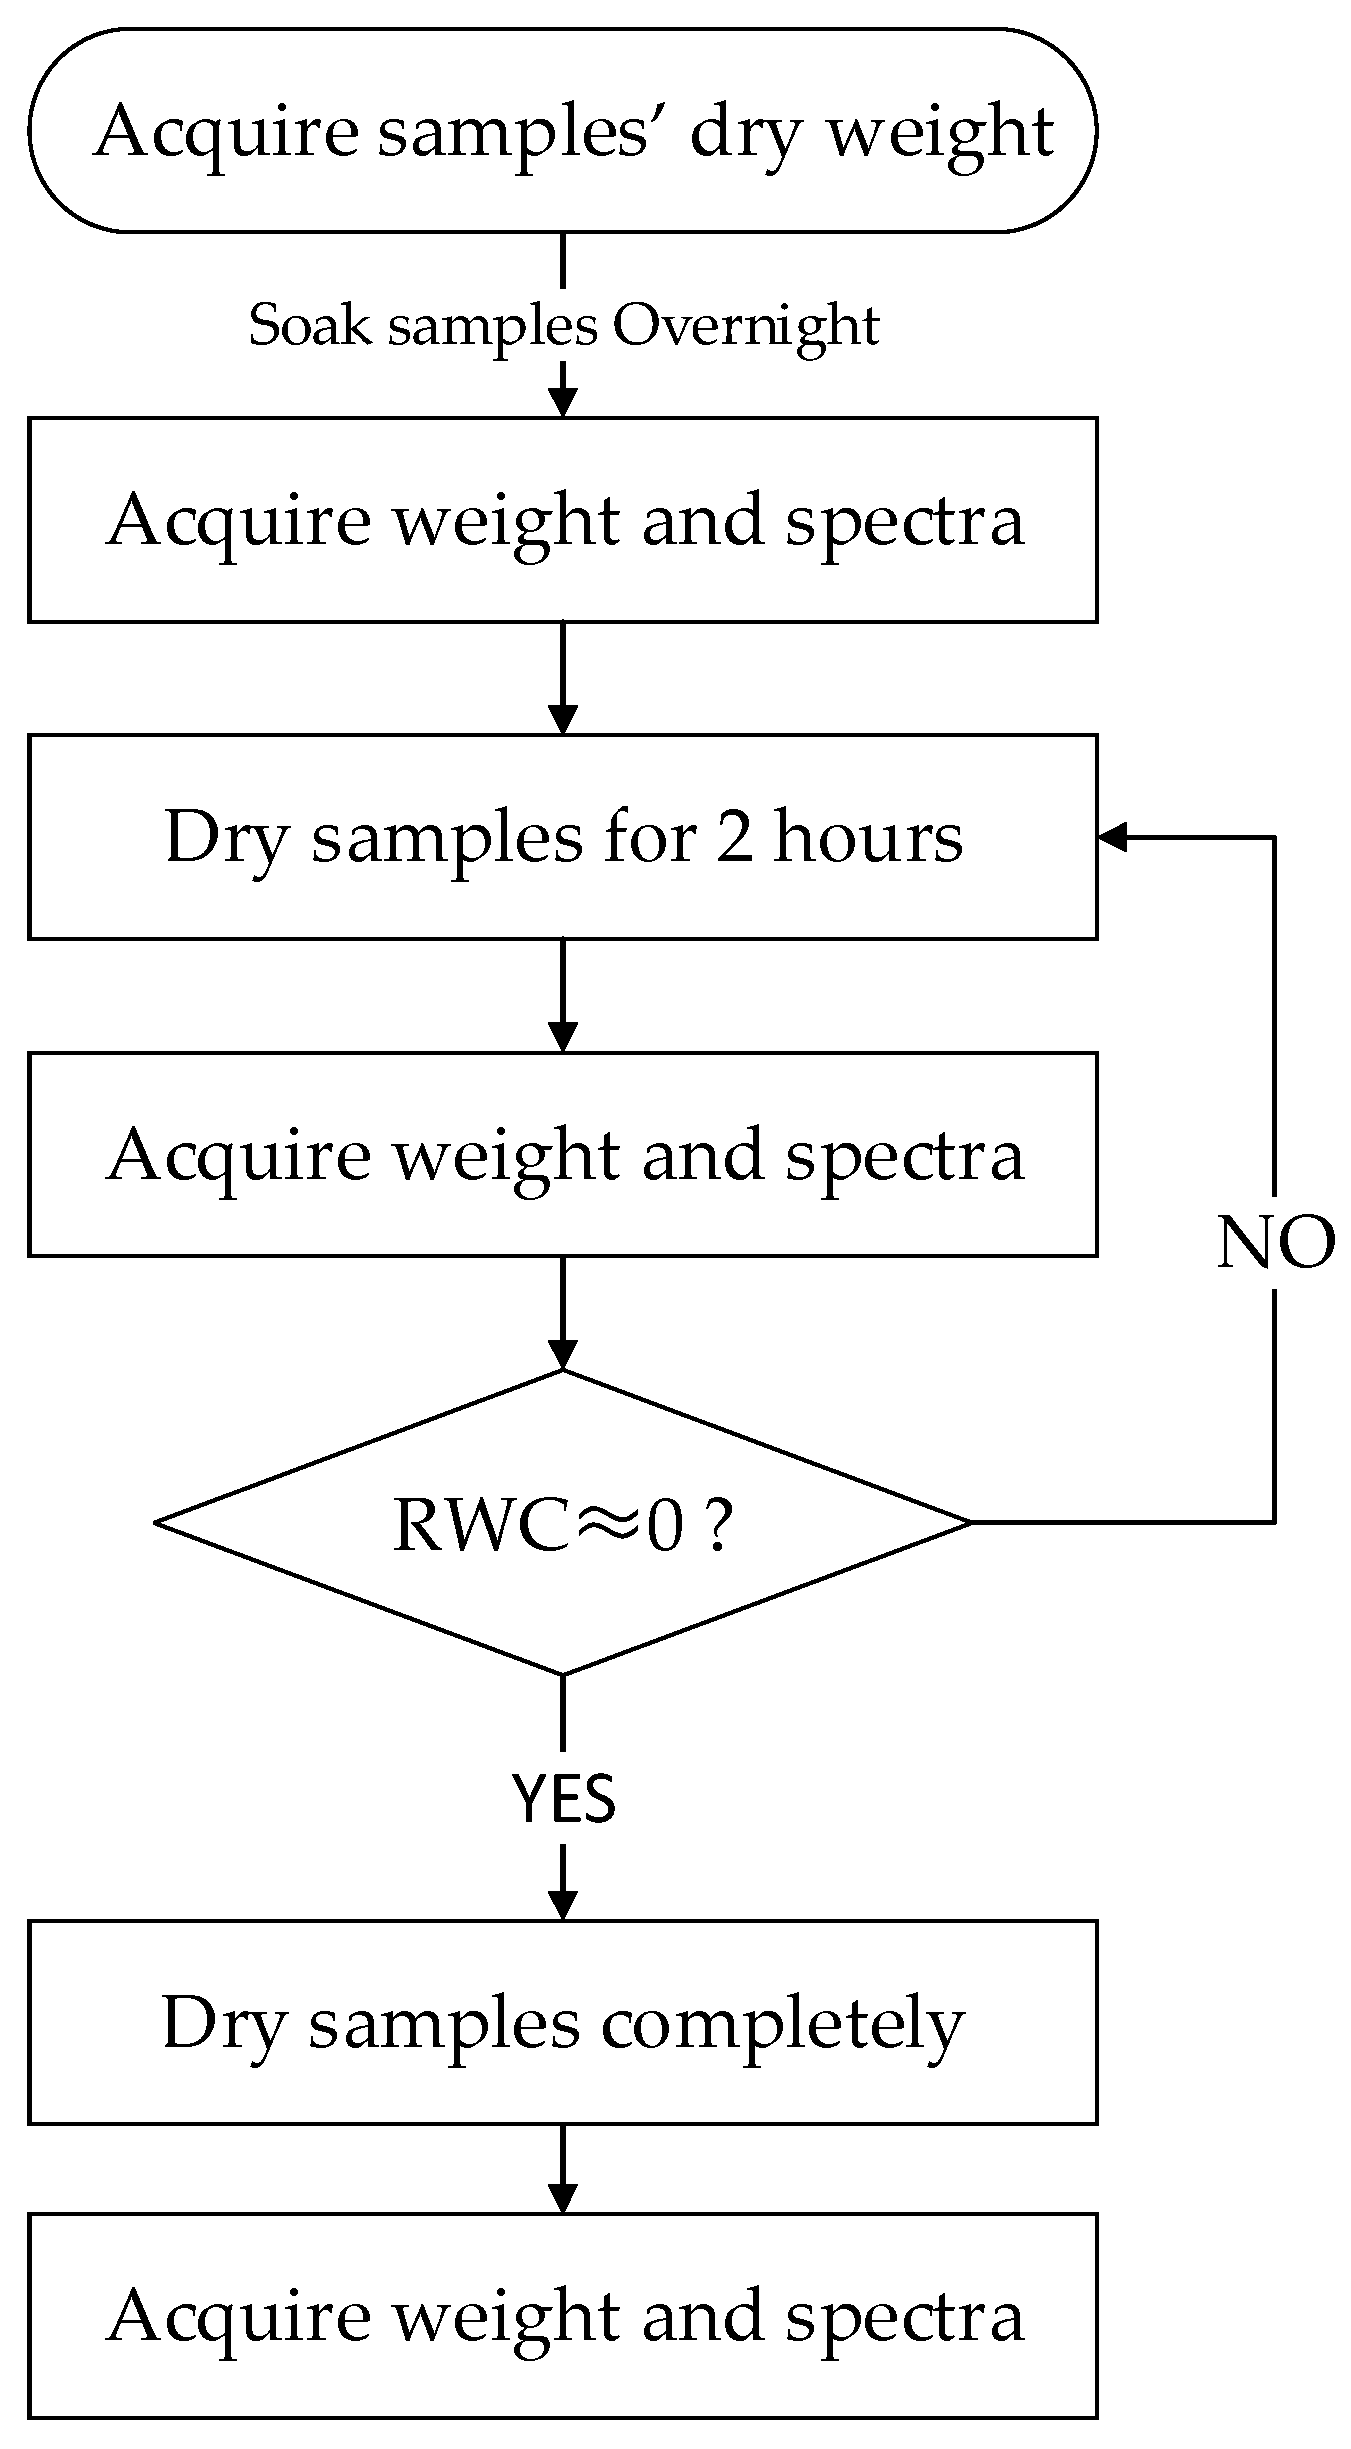
Figure 1. The flow chart of experiment.
Sustainability 11 03032 g001
Figure 2. Reflectance of crop residue under various relative water content (RWC).
Sustainability 11 03032 g002
Figure 3. Reflectance of soil under various RWC.
Sustainability 11 03032 g003
Figure 4. Crop residue cover as a function of cellulose absorption index (CAI) under various RWC.
Sustainability 11 03032 g004
Figure 5. Slope as a function of RWC.
Sustainability 11 03032 g005
Figure 6. Intercept as a function of RWC.
Sustainability 11 03032 g006
Figure 7. Sensitivity between RWC and reflectance.
Sustainability 11 03032 g007
Figure 8. RWC of crop residues and soil as a function of the sensitive band and two water indices: (a) R2005 (b) R1.6/R1.5 (c) R1.6/R2.0.
Sustainability 11 03032 g008aSustainability 11 03032 g008b
Figure 9. RWCm as a function of the sensitive band and two water indices: (a) R2005 (b) R1.6/R1.5 (c) R1.6/R2.0.
Sustainability 11 03032 g009aSustainability 11 03032 g009b
Figure 10. The contrast between estimated crop residue cover and true crop residue cover.
Sustainability 11 03032 g010aSustainability 11 03032 g010b
Table 1. Selected bands of different water indices.
Water IndicesThe Selected Bands
R 1.6 / R 1.5 R 1.5 is 10-nm band centered at 1500 nm,
R 1.6 is 10-nm band centered at 1600 nm
R 1.6 / R 2.0 R 1.6 is 10-nm band centered at 1600 nm,
R 2.0 is 10-nm band centered at 2030 nm
R 2.2 / R 2.0 R 2.2 is 10-nm band centered at 2200 nm,
R 2.0 is 10-nm band centered at 2030 nm
SWIR3/SWIR6SWIR3: 1640–1680 nm,
SWIR6: 2185–2225 nm for WorldView-3
OLI6/OLI7OLI6: 1570–1650 nm,
OLI7: 2110–2290 nm for Landsat8
Table 2. Slope and intercept as the functions of RWC.
ParameterEquationAdj.R2RMSE
slope slope = 0.15471 exp ( RWC 0.51696 ) + 0.01725 0.998680.01268
Intercept intercept = 0.50728 RWC + 0.36342 0.97430.03336
Table 3. The information of water indices and the sensitive band.
Water Indices/The Sensitive BandThe Selected Bands
R1.6/R1.5R1.5 is 10-nm band centered at 1500 nm
R1.6 is 10-nm band centered at 1600 nm
R1.6/R2.0R1.6 is 10-nm band centered at 1600 nm
R2.0 is 10-nm band centered at 2030 nm
R2005R2005 is 10-nm band centered at 2005 nm