Article

Variations in FINN Emissions of Particulate Matters and Associated Carbonaceous Aerosols from Remote Sensing of Open Biomass Burning over Northeast China during 2002–2016

1
Key Laboratory for Aerosol-Cloud-Precipitation of China Meteorological Administration, Collaborative Innovation Center on Forecast and Evaluation of Meteorological Disasters, Nanjing University of Information Science and Technology, Nanjing 210044, China
2
Department of Atmospheric Sciences, School of Environmental Sciences, China University of Geosciences, Wuhan 430074, China
3
School of Environmental Science and Engineering, Nanjing University of Information Science and Technology, Nanjing 210044, China
4
Key Laboratory for Atmospheric Chemistry, Chinese Academy of Meteorological Sciences, Beijing 100081, China
*
Authors to whom correspondence should be addressed.
Sustainability 2018, 10(9), 3353; https://doi.org/10.3390/su10093353
Submission received: 3 August 2018 / Revised: 7 September 2018 / Accepted: 16 September 2018 / Published: 19 September 2018

Abstract

:
Various particulate matters (PM) and associated carbonaceous aerosols released from open biomass burning (including open straw burning, grass and forest fires) are major sources of atmospheric pollutants. Northeast China is a central region with high forest and grass coverage, as well as an intensive agricultural area. In this study, the FINN (Fire INventory from Ncar) emission data was used to analyze the spatiotemporal variations of PM and associated carbonaceous aerosol component (PM2.5, PM10, OC and BC) emissions from open biomass burning in Northeast China from 2002 to 2016. The results show that the total amount of annual PM2.5, PM10, OC and BC emissions was estimated to be 59.0, 70.6, 31.5, and 4.3 kilotons, respectively, from open biomass burning over Northeast China, averaged from 2002 to 2016, with significant inter-annual variations in amplitudes from 28.0 to 122.3, 33.7 to 144.1, 15.0 to 65.0, and 2.1 to 8.6 kilotons. The regional PM2.5, PM10, OC and BC emissions showed significant seasonal variations with highest emissions in spring (with a seasonal peak in April), followed by autumn (with a seasonal peak in October), summer, and winter in Northeast China; high emissions were concentrated in the forests and grasslands with natural fires, as well as over agricultural areas with crop straw burning from human activities. The PM2.5, PM10, OC and BC emissions over forest areas presented decreasing trends, while the emissions over farmlands showed increasing trends in Northeast China during 2002–2016; this reflects on the dominance of biomass burning that shifted from forestland with natural fires to farmlands with increasing human activities. Three key meteorological drivers—strong near-surface wind speed, high air temperature and low relative humidity—were identified as having significant positive impacts on the inter-annual variations of PM2.5, PM10, OC and BC emissions from open biomass burning in Northeast China.

1. Introduction

Open biomass burning is a major source of gaseous pollutants and particulate matters [1,2]. Most of the emitted particulates are fine particles [3]; globally 26–73% of fine particles come from open biomass burning [4]. PM2.5 emissions from biomass burning account for 74% of the total particulate matter emissions [5]. They are comprised primarily of carbonaceous particulates, which make up approximately 73% of the total particulate matter [6]. Carbonaceous particulates are generally composed of organic carbon (OC) and black carbon (BC). Both OC and BC are major scattering and absorbing aerosols that affect global and regional radiation balance, reduce visibility [7], and impair human health [8,9]. Therefore, particulate matters from biomass burning play an important role in climate and environment change [10,11,12].
Open biomass burning is a wide-ranging and difficult-to-control source, which can produce a large number of pollutant emissions [13]. The emissions from fires vary with types of ecosystems, prevailing weather patterns, fuel characteristics, etc., and have significant inter-annual and seasonal variations [14]. On a global scale, the underlying surface types of biomass burning are mainly forests and grasslands. The large inter-annual variation of forest fire areas is one of the main causes for the high inter-annual variation of global biomass burning emissions [15]. Bossioli et al. [16] showed that biomass burning in the eastern Mediterranean increased the concentrations of PM2.5 in the Aegean Sea by about 24%. According to Streets et al. [17], about 730 Tg of biomass was burned in Asia each year; among the total, forest burning comprised 45%, crop residue burning 34% and grassland fires owned the rest. China contributed 25% to the total biomass burning. Sahu et al. [18] studied the seasonal and long-term trends of biomass burning sources in south and southeast Asia, and found that the intensity of biomass fires had been modulated by the large-scale climatic phenomena. Crop straw burning is the main form of biomass burning in China [17,19]. Li et al. [20] estimated the quantity of open straw burning in China and provided a straw burning emission inventory. Wu et al. [21] estimated the open biomass burning emissions in central and eastern China from 2003 to 2015 based on satellite observation, providing credible evidence to assess the influence of policies on burning activities. The study of Li et al. [22] showed that, from 1990 to 2013, the area with high biomass burning emissions extended significantly in Northeast China. Biomass burning contributes up to 30–60% of atmospheric OC in Beijing, the capital of China [23,24]. A large number of crop straw burnings during the harvest seasons is a main source of atmospheric particulate matter in Sichuan Basin, Southwest China [25,26]. Zhao et al. [27] reviewed the current situation of crop residue burning in China, and offered recommendations on reducing the threat of open biomass burning on air quality by prescribed open burning.
As an urgent sustainability problem, air quality in China has deteriorated by changing air pollutant emissions. There is a large gap in understanding the spatiotemporal variations of air pollutant emissions in China due to the complication of natural and anthropogenic sources, which is becoming a major challenge for air pollution control. The harm from haze and poor air quality in China has attracted worldwide attention. However, a number of studies on air pollution and air pollutant emissions, especially from biomass burning in China, were mainly focused on North China Plain, Yangtze River Delta, Sichuan Basin and Pearl River Delta regions of China [28,29]. In recent years, haze pollution in Northeast China (which is at a high latitude), has become frequent and intense; the issue, however, is poorly understood in China [27,30].
Northeast China is rich in forest resources with total forest area of approximately 37 million hectares, accounting for 37% of the country’s total forest area. Its forest coverage rate is approximately 37.9%, which is three times the national average. Northeast China is also the main grain-producing region in the country. Seasonally, a large number of crop straws are burned on farmland in this region. Therefore, forest fires and crop straw burning are main emission sources of particulate matters and associated carbonaceous aerosols in Northeast China [31,32]. There is a lack of understanding of the spatiotemporal distribution of biomass burning emissions in Northeast China, where forestland and cropland are dominant.
Open fire from farmlands is closely related to anthropogenic factors (crop straw burning, crop types, laws and regulations, etc.), while forest and grassland fires are mostly determined by natural factors (lightning, precipitation, winds, temperature, etc.). Both anthropogenic and natural factors with large uncertainties may severely limit study on the spatial and temporal distribution in air pollutant emissions from biomass burning over a largescale region. Therefore, satellite monitoring becomes practicable in studies on open biomass burning [14,32]. Open biomass burning with a large amount of aerosol emissions in a short time could result in regional haze pollution in China [33,34,35,36]. Zhao et al. [37] made an emission inventory of gaseous pollutants in Sanjiang Plain, northeast China, and the results indicated that owing to the change of land use, the main source of air pollutants changed from wetland to crop residue burning. It is of scientific significance to deeply understand the spatial and temporal characteristics of biomass burning emissions in Northeast China. In this study, we selected Northeast China as the study region to analyze the spatiotemporal variations in emissions of particulate matters and associated carbonaceous aerosols over the past 15 years (2002–2016) and provide a scientific basis for air pollution mitigation policies and sustainable development in China.

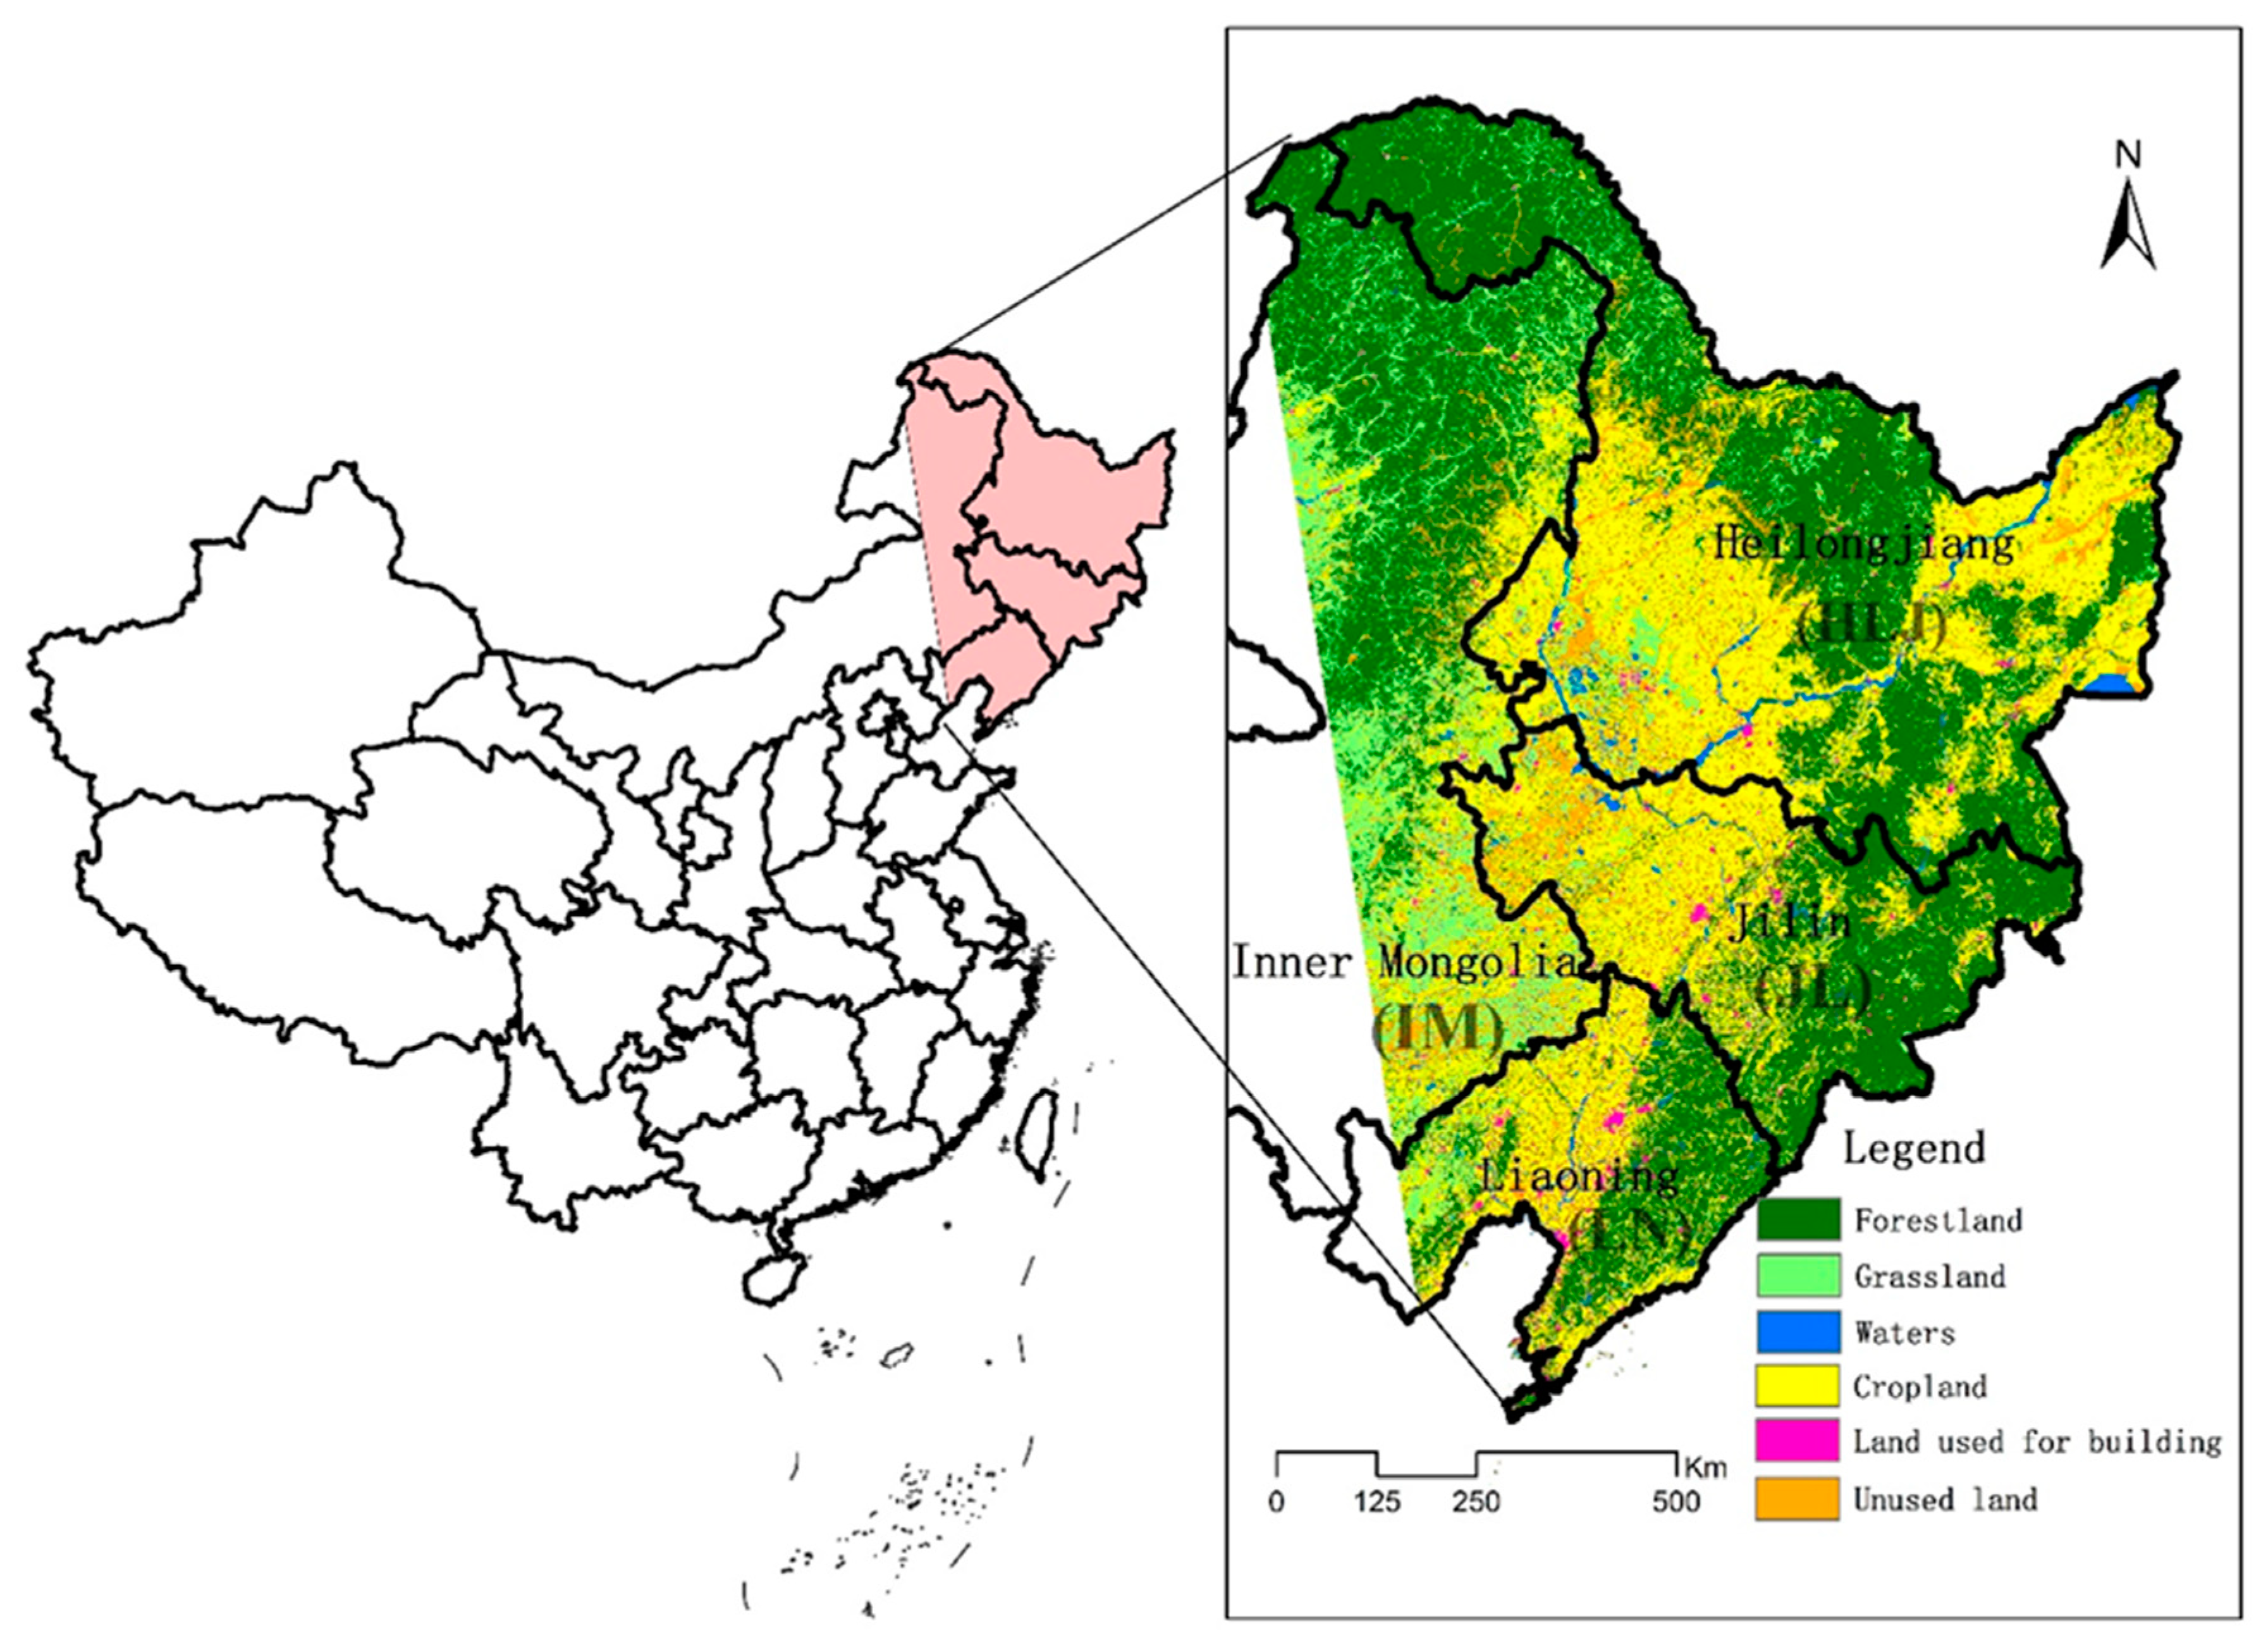
2. Observation Data and Analysis Methods

An inventory of biomass burning emission sources from survey data is only applicable to a specific year, because the actual quantity of biomass burning in the survey year is closely related to weather conditions (drought, rain, etc.). In China, the site survey mainly focuses on crop straw burning, and has limitations in determining the spatial and temporal characteristics of fires. To compensate for the site survey, the “top-down” satellite observation is used for determining actual sizes of biomass burning and fire locations for a quantitative study on continuous biomass burning (such as forest fires and grassland fires over large areas); it provides a more accurate inventory of biomass burning emissions for air quality and climate simulation [38].
FINN (Fire INventory from NCAR) emission data were used (https://www2.acom.ucar.edu/) in this study. FINN uses the location and time of active fires, and land cover type data obtained by remote sensing from MODIS sensors mounted on NASA Terra satellites and Aqua polar orbiting satellites. Together with emission factors and estimated fuel loadings, FINN provides daily, highly-resolved open burning emission inventory for regional and global atmospheric chemical transport models. The inventory framework produces daily emission data at a horizontal resolution of about 1 km2. The vegetation type of each fire pixel is determined by the MODIS Collection 5-Land Cover Type product [39]. In addition, MODIS VCF (Vegetation Continuous Field) products were used to identify the density of vegetation at each fire point. Different from other inventories of emission sources, FINN data offers global coverage, high temporal and spatial resolution, and contain emissions with a large number of chemical species, including CO2, CO, NOx, NH3, CH4 volatile and semi-volatile organic compounds (VOC and SVOC) and particulate matters (PM). FINN has been widely used in studies on atmospheric chemical transport models and air quality change from local to global scales.
Wiedinmyer et al. [40] presented a detailed description of the FINN datasets and compared the FINN dataset with other biomass burning inventories; the results showed that the FINN emissions agree well with other emission inventories, and the different evaluations for chemical species were consistent within the uncertainties of the frameworks. They then analyzed the global total emissions from open biomass burning during 2005–2010. The major emissions from cropland fires occured in the Northern Hemisphere, and equatorial Asia had the most variability in area and biomass burned. Val Martin et al. [41] used FINN data to analyze the effect of forest fires on atmosphere aerosol content and air quality during 2000–2012 in Colorado. Jiang et al. [42] used FINN data to explore the role of aerosol emissions from fires in O3 photochemical reaction. Reddington et al. [43] used three satellite derived fire emission inventories (GFED, GFAS and FINN) to explore the uncertainties in emissions. The smallest bias between the model and PM2.5 and AOD observations was found using FINN emissions; the small fires was better captured by the FINN dataset. Although the FINN dataset has uncertainties due to satellite overpass timing and cloud cover influencing the detection of fires as well as emission factors, etc., it has been widely used in studies on atmospheric, environment and air pollutant emissions. The meteorological data used in this study are provided by the Meteorological Data Sharing Network (http://data.cma.cn/) of the China Meteorological Administration (CMA). In this study, the ground meteorological data of 101 stations in Northeast China were selected for the analysis of regional climate and environment changes.
The study area is shown in Figure 1; it is actually the Northeast China within 120–135° E and 38–54° N. The area includes three provinces of Northeast China (Liaoning—LN, Jilin—JL, Heilongjiang—HLJ) and the east part of Inner Mongolia Autonomous Region (IM). For convenience, the study area has been abbreviated as the “NE region” in this study. Figure 1 also shows the land cover types over the NE region. These land-use data are from the Resource and Environment Science Data Center (http://www.resdc.cn) of Chinese Academy of Sciences.
Boreal seasonal division in this study refers to certain months of March, April and May as spring; June, July and August as summer; September, October and November as autumn; as well as December and following January and February as winter.
In this study, the following Equations (1) and (2) are used to calculate the trend b in inter-annual change of emissions from open biomass burning:
b = S x y S x x
S x y = i = 1 n ( x i x ¯ ) ( y i y ¯ ) , S x x = i = 1 n ( x i x ¯ ) 2
where x i , x ¯ are 2002–2016 year ordinal numbers and their average, y i , y ¯ are the annual emissions from open biomass burning and their averages over 2002–2016.

3. Results and Discussion

3.1. Temporal Variation of Emissions Averaged over NE Region

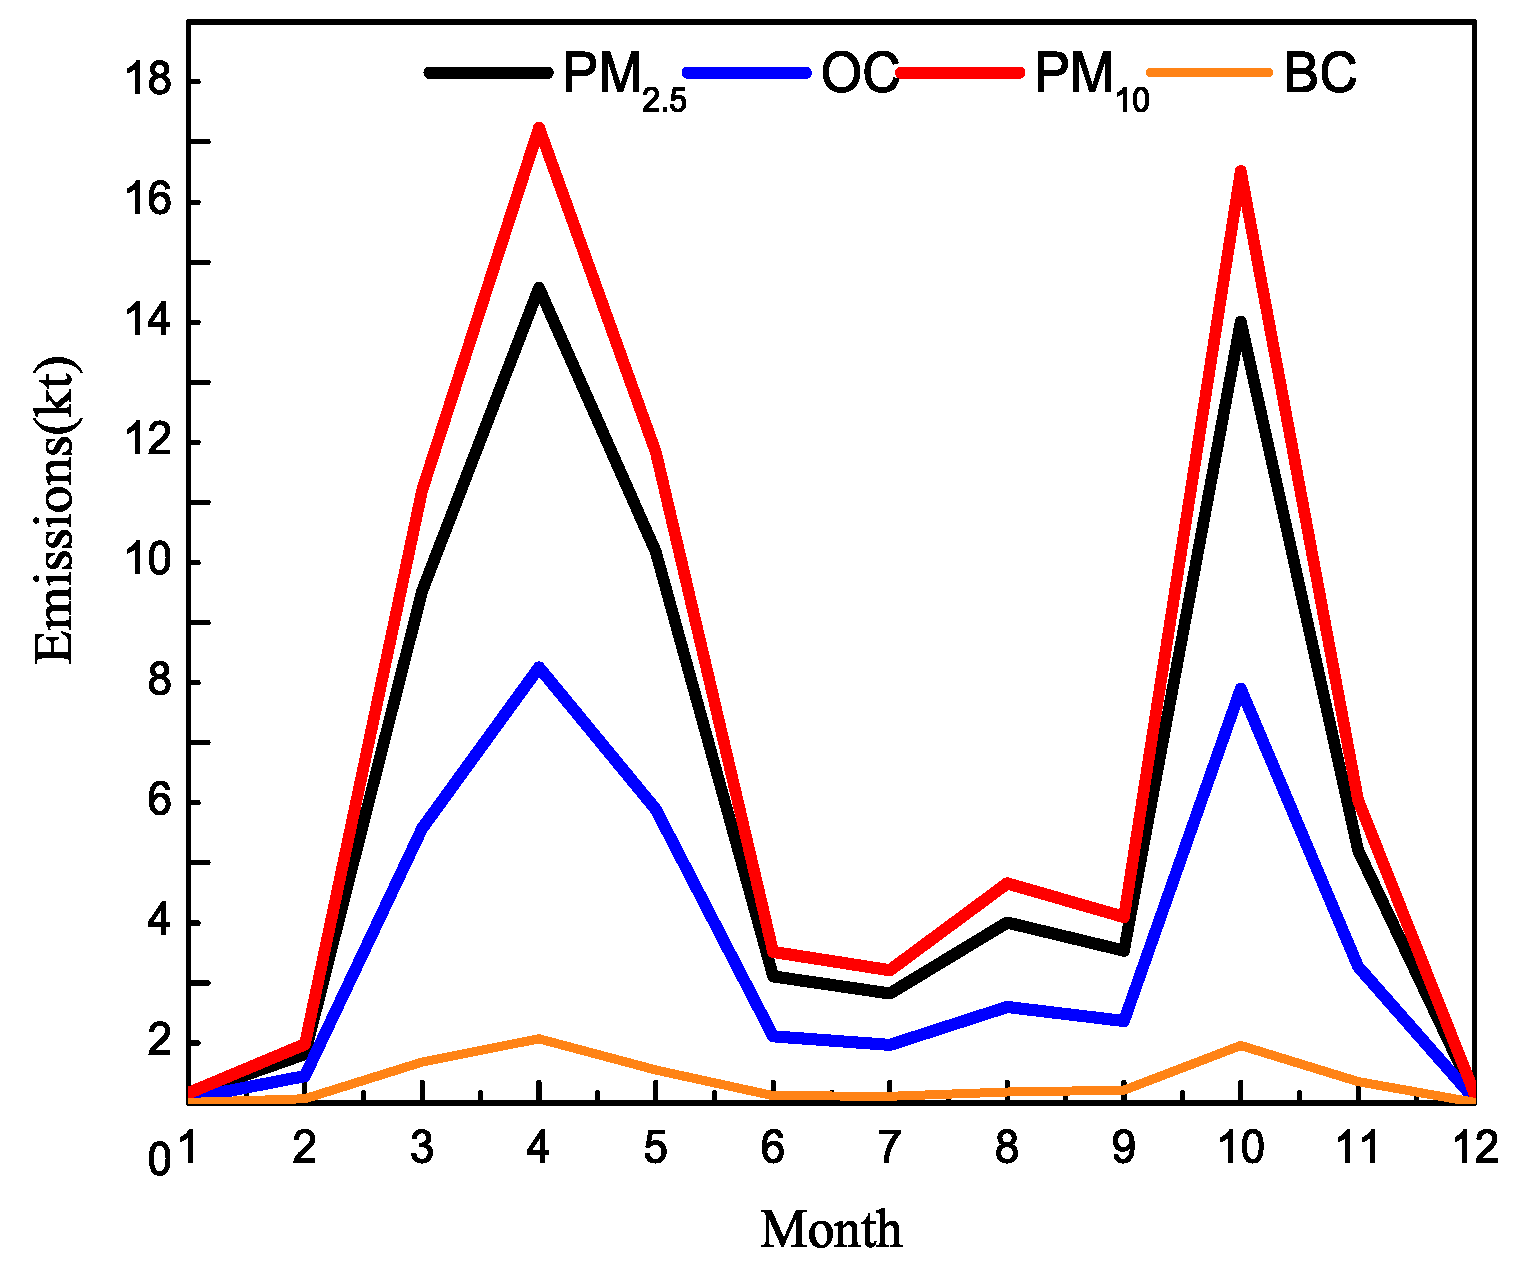
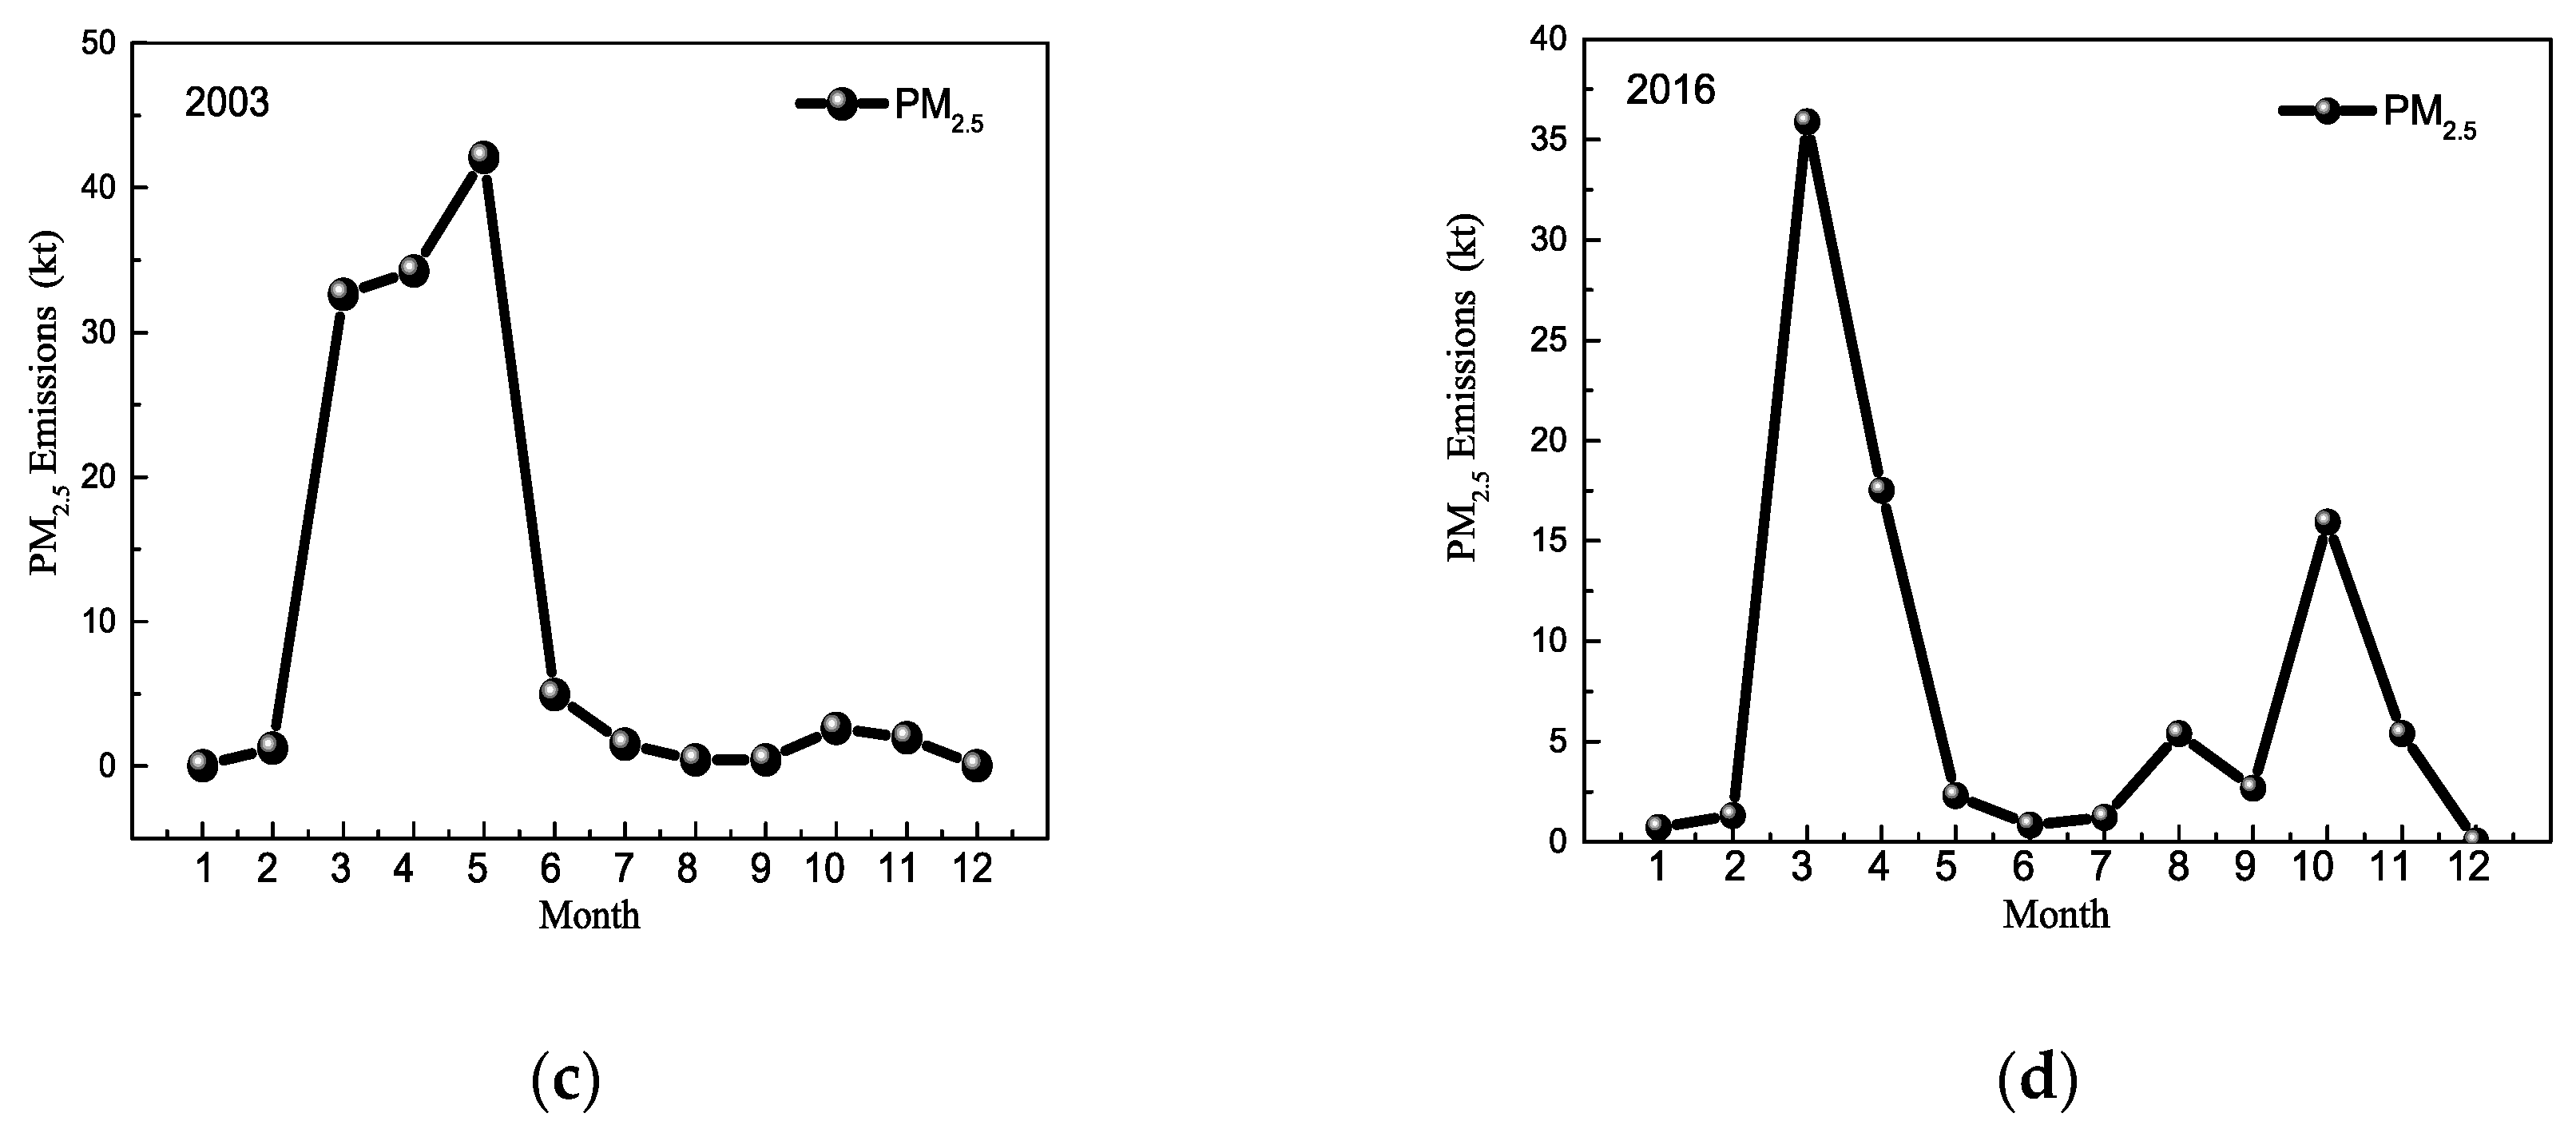
3.1.1. Monthly Variations of Emissions

The monthly variations of PM2.5, PM10, OC and BC emissions from open biomass burning for 2002–2016 averaged in the NE region are shown in Figure 2. The regional emissions varied monthly with two peaks in April and October for particulate matters and associated carbonaceous aerosols. Seasonally, the largest PM emissions occurred in spring, the second in autumn and the smallest in summer and winter. In spring, forest and grassland fires occurred frequently in the NE region due to drought climate. In addition, as the main grain-producing area in China, the NE region with vast farmlands accounts for about 30% of the total area of the region. Intensive agricultural activities, including spring plowing, burning, and remaining crop burning, make up man-made burning. Natural fires and man-made burning could make spring the largest biomass burning emission season in the NE region. In autumn, open straw burning is the most convenient and inexpensive way to dispose of residual crops. Farmers generally use this method to process large amounts of crop residues in a short time to prepare the land for crop planting in the next season, which could lead to autumn being the second-largest emission season. Summer is a rainy and growing season in the NE region; therefore, summer emissions are significantly lower than those in spring and autumn. In winter, open fire emissions are the lowest because the land is mostly covered by snow in this high latitude region.

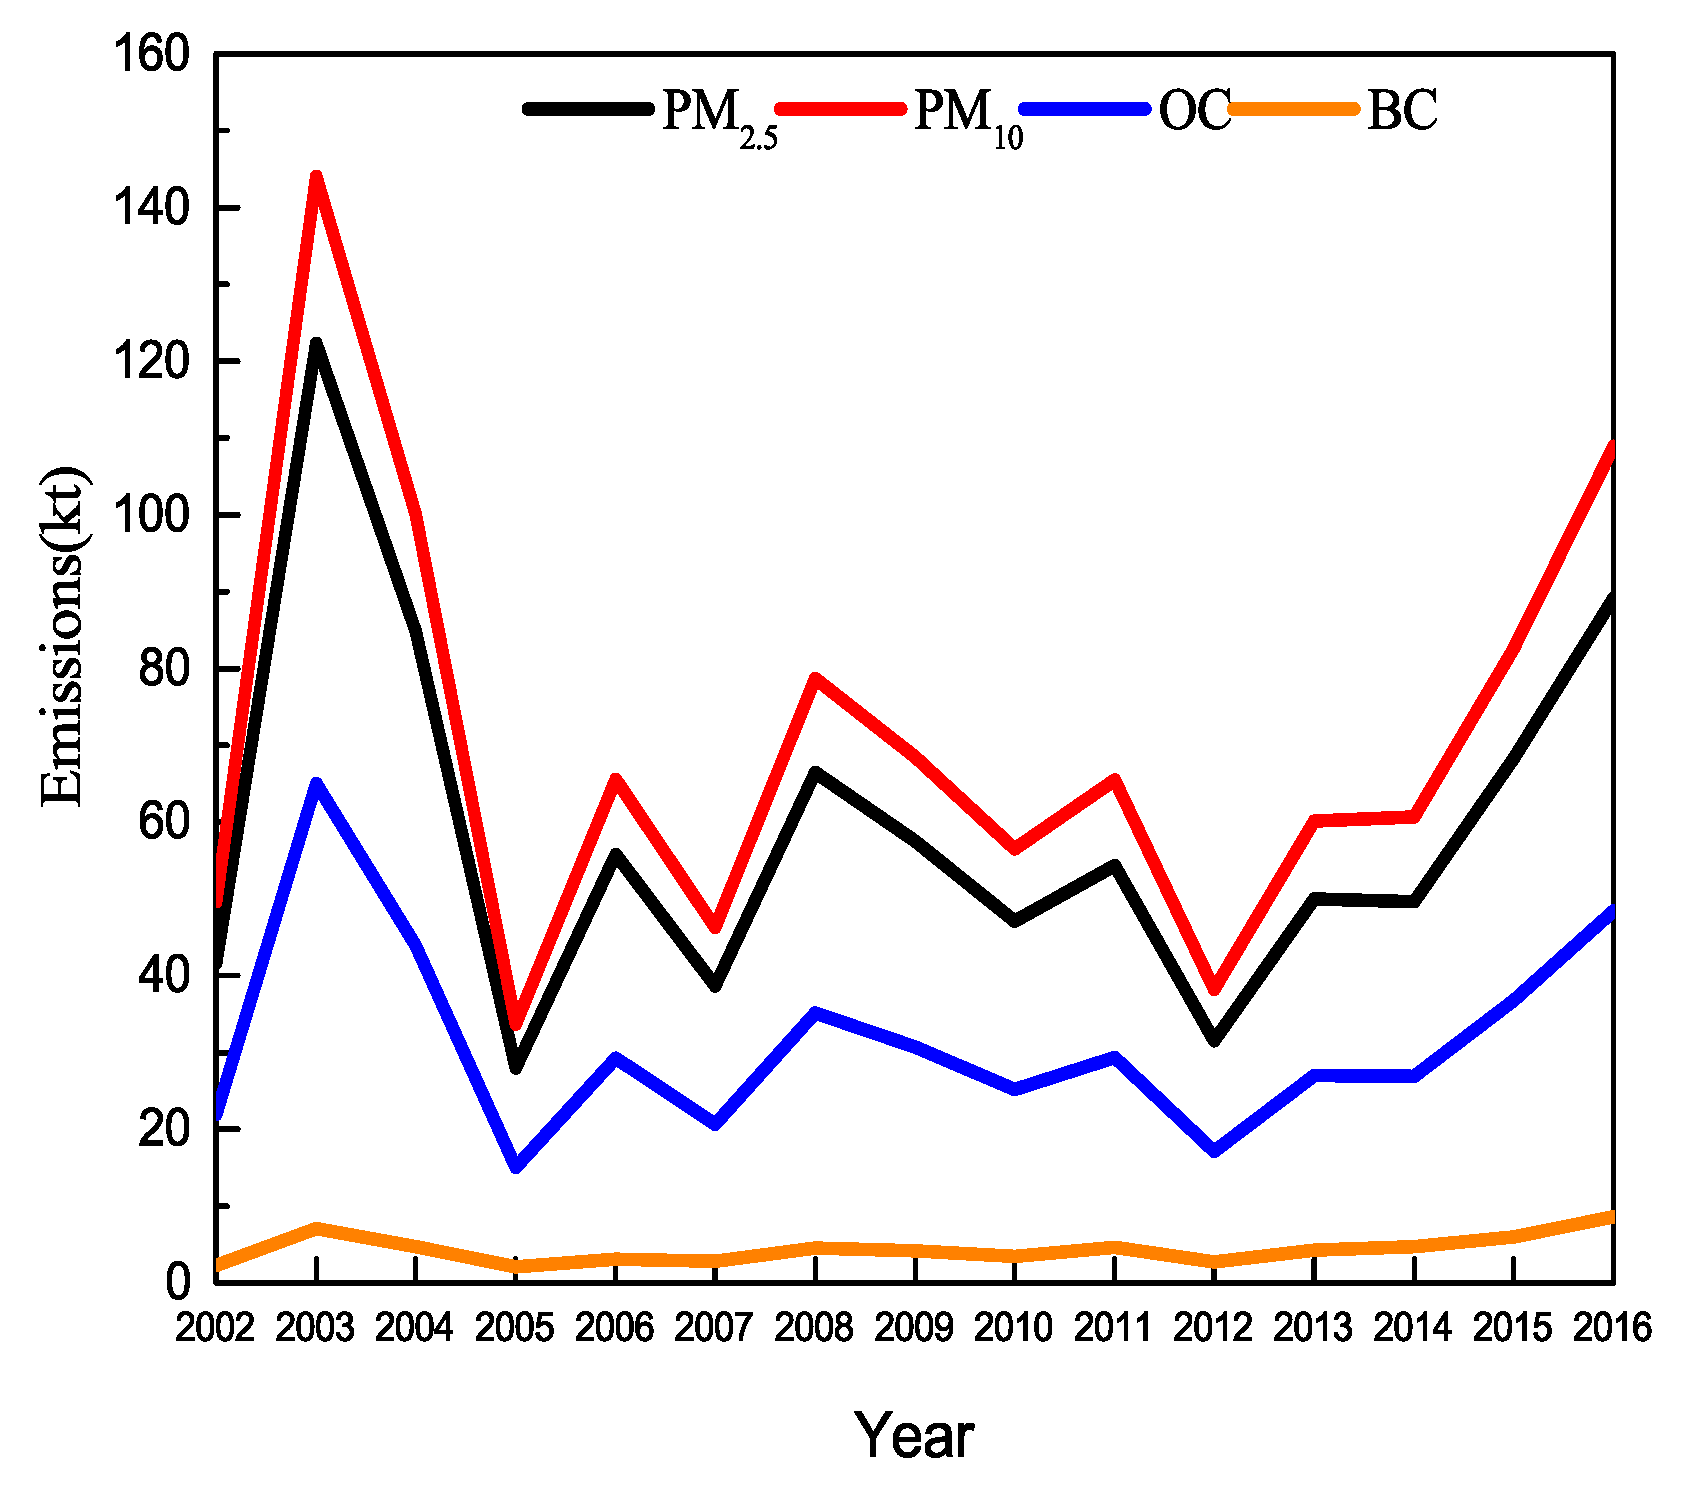
3.1.2. Inter-Annual Variations of Emissions

Capturing the inter-annual variability of open biomass burning emissions by using long-term sequence of FINN fire data is important to understanding environment change to [44], where PM10 and PM2.5 are particulate matters, respectively, with 10 micrometers or less and 2.5 micrometers or less in diameter. Figure 3 shows the inter-annual variations of PM2.5, PM10, OC, and BC emissions from fires in the NE region from 2002 to 2016. The PM2.5, PM10, OC, and BC emissions all exhibited significant inter-annual oscillations in amplitudes from 28.0 to 122.3, from 33.7 to 144.1, from 15.0 to 65.0, and from 2.1 to 8.6 kilotons, respectively. The strength of inter-annual variability could be defined by the ratio of the standard deviation of annual emissions to their average emissions for 15 years. The inter-annual variability strengths of emissions for PM2.5, PM10, OC, and BC were estimated as 40.4%, 39.8%, 40.0%, and 39.9%, respectively, with annual average emissions of 59.0, 70.6, 31.5, and 4.3 kilotons, respectively. From 2002 to 2012, the annual emissions of all PM presented a decreasing trend with fluctuations. The largest annual emissions happened in 2003 when the annual emissions of PM2.5, PM10, OC, and BC were 122.0, 144.0, 65.0 and 7.1 kilotons, respectively. From 2012, PM emissions increased continuously and significantly, reaching the next peak value of 15 years in 2016, when the annual emissions of PM2.5, PM10, OC, and BC were 89.2, 109.0, 48.5 and 8.6 kilotons, respectively. Since 2012, the NE region has experienced heavy pollution over five consecutive years. Open biomass burning emissions are a major cause of severe regional haze pollution in the autumn season [35]. Controlling biomass burning is crucial to improving the air quality in the NE region.
Land use changes are an important issue in ecological and environmental protection for sustainable development. During the processes of economic development and urbanization in the NE region from 2000 to 2015, the areas of land-use types with forestland and cropland in the NE region were estimated as about 4.9 × 10 5 km2 and 3.6 × 10 6 km2, accounting for 45% and 33% of the total area in Northeast China, and the area of cropland increased by about 2.9 × 10 3 km2 accounting for 0.3% of the NE-total cropland. Areas of forest and grassland decreased slightly—about 1.5 × 10 3 km2 and 1.3 × 10 3 km2, respectively—in Northeast China, accounting for −0.14% and −0.12% of the forest and grasslands, respectively (Table 1). These negligible percentages of area change rates in cropland, forestland and grassland with potential open fires in the NE-region over the past years indicate that land use changes could have less impact on the inter-annual variations in emissions of PM and associated carbonaceous aerosols from open biomass burning over the NE region.

3.2. Spatial Variations of Emissions in the NE Region

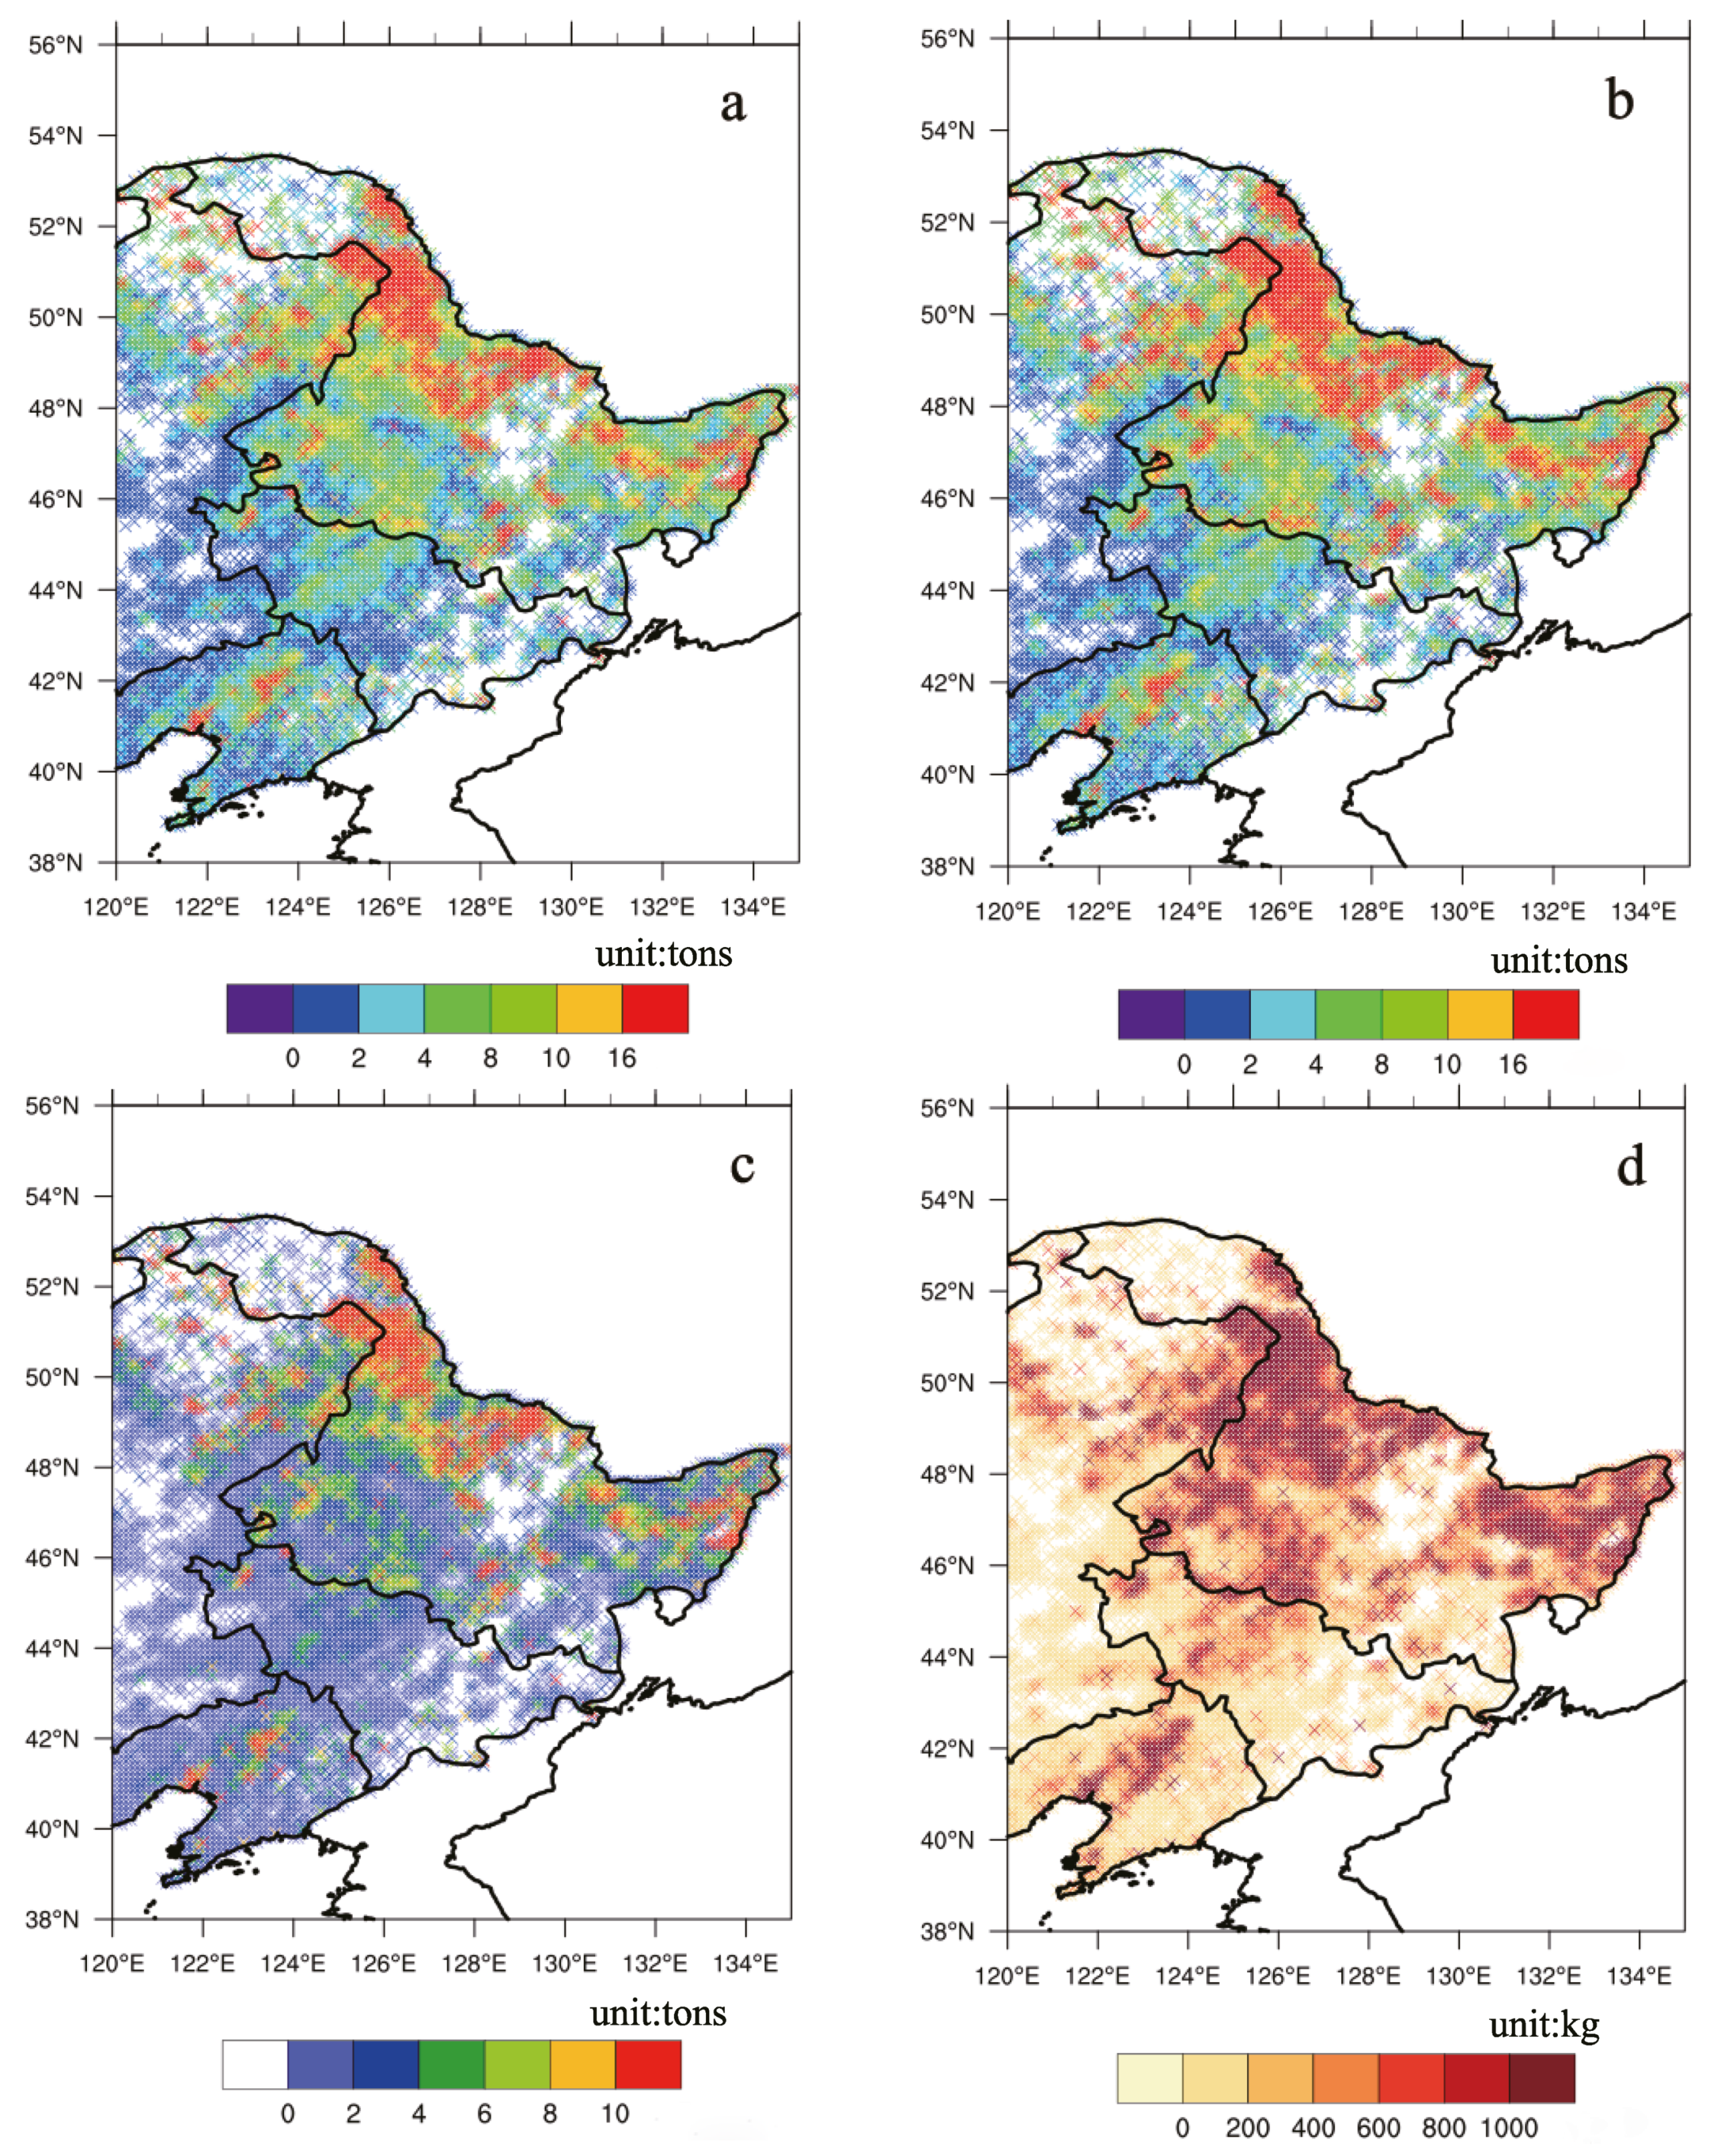
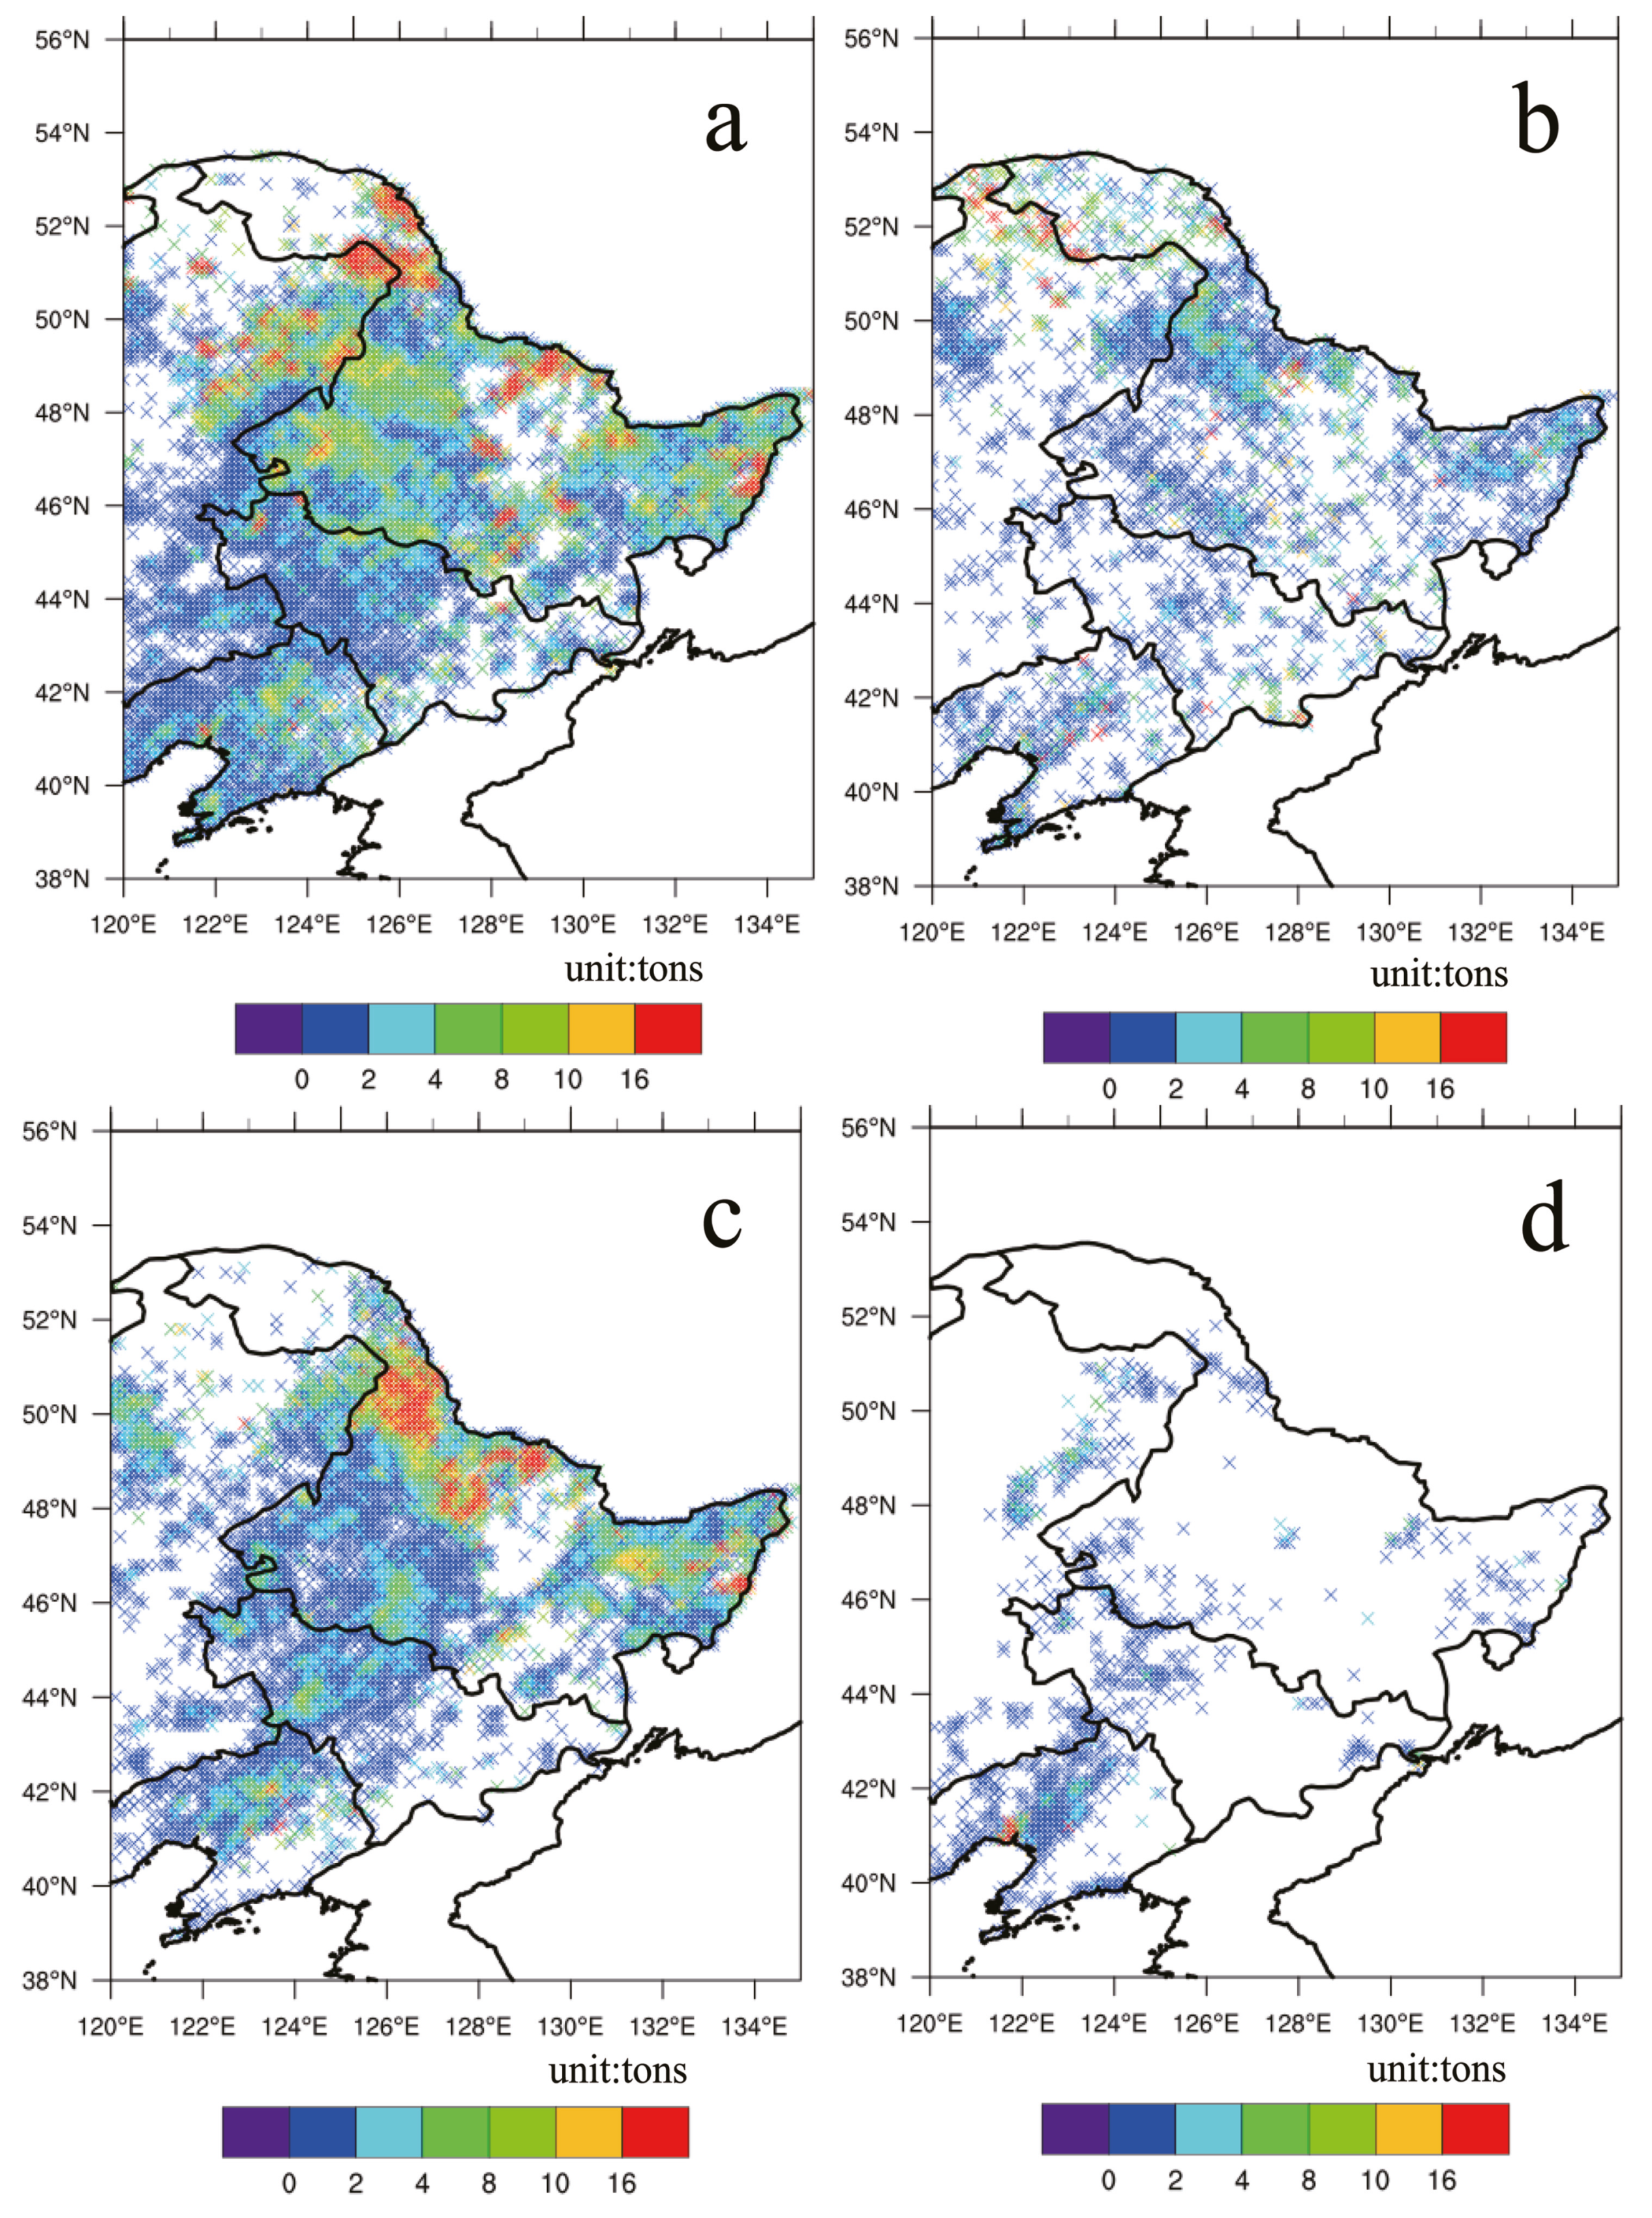
3.2.1. 15-Year Averages of Emissions

The NE region has abundant forest resources, where the forestland in Da Hinggan Ling and Xiao Hinggan Ling are the largest ecological forest and grassland areas in China. Cultivated lands are mostly located in Songnen Plain, Liaohe Plain, and Sanjiang Plain. Figure 4 shows the spatial distribution of annual PM2.5, PM10, OC, and BC emissions from open biomass burning in the NE region from 2002 to 2016. It can be seen that the high value areas of PM emissions were mainly located over Da Hinggan Ling in the northeast of IM, Xiao Hinggan Ling in the north of HLJ, and the Sanjiang Plain in the northeast of HLJ. The high emissions were mainly from natural fires, including forest fires and grassland fires. The Sanjiang Plain in the northeast of HLJ is the largest farmland area in China. The high PM emissions could be caused by both forest fires and agricultural burning. Another high PM emission area is in an arable agricultural area of the Manchurian Plain, a belt from northeast to southwest, including the southwestern part of HLJ, the Songnen Plain of west-central JL and the Liaohe Plain of south-central LN, where high PM emissions from open fires could be mainly related to human activities, such as crop straw burning.
Figure 5 presents the spatial distribution of seasonal PM2.5 emissions over the NE region, averaged over 2002–2016. The seasonal variations in open biomass burning emissions from forest and farmland exhibited high values in spring and autumn as well as low values in winter and summer. The obvious differences in high emissions between spring and autumn were located in western HLJ and Da Hinggan Ling in northeastern IM with emission centers being located over forestland in dry spring and over farmland in harvest autumn over the NE region. The largest forest fire in China in history occurred in the northern part of Da Hinggan Ling in the spring of 1987, with more than 133 hectares of forest burned during this fire [45].

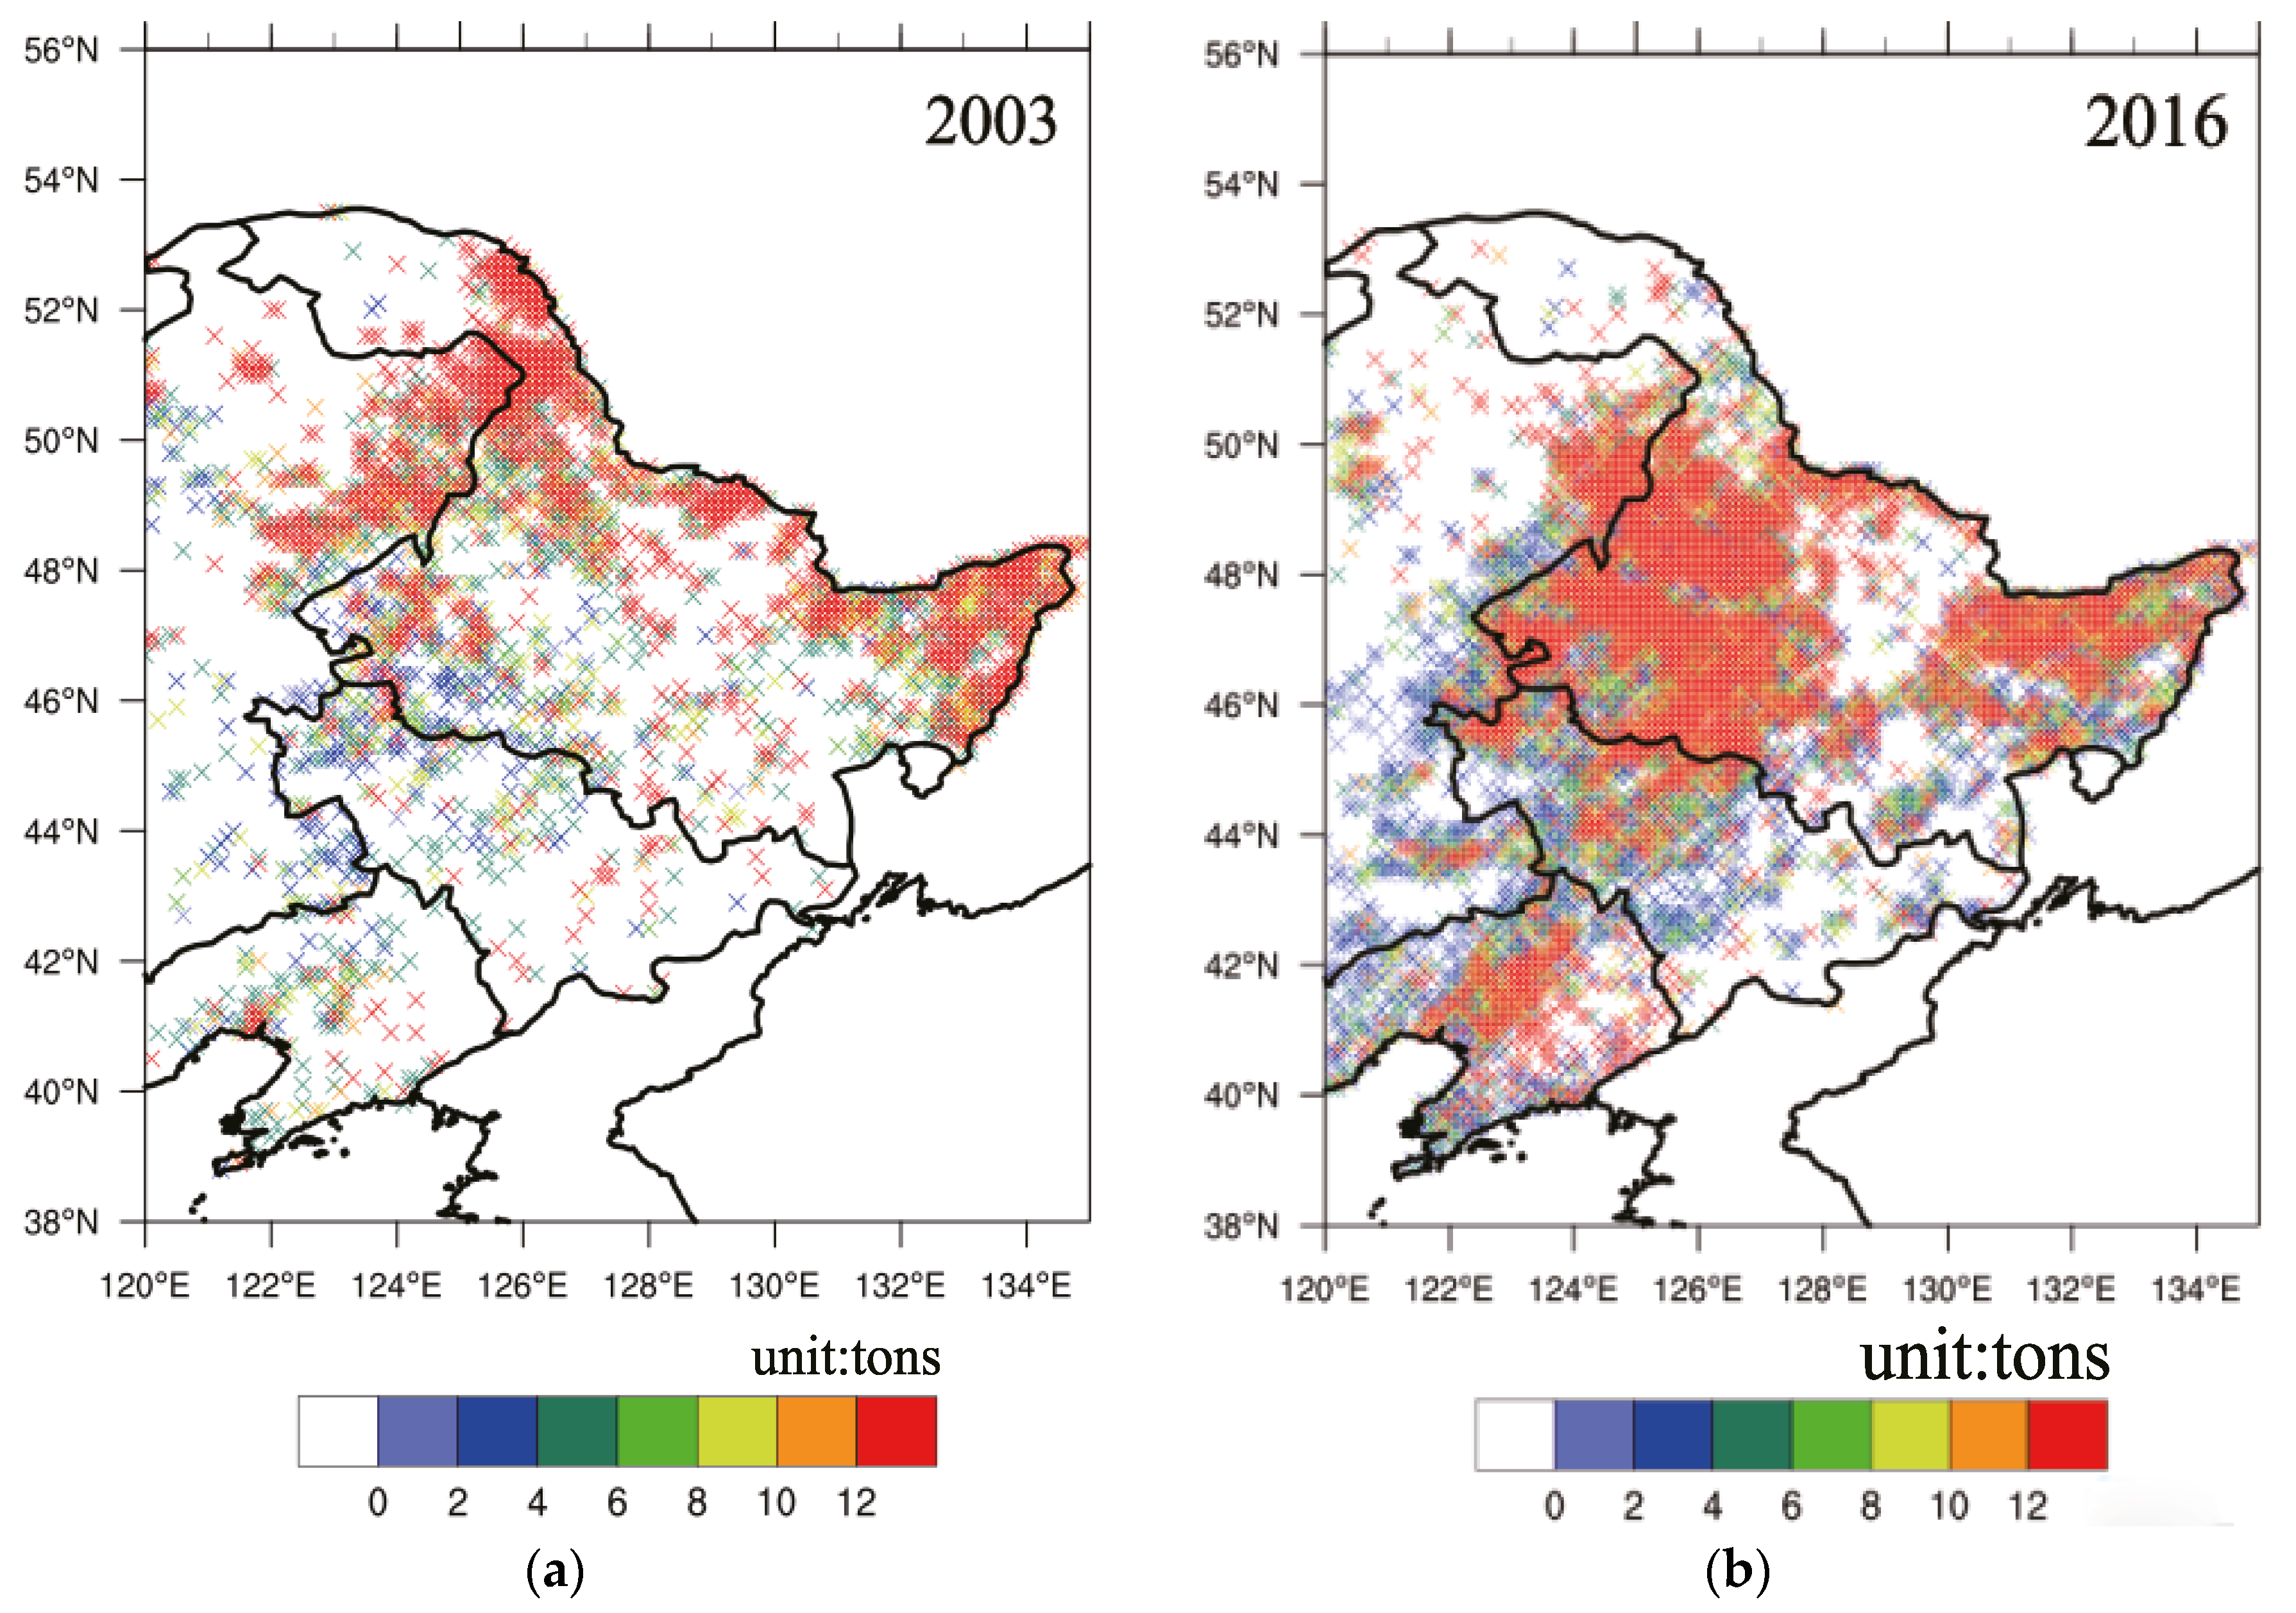
3.2.2. Differences of High PM Emissions between 2003 and 2016

Year 2003, which had the largest PM emissions from biomass burning, and year 2016, the second largest year, are selected for a comparison. Taking the PM2.5 emissions as an example, the differences of spatial distribution for the two high emission years are analyzed. Figure 6 shows the spatial distribution and monthly variations of PM2.5 emissions in 2003 and 2016. There are significant differences between the two years. Emissions from fires in the NE region are not only from straw burning, but also from forest and grassland fires, which can be distinguished by geographical locations of forestland and farmland. Obviously, the high value areas for PM emissions in 2003 were mainly located in the forestland of NE, centering in Da Hinggan Ling, Xiao Hinggan Ling and the Sanjiang Plain (Figure 6a) with a significant peak of regional emissions concentrated in spring (Figure 6c). There were much more forest fires over NE region in 2003, and heavy and severe fires occurred frequently, which accounted for 21.5% and 100% of the country’s total in 2003. The area of burnt forests in 2003 was 15.4 times that in 2002 (http://www. forestry.gov.cn/main/72/content-386085.html). However, in 2016, there was a shift in the area of high PM emissions to farmlands in the NE region. Unlike the area of high PM emissions over forestlands in 2003, PM emissions in 2016 are mainly released in the farmlands covering the southwest of HLJ, the Songnen Plain of the central west JL and the Liaohe Plain of the south-central LN (Figure 6b). In addition to spring, the PM emissions in the autumn of 2016 were much larger than that of 2003 (Figure 6c,d). In the autumn of 2003, the PM2.5 emissions from open biomass burning accounted for 4% of the annual emissions, while it was 27% in the autumn of 2016.

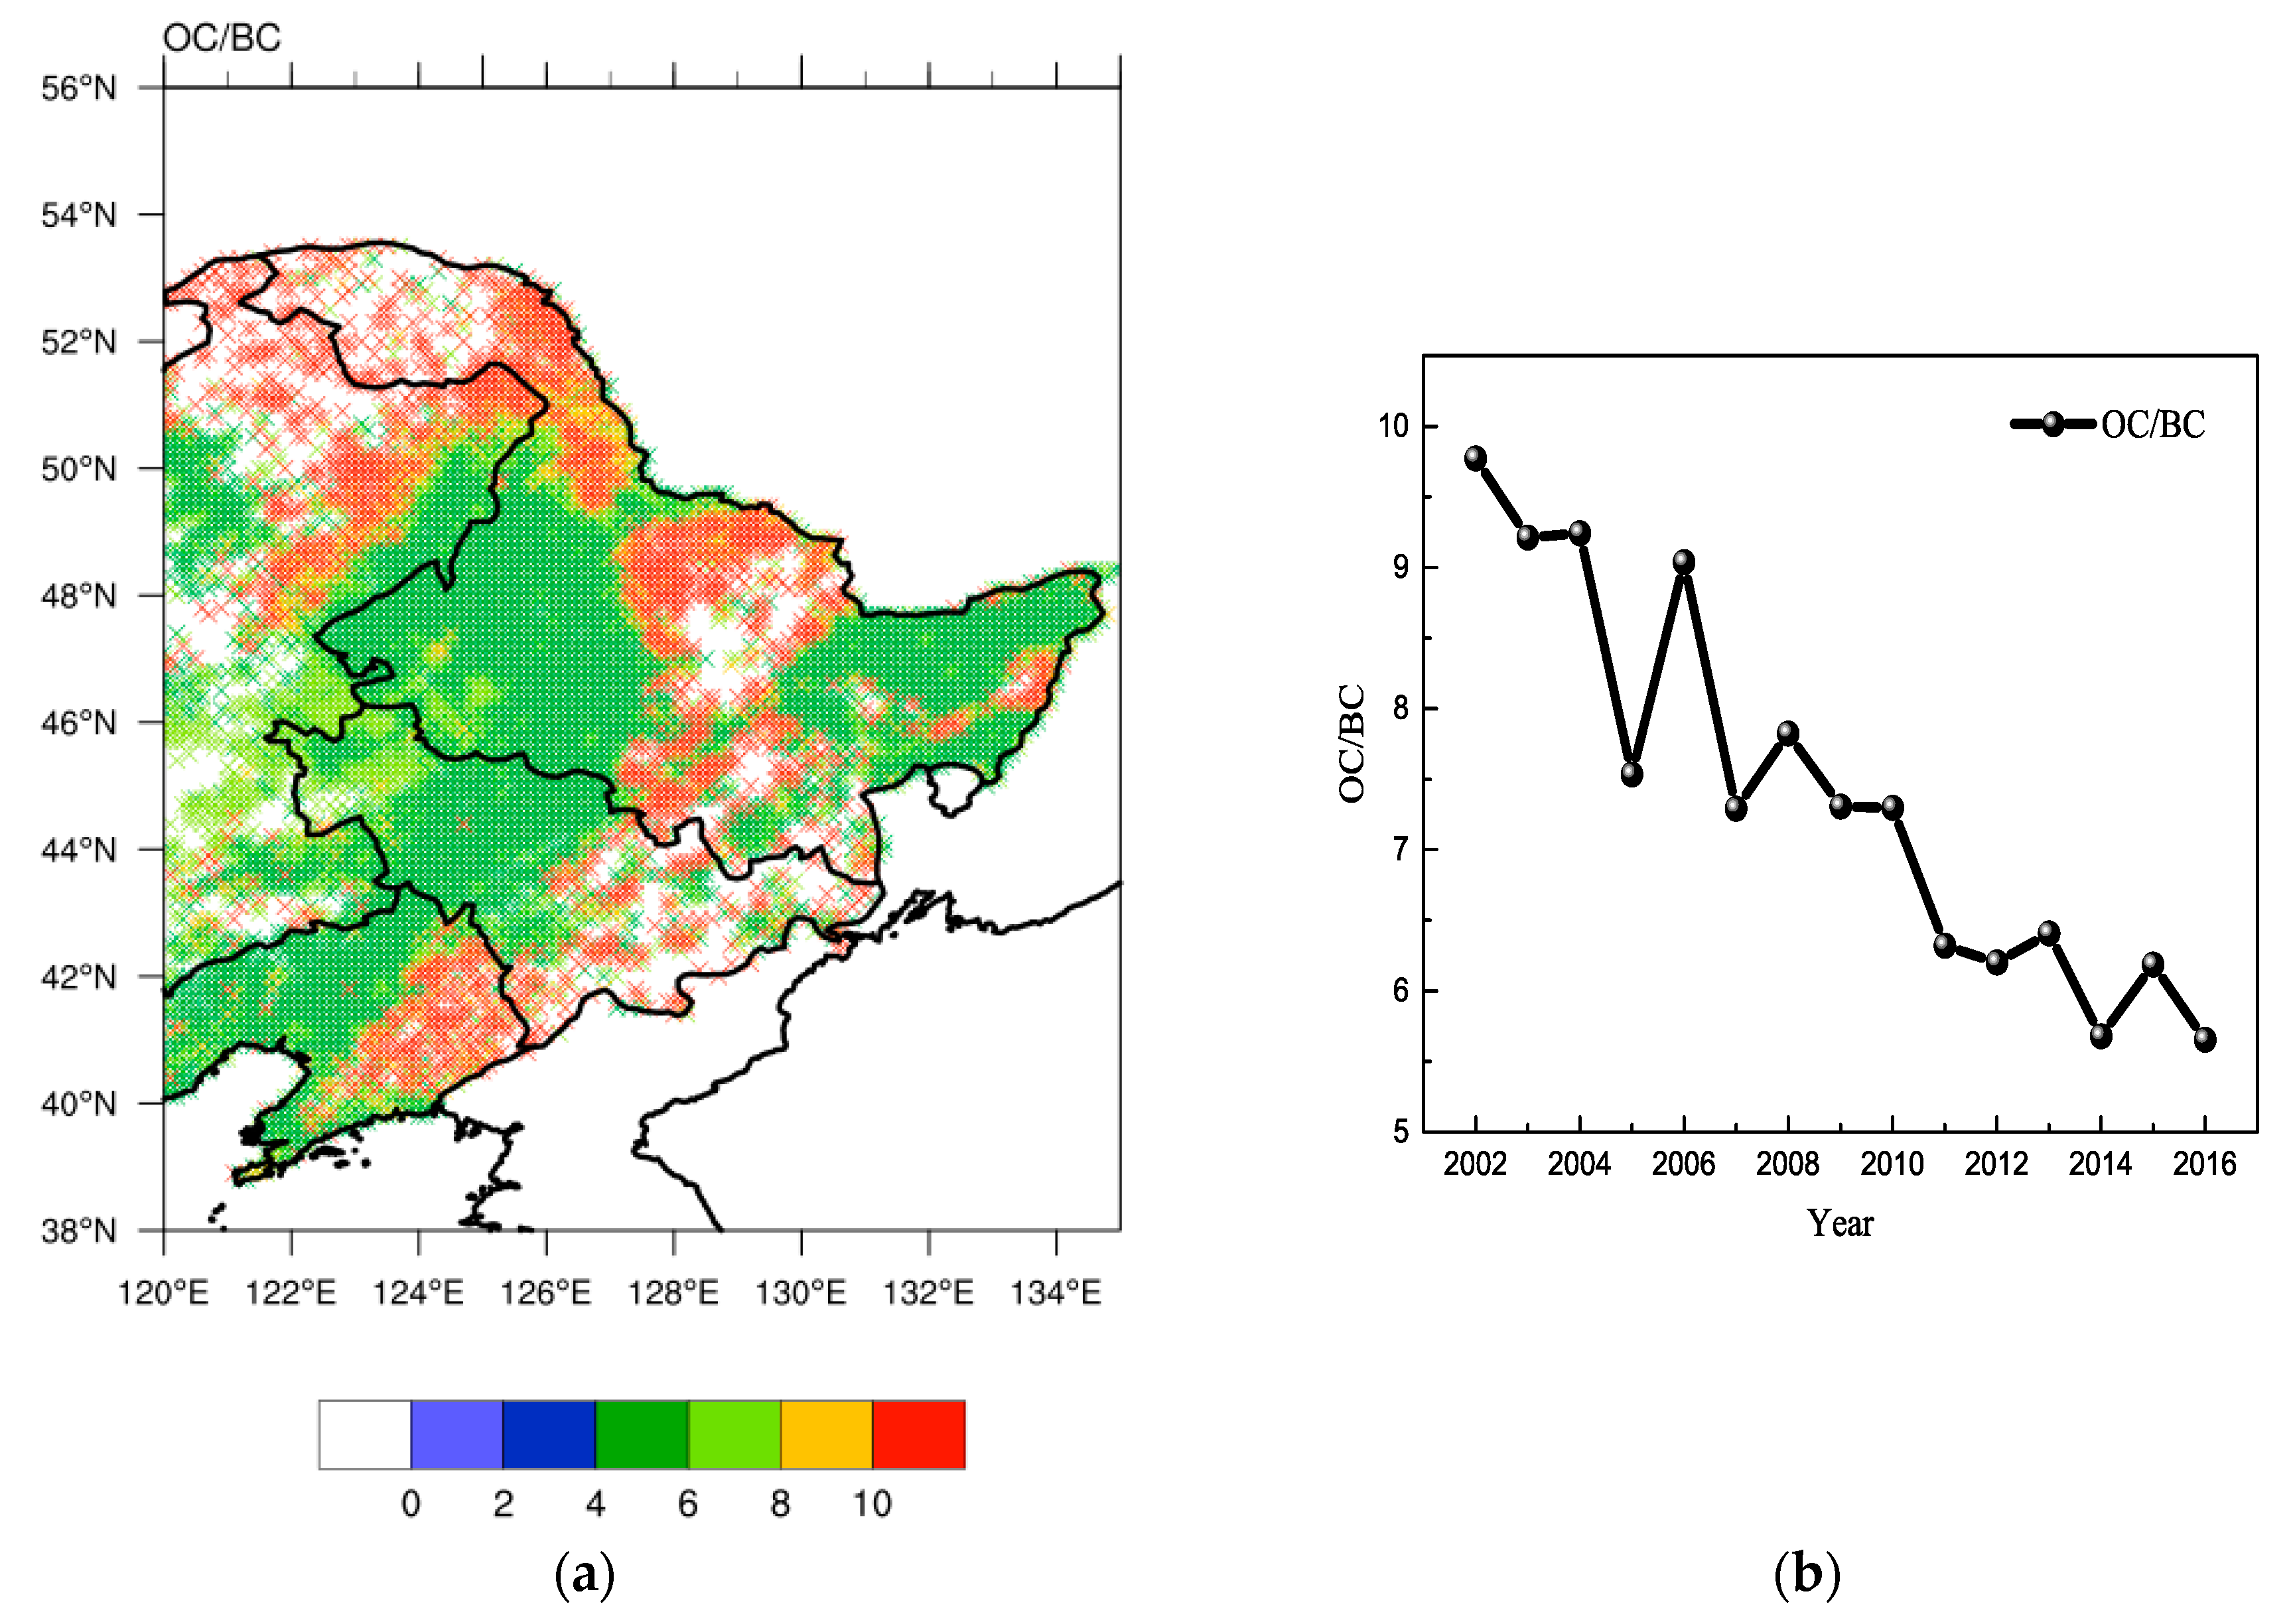
3.2.3. Changes of OC/BC Emission Ratio

Open biomass burning emissions are a major source of organic carbon (OC) and black carbon (BC) in the atmosphere [46,47]. The OC/BC ratios reflect different biomass burning processes [48]. As shown in Figure 7a, the OC/BC emission ratio is significantly different in forestlands and farmlands (Figure 1). On combining Figure 1 and Figure 7a, it was found that the OC/BC ratios were over 10 for natural emissions over forest areas and from 4 to 6 for anthropogenic emissions from agricultural activities over farmlands in the NE region. The right panel of Figure 7 shows the inter-annual change of OC/BC emission ratio in the NE region from 2002 to 2016. Regionally over NE, the OC/BC emission ratio experienced a decreasing trend during 2002–2016, and the OC/BC emission ratios decreased from 9.8 in 2002 to 5.5 in 2016 (Figure 7b), which indicates that the dominant emissions of particulate matters with open biomass burning in NE region shifted from natural sources over forestlands to anthropogenic sources over farmlands during 2002–2016. Emissions from crop straw burning has continuously increased over 15 years, which could be due to a decrease in farmers’ requirements for crop residue as cooking fuel and animal feed (primarily as a result of modernization and improvement in lifestyles) as well as owing to the fact that almost all crop residues were simply burned in farmlands [21]. It is thus suggested that policy makers implement effective legislations and take scientific measures to ban straw burning in a bid to cut down on anthropogenic emissions for the sustainable development of Northeast China.

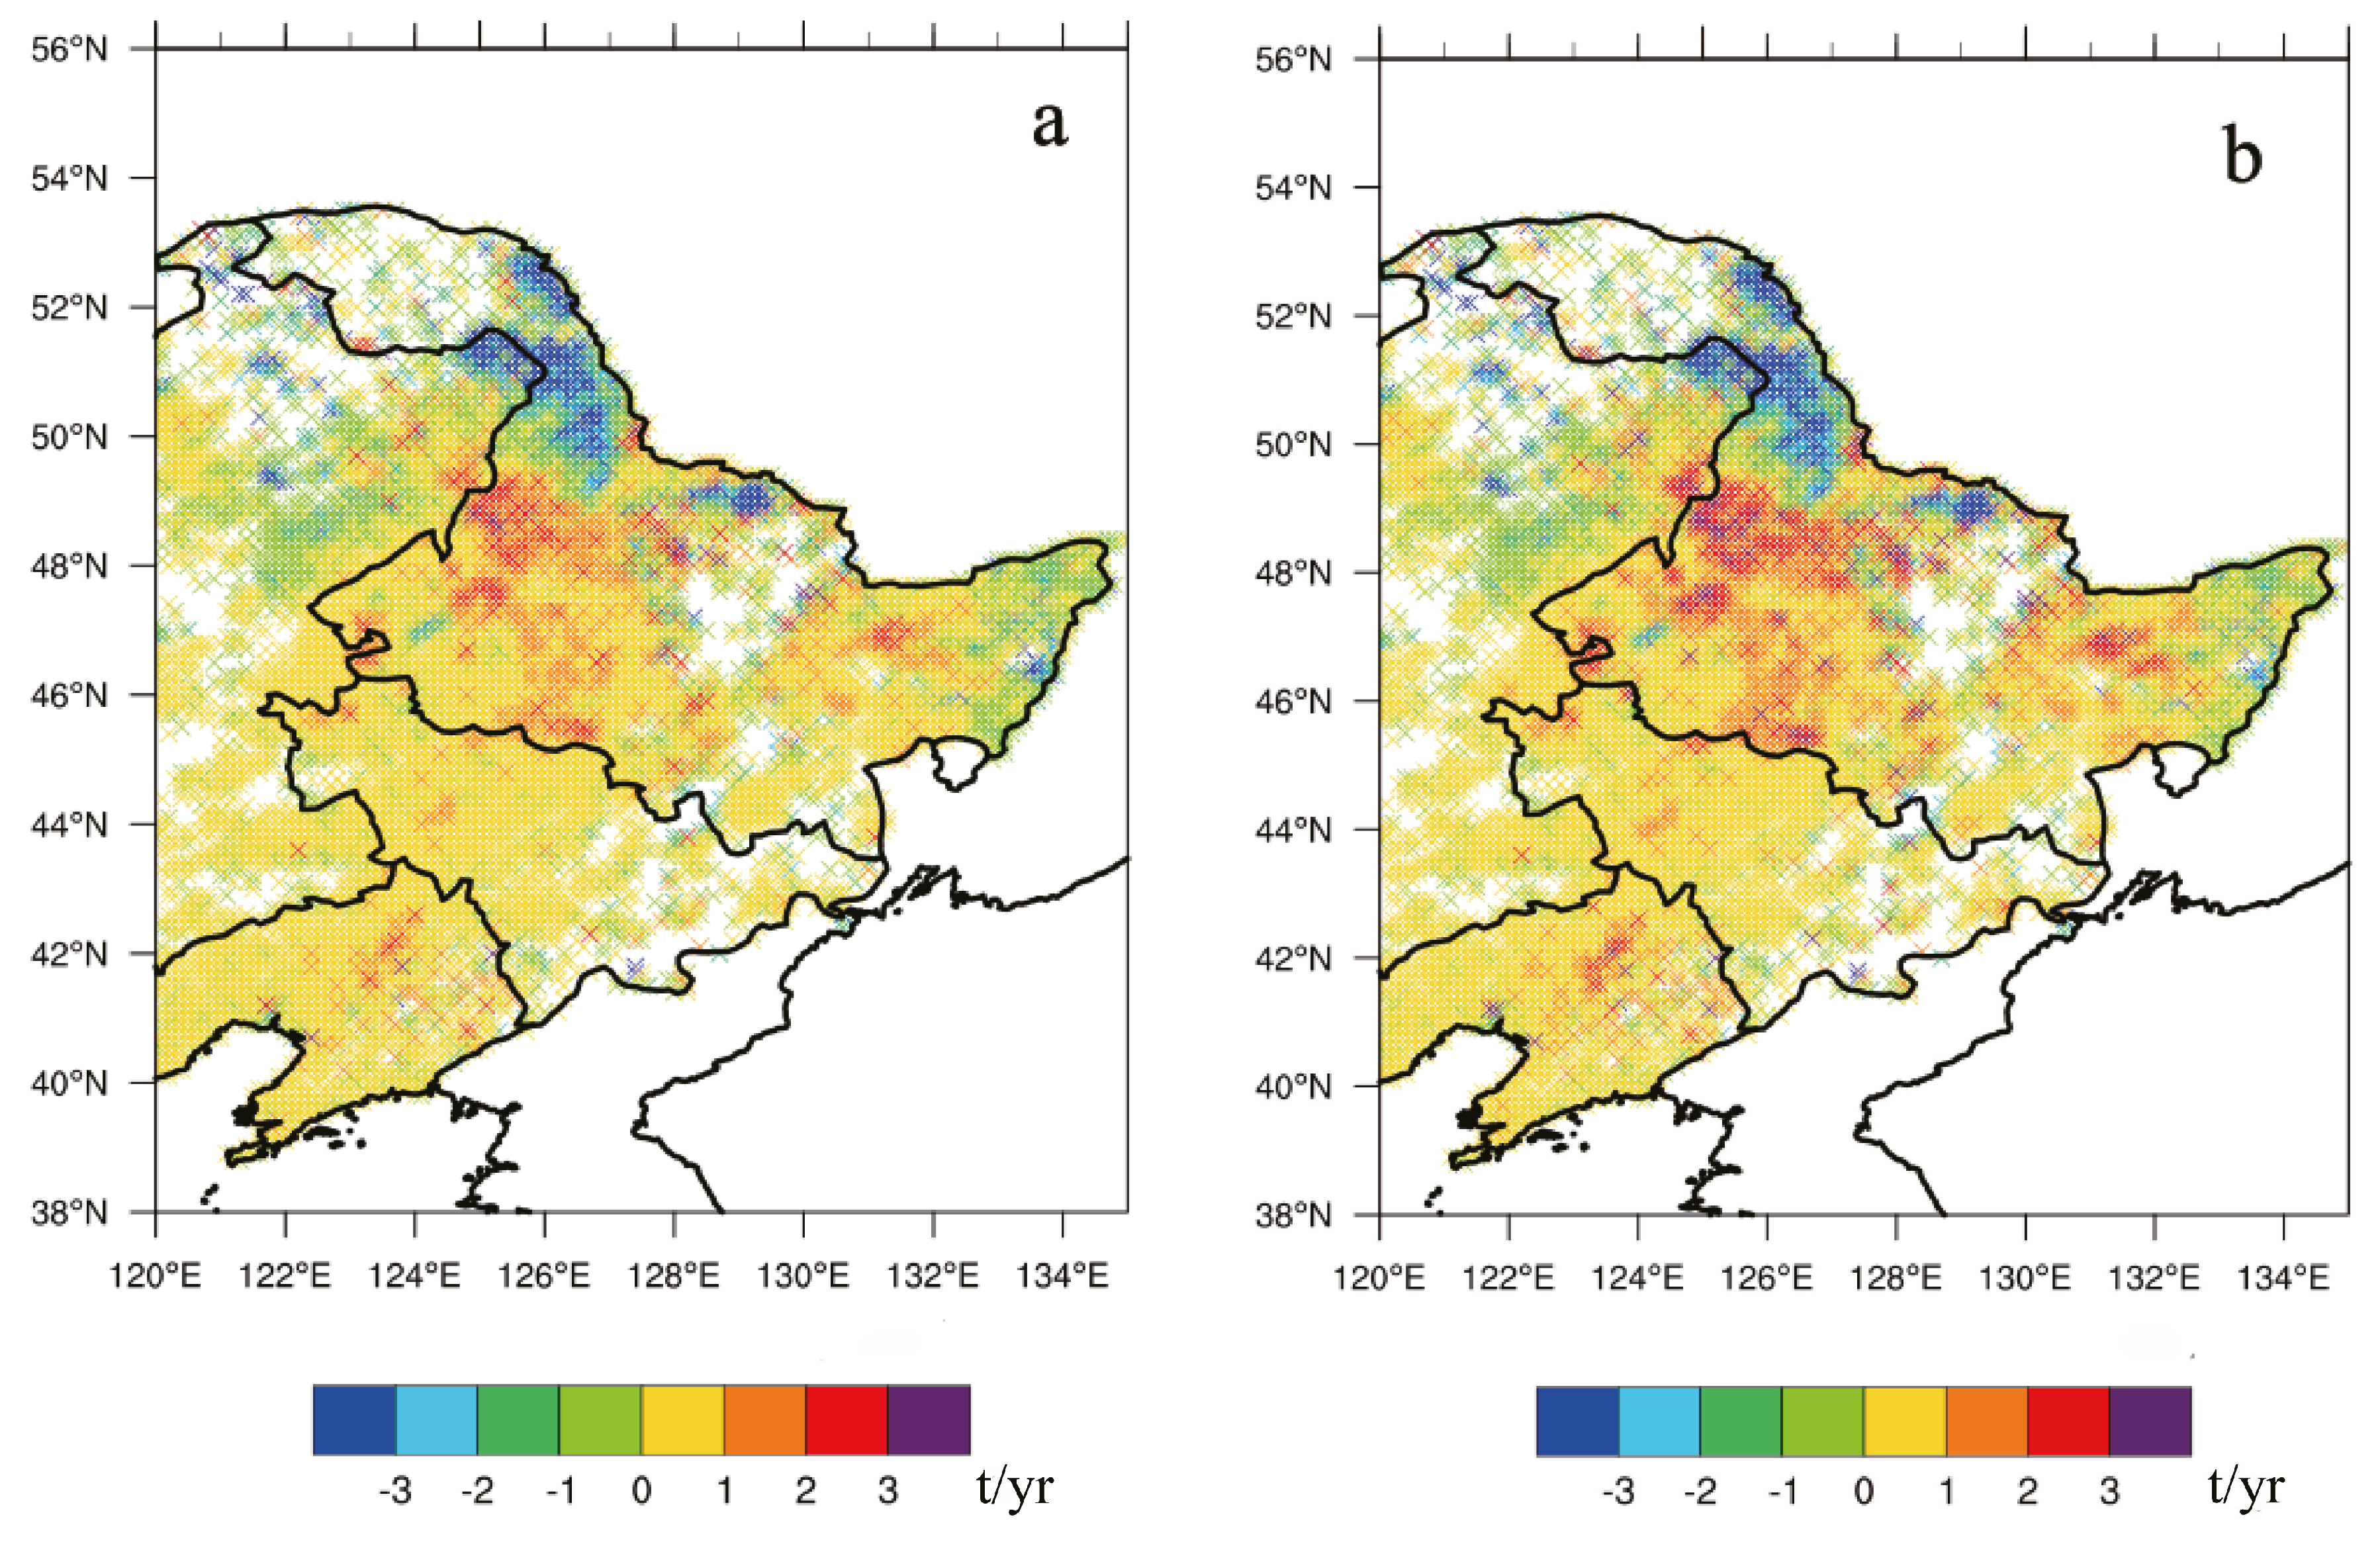
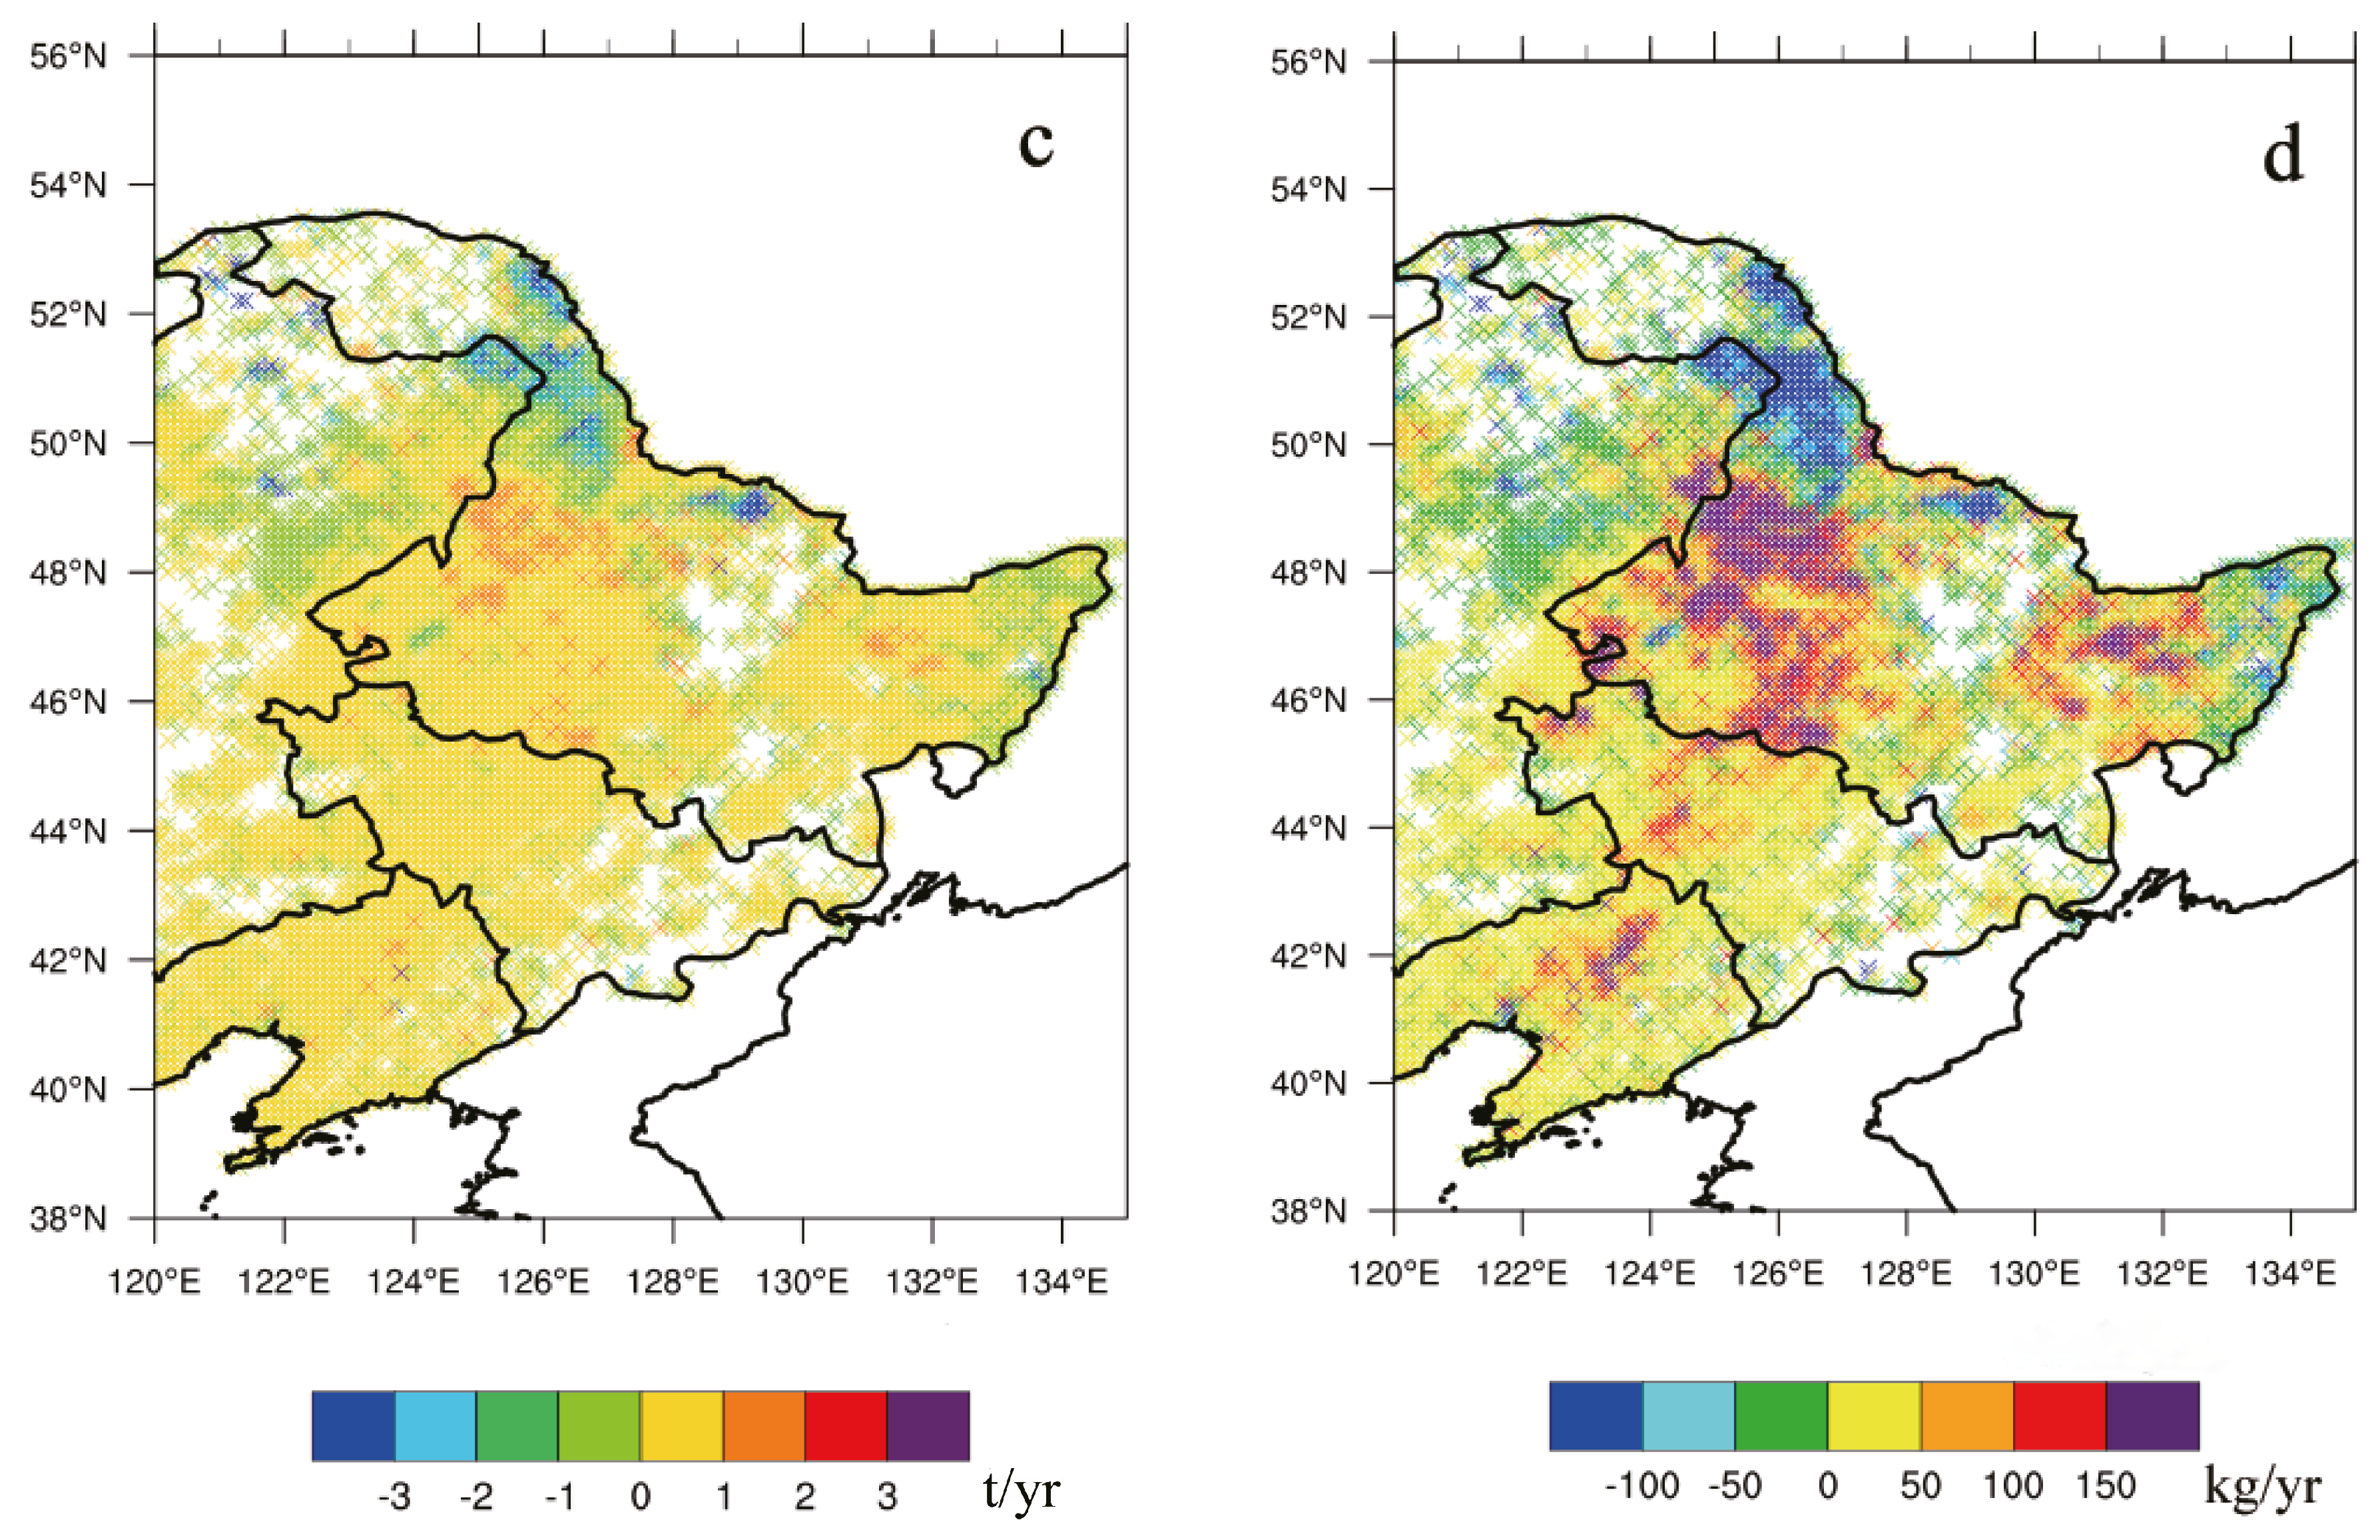
3.2.4. Spatial Distribution of Inter-Annual Emission Variations

By using Equations (1) and (2), we calculated the trends in inter-annual changes of PM and associated carbonaceous aerosol emissions from open biomass burning in the NE region from 2002 to 2016. Figure 8 shows the spatial distribution of inter-annual change trends in PM2.5, PM10, OC and BC emissions over NE. As illustrated in Figure 8, the declining trends in inter-annual variations of PM2.5, PM10, OC, and BC emissions were centered over the forestlands in Da Hinggan Ling, Xiao Hinggan Ling and the Sanjiang Plain in the northern NE region from 2002 to 2016. The PM2.5, PM10, OC, and BC emissions in Xiao Hinggan Ling and the surrounding area over the central-northern NE region decreased, respectively, at rates of about −3, −3, −1 tons per year and approximately 50 kilograms per year over the past 15 years. In sharp contrast to forest areas, the PM2.5, PM10, OC, and BC emissions from farmland fires mostly show increasing trends from 2002 to 2016. The PM2.5 and PM10 emissions generally increased at the rate of about 1 ton per year in the Northeast Plain with the strongest increase rates exceeding 3 tons per year in southwest HLJ. BC emissions in this area of farmlands was also enhanced, reaching up to 100 kg per year over 2002–2016.

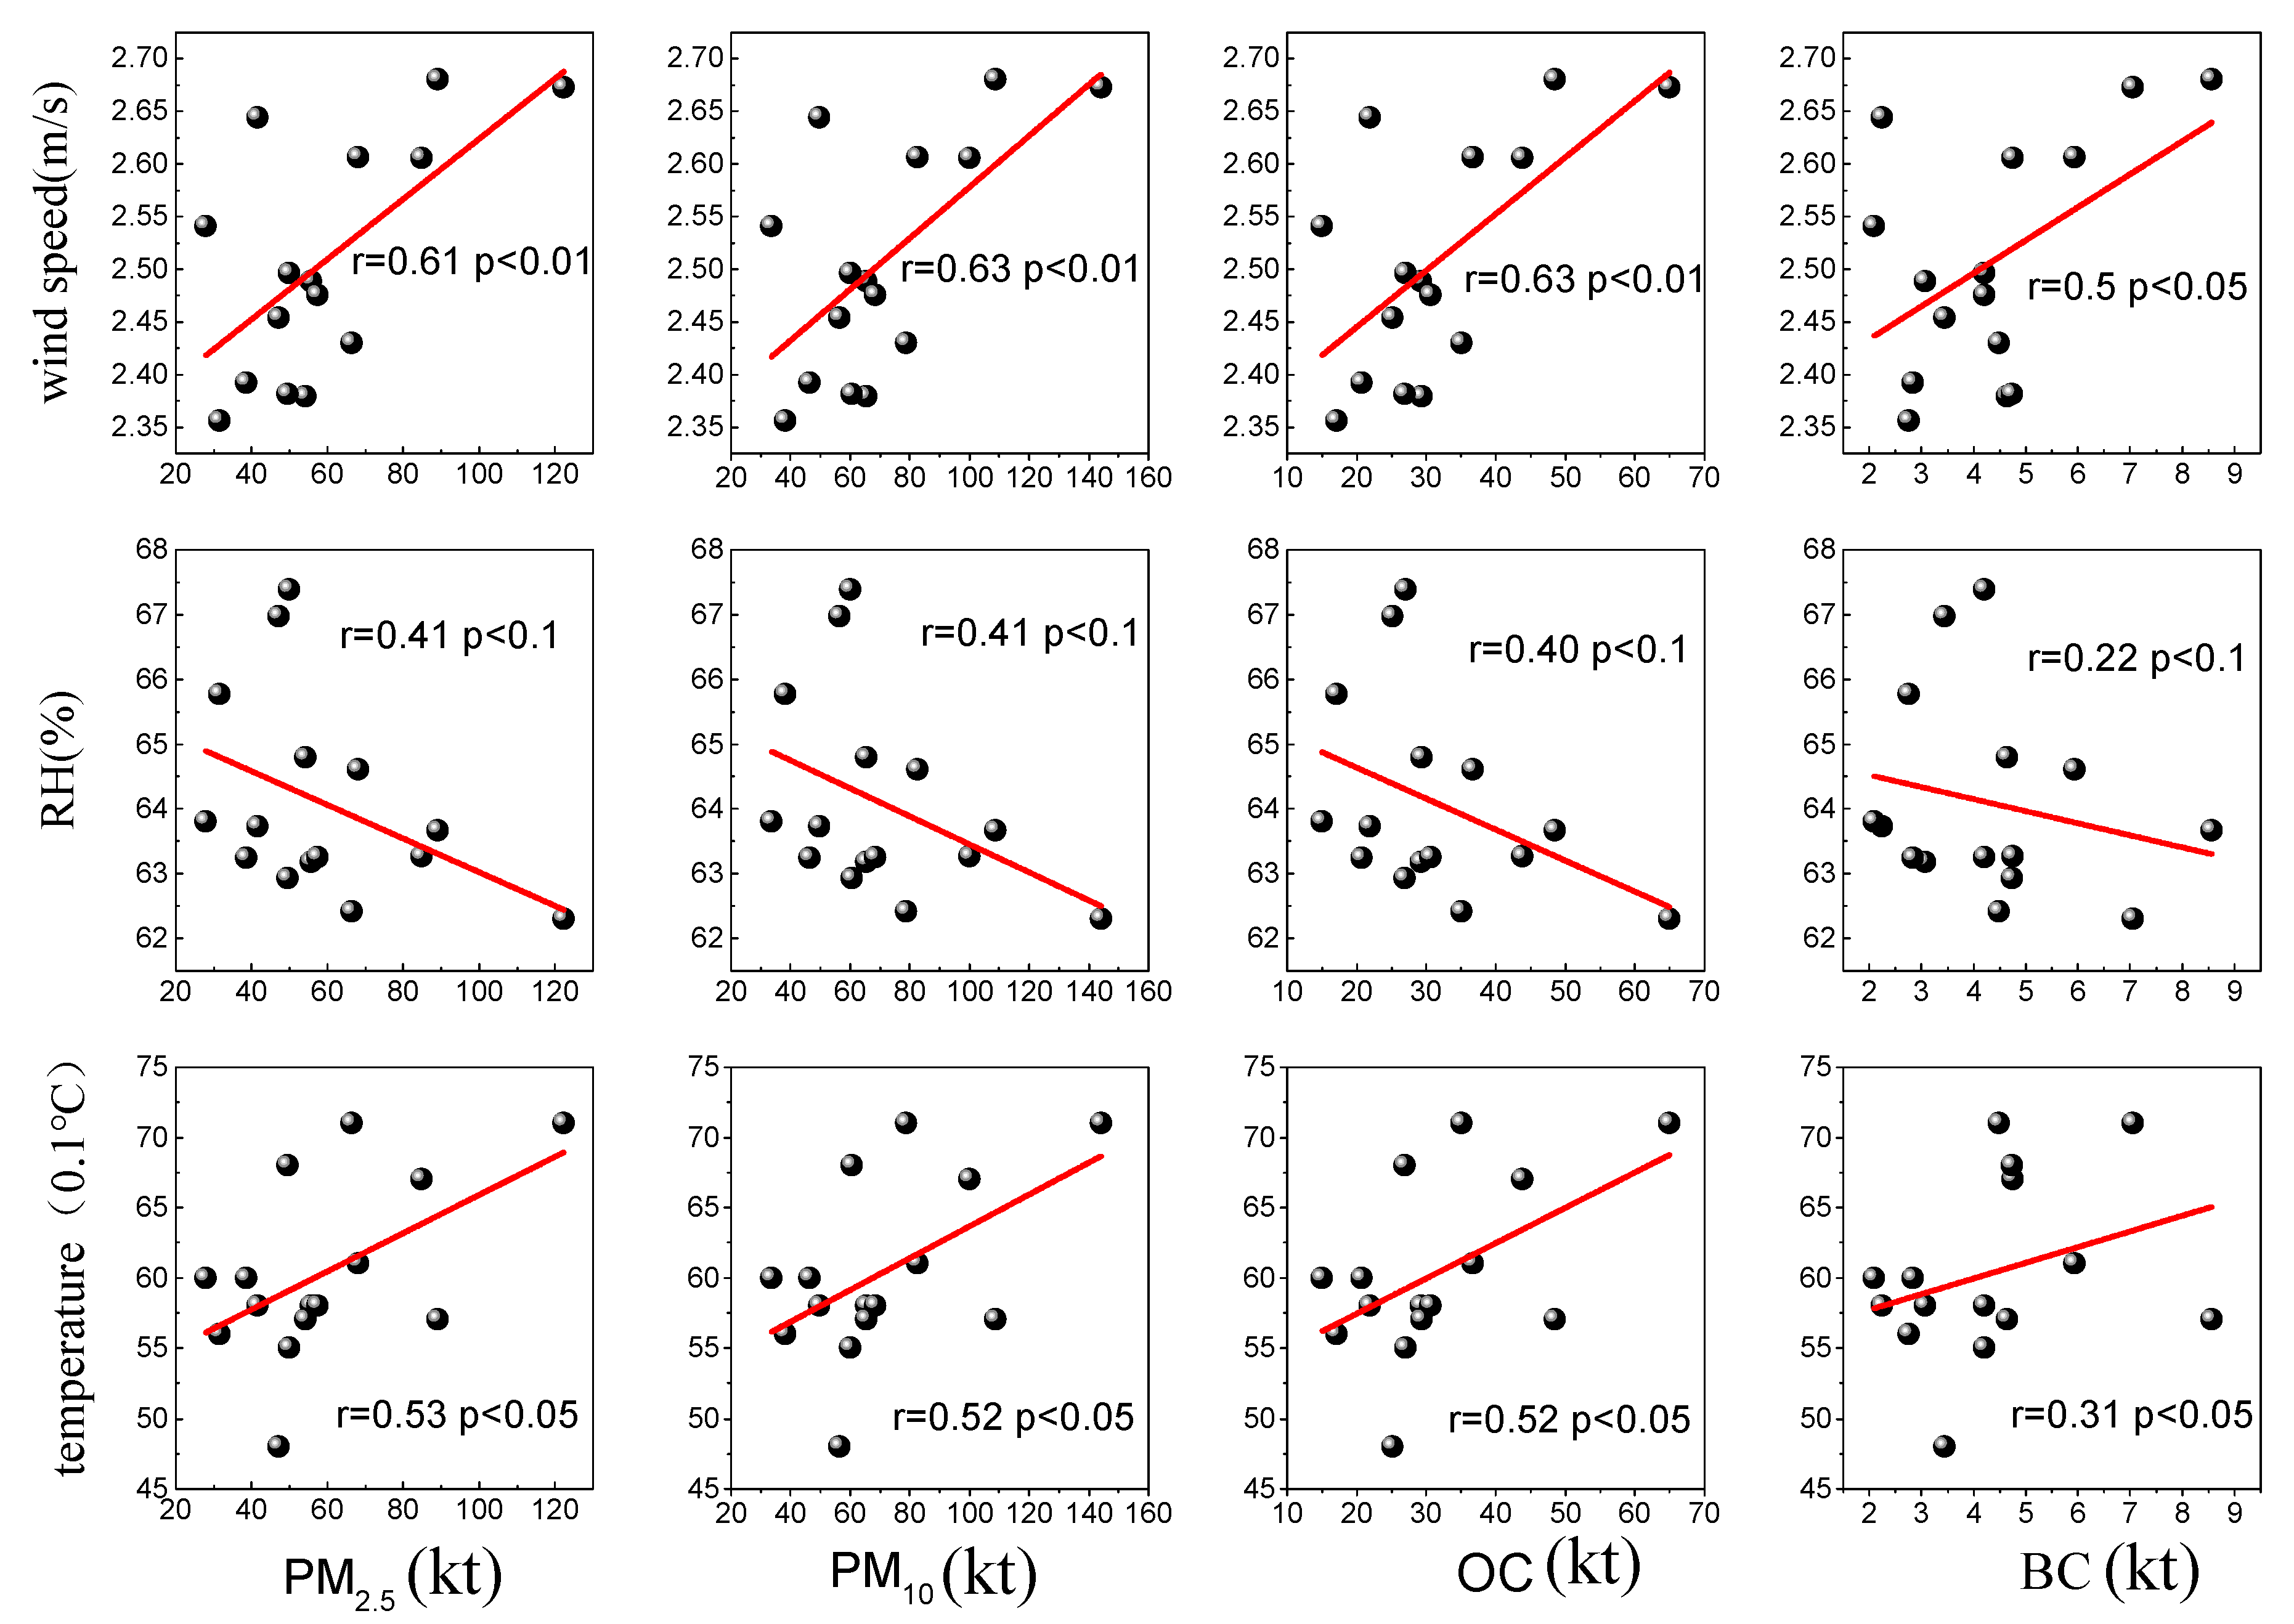
3.3. Key Meteorological Drivers in Emission Changes

The occurrence of open biomass burning events is closely related to meteorological factors, especially natural disasters such as forest fires and grassland fires, mostly occurring under adverse meteorological conditions like heavy lightning, prolonged drought, and strong winds [5,11,18]. We calculated the linear correlation coefficients of inter-annual variations between the FINN (PM2.5, PM10, OC, and BC) emissions and observed meteorological conditions (near-surface air pressure, temperature, relative humidity, precipitation, wind direction and speed) averaged over the NE region for 2002–2016 to understand the role of meteorological drivers in PM emissions from open biomass burning in the NE region. The changes in emissions from fires were influenced by both meteorological conditions and anthropogenic factors. These correlation coefficients between emissions and meteorological drivers could reflect the role of natural factors in variations of open fire emissions under changing regional climates. In our study, relative humidity, wind speed and air temperature were identified as key meteorological drivers affecting PM emission changes in NE with the high correlation coefficients passing significant tests. Figure 9 shows the correlation coefficients of inter-annual variations in NE, regional PM2.5, PM10, OC and BC emissions with near-surface relative humidity, wind speed and air temperature over 2002–2016. The correlation coefficients of PM2.5, PM10, OC, and BC emissions with relative humidity were respectively −0.41, −0.41, −0.4, and −0.22, with near-surface wind speed were 0.61, 0.63, 0.63, and 0.5, and with air temperature were 0.53, 0.52, 0.52, and 0.31 (Figure 9). In general, strong winds, low relative humidity, and high air temperature could drive the increase of emissions from open fires. With higher wind speeds, the fires could further spread, and the combustion range could be expanded with rapid increase in fire intensity. As a result, wind speed has a significant positive correlation to PM emissions from open fires. When ambient air relative humidity was relatively high, the probability of occurrence of open fires is low. Therefore, relative humidity has a significant negative correlation to PM emissions from fires. The significant positive correlations between air temperature and PM emissions could reflect the PM emissions enhanced by prolonged drought and heavy lightning in association with high air temperature. Moreover, as regional variations of meteorological factors are closely associated with climate change, NE regional changes in emissions of PM and associated carbonaceous aerosols could be influenced by global and regional climate changes.

4. Conclusions

Although the FINN emission dataset has uncertainties due to satellite overpass timing and cloud cover influencing the detection of fires as well as emission factors etc., it has been widely used in studies on atmospheric, environment, and air pollutant emissions. In this study based on the FINN dataset of emissions, the spatiotemporal variations of PM2.5, PM10, OC and BC emissions from open biomass burning in Northeast China from 2002 to 2016 were characterized. Meteorological data were used to explore the impacts of meteorological conditions on emissions of particulate matters and associated carbonaceous aerosols.
The 15-year averages of annual PM2.5, PM10, OC and BC emissions were estimated as 59.0, 70.6, 31.5, and 4.3 kilotons, respectively, from open biomass burning over Northeast China, where high emissions were concentrated in the forest and grasslands with natural fires, as well as over agricultural areas with crop straw burning from human activities. Particulate matter (PM2.5, PM10, OC and BC) emissions varied seasonally with the strongest emissions in spring, followed by autumn, summer and winter in Northeast China. Distinct inter-annual variations in PM2.5, PM10, OC and BC emissions oscillated in Northeast China during 2002–2016.
The emissions over forest areas presented decreasing trends, while the emissions over farmlands exhibited increasing trends in Northeast China during 2002–2016 with a declining trend in the inter-annual variation in ratio of regional OC/BC emissions, reflecting on the fact that the dominance of aerosol emissions of open fires shifted from forestland with natural fires to farmland with increasing biomass burning from anthropogenic activities.
Three key meteorological drivers—near surface wind, relative humidity and air temperatures—were identified as causes for changes of PM emissions over Northeast China, where strong near-surface wind speed, high air temperature and low relative humidity had significant positive impacts on the inter-annual variations of PM2.5, PM10, OC and BC emissions from open biomass burning. Because the regional variations of meteorological factors are closely associated with climate change, changes in emissions of PM and associated carbonaceous aerosols could also be influenced by it.
Research on how weather patterns contribute to haze pollution will be an interesting contribution to the topic, especially with regard to air pollutant concentrations in ambient air. Our present study is focused on the correlation of inter-annual variations between open fire emissions and meteorological drivers. The understanding of weather patterns on a synoptic scale could prompt future study on air pollutant emission changes. The influences of land use and climate changes on sustainability could also be further studied taking into consideration long-term data of meteorological and environmental observations.

Author Contributions

T.Z. and G.M. conceived and designed the study; G.M. analyzed the data and wrote the paper; T.Z., Y.B., S.K. and C.C. gave valuable comments and suggestions and carefully revised the manuscript; S.G. and J.G. offered advice on the study; C.Y., M.W., J.C. and Y.Y. participated in the discussion.

Funding

This study was jointly funded by National Key R & D Program Pilot Projects of China (2016YFC0203304), National Natural Science Foundation of China (91744209; 91644223; 91544109) and Key program for Environmental Protection of Jiangsu Province in 2015 (2015017).

Conflicts of Interest

The authors declare no conflict of interest.

References

  1. Crutzen, P.J.; Heidt, L.E.; Krasnec, J.P.; Pollock, W.H.; Seiler, W. Biomass burning as a source of atmospheric gases CO, H2, N2O, NO, CH3Cl and COS. Nature 1979, 282, 253–256. [Google Scholar] [CrossRef]
  2. Cofer, W.R.; Koutzenogii, K.P.; Kokorin, A.; Ezcurra, A. Biomass Burning Emissions and the Atmosphere. In Sediment Records of Biomass Burning and Global Change; Clark, J.S., Cachier, H., Goldammer, J.G., Stocks, B., Eds.; Springer: Berlin/Heidelberg, Germany, 1997; pp. 189–206. ISBN 978-3-642-63881-7. [Google Scholar]
  3. Zong, Z.; Wang, X.; Tian, C.; Chen, Y.; Qu, L.; Ji, L.; Zhi, G.; Li, J.; Zhang, G. Source apportionment of PM2.5 at a regional background site in North China using PMF linked with radiocarbon analysis: Insight into the contribution of biomass burning. Atmos. Chem. Phys. 2016, 16, 11249–11265. [Google Scholar] [CrossRef]
  4. Bond, T.C.; Streets, D.G.; Yarber, K.F.; Nelson, S.M.; Woo, J.-H.; Klimont, Z. A technology-based global inventory of black and organic carbon emissions from combustion. J. Geophys. Res. 2004, 109, D14203. [Google Scholar] [CrossRef]
  5. Crutzen, P.J.; Andreae, M.O. Biomass Burning in the Tropics: Impact on Atmospheric Chemistry and Biogeochemical Cycles. Science 1990, 250, 1669–1678. [Google Scholar] [CrossRef] [PubMed]
  6. Cachier, H.; Liousse, C.; Buat-Menard, P.; Gaudichet, A. Particulate content of savanna fire emissions. J. Atmos. Chem. 1995, 22, 123–148. [Google Scholar] [CrossRef]
  7. Deng, X.; Tie, X.; Wu, D.; Zhou, X.; Bi, X.; Tan, H.; Li, F.; Jiang, C. Long-term trend of visibility and its characterizations in the Pearl River Delta (PRD) region, China. Atmos. Environ. 2008, 42, 1424–1435. [Google Scholar] [CrossRef]
  8. Pope, C.A.; Dockery, D.W. Health effects of fine particulate air pollution: Lines that connect. J. Air Waste Manag. Assoc. 2006, 56, 709–742. [Google Scholar] [CrossRef] [PubMed]
  9. Heal, M.R.; Kumar, P.; Harrison, R.M. Particles, air quality, policy and health. Chem. Soc. Rev. 2012, 41, 6606–6630. [Google Scholar] [CrossRef] [PubMed] [Green Version]
  10. Zhang, H.; Hu, J.; Qi, Y.; Li, C.; Chen, J.; Wang, X.; He, J.; Wang, S.; Hao, J.; Zhang, L. Emission characterization, environmental impact, and control measure of PM2.5 emitted from agricultural crop residue burning in China. J. Clean. Prod. 2017, 149, 629–635. [Google Scholar] [CrossRef]
  11. Haywood, J.M.; Ramaswamy, V. Global sensitivity studies of the direct radiative forcing due to anthropogenic sulfate and black carbon aerosols. J. Geophys. Res. 1998, 103, 6043–6058. [Google Scholar] [CrossRef] [Green Version]
  12. Jacobson, M.Z. Control of fossil-fuel particulate black carbon and organic matter, possibly the most effective method of slowing global warming. J. Geophys. Res. 2002, 107, 4410. [Google Scholar] [CrossRef]
  13. Ichoku, C.; Kahn, R.; Chin, M. Satellite contributions to the quantitative characterization of biomass burning for climate modeling. Atmos. Res. 2012, 111, 1–28. [Google Scholar] [CrossRef] [Green Version]
  14. Duncan, B.N.; Martin, R.V.; Staudt, A.C.; Yevich, R.; Logan, J.A. Interannual and seasonal variability of biomass burning emissions constrained by satellite observations. J. Geophys. Res 2003, 108, 4040. [Google Scholar] [CrossRef]
  15. Van der Werf, G.R.; Randerson, J.T.; Giglio, L.; Collatz, G.J.; Kasibhatla, P.S.; Arellano, A.F., Jr. Interannual variability in global biomass burning emissions from 1997 to 2004. Atmos. Chem. Phys. 2006, 6, 3423–3441. [Google Scholar] [CrossRef] [Green Version]
  16. Bossioli, E.; Tombrou, M.; Kalogiros, J.; Allan, J.; Bacak, A.; Bezantakos, S.; Biskos, G.; Coe, H.; Jones, B.T.; Kouvarakis, G. Atmospheric composition in the Eastern Mediterranean: Influence of biomass burning during summertime using the WRF-Chem model. Atmos. Environ. 2016, 132, 317–331. [Google Scholar] [CrossRef]
  17. Streets, D.G.; Yarber, K.F.; Woo, J.-H.; Carmichael, G.R. Biomass burning in Asia: Annual and seasonal estimates and atmospheric emissions. Glob. Biogeochem. Cycles 2003, 17, 1099. [Google Scholar] [CrossRef]
  18. Sahu, L.K.; Sheel, V.J. Spatio-temporal variation of biomass burning sources over South and Southeast Asia. J. Atmos. Chem. 2014, 71, 1–19. [Google Scholar] [CrossRef]
  19. Zhou, Y.; Xing, X.; Lang, J.; Chen, D.; Cheng, S.; Wei, L.; Wei, X.; Liu, C. A comprehensive biomass burning emission inventory with high spatial and temporal resolution in China. Atmos. Chem. Phys. 2017, 17, 2839–2864. [Google Scholar] [CrossRef]
  20. Li, X.; Wang, S.; Duan, L.; Hao, J.; Li, C.; Chen, Y.; Yang, L. Particulate and Trace Gas Emissions from Open Burning of Wheat Straw and Corn Stover in China. Environ. Sci. Technol. 2007, 41, 6052–6058. [Google Scholar] [CrossRef] [PubMed]
  21. Wu, J.; Kong, S.; Wu, F.; Cheng, Y.; Zheng, S.; Yan, Q.; Zheng, H.; Yang, G.; Zheng, M.; Liu, D.; et al. Estimating the open biomass burning emissions in central and eastern China from 2003 to 2015 based on satellite observation. Atmos. Chem. Phys. 2018, 18, 11623–11646. [Google Scholar] [CrossRef]
  22. Li, J.; Li, Y.; Bo, Y.; Xie, S. High-resolution historical emission inventories of crop residue burning in fields in China for the period 1990–2013. Atmos. Environ. 2016, 138, 152–161. [Google Scholar] [CrossRef]
  23. Zheng, X.; Liu, X.; Zhao, F.; Duan, F.; Yu, T.; Cachier, H. Seasonal characteristics of biomass burning contribution to Beijing aerosol. Sci. China Ser. B Chem. 2005, 48, 481–488. [Google Scholar] [CrossRef]
  24. Duan, F.; Yu, L.T.; Cachier, H. Identification and estimate of biomass burning contribution to the urban aerosol organic carbon concentrations in Beijing. Atmos. Environ. 2004, 38, 1275–1282. [Google Scholar] [CrossRef]
  25. Wang, Q.; Cao, J.; Shen, Z.; Tao, J.; Xiao, S.; Luo, L.; He, Q.; Tang, X. Chemical characteristics of PM2.5 during dust storms and air pollution events in Chengdu, China. Particuology 2013, 11, 70–77. [Google Scholar] [CrossRef]
  26. Yang, Y.; Chan, C.; Tao, J.; Lin, M.; Engling, G.; Zhang, Z.; Zhang, T.; Su, L. Observation of elevated fungal tracers due to biomass burning in the Sichuan Basin at Chengdu city, China. Sci. Total Environ. 2012, 431, 68–77. [Google Scholar] [CrossRef] [PubMed]
  27. Zhao, H.M.; Zhang, X.L.; Zhang, S.C.; Chen, W.W.; Tong, D.Q.; Xiu, A.J. Effects of Agricultural Biomass Burning on Regional Haze in China: A Review. Atmosphere 2017, 8, 88. [Google Scholar] [CrossRef]
  28. Cheng, Z.; Wang, S.; Fu, X.; Watson, J.G.; Jiang, J.; Fu, Q.; Chen, C.; Xu, B.; Yu, J.; Chow, J.C.; et al. Impact of biomass burning on haze pollution in the Yangtze River delta, China: A case study in summer 2011. Atmos. Chem. Phys. 2014, 14, 4573–4585. [Google Scholar] [CrossRef] [Green Version]
  29. Yamaji, K.; Li, J.; Uno, I.; Kanaya, Y.; Irie, H.; Takigawa, M.; Komazaki, Y.; Pochanart, P.; Liu, Y.; Tanimoto, H.; et al. Impact of open crop residual burning on air quality over Central Eastern China during the Mount Tai Experiment 2006 (MTX2006). Atmos. Chem. Phys. 2010, 10, 7353–7368. [Google Scholar] [CrossRef] [Green Version]
  30. Chen, W.W.; Tong, D.Q.; Dan, M.; Zhang, S.C.; Zhang, X.L.; Pan, Y.P. Typical atmospheric haze during crop harvest season in northeastern China: A case in the Changchun region. J. Environ. Sci. 2017, 54, 101–113. [Google Scholar] [CrossRef] [PubMed]
  31. Huang, X.; Li, M.; Friedli, H.R.; Song, Y.; Chang, D.; Zhu, L. Mercury Emissions from Biomass Burning in China. Environ. Sci. Technol. 2011, 45, 9442–9448. [Google Scholar] [CrossRef] [PubMed]
  32. Kong, F.H.; Li, X.Z.; Zhao, S.L.; Yin, H.W. Research advance in forest restoration on the burned blanks. J. For. Res. 2003, 14, 180–184. [Google Scholar] [CrossRef]
  33. Lawrence, C.C.K.; Avelino, F.A.; John, L.M. Investigating the haze transport from 1997 biomass burning in Southeast Asia: Its impact upon Singapore. Atmos. Environ. 2001, 35, 2723–2734. [Google Scholar] [CrossRef]
  34. Nie, W.; Ding, A.J.; Xie, Y.N.; Xu, Z.; Mao, H.; Kerminen, V.M.; Zheng, L.F.; Qi, X.M.; Huang, X.; Yang, X.Q.; et al. Influence of biomass burning plumes on HONO chemistry in eastern China. Atmos. Chem. Phys. 2015, 15, 1147–1159. [Google Scholar] [CrossRef] [Green Version]
  35. Wang, Y.; Zhuang, G.S.; Tang, A.H.; Yuan, H.; Sun, Y.L.; Chen, S.; Zheng, A.H. The ion chemistry and the source of PM2.5 aerosols in Beijing. Atmos. Environ. 2005, 39, 3771–3784. [Google Scholar] [CrossRef]
  36. Zhang, J.J.; Cui, M.M.; Fan, D.; Zhang, D.S.; Lian, H.X.; Yin, Z.Y.; Li, J. Relationship between haze and acute cardiovascular, cerebrovascular, and respiratory diseases in Beijing. Environ. Sci. Pollut. Res. 2015, 22, 3920–3925. [Google Scholar] [CrossRef] [PubMed]
  37. Zhao, H.M.; Tong, D.Q.; Gao, C.Y.; Wang, G.P. Effect of dramatic land use change on gaseous pollutant emissions from biomass burning in Northeastern China. Atmos. Res. 2015, 153, 429–436. [Google Scholar] [CrossRef]
  38. Korontzi, S.; McCarty, J.; Loboda, T.; Kumar, S.; Justice, C. Global distribution of agricultural fires in croplands from 3 years of Moderate Resolution Imaging Spectroradiometer (MODIS) data. Glob. Biogeochem. Cycles 2006, 20, GB2021. [Google Scholar] [CrossRef]
  39. Friedl, M.A.; Sullamenashe, D.; Tan, B.; Schneider, A.; Ramankutty, N.; Sibley, A.; Huang, X.M. MODIS Collection 5 global land cover: Algorithm refinements and characterization of new datasets. Remote. Sens. Environ. 2010, 114, 168–182. [Google Scholar] [CrossRef]
  40. Wiedinmyer, C.; Akagi, S.K.; Yokelson, R.J.; Emmons, L.K.; Al-Saadi, J.A.; Orlando, J.J.; Soja, A.J. The Fire INventory from NCAR (FINN): A High Resolution Global Model to Estimate the Emissions from Open Burning. Geosci. Model Dev. 2011, 4, 625–641. [Google Scholar] [CrossRef]
  41. Val Martin, M.; Heald, C.L.; Ford, B.; Prenni, A.J.; Wiedinmyer, C. A decadal satellite analysis of the origins and impacts of smoke in Colorado. Atmos. Chem. Phys. 2013, 13, 7429–7439. [Google Scholar] [CrossRef] [Green Version]
  42. Jiang, X.; Wiedinmyer, C.; Carlton, A.G. Aerosols from Fires: An Examination of the Effects on Ozone Photochemistry in the Western United States. Environ. Sci. Technol. 2012, 46, 11878–11886. [Google Scholar] [CrossRef] [PubMed]
  43. Reddington, C.L.; Spracklen, D.V.; Artaxo, P.; Ridley, D.A.; Rizzo, L.V.; Arana, A. Analysis of particulate emissions from tropical biomass burning using a global aerosol model and long-term surface observations. Atmos. Chem. Phys. 2016, 16, 11083–11106. [Google Scholar] [CrossRef]
  44. Giglio, L.; Csiszar, I.; Justice, C.O. Global distribution and seasonality of active fires as observed with the Terra and Aqua Moderate Resolution Imaging Spectroradiometer (MODIS) sensors. J. Geophys. Res. 2015, 111, 17–23. [Google Scholar] [CrossRef]
  45. Cahoon, D.R., Jr.; Stocks, B.J.; Levine, J.S.; Cofer, W.R., III; Pierson, J.M. Satellite analysis of the severe 1987 forest fires in northern China and southeastern Siberia. J. Geophys. Res. 1994, 99, 18627–18638. [Google Scholar] [CrossRef]
  46. Levine, J.S.; Cofer, W.R., III; Cahoon, D.R., Jr.; Winstead, E.L. Biomass Burning: A Driver for Global Change. Environ. Sci. Technol. 1995, 29, 120A–125A. [Google Scholar] [CrossRef]
  47. Hallquist, M.; Wenger, J.C.; Baltensperger, U.; Rudich, Y.; Simpson, D.; Claeys, M.; Dommen, J.; Donahue, N.M.; George, C.; Goldstein, A.H.; et al. The formation, properties and impact of secondary organic aerosol: Current and emerging issues. Atmos. Chem. Phys. 2009, 9, 5155–5236. [Google Scholar] [CrossRef] [Green Version]
  48. Novakov, T.; Andreae, M.O.; Gabriel, R.; Kirchstetter, T.W.; Mayol-Bracero, O.L.; Ramanathan, V. Origin of carbonaceous aerosols over the tropical Indian Ocean: Biomass burning or fossil fuels? Geophys. Res. Lett. 2000, 27, 4061–4064. [Google Scholar] [CrossRef] [Green Version]
Figure 1. Study region of Northeast China with its underlying land cover types in 2015.
Sustainability 10 03353 g001
Figure 2. Monthly variations of average emissions from open fires for 2002–2016 in the NE region (unit: kilotons).
Sustainability 10 03353 g002
Figure 3. Inter-annual changes in emissions of open biomass burning in the NE region from 2002 to 2016 (unit: kilotons).
Sustainability 10 03353 g003
Figure 4. Spatial distribution of annual (a) PM2.5, (b) PM10, (c) OC, and (d) BC emissions from open biomass burning in the NE region, averaged from 2002 to 2016.
Sustainability 10 03353 g004
Figure 5. Spatial distribution of PM2.5 emissions (unit: tons) in (a) spring, (b) summer, (c) autumn, and (d) winter in the NE region, averaged from 2002 to 2016.
Sustainability 10 03353 g005
Figure 6. Spatial distribution of annual PM2.5 emissions (tons) from open biomass burning in the NE region in 2003 (a) and 2016 (b) as well as the monthly changes of NE regional PM2.5 emissions (kilotons) in 2003 (c) and 2016 (d).
Sustainability 10 03353 g006aSustainability 10 03353 g006b
Figure 7. Spatial distribution of OC/BC ratio of biomass burning in the NE region from 2002 to 2016 (a) and its inter-annual variation (b).
Sustainability 10 03353 g007
Figure 8. Spatial distribution of inter-annual change trends in (a) PM2.5, (b) PM10, (c) OC, and (d) emissions with units of t/yr (tons per year) or kg/yr (kilograms/year) from open biomass burning in the NE region over 2002–2016.
Sustainability 10 03353 g008aSustainability 10 03353 g008b
Figure 9. Relations of inter-annual variations in NE regional PM2.5, PM10, OC and BC emissions with near-surface wind speed, relative humidity (RH) and air temperature (0.1 °C) from 2002–2016 with correlation coefficients (r) and corresponding significant levels (p).
Sustainability 10 03353 g009
Table 1. Changes in areas (km2) of cropland, forestland and grassland in Northeast China from 2000 to 2015.
Land-Use Types20002015Change Amounts (Rates)
Cropland353,028.38355,938.182909.8 (0.3%)
Forestland486,735.81485,266.71−1469.1 (−0.14%)
Grassland133,800.11132,460.87−1339.24 (−0.12%)

