Modified S2CVA Algorithm Using Cross-Sharpened Images for Unsupervised Change Detection


Abstract
:1. Introduction
2. Sharpening
2.1. General Pan-Sharpening
2.2. Cross-Sharpening
3. Modified S2CVA Algorithm
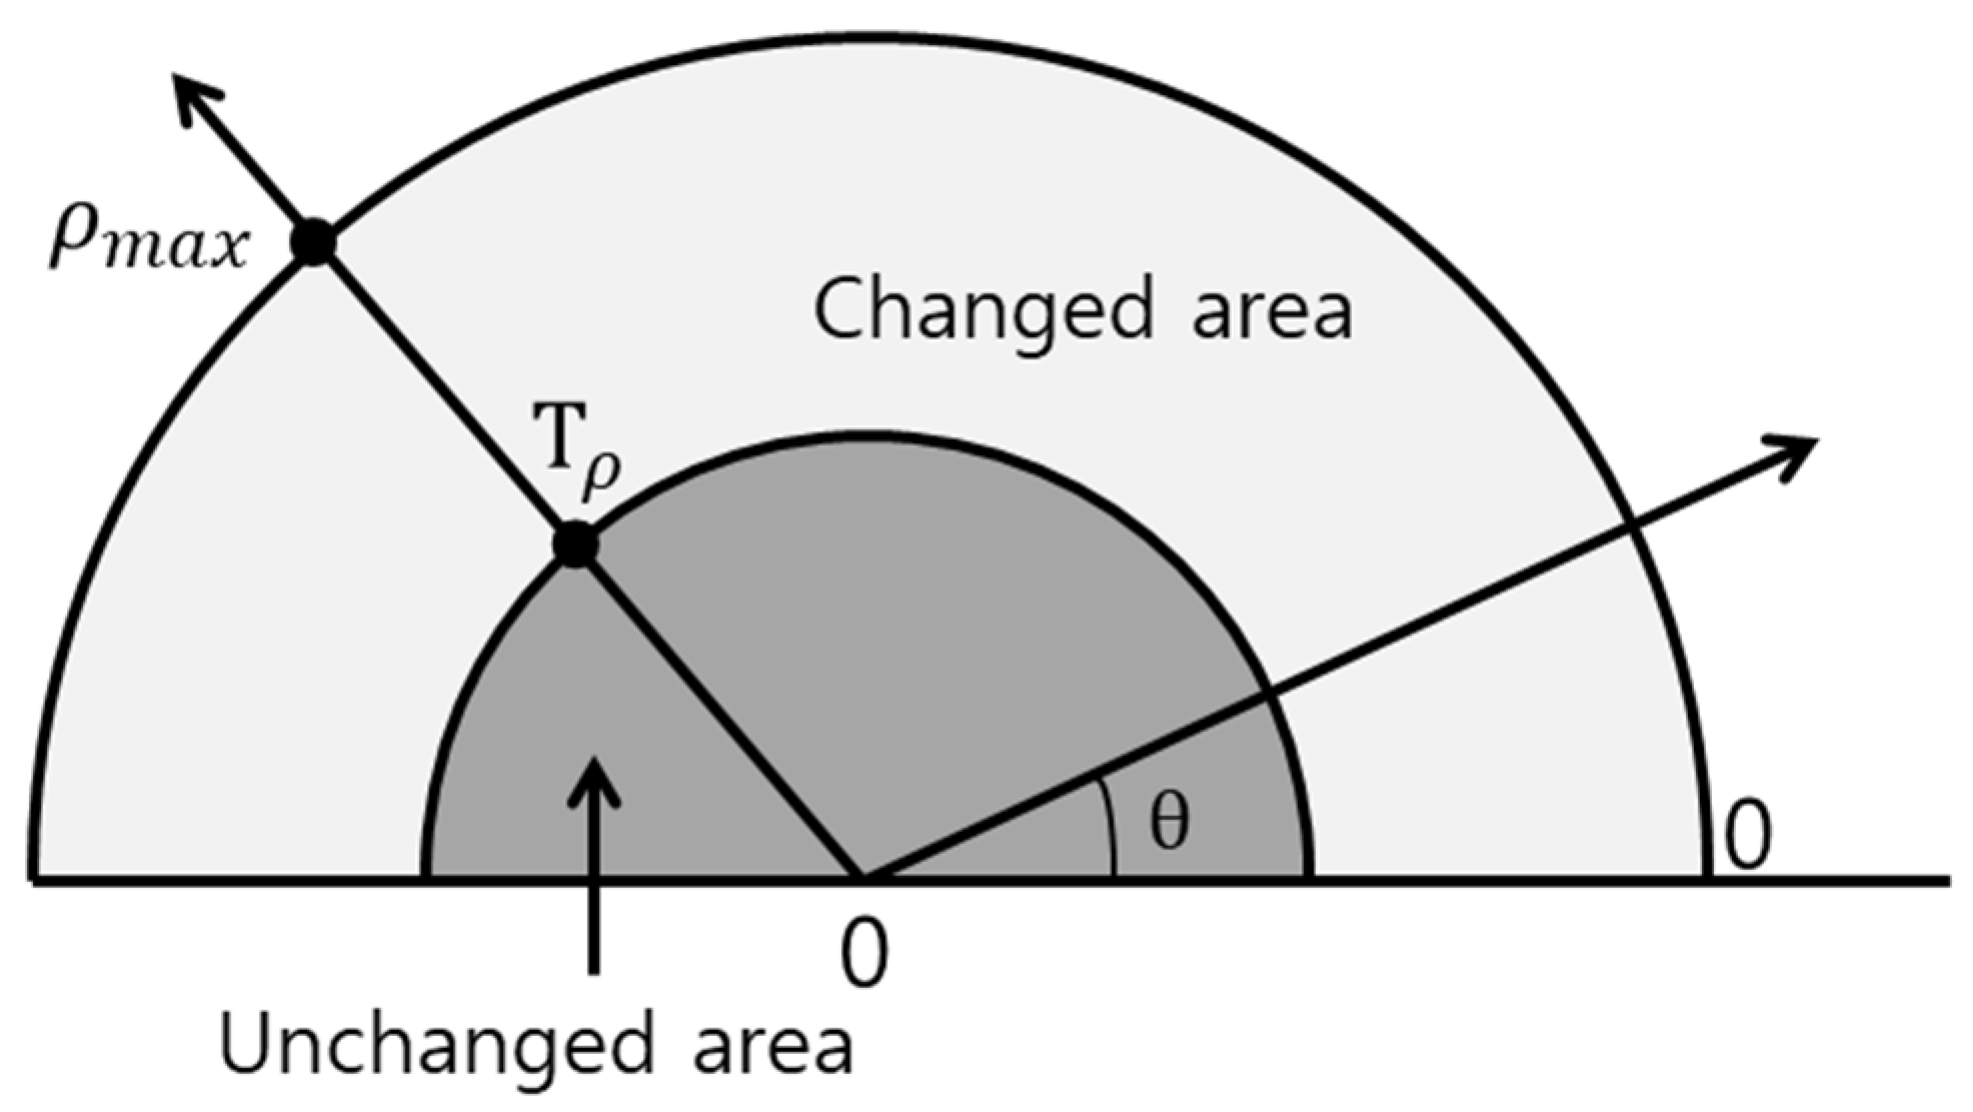
3.1. S2CVA
3.2. Modified S2CVA to Reduce False Alarms Using the Direction Vector for Cross-Sharpened Images
4. Experimental Results and Discussion
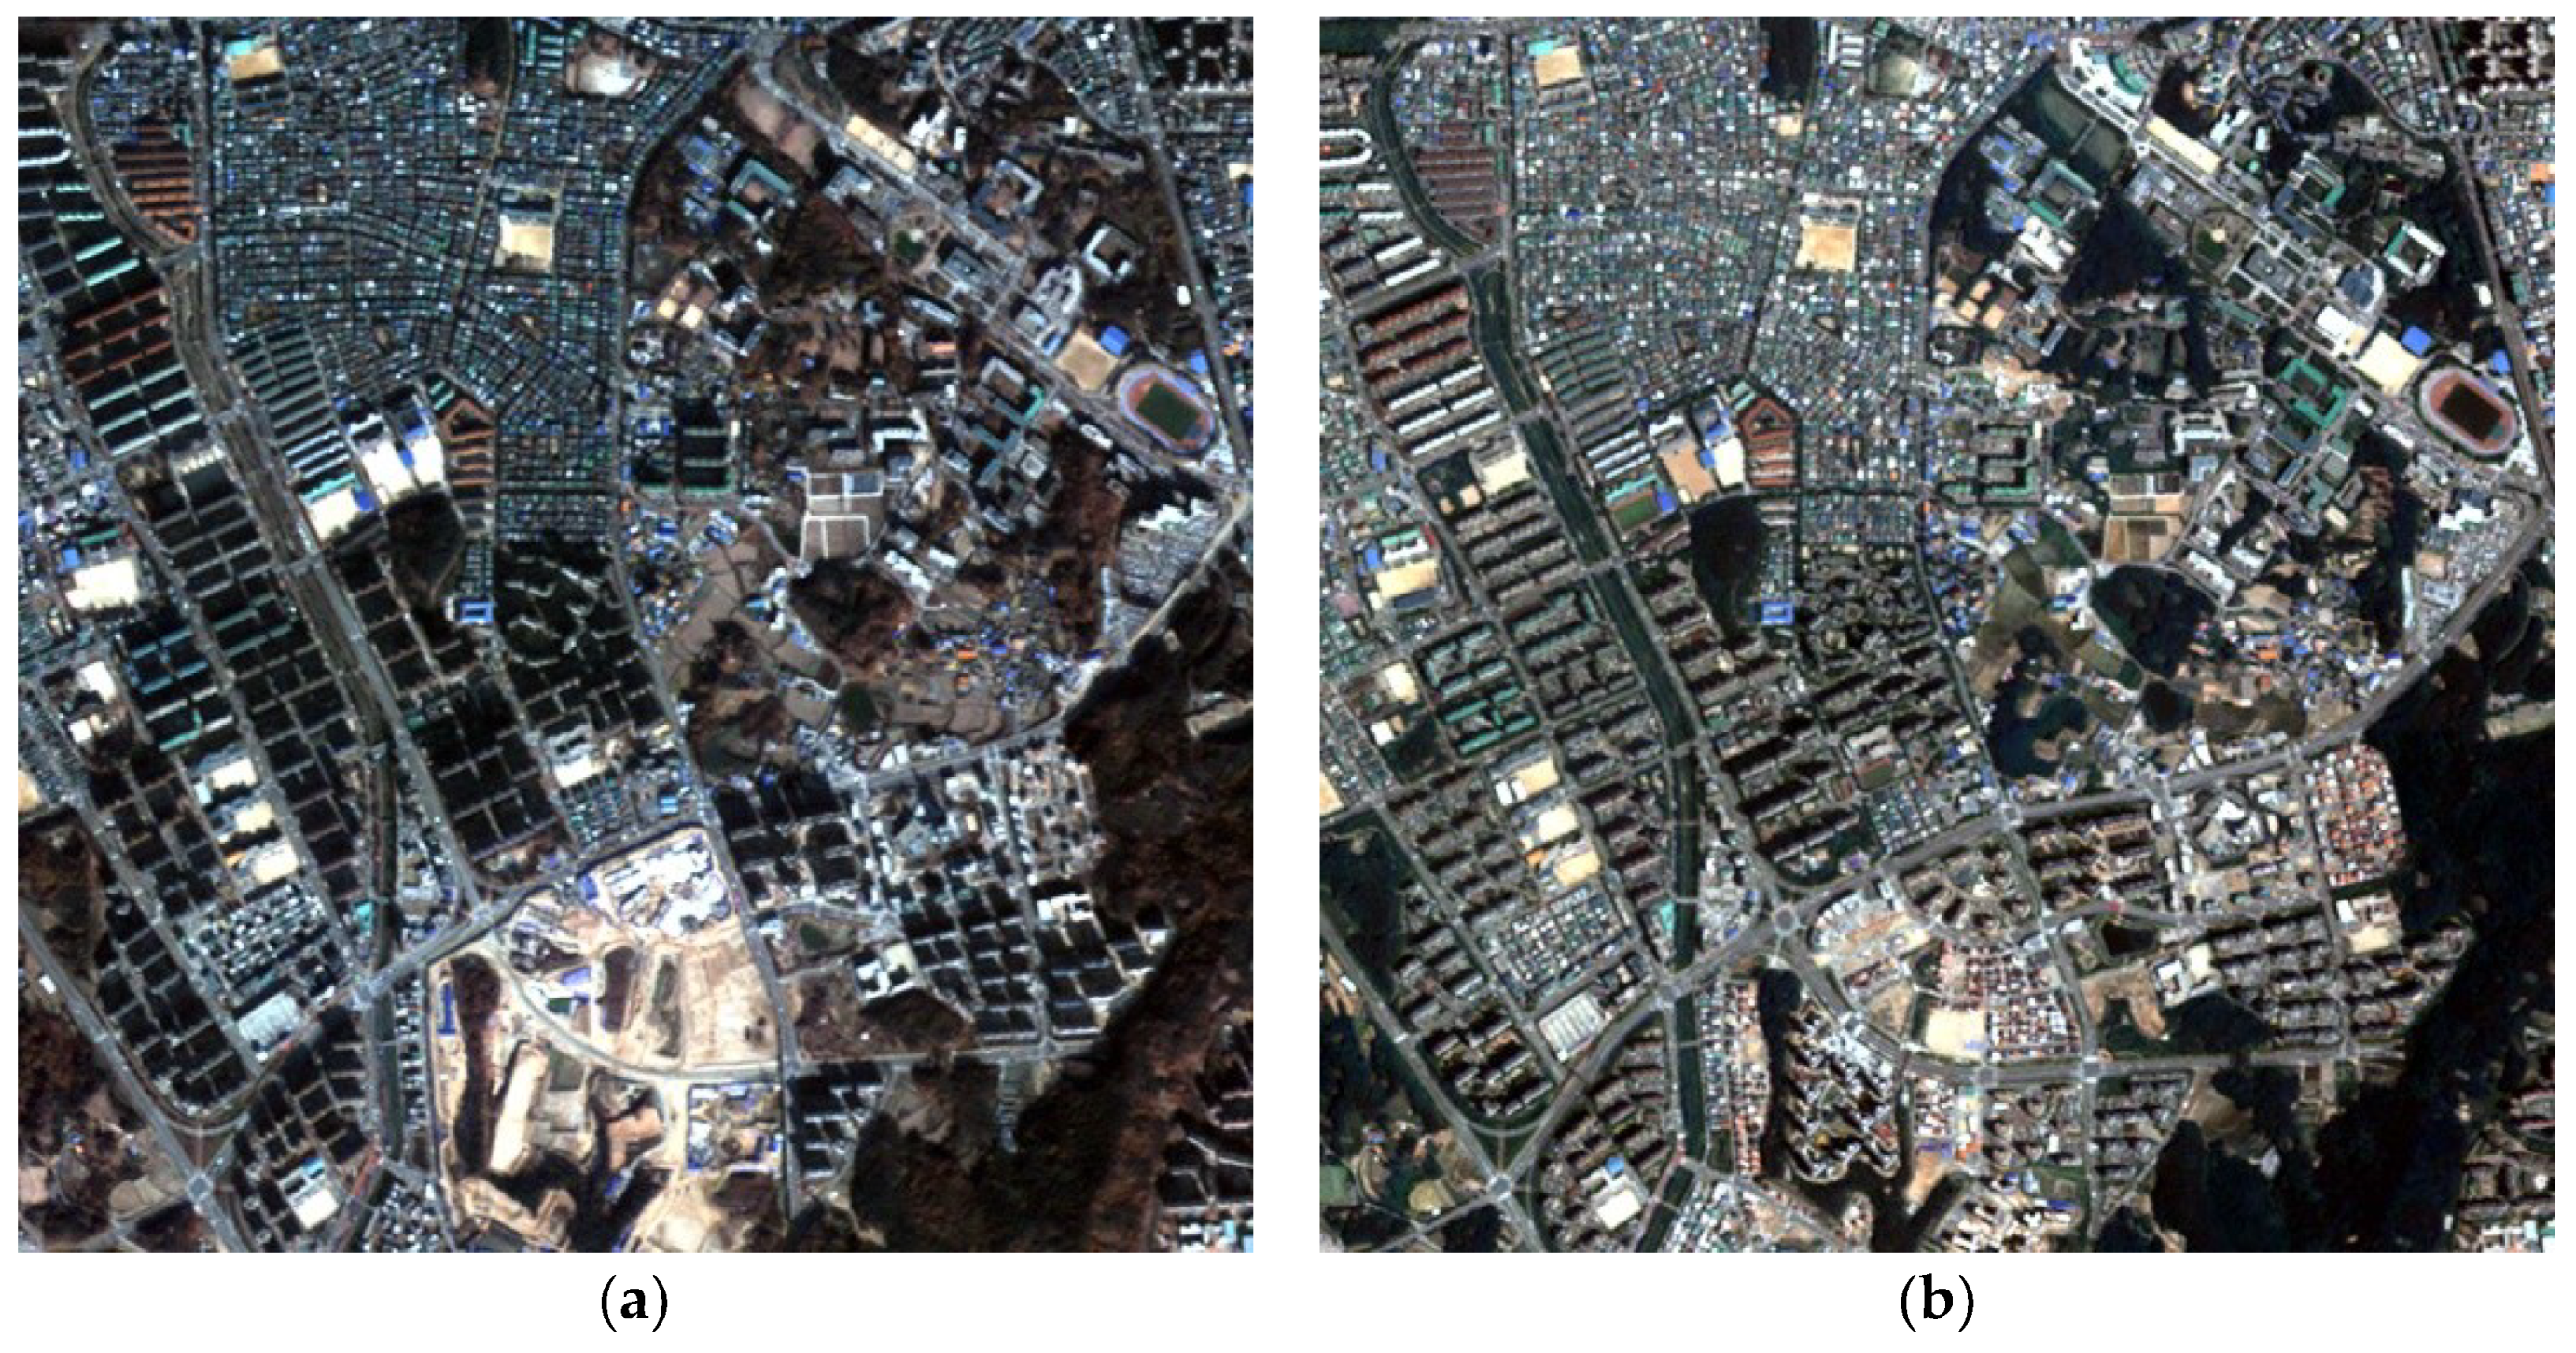
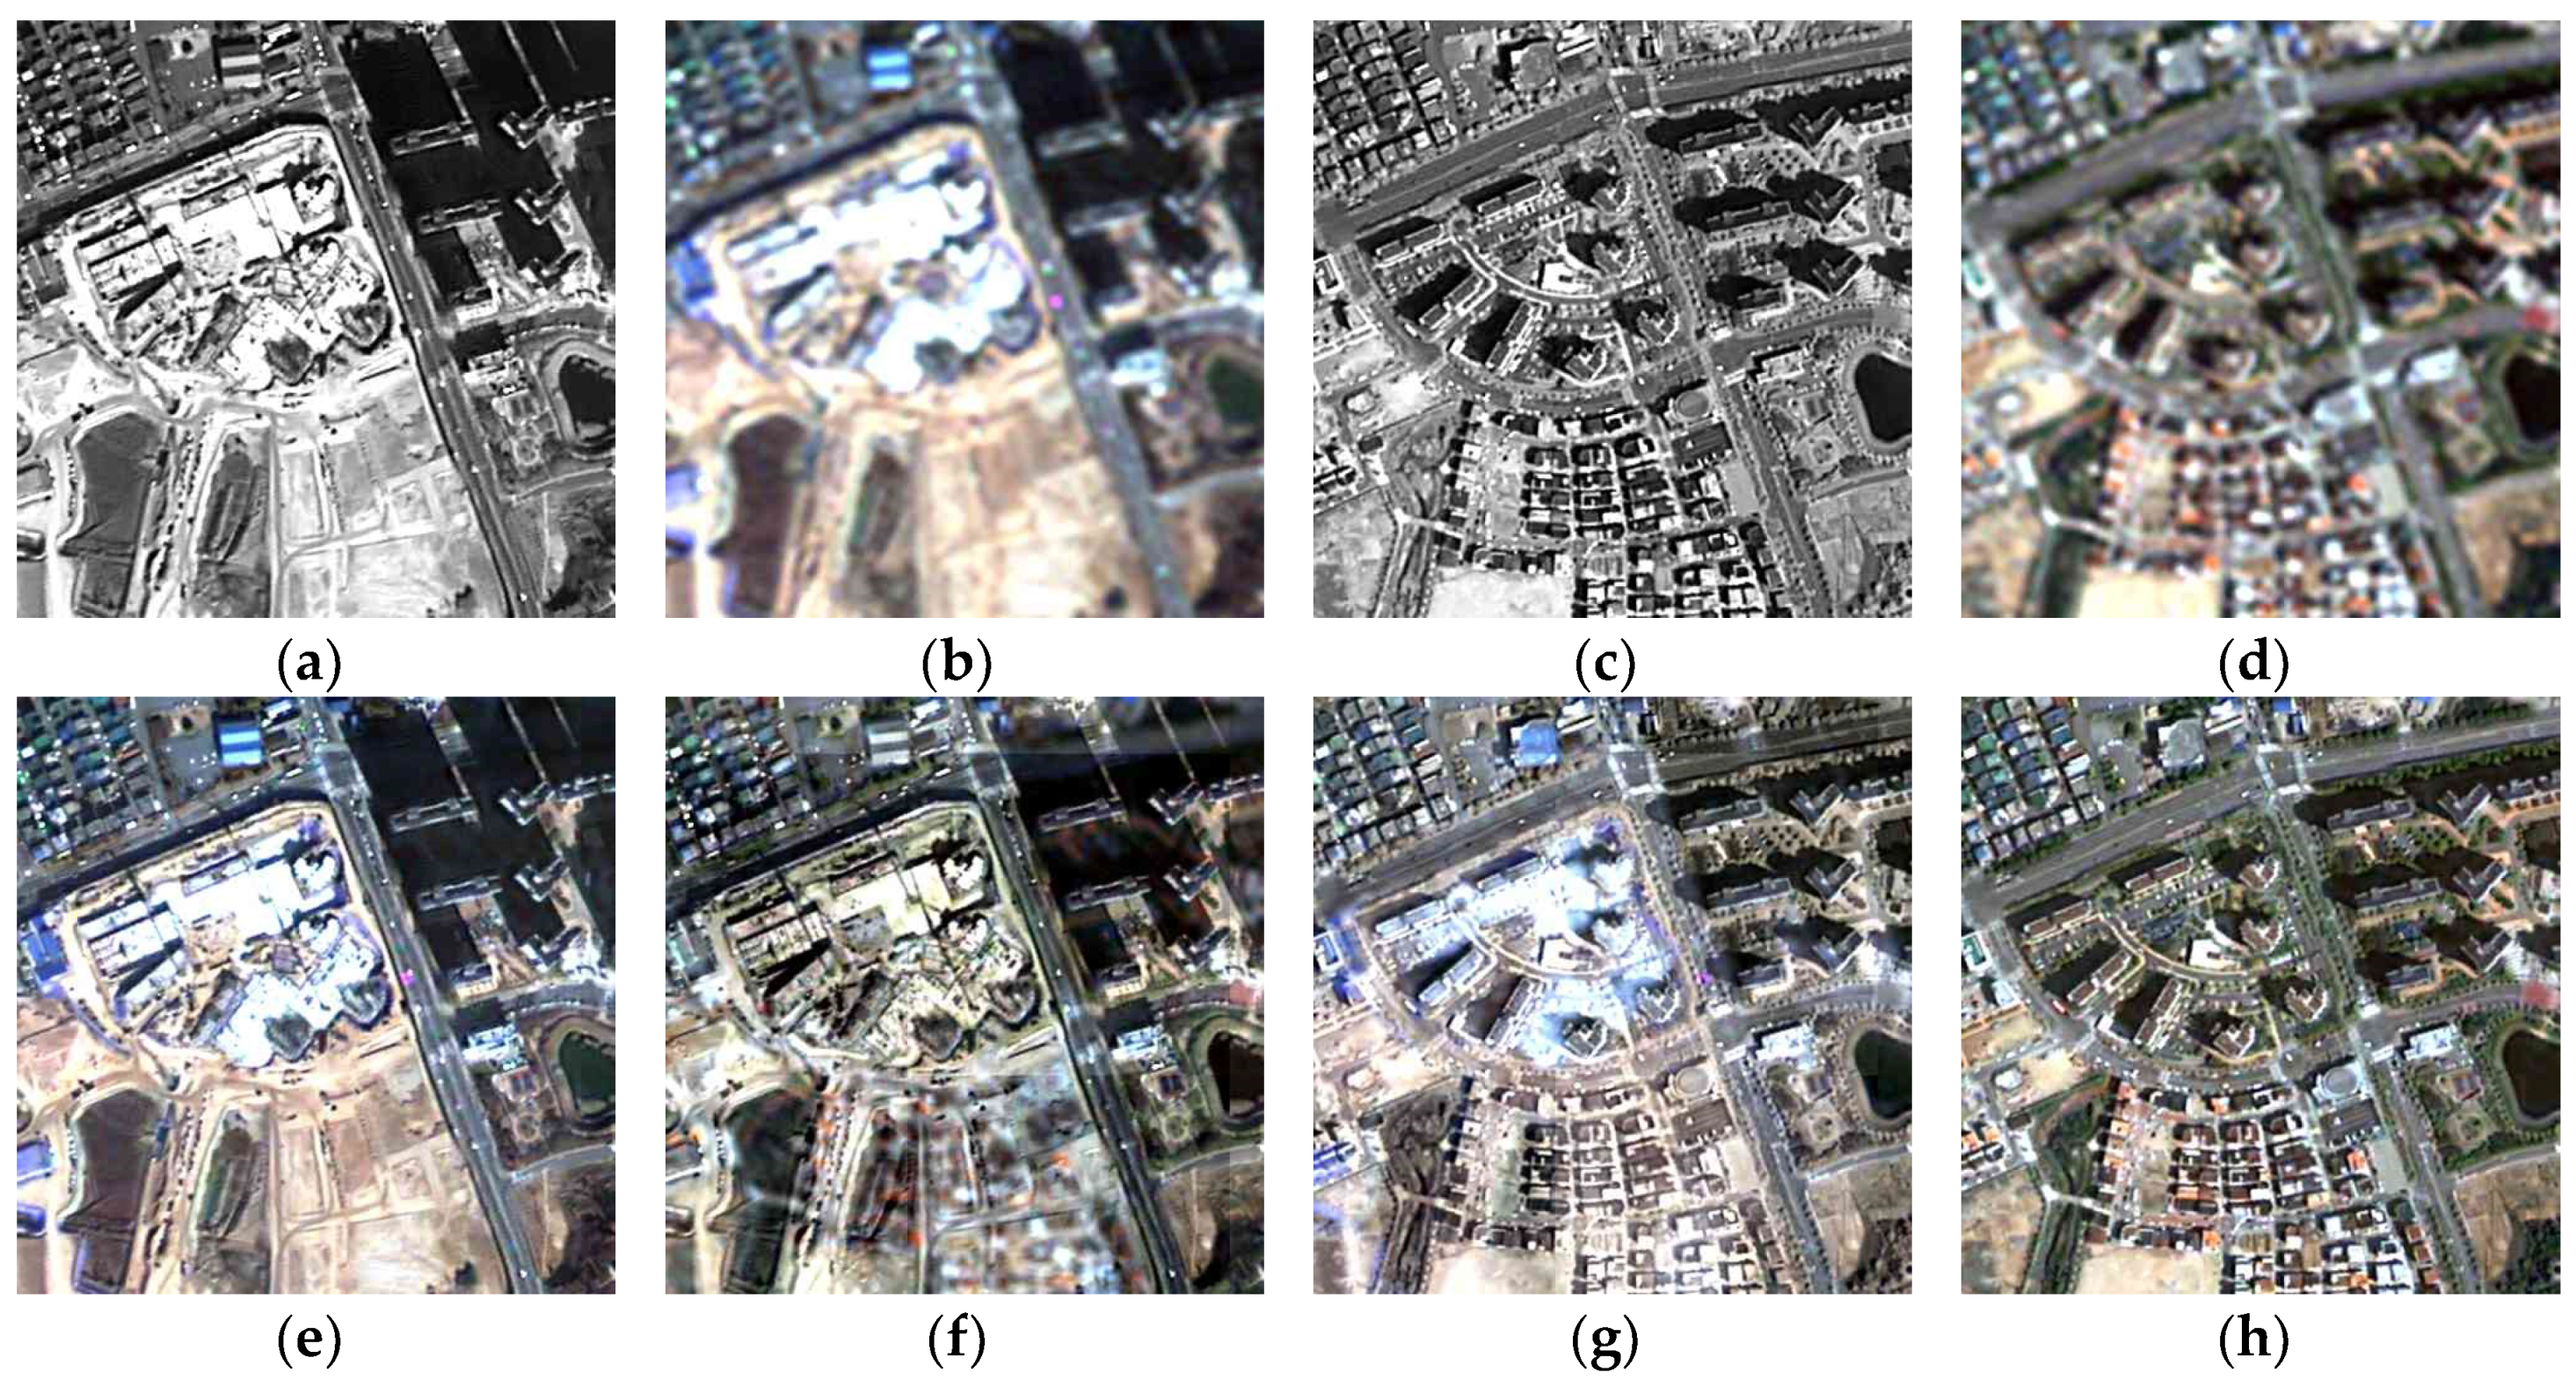
4.1. Materials and Study Areas
4.2. Experimental Results
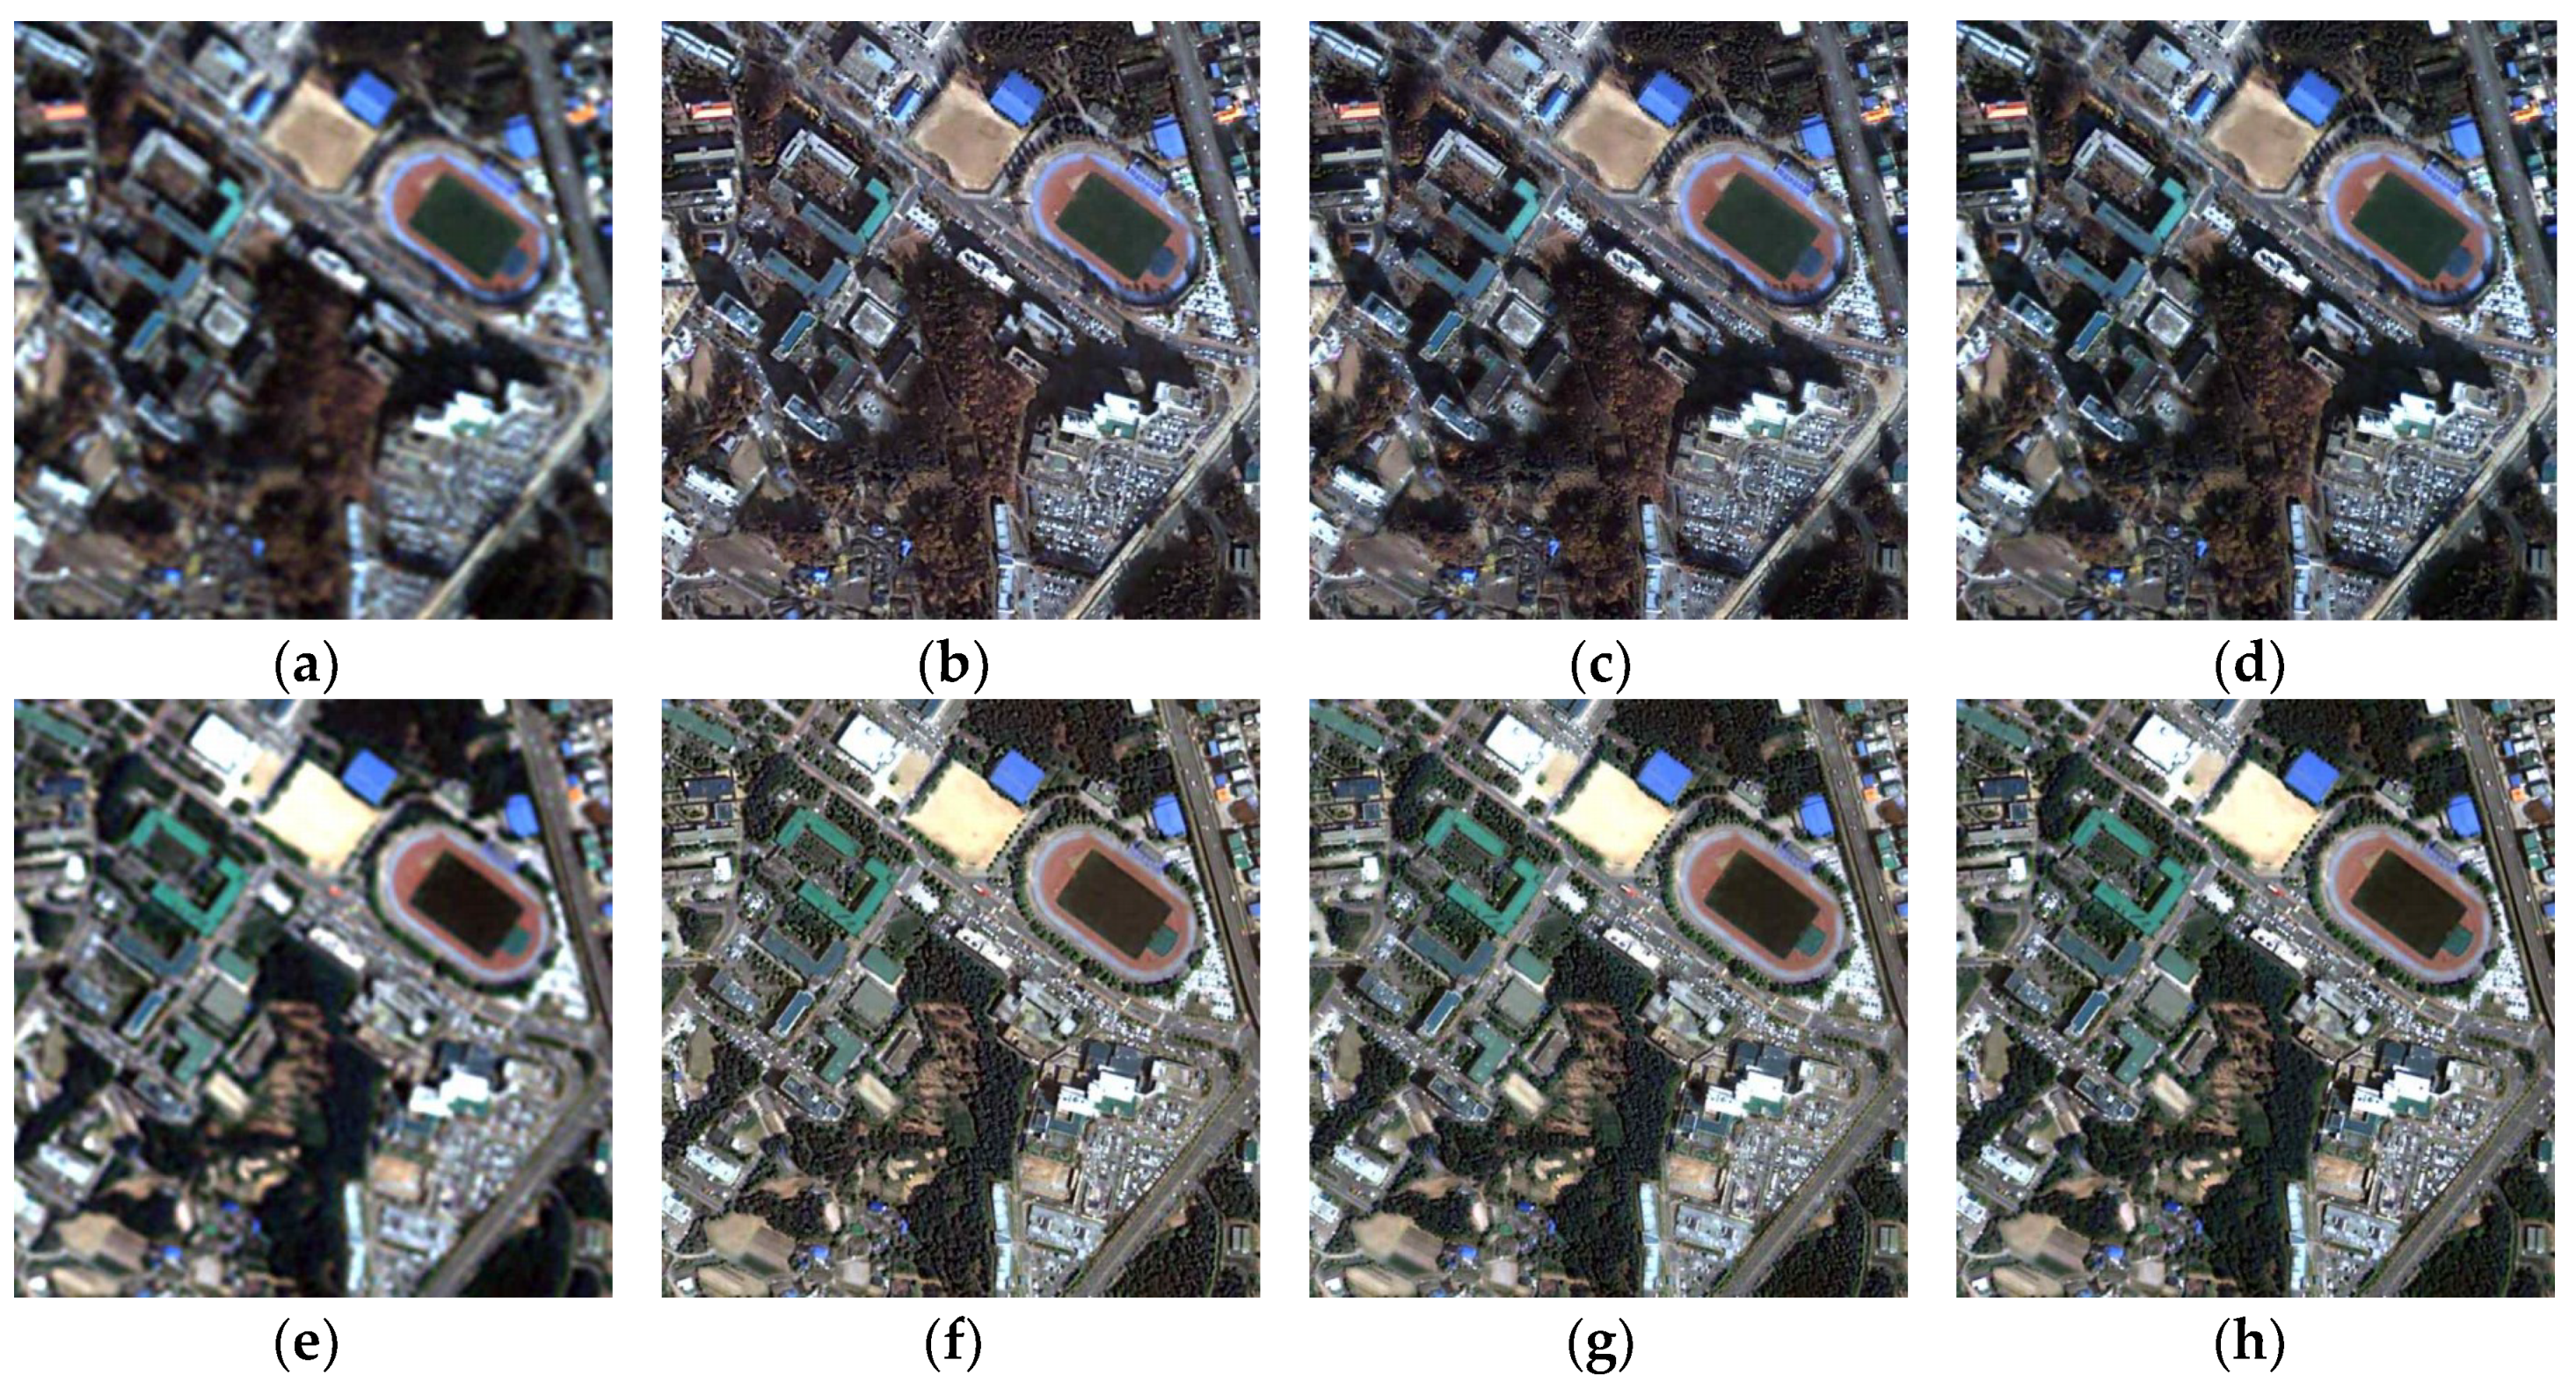
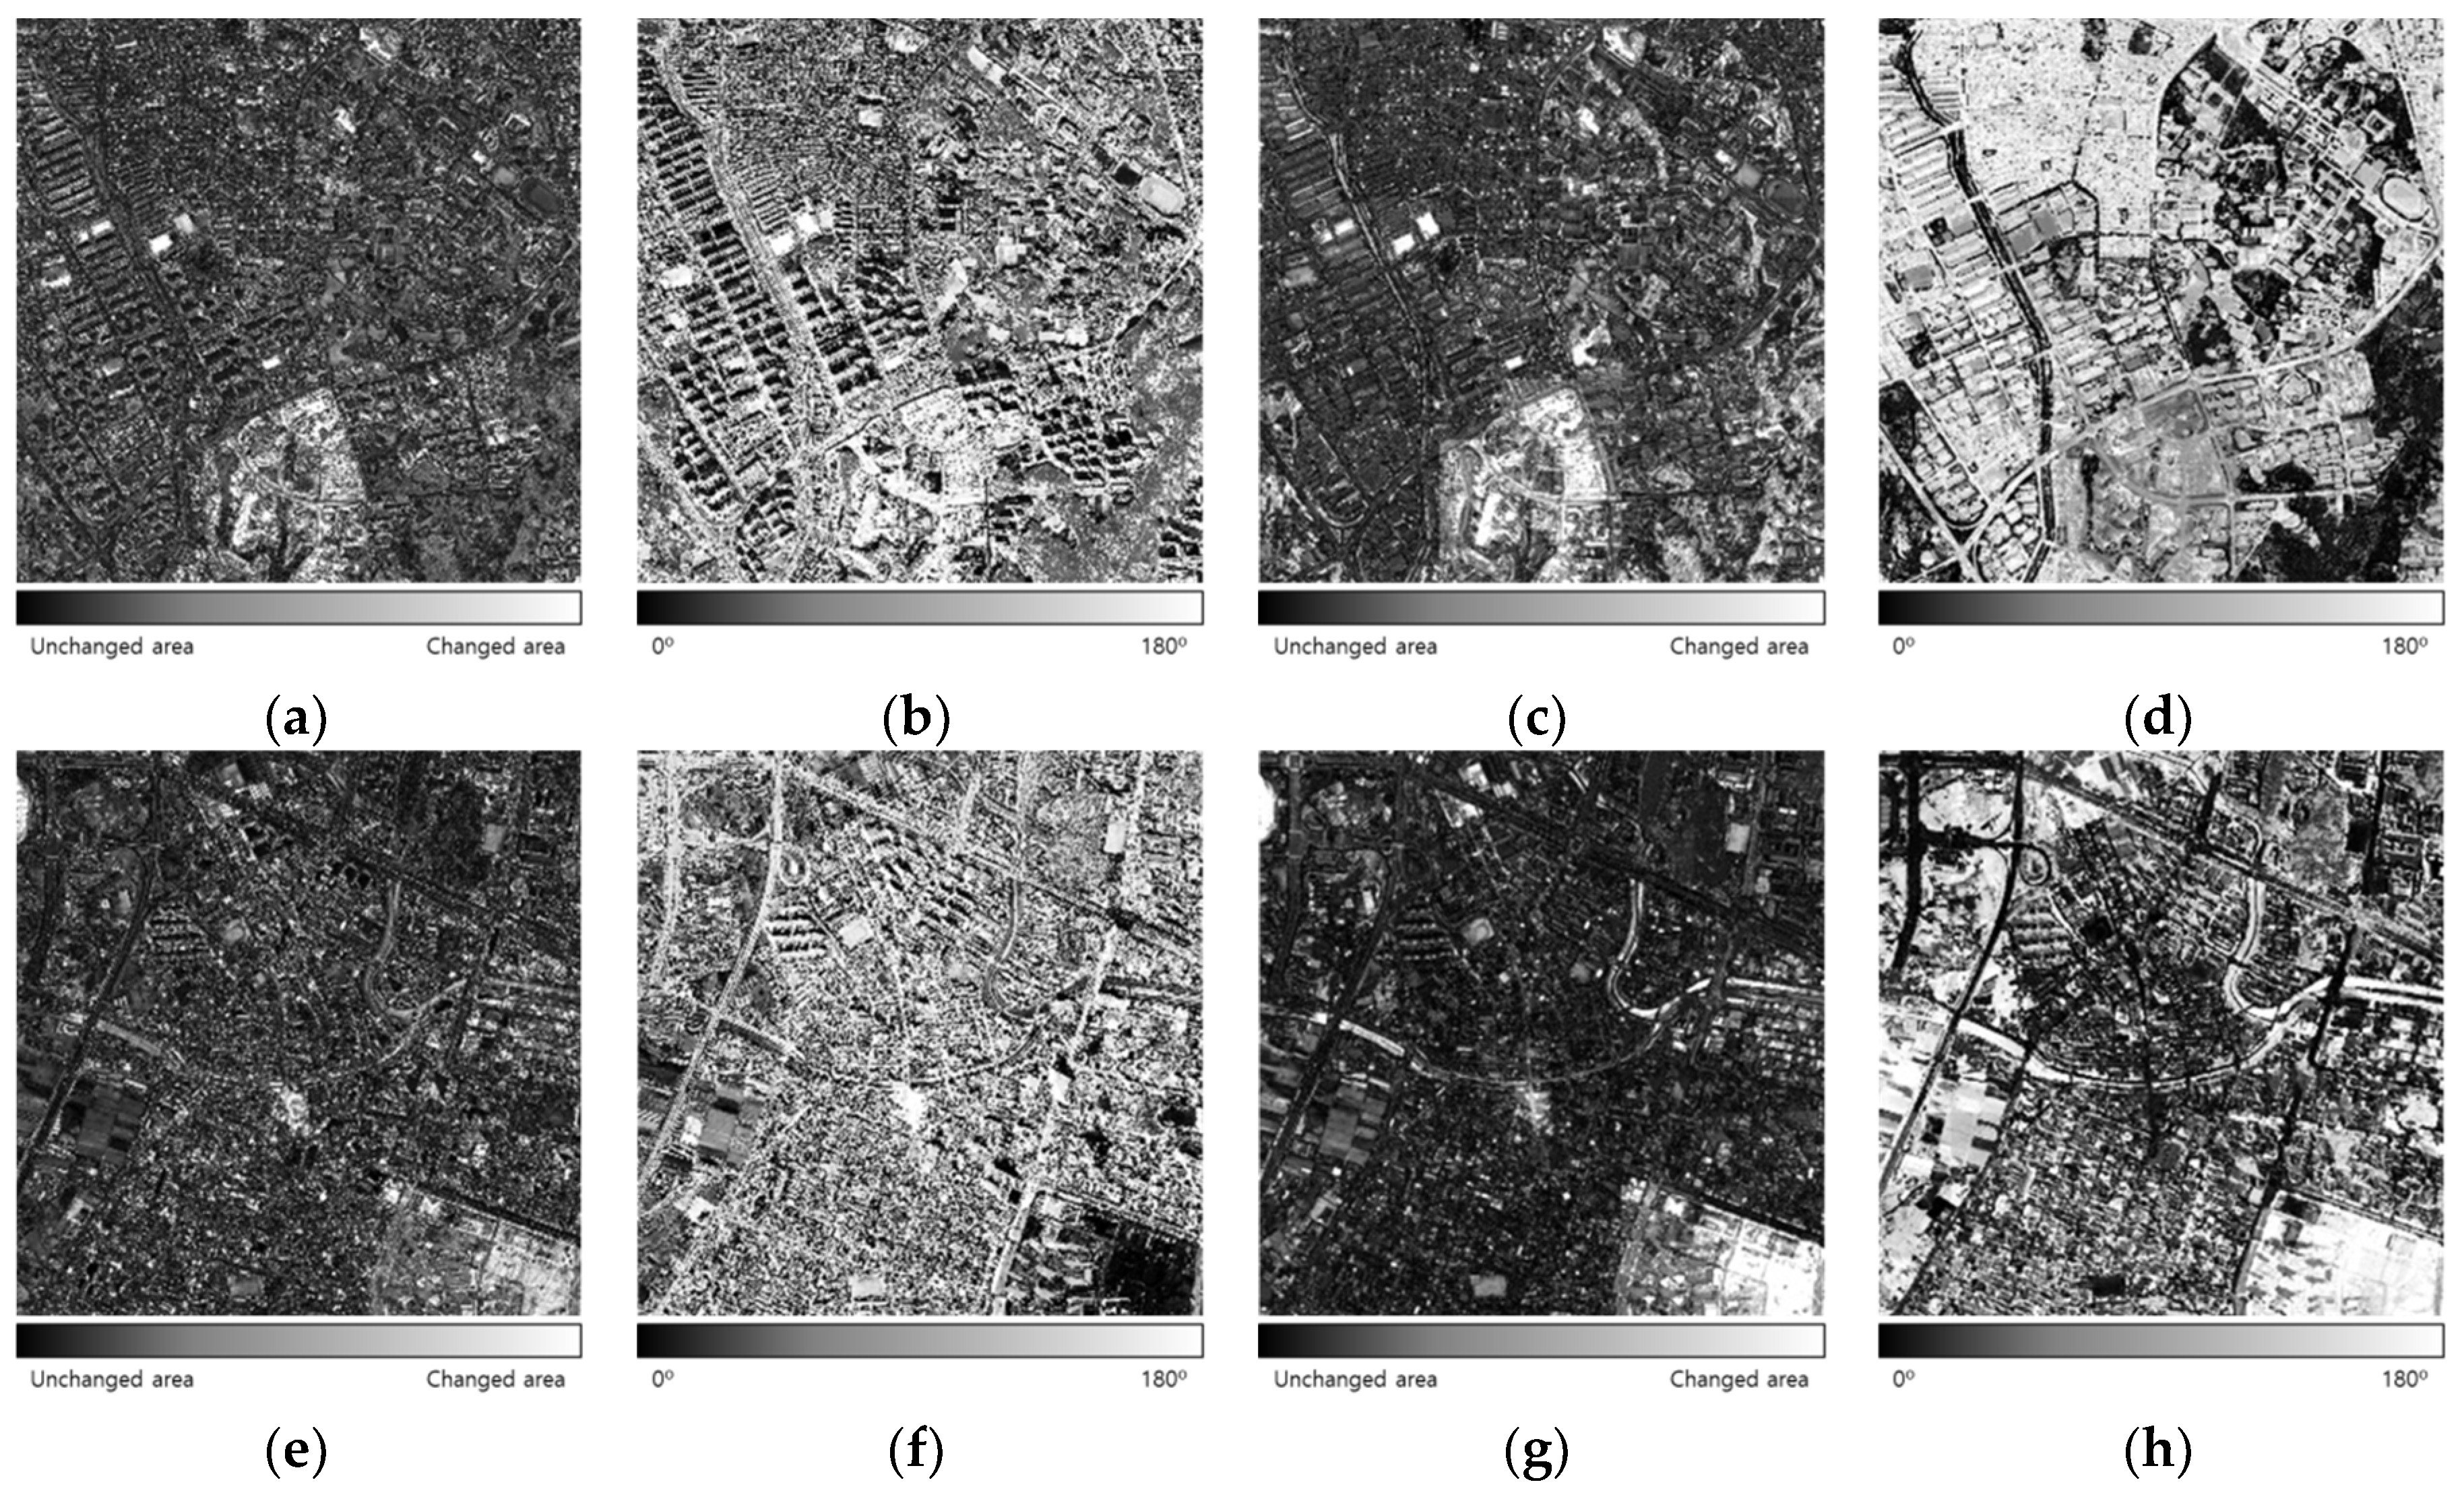
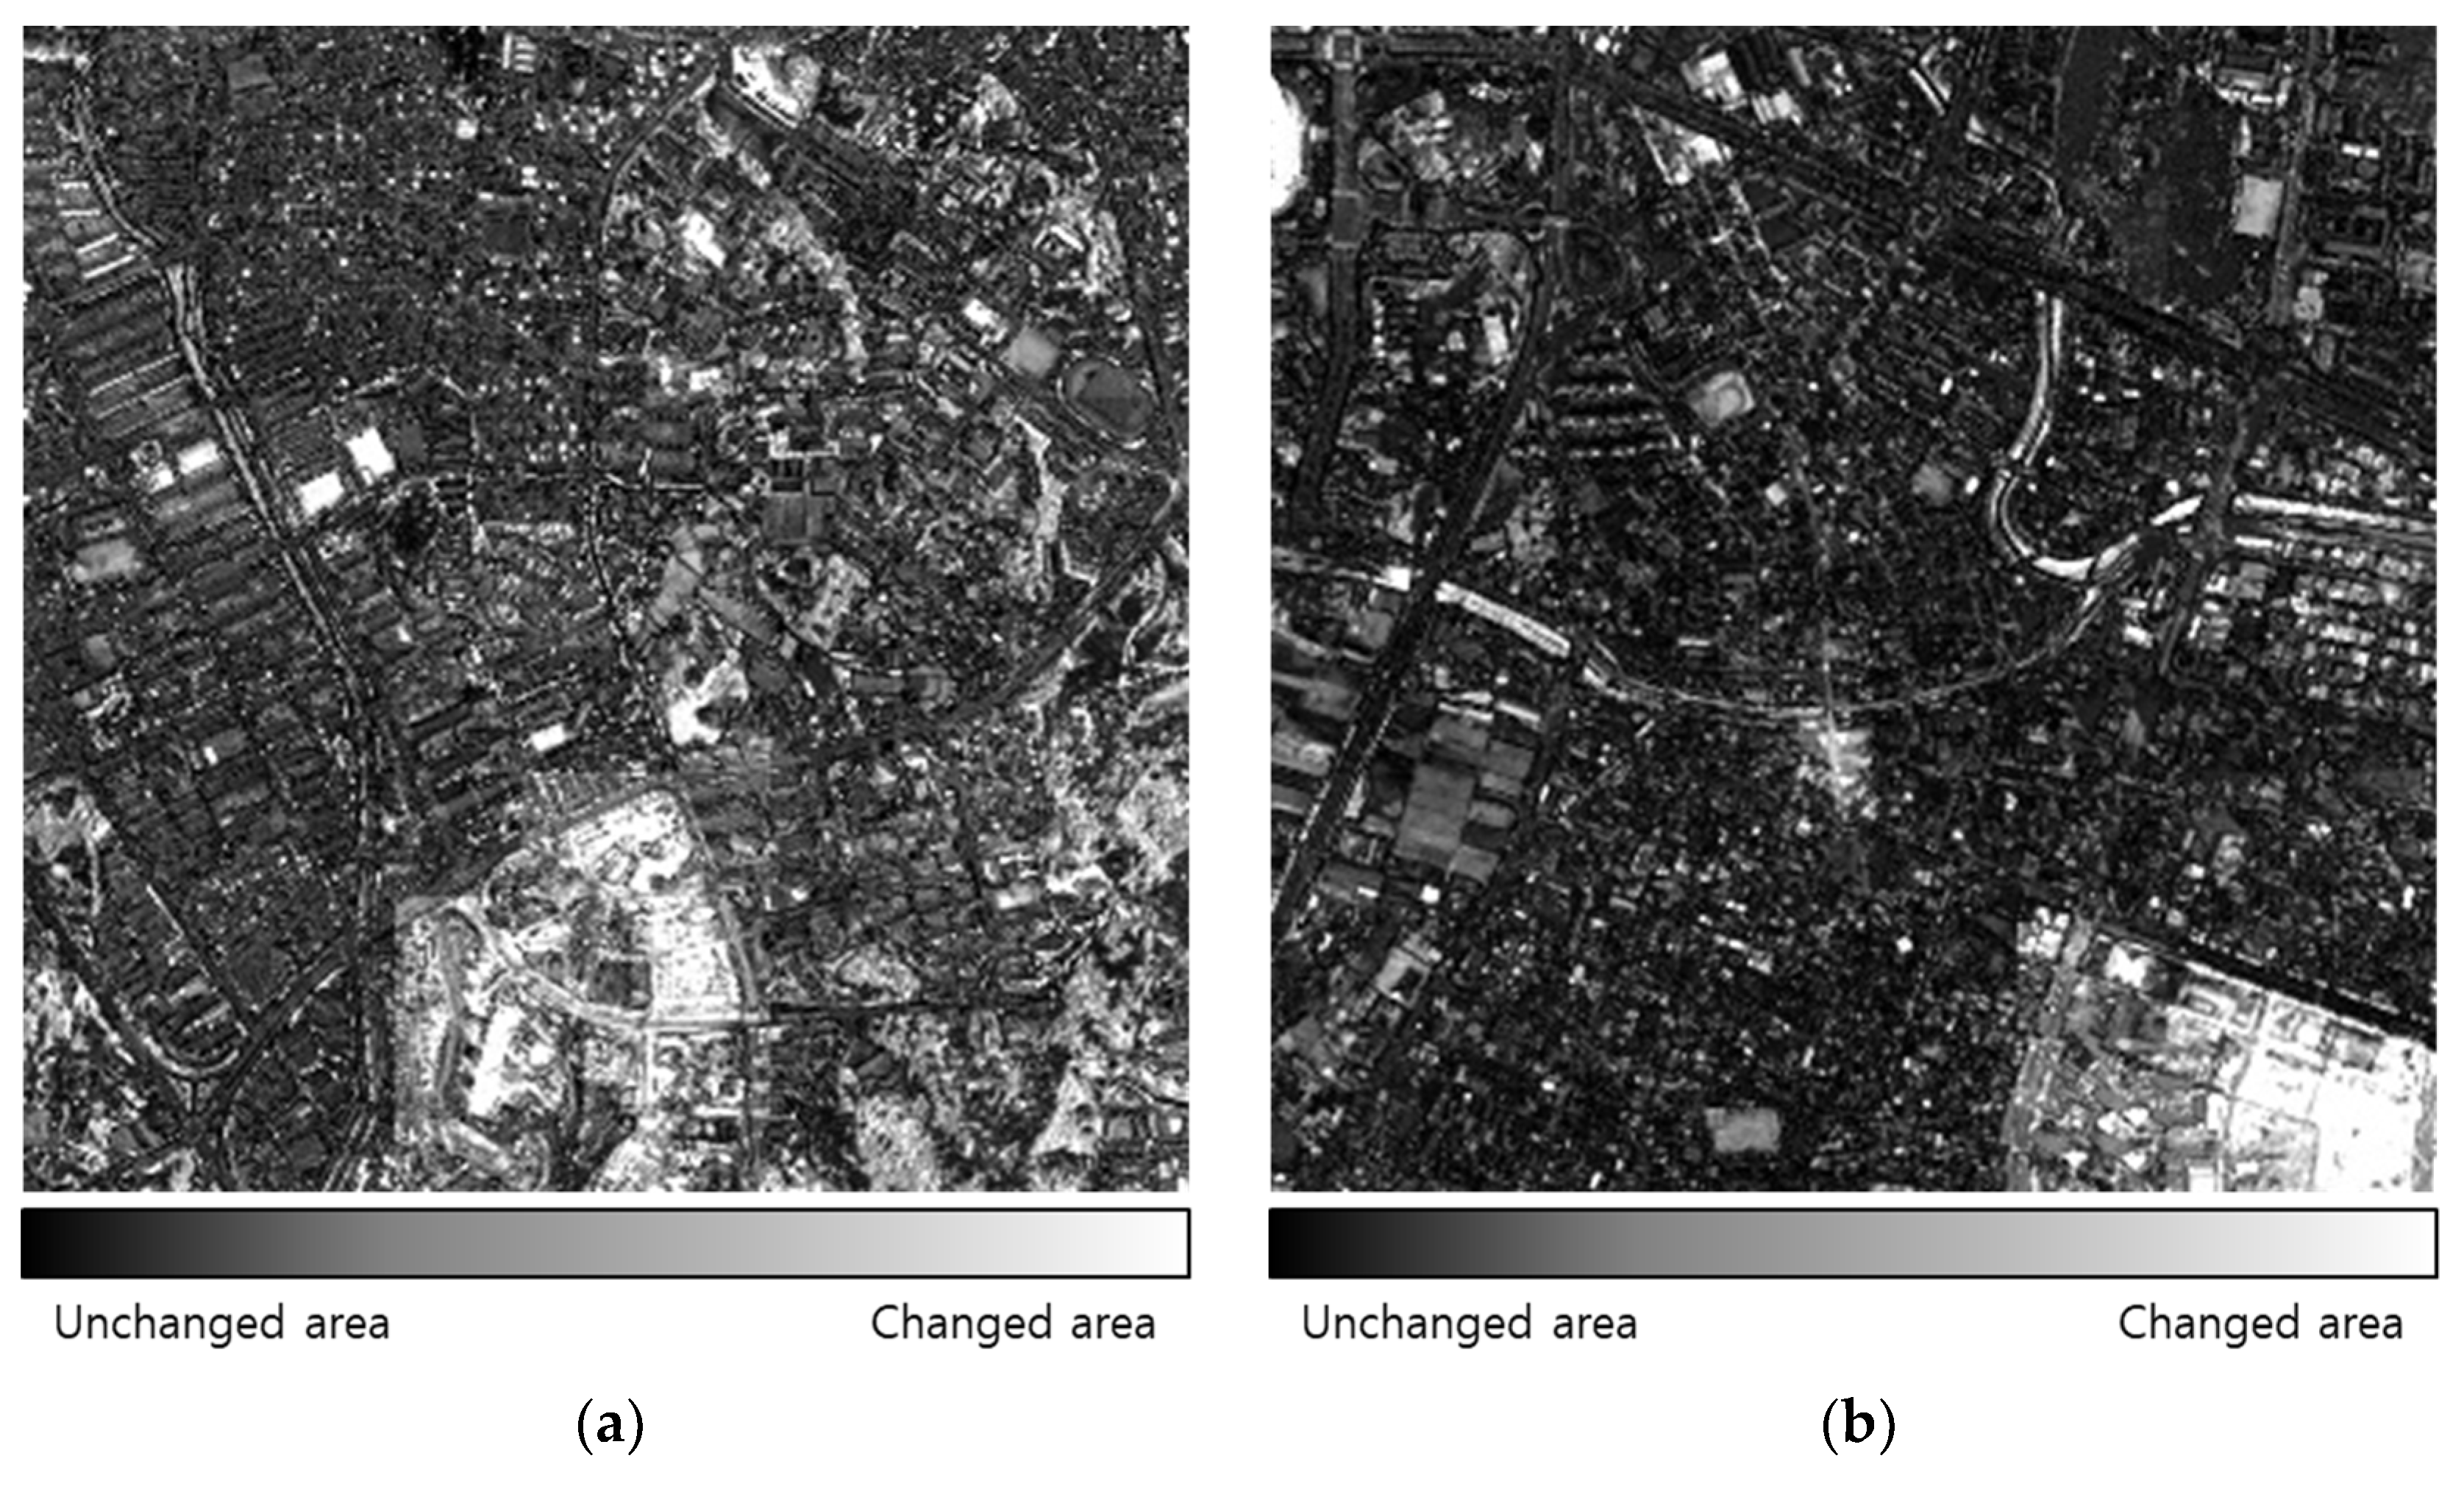
4.2.1. Influence of the Cross-Sharpened Images Based on the Pan-Sharpening Algorithm on the Change Detection Results
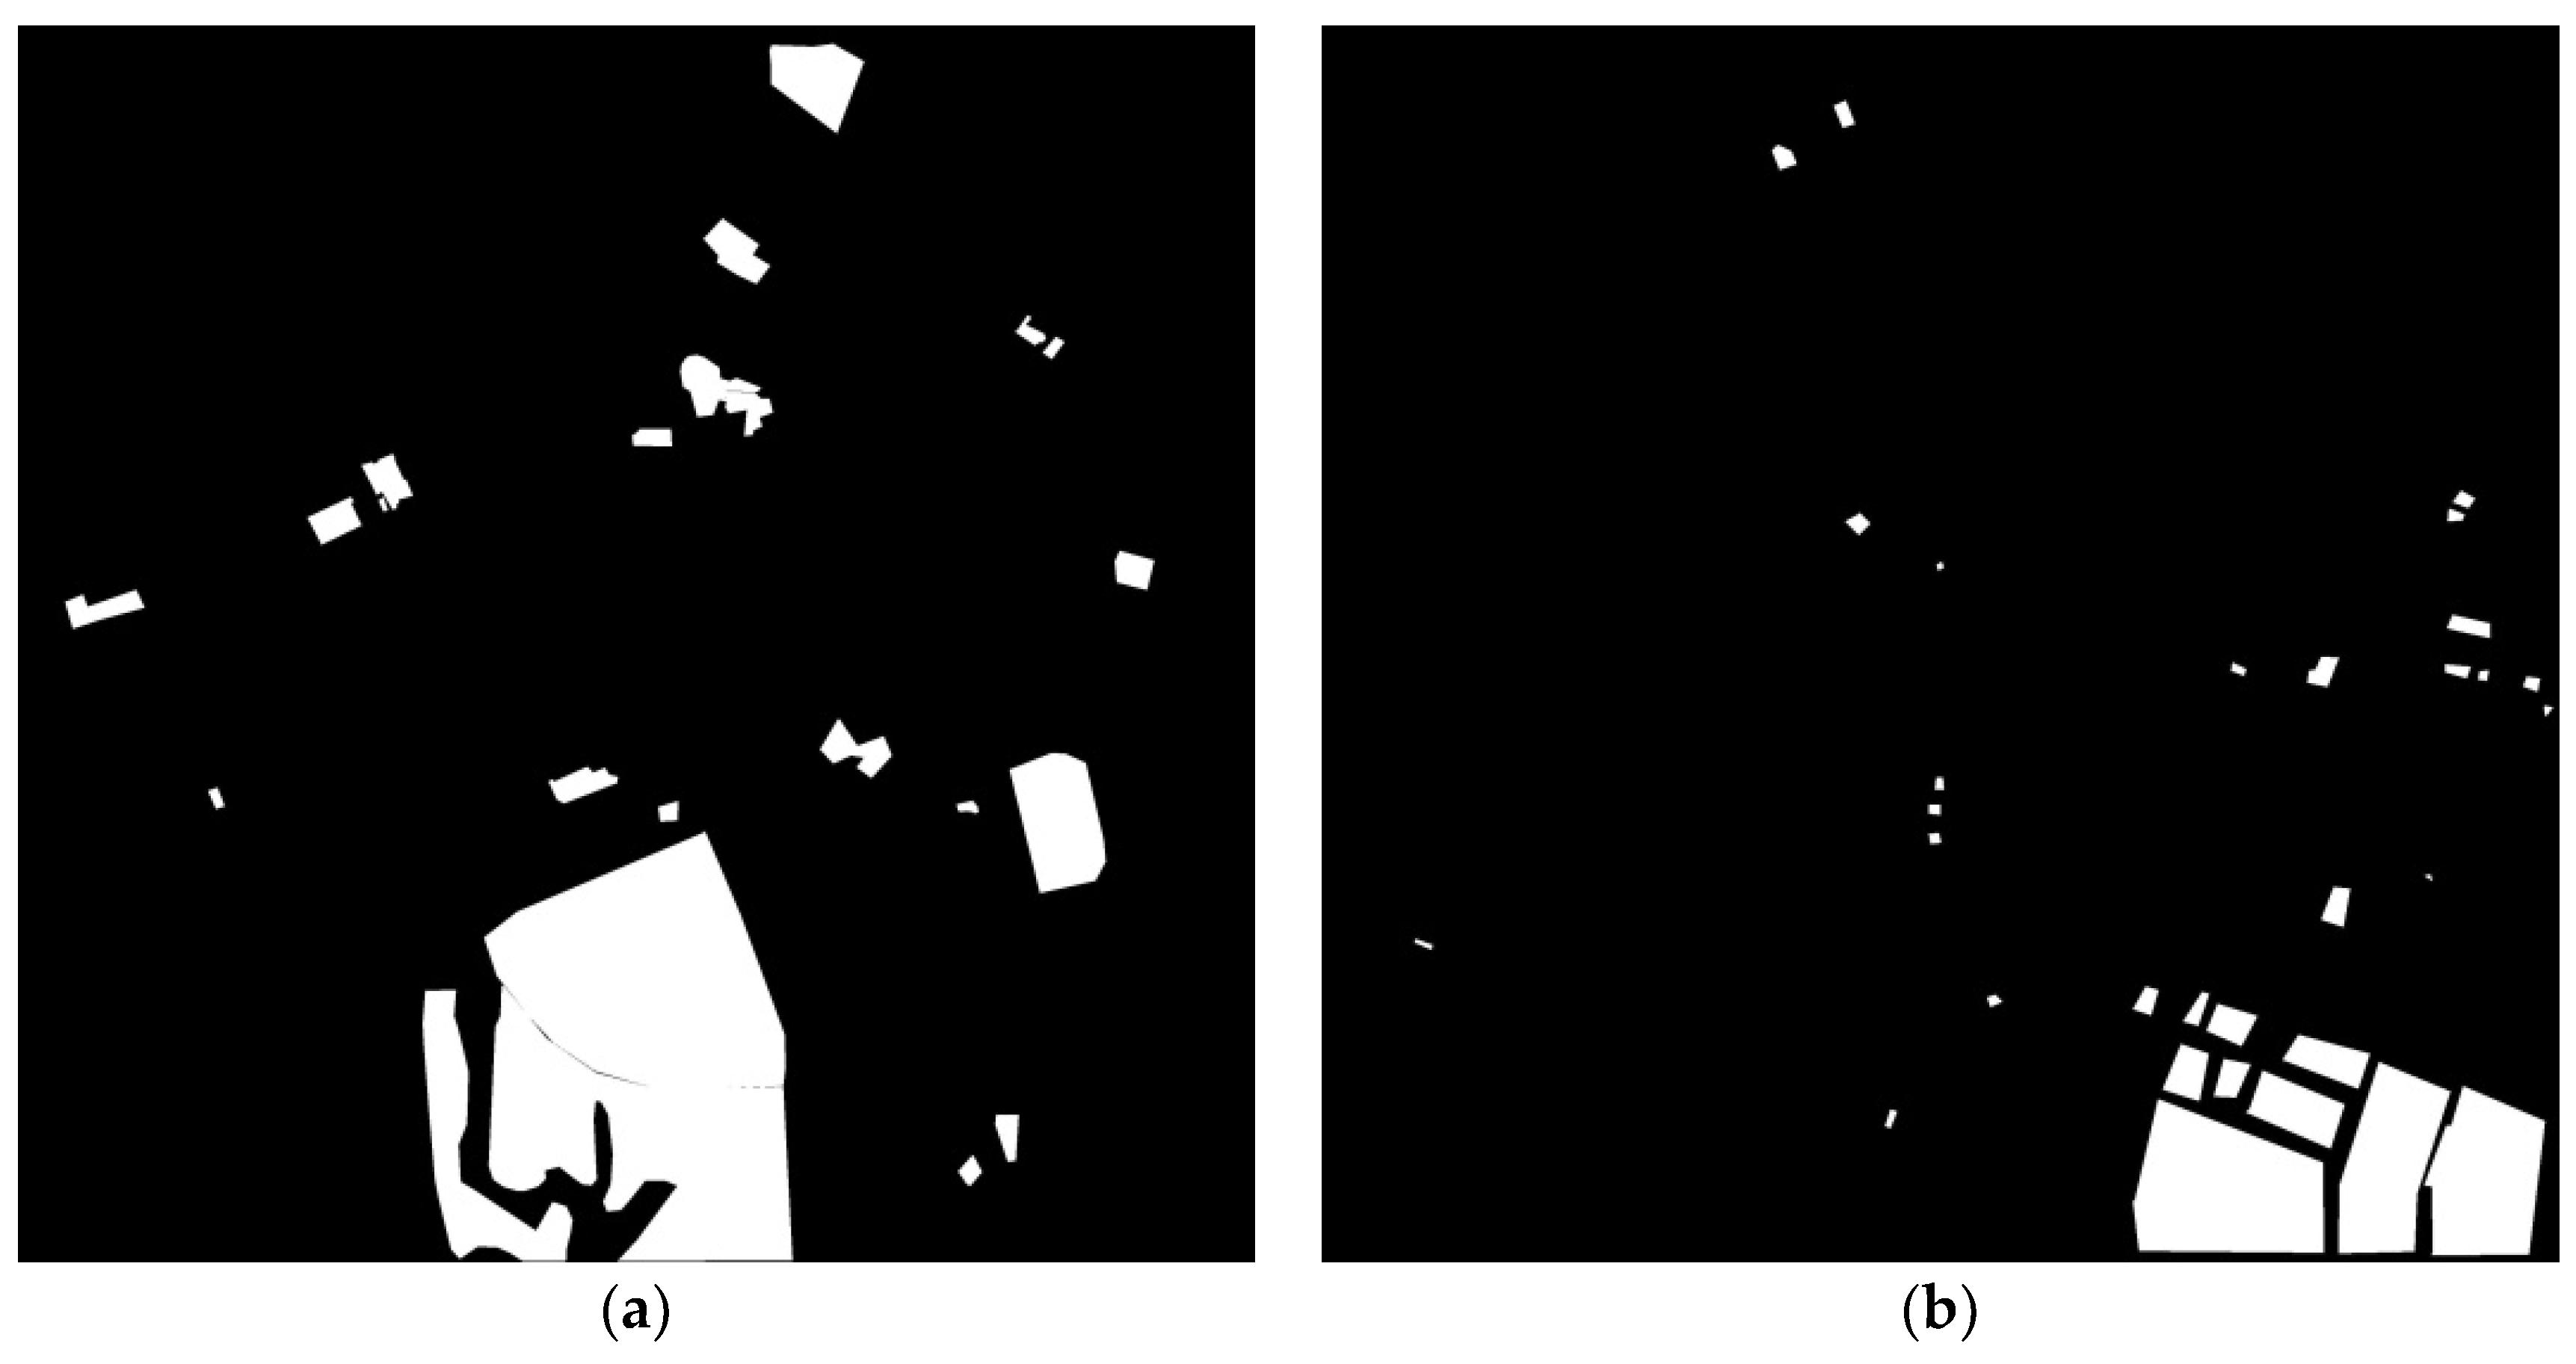
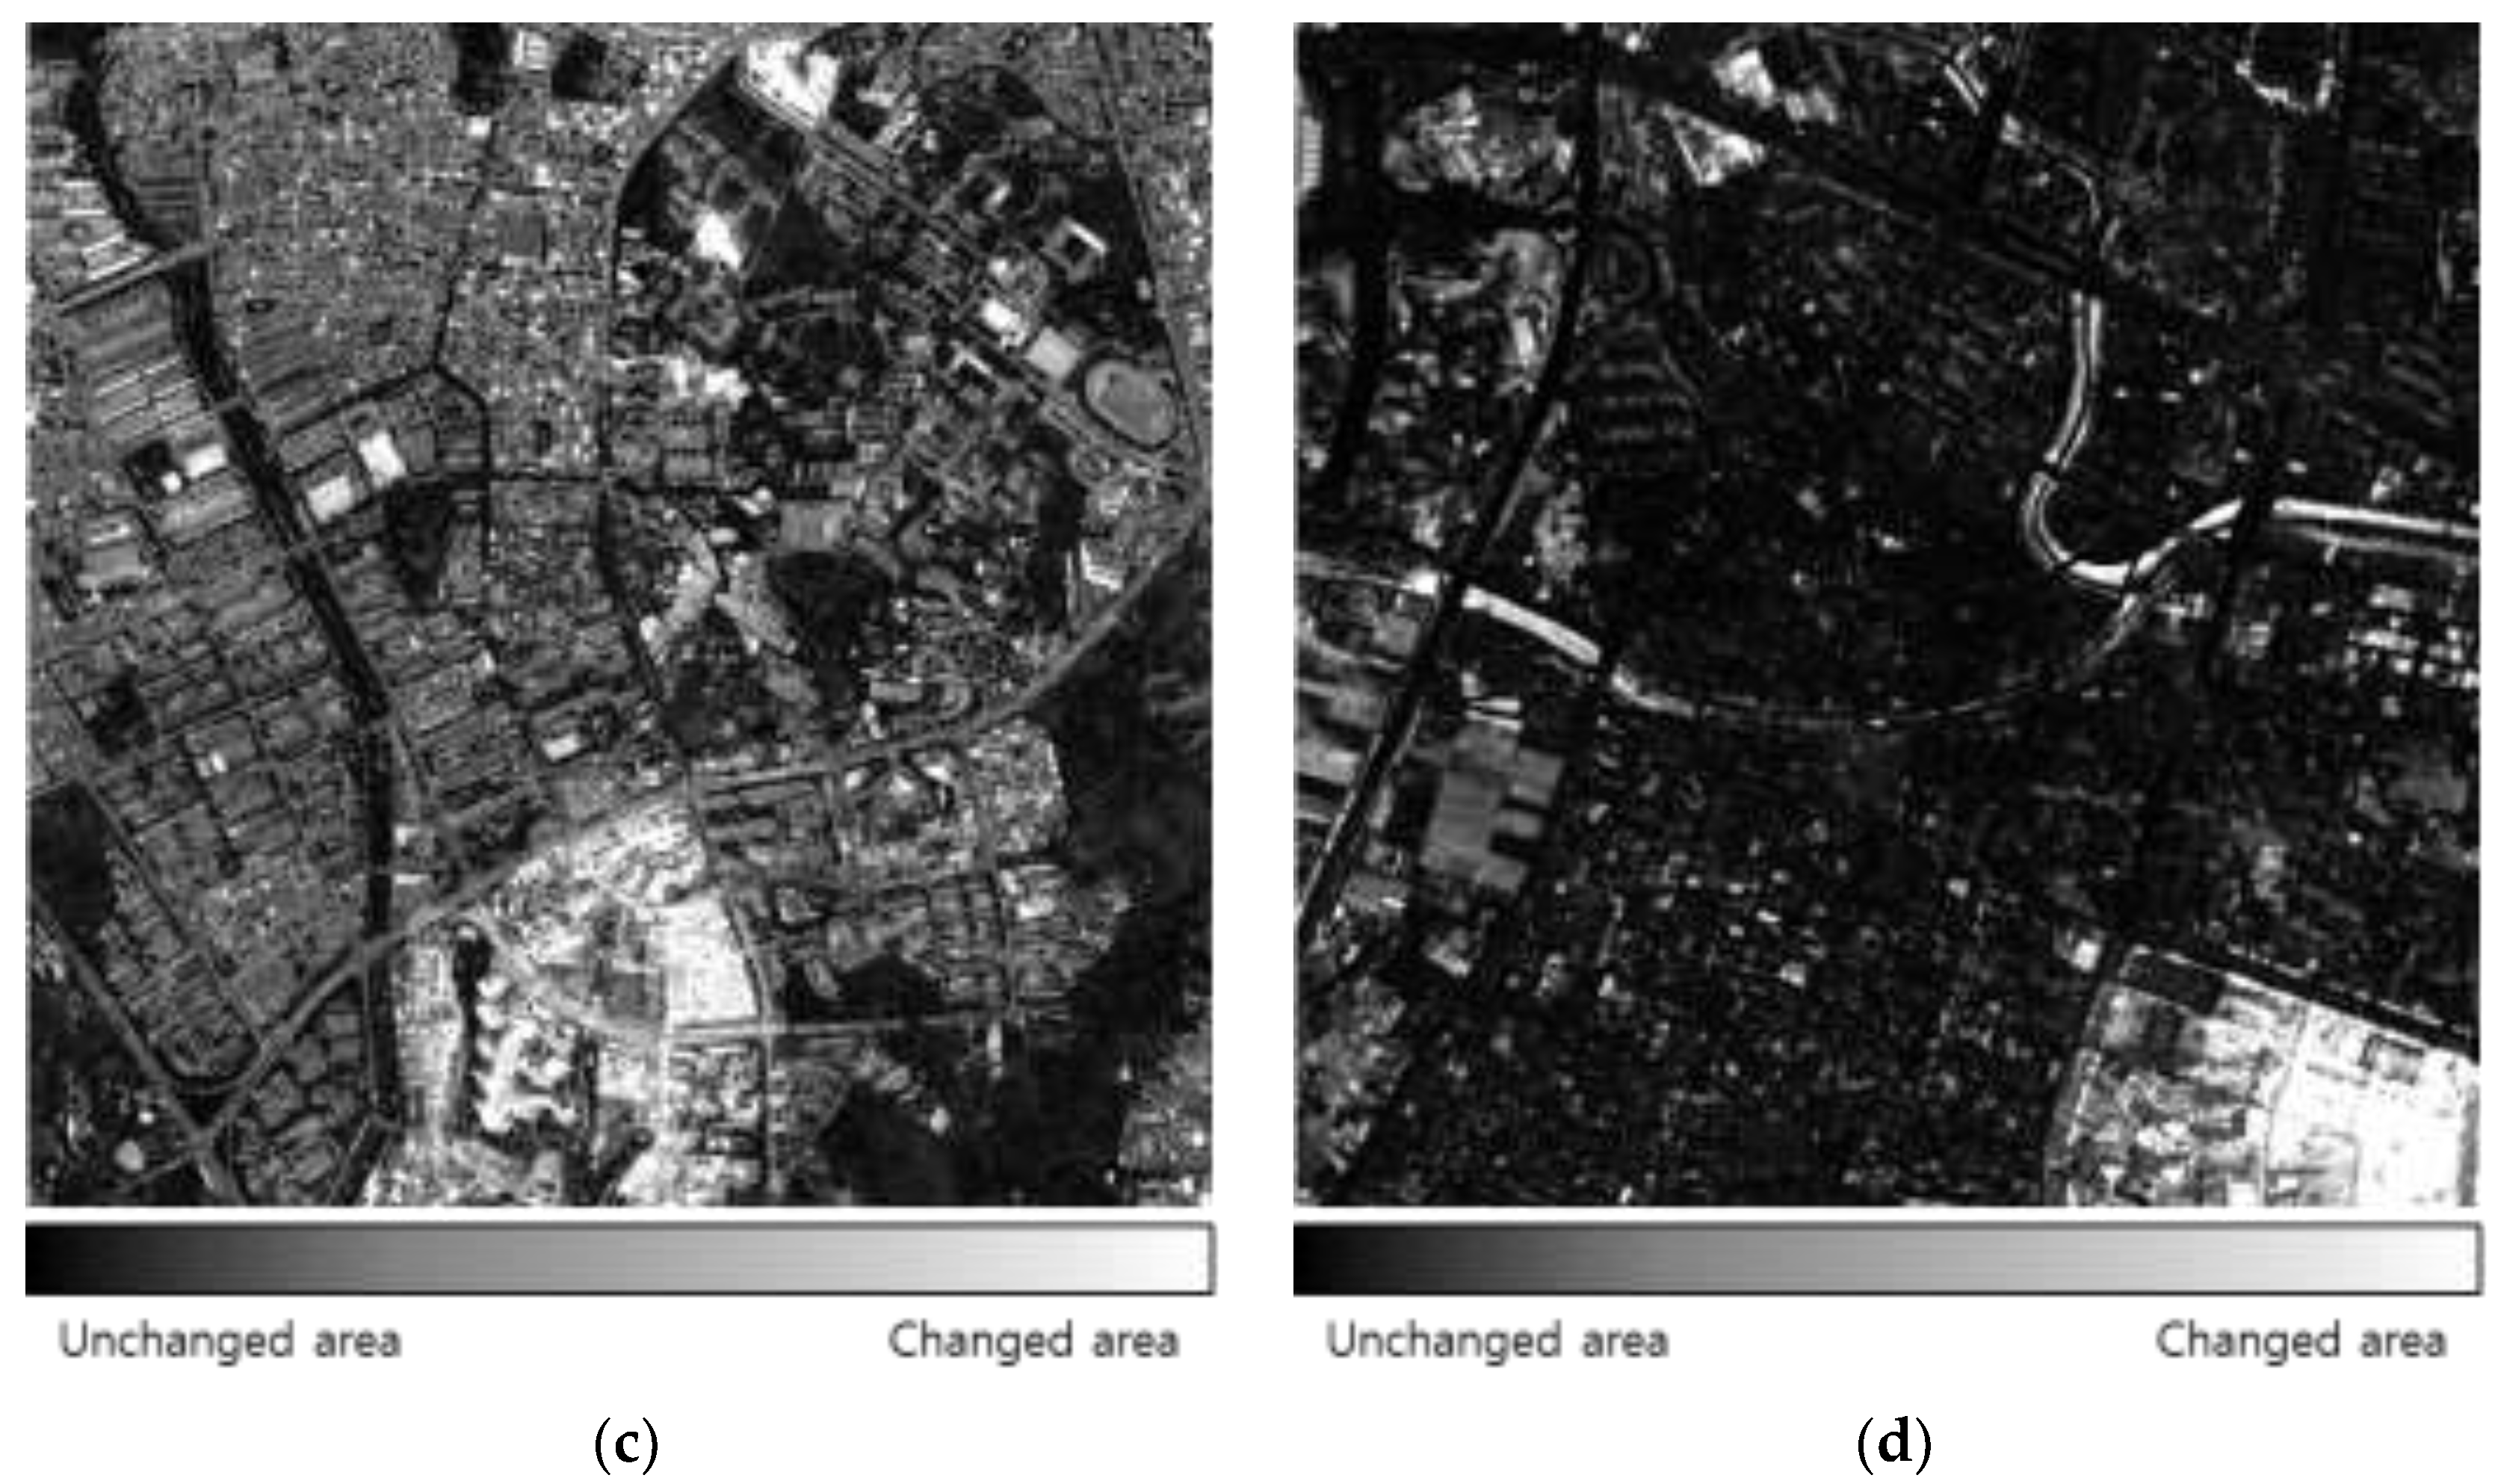
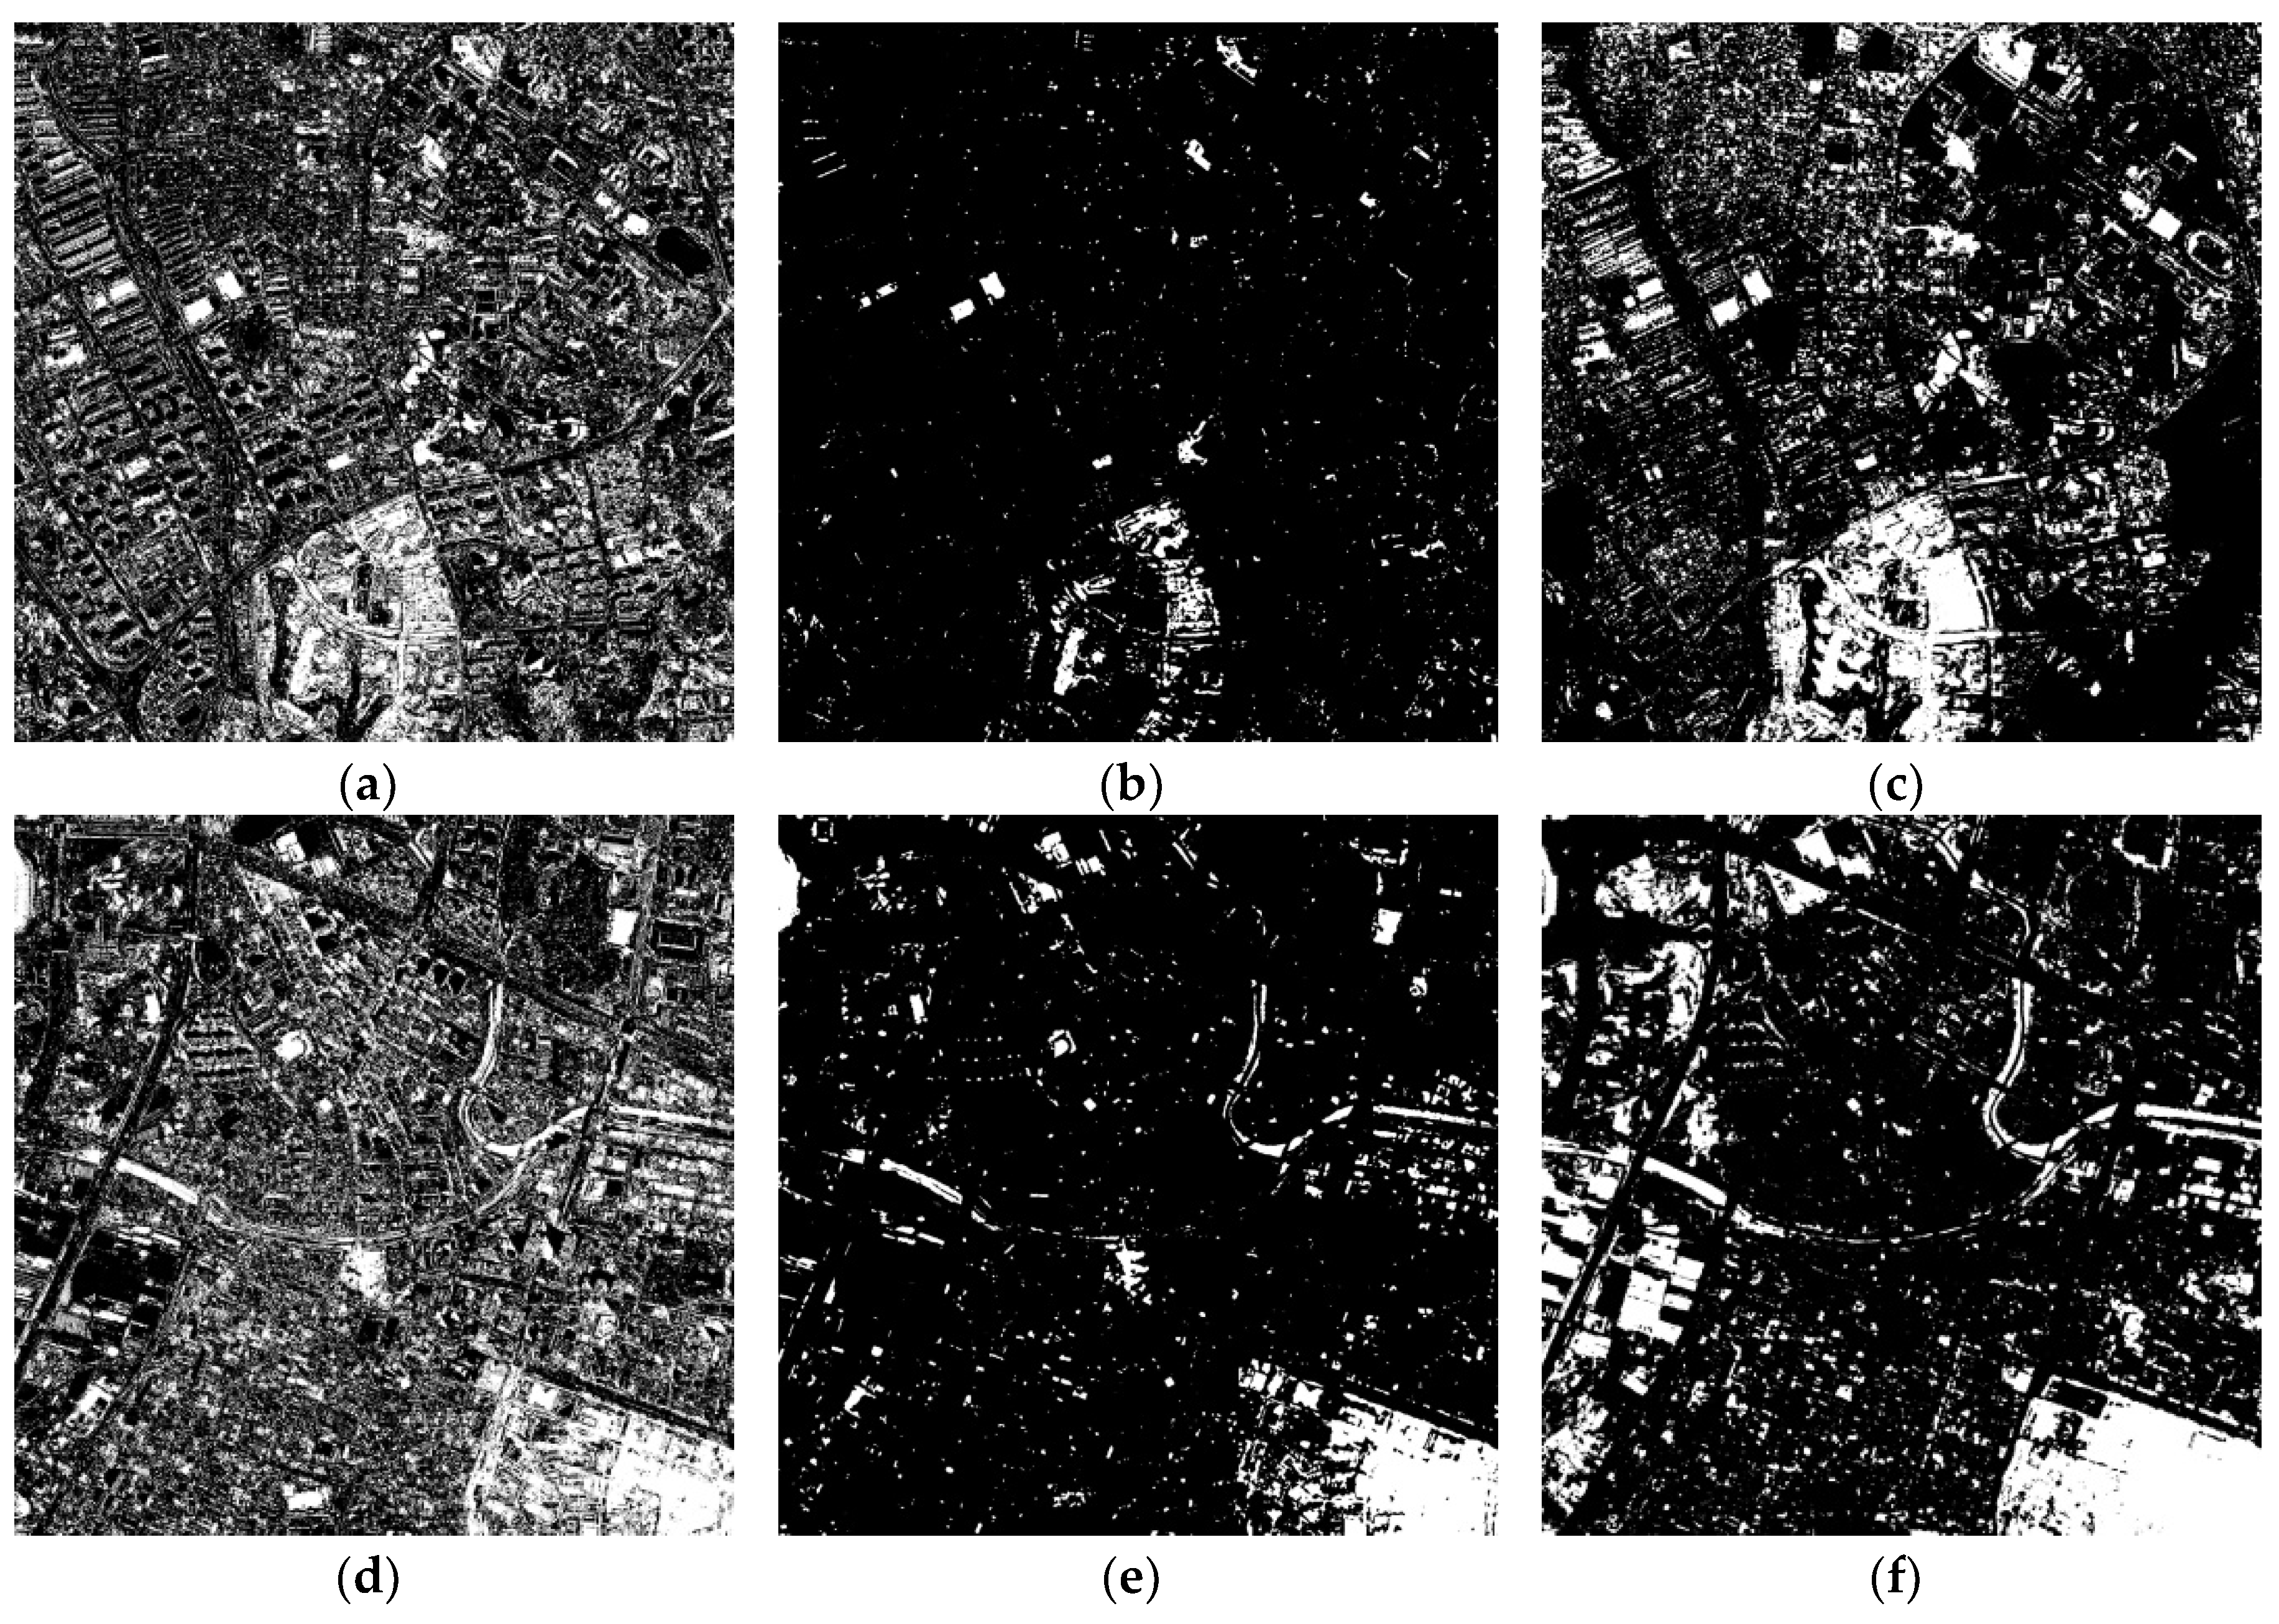
4.2.2. Accuracy Estimation of the Change Detection Results from Cross-Sharpened Images
5. Conclusions
Author Contributions
Funding
Acknowledgments
Conflicts of Interest
References
- Kim, D.S.; Kim, H.T. Automatic thresholding method using cumulative similarity measurement for unsupervised change detection of multispectral and hyperspectral images. Korean J. Remote Sens. 2008, 24, 341–349. [Google Scholar]
- Lu, D.; Li, G.; Moran, E. Current situation and needs of change detection techniques. Int. J. Image Data Fusion 2014, 5, 13–38. [Google Scholar] [CrossRef]
- Volpi, M.; Tuia, D.; Bovolo, F.; Kanevski, M.; Bruzzone, L. Supervised change detection in VHR images using contextual information and support vector machines. Int. J. Appl. Earth Observat. Geoinf. 2013, 20, 77–85. [Google Scholar] [CrossRef]
- Bovolo, F.; Bruzzone, L.; Marconcini, M. A novel approach to unsupervised change detection based on a semisupervised SVM and a similarity measure. IEEE Trans. Geosci. Remote Sens. 2008, 46, 2070–2082. [Google Scholar] [CrossRef]
- Johnson, R.D.; Kasischke, E.S. Change vector analysis: A technique for the multispectral monitoring of land cover and condition. Int. J. Remote Sens. 1998, 19, 411–426. [Google Scholar] [CrossRef]
- Solano-Correa, Y.T.; Bovolo, F.; Bruzzone, L. An approach for unsupervised change detection in multitemporal VHR images acquired by different multispectral sensors. Remote Sens. 2018, 10, 533. [Google Scholar] [CrossRef]
- Chen, J.; Gong, P.; He, C.; Pu, R.; Shi, P. Land-use/land-cover change detection using improved change-vector analysis. Photogramm. Eng. Remote Sens. 2003, 4, 369–379. [Google Scholar] [CrossRef]
- Carvalho Júnior, O.A.; Guimaraes, R.F.; Gillespie, A.R.; Silva, N.C.; Gomes, R.A.T. A new approach to change vector analysis using distance and similarity measures. Remote Sens. 2011, 3, 2473–2493. [Google Scholar] [CrossRef]
- Wu, C.; Du, B.; Zhang, L. A subspace-based change detection method for hyperspectral images. IEEE J. Sel. Top. Appl. Earth Obs. Remote Sens. 2013, 6, 815–830. [Google Scholar] [CrossRef]
- Bovolo, F.; Bruzzone, L. A theoretical framework for unsupervised change detection based on change vector analysis in the polar domain. IEEE Trans. Geosci. Remote Sens. 2007, 45, 218–236. [Google Scholar] [CrossRef]
- Liu, S.; Bruzzone, L.; Bovolo, F.; Du, P. A novel sequential spectral change vector analysis for detecting multiple changes in hyperspectral images. In Proceedings of the 2014 IEEE International Geoscience and Remote Sensing Symposium (IGARSS), Quebec, Canada, 13–18 July 2014; pp. 4656–4659. [Google Scholar]
- Marchesi, S.; Bovolo, F.; Bruzzone, L. A context-sensitive technique robust to registration noise for change detection in VHR multispectral images. IEEE Trans. Image Process. 2010, 19, 1877–1889. [Google Scholar] [CrossRef] [PubMed]
- Im, J.; Jensen, J.R.; Tullis, J.A. Object-based change detection using correlation image analysis and image segmentation. Int. J. Remote Sens. 2013, 29, 399–423. [Google Scholar] [CrossRef]
- Choi, J. Unsupervised change detection for very high-spatial resolution satellite imagery by using object-based IR-MAD algorithm. J. Korean Soc. Surv. Geodesy Photogramm. Cartogr. 2015, 33, 297–304. [Google Scholar]
- Peng, D.; Zhang, Y. Object-based change detection from satellite imagery by segmentation optimization and multi-features fusion, International Journal of Remote Sensing. Int. J. Remote Sens. 2017, 38, 3886–3905. [Google Scholar] [CrossRef]
- Zhang, P.; Gong, M.; Su, L.; Liu, J.; Li, Z. Change detection based on deep feature representation and mapping transformation for multi-spatial-resolution remote sensing images. ISPRS J. Photogramm. Remote Sens. 2016, 116, 24–41. [Google Scholar] [CrossRef]
- Seo, D.K.; Kim, Y.H.; Eo, Y.D.; Park, W.Y.; Park, H.C. Generation of radiometric, phenological normalized image based on random forest regression for change detection. Remote Sens. 2017, 9, 1163. [Google Scholar] [CrossRef]
- Wang, B.; Choi, S.; Byun, Y.; Lee, S.; Choi, J. Object-based change detection of very high resolution satellite imagery using the cross-sharpening of multitemporal data. IEEE Geosci. Remote Sens. Lett. 2015, 12, 1151–1155. [Google Scholar] [CrossRef]
- Byun, Y.; Han, Y.; Chae, T. Image fusion-based change detection for flood extent extraction using bi-temporal very high-resolution satellite images. Remote Sens. 2015, 7, 10347–10363. [Google Scholar] [CrossRef]
- Wang, B.; Choi, J.; Choi, S.; Lee, S.; Wu, P.; Gao, Y. Image fusion-based land cover change detection using multi-temporal high-resolution satellite images. Remote Sens. 2017, 9, 804. [Google Scholar] [CrossRef]
- Park, H.; Choi, J.; Park, N.; Choi, S. Sharpening the VNIR and SWIR bands of Sentinel-2A imagery through modified selected and synthesized band schemes. Remote Sens. 2017, 9, 1080. [Google Scholar] [CrossRef]
- Li, H.; Jing, L.; Tang, Y. Assessment of pansharpening method applied to Worldview-2 imagery fusion. Sensors 2017, 17, 89. [Google Scholar] [CrossRef] [PubMed]
- Wang, Q.; Shi, W.; Li, Z.; Atkinson, P.M. Fusion of Sentinel-2 images. Remote Sens. Environ. 2016, 187, 241–252. [Google Scholar] [CrossRef]
- Pradhan, P.S.; King, R.L.; Younan, N.H.; Holcomb, D.W. Estimation of the number of decomposition levels for a wavelet-based multiresolution multisensory image fusion. IEEE Trans. Geosci. Remote Sens. 2006, 44, 3674–3686. [Google Scholar] [CrossRef]
- Choi, J.; Yeom, J.; Chang, A.; Byun, Y.; Kim, Y. Hybrid pansharpening algorithm for high spatial resolution satellite imagery to improve spatial quality. IEEE Geosci. Remote Sens. Lett. 2013, 10, 490–494. [Google Scholar] [CrossRef]
- Garzelli, A.; Nencini, F. Panchromatic sharpening of remote sensing images using a multiscale Kalman filter. Pattern Recognit. 2007, 40, 3568–3577. [Google Scholar] [CrossRef]
- Baronti, S.; Aiazzi, B.; Selva, M.; Garzelli, A.; Alparone, L. A theoretical analysis of the effects of aliasing and misregistration on pansharpened imagery. IEEE J. Sel. Topics Signal Process. 2011, 5, 446–453. [Google Scholar] [CrossRef]
- Lee, J.; Lee, C. Fast and efficient panchromatic sharpening. IEEE Trans. Geosci. Remote Sens. 2010, 48, 155–163. [Google Scholar]
- Dai, X.; Khorram, S. The effects of image misregistration on the accuracy of remotely sensed change detection. IEEE Trans. Geosci. Remote Sens. 1998, 36, 1566–1577. [Google Scholar]
- Lee, S.B.; Park, W.Y.; Eo, Y.D.; Pyeon, M.W.; Han, S.; Yeon, S.H.; Lee, B.K. Analysis on the applicability of simulated image from SPOT 4 HRVIR image. KSCE J. Civ. Eng. 2017, 21, 1434–1442. [Google Scholar] [CrossRef]
- Lee, M.H.; Lee, S.B.; Eo, Y.D.; Kim, S.W.; Woo, J.; Han, S.H. A comparative study on generating simulated Landsat NDVI images using data fusion and regression method—the case of the Korean peninsula. Environ. Monit. Assess. 2017, 189, 333. [Google Scholar] [CrossRef] [PubMed]
- Choi, J.; Park, H.; Park, N.; Han, S.; Song, J. Deforestation analysis using unsupervised change detection based on ITPCA. Korean J. Remote Sens. 2017, 33, 1233–1242. [Google Scholar]
- Han, Y.; Kim, T.; Han, S.; Song, J. Change detection of urban development over large area using KOMPST optical imagery. Korean J. Remote Sens. 2017, 33, 1223–1232. [Google Scholar]
- Solano-Correa, Y.T.; Bovolo, F.; Bruzzone, L. VHR time-series generation by prediction and fusion of multi-sensor images. In Proceedings of the 2015 IEEE International Geoscience and Remote Sensing Symposium (IGARSS), Milan, Italy, 26–31 July 2015; pp. 3298–3301. [Google Scholar]
- Liu, S.; Bruzzone, L.; Bovolo, F.; Zanetti, M.; Du, P. Sequential spectral change vector analysis for iteratively discovering and detection multiple changes in hyperspectral images. IEEE Geosci. Remote Sens. 2015, 53, 4363–4378. [Google Scholar] [CrossRef]
- Park, N.; Kim, D.; Ahn, J.; Choi, J.; Park, W.; Park, H. Unsupervised change detection based on sequential spectral change vector analysis for updating land cover map. Korean J. Remote Sens. 2017, 33, 1075–1087. [Google Scholar]
- Liu, S.; Du, Q.; Tong, X.; Samat, A.; Bruzzone, L.; Bovolo, F. Multiscale morphological compressed change vector analysis for unsupervised multiple change detection. IEEE J. Sel. Top. Appl. Earth Obs. Remote Sens. 2017, 10, 4124–4137. [Google Scholar] [CrossRef]
- Park, H.; Choi, J.; Oh, J. Seasonal effects removal of unsupervised change detection based multitemporal imagery. J. Korean Soc. Surv. Geodesy Photogramm. Cartogr. 2018, 36, 51–58. [Google Scholar]
- Han, Y.; Bovolo, F.; Bruzzone, L. Segmentation-based fine registration of very high resolution multitemporal images. IEEE Geosci. Remote Sens. 2017, 55, 2884–2897. [Google Scholar] [CrossRef]
- Aiazzi, B.; Baronti, S.; Lotti, F.; Selva, M. A comparison between global and context-adaptive pansharpening of multispectral images. IEEE Geosci. Remote Sens. Lett. 2009, 6, 302–306. [Google Scholar] [CrossRef]
- Garzelli, A. Pansharpening of multispectral images based on nonlocal parameter optimization. IEEE Trans. Geosci. Remote Sens. 2015, 53, 2096–2107. [Google Scholar] [CrossRef]
- Choi, J.; Kim, G.; Park, N.; Park, H.; Choi, S. A hybrid pansharpening algorithm of VHR satellite images that employs injection gains based on NDVI to reduce computational costs. Remote Sens. 2017, 9, 976. [Google Scholar] [CrossRef]
- Guo, Q.; Chen, S.; Leung, H.; Liu, S. Covariance intersection based image fusion technique with application to pansharpening in remote sensing. Inf. Sci. 2010, 180, 3434–3443. [Google Scholar] [CrossRef]
- Li, S. A new pan-sharpening method using a compressed sensing technique. IEEE Trans. Geosci. Remote Sens. 2011, 49, 738–746. [Google Scholar] [CrossRef]
- Cheng, J.; Liu, H.; Liu, T.; Wang, F.; Li, H. Remote sensing image fusion via wavelet transform and sparse representation. ISPRS J. Photogramm. Remote Sens. 2015, 104, 158–173. [Google Scholar] [CrossRef]
- Wei, Q.; Bioucas-Dias, J.; Dobigeon, N.; Tourneret, J.Y. Hyperspectral and multispectral image fusion based on a sparse representation. IEEE Trans. Geosci. Remote Sens. 2015, 53, 3658–3668. [Google Scholar] [CrossRef]
- Mahyari, A.G.; Yazdi, M. Panchromatic and multispectral image fusion based on maximization of both spectral and spatial similarities. IEEE Trans. Geosci. Remote Sens. 2011, 49, 1976–1985. [Google Scholar] [CrossRef]
- Alparone, L.; Aiazzi, B.; Baronti, S.; Garzelli, A.; Nencini, F.; Selva, M. Multispectral and panchromatic data fusion assessment without reference. Photogramm. Eng. Remote Sens. 2008, 74, 193–200. [Google Scholar] [CrossRef]
- Wang, Z.; Bovik, A.C. A universal image quality index. IEEE Geosci. Remote Sens. Lett. 2002, 9, 81–84. [Google Scholar] [CrossRef]
- Falco, N.; Mura, M.D.; Bovolo, F.; Benediktsson, J.A.; Bruzzone, L. Change detection in VHR images based on morphological attribute profiles. IEEE Geosci. Remote Sens. Lett. 2013, 10, 636–640. [Google Scholar] [CrossRef]
- Wen, D.; Huang, X.; Zhang, L.; Benediktsson, J.A. A novel automatic change detection method for urban high-resolution remotely sensed imagery based on multiindex scene representation. IEEE Trans. Geosci. Remote Sens. 2016, 54, 609–625. [Google Scholar] [CrossRef]
- Fluss, R.; Garaggi, D.; Reiser, B. Estimation of the youden index and its associated cutoff point. Biom. J. 2005, 47, 458–472. [Google Scholar] [CrossRef] [PubMed]


| Launch | 28 July 2006 |
|---|---|
| Ground sampling distance | Panchromatic: 1.0 m Multispectral: 4.0 m |
| Spectral bands | Panchromatic: 500–900 nm MS1 (Blue): 450–520 nm MS2 (Green): 520–600 nm MS3 (Red): 630–690 nm MS4 (NIR): 760–900 nm |
| Swath width | 15 km (nadir) |
| Radiometric resolution | 11 bits |
| Site 1 (Cheongju) | Site 2 (Daejeon) | ||
|---|---|---|---|
| Image size | 2400 × 2400 | 2000 × 2000 | |
| Acquisition date | Before change | 18 November 2008 | 5 October 2007 |
| After change | 21 May 2012 | 12 April 2011 | |
| Algorithm | ERGAS | SAM | UIQI | |
|---|---|---|---|---|
| GSA | Time 1 (before change) | 3.5798 | 1.7084 | 0.6943 |
| Time 2 (after change) | 3.0608 | 1.9015 | 0.6795 | |
| GS2 | Time 1 | 2.7289 | 1.1826 | 0.7825 |
| Time 2 | 2.4152 | 1.4444 | 0.7529 | |
| NDVI-based algorithm | Time 1 | 2.7742 | 1.4072 | 0.7899 |
| Time 2 | 2.5982 | 1.5166 | 0.7521 | |
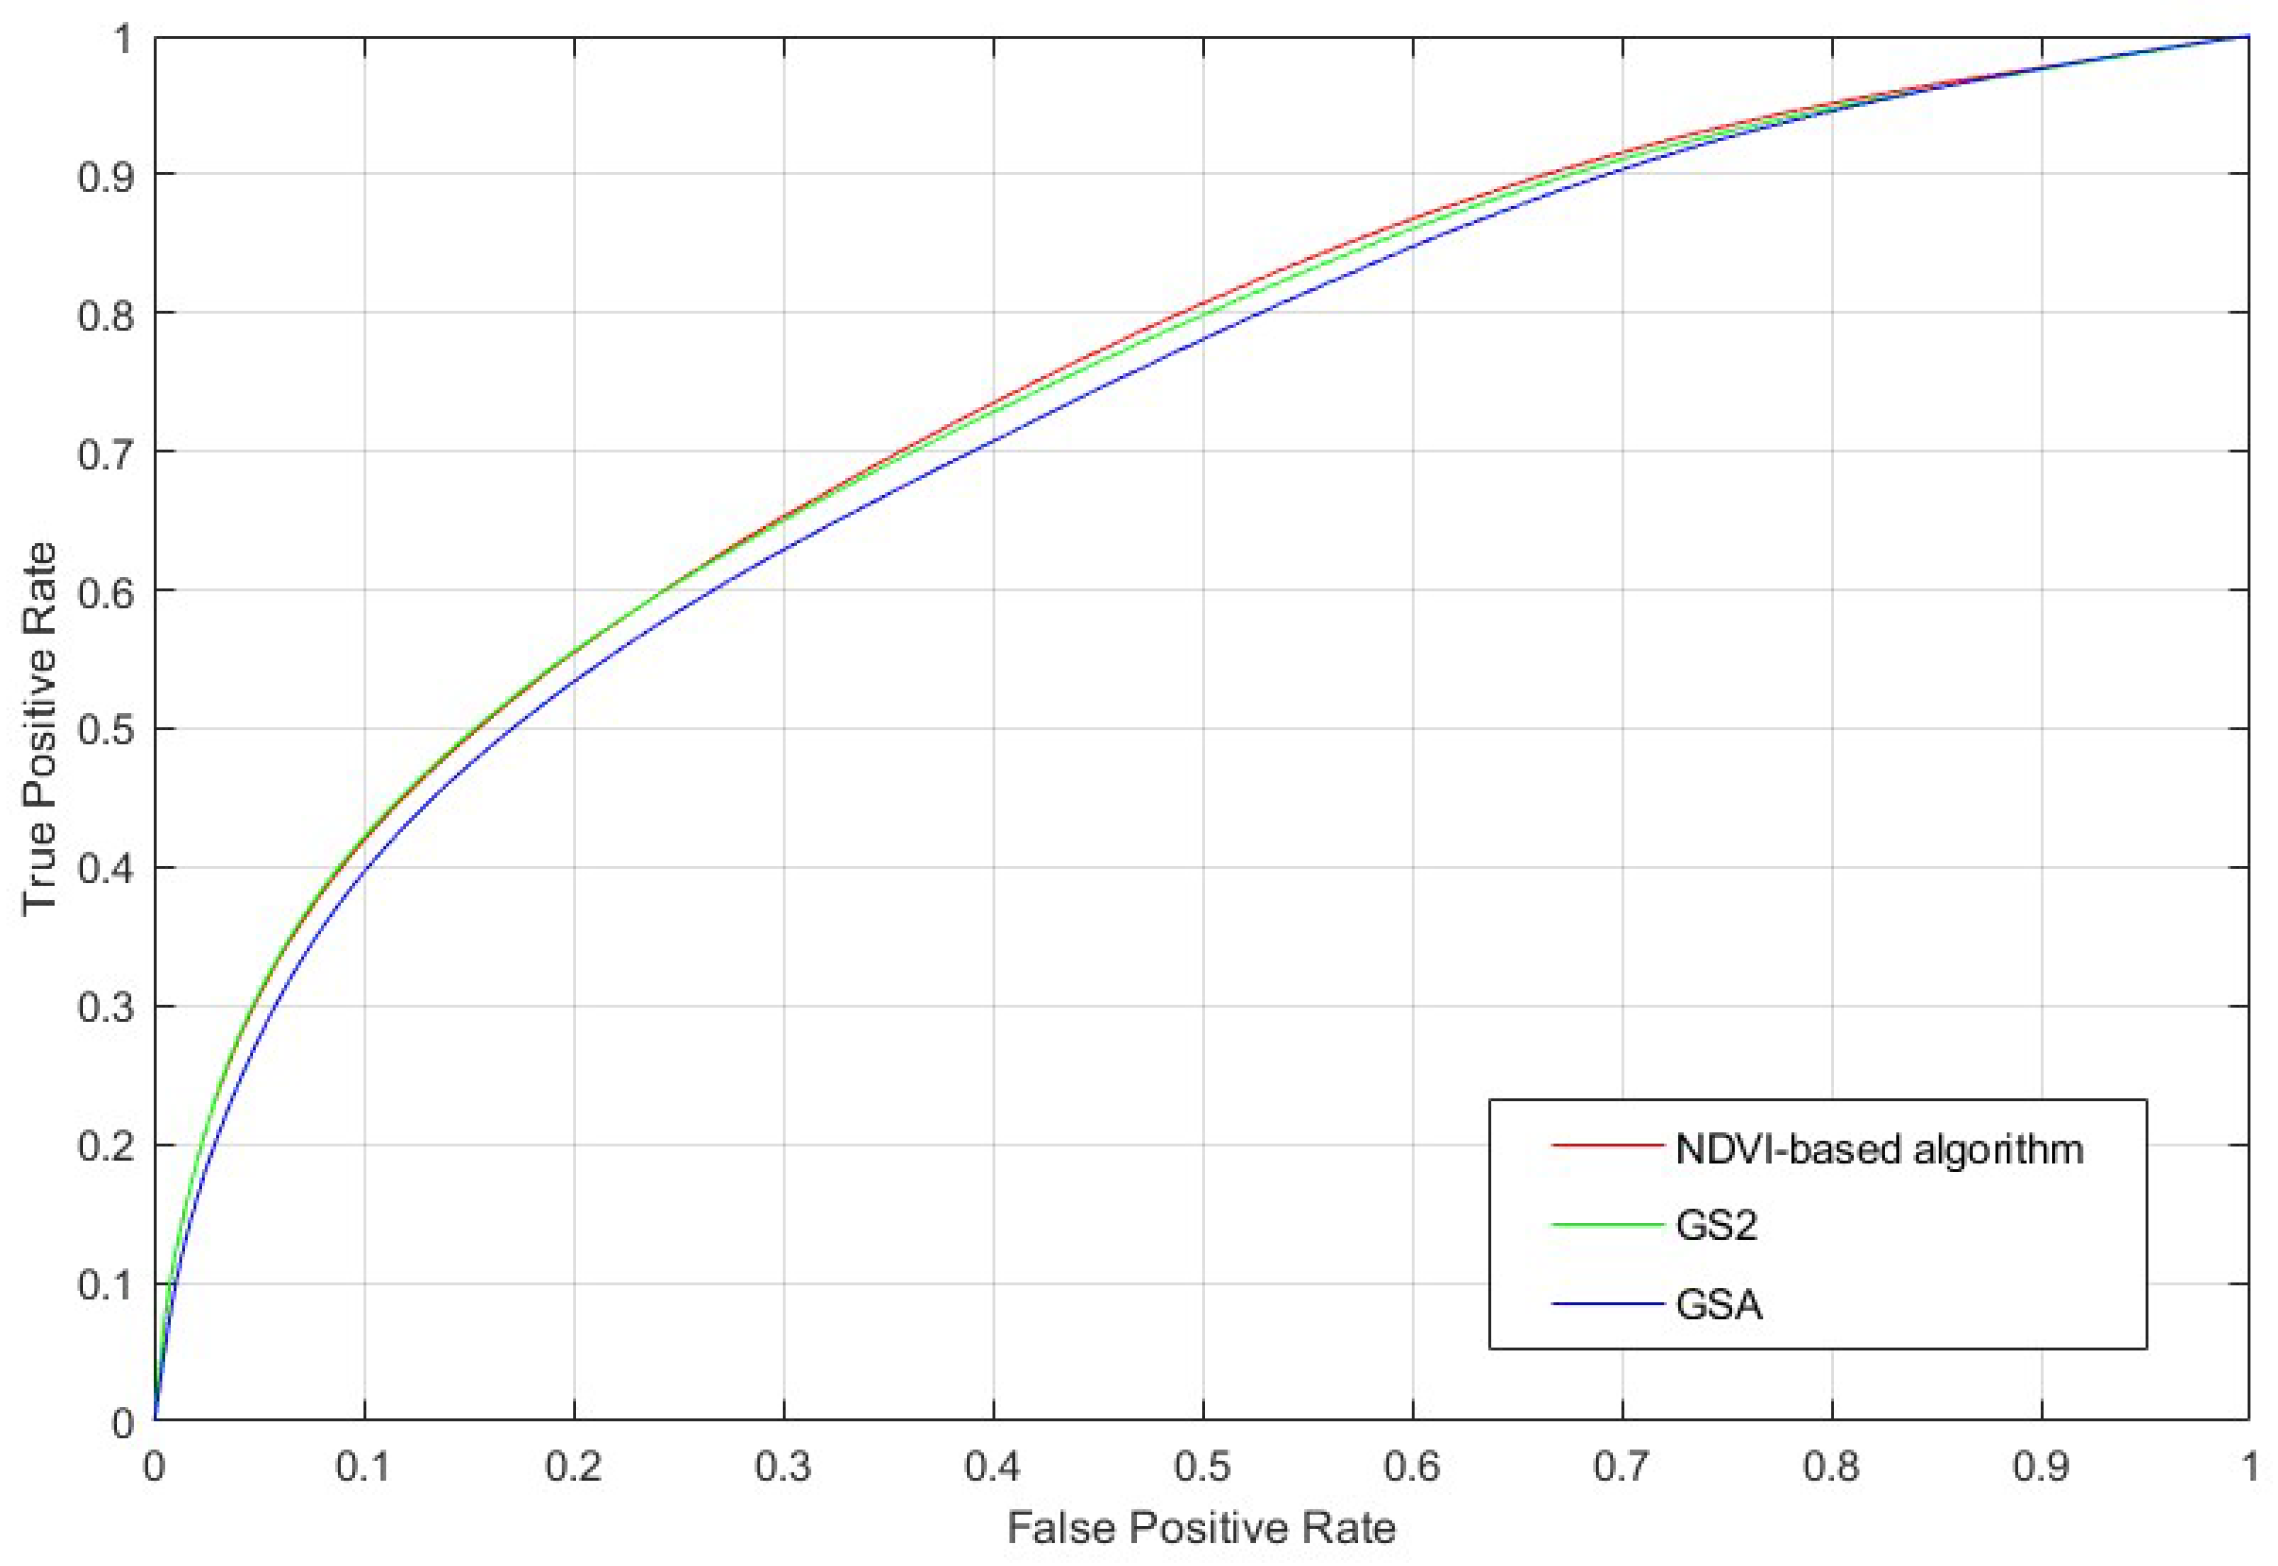
| Algorithm | AUC |
|---|---|
| GSA | 0.7290 |
| GS2 | 0.7433 |
| NDVI-based algorithm | 0.7464 |
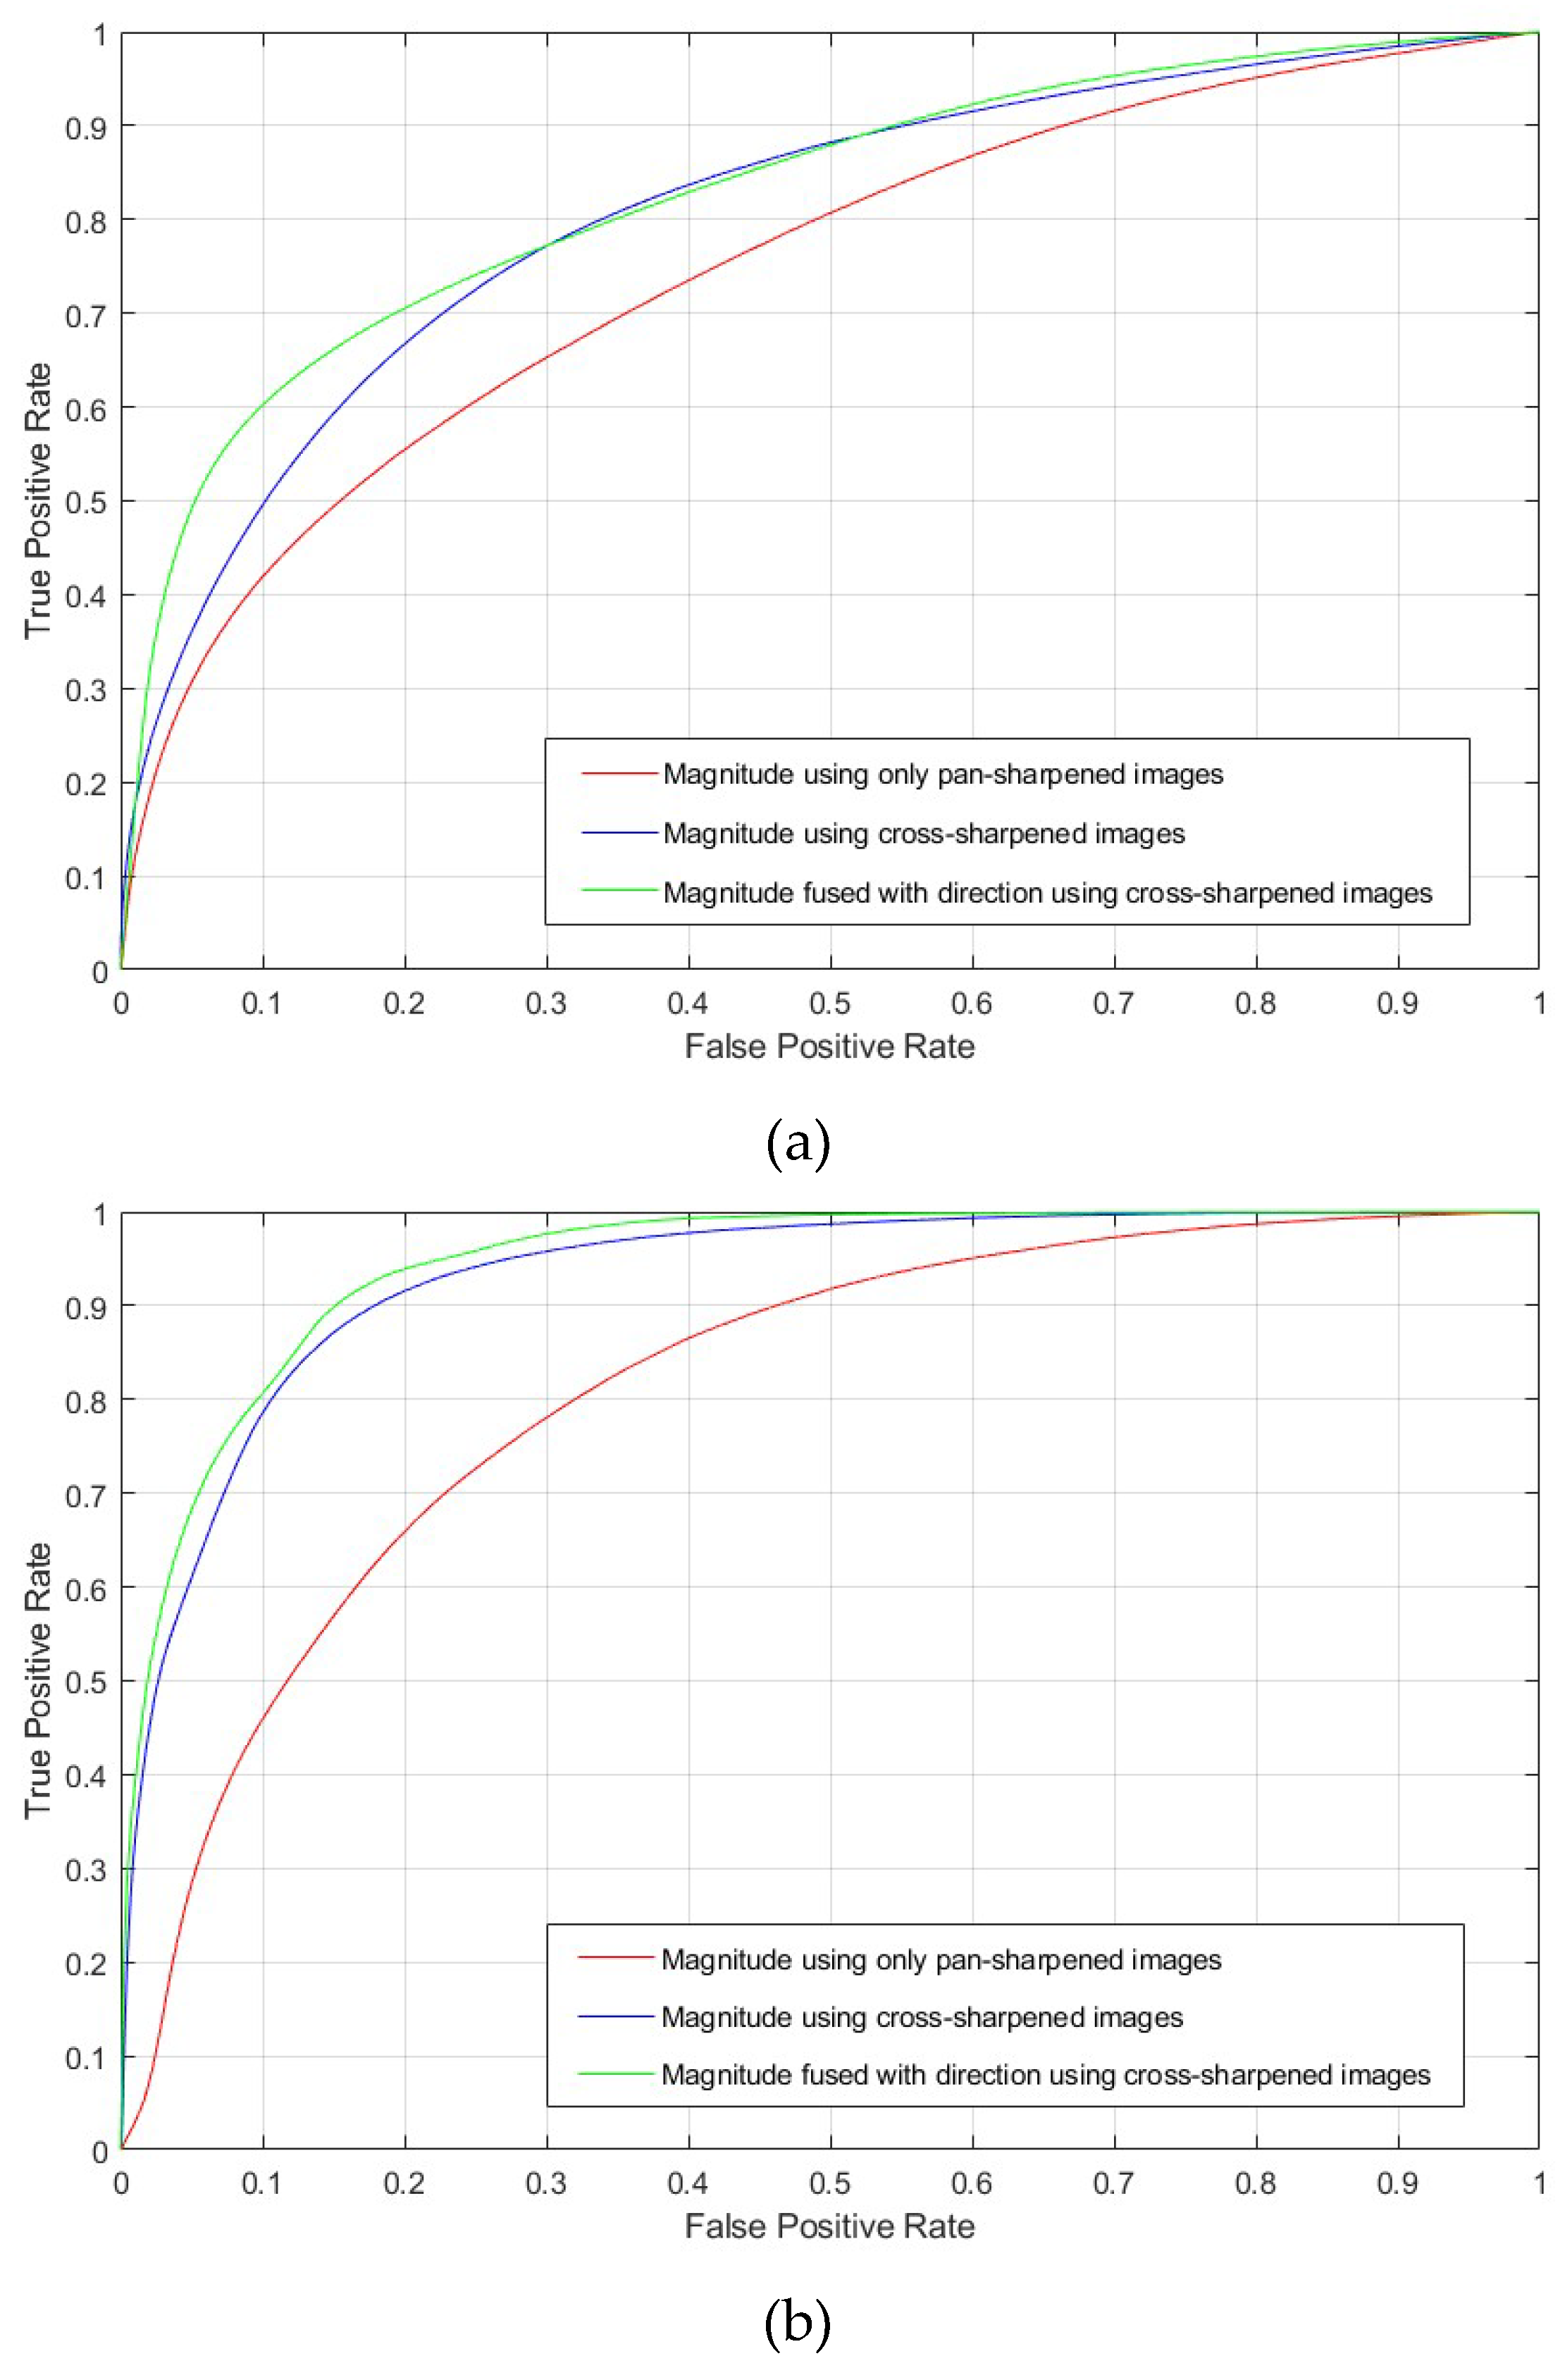
| Study Area | Change Detection | AUC |
|---|---|---|
| Site 1 | Magnitude using only pan-sharpened images | 0.7464 |
| Magnitude using cross-sharpened images | 0.8070 | |
| Magnitude fused with direction using cross-sharpened images | 0.8272 | |
| Site 2 | Magnitude using only pan-sharpened images | 0.8192 |
| Magnitude using cross-sharpened images | 0.9342 | |
| Magnitude fused with direction using cross-sharpened images | 0.9456 |
| Using Only Pan-Sharpened Images | Using only the Magnitude of Cross-Sharpened Images | Using Fused Magnitude and the Direction of Cross-Sharpened Images | |||||
|---|---|---|---|---|---|---|---|
| Ground Truth | Ground Truth | Ground Truth | |||||
| Changed | Unchanged | Changed | Unchanged | Changed | Unchanged | ||
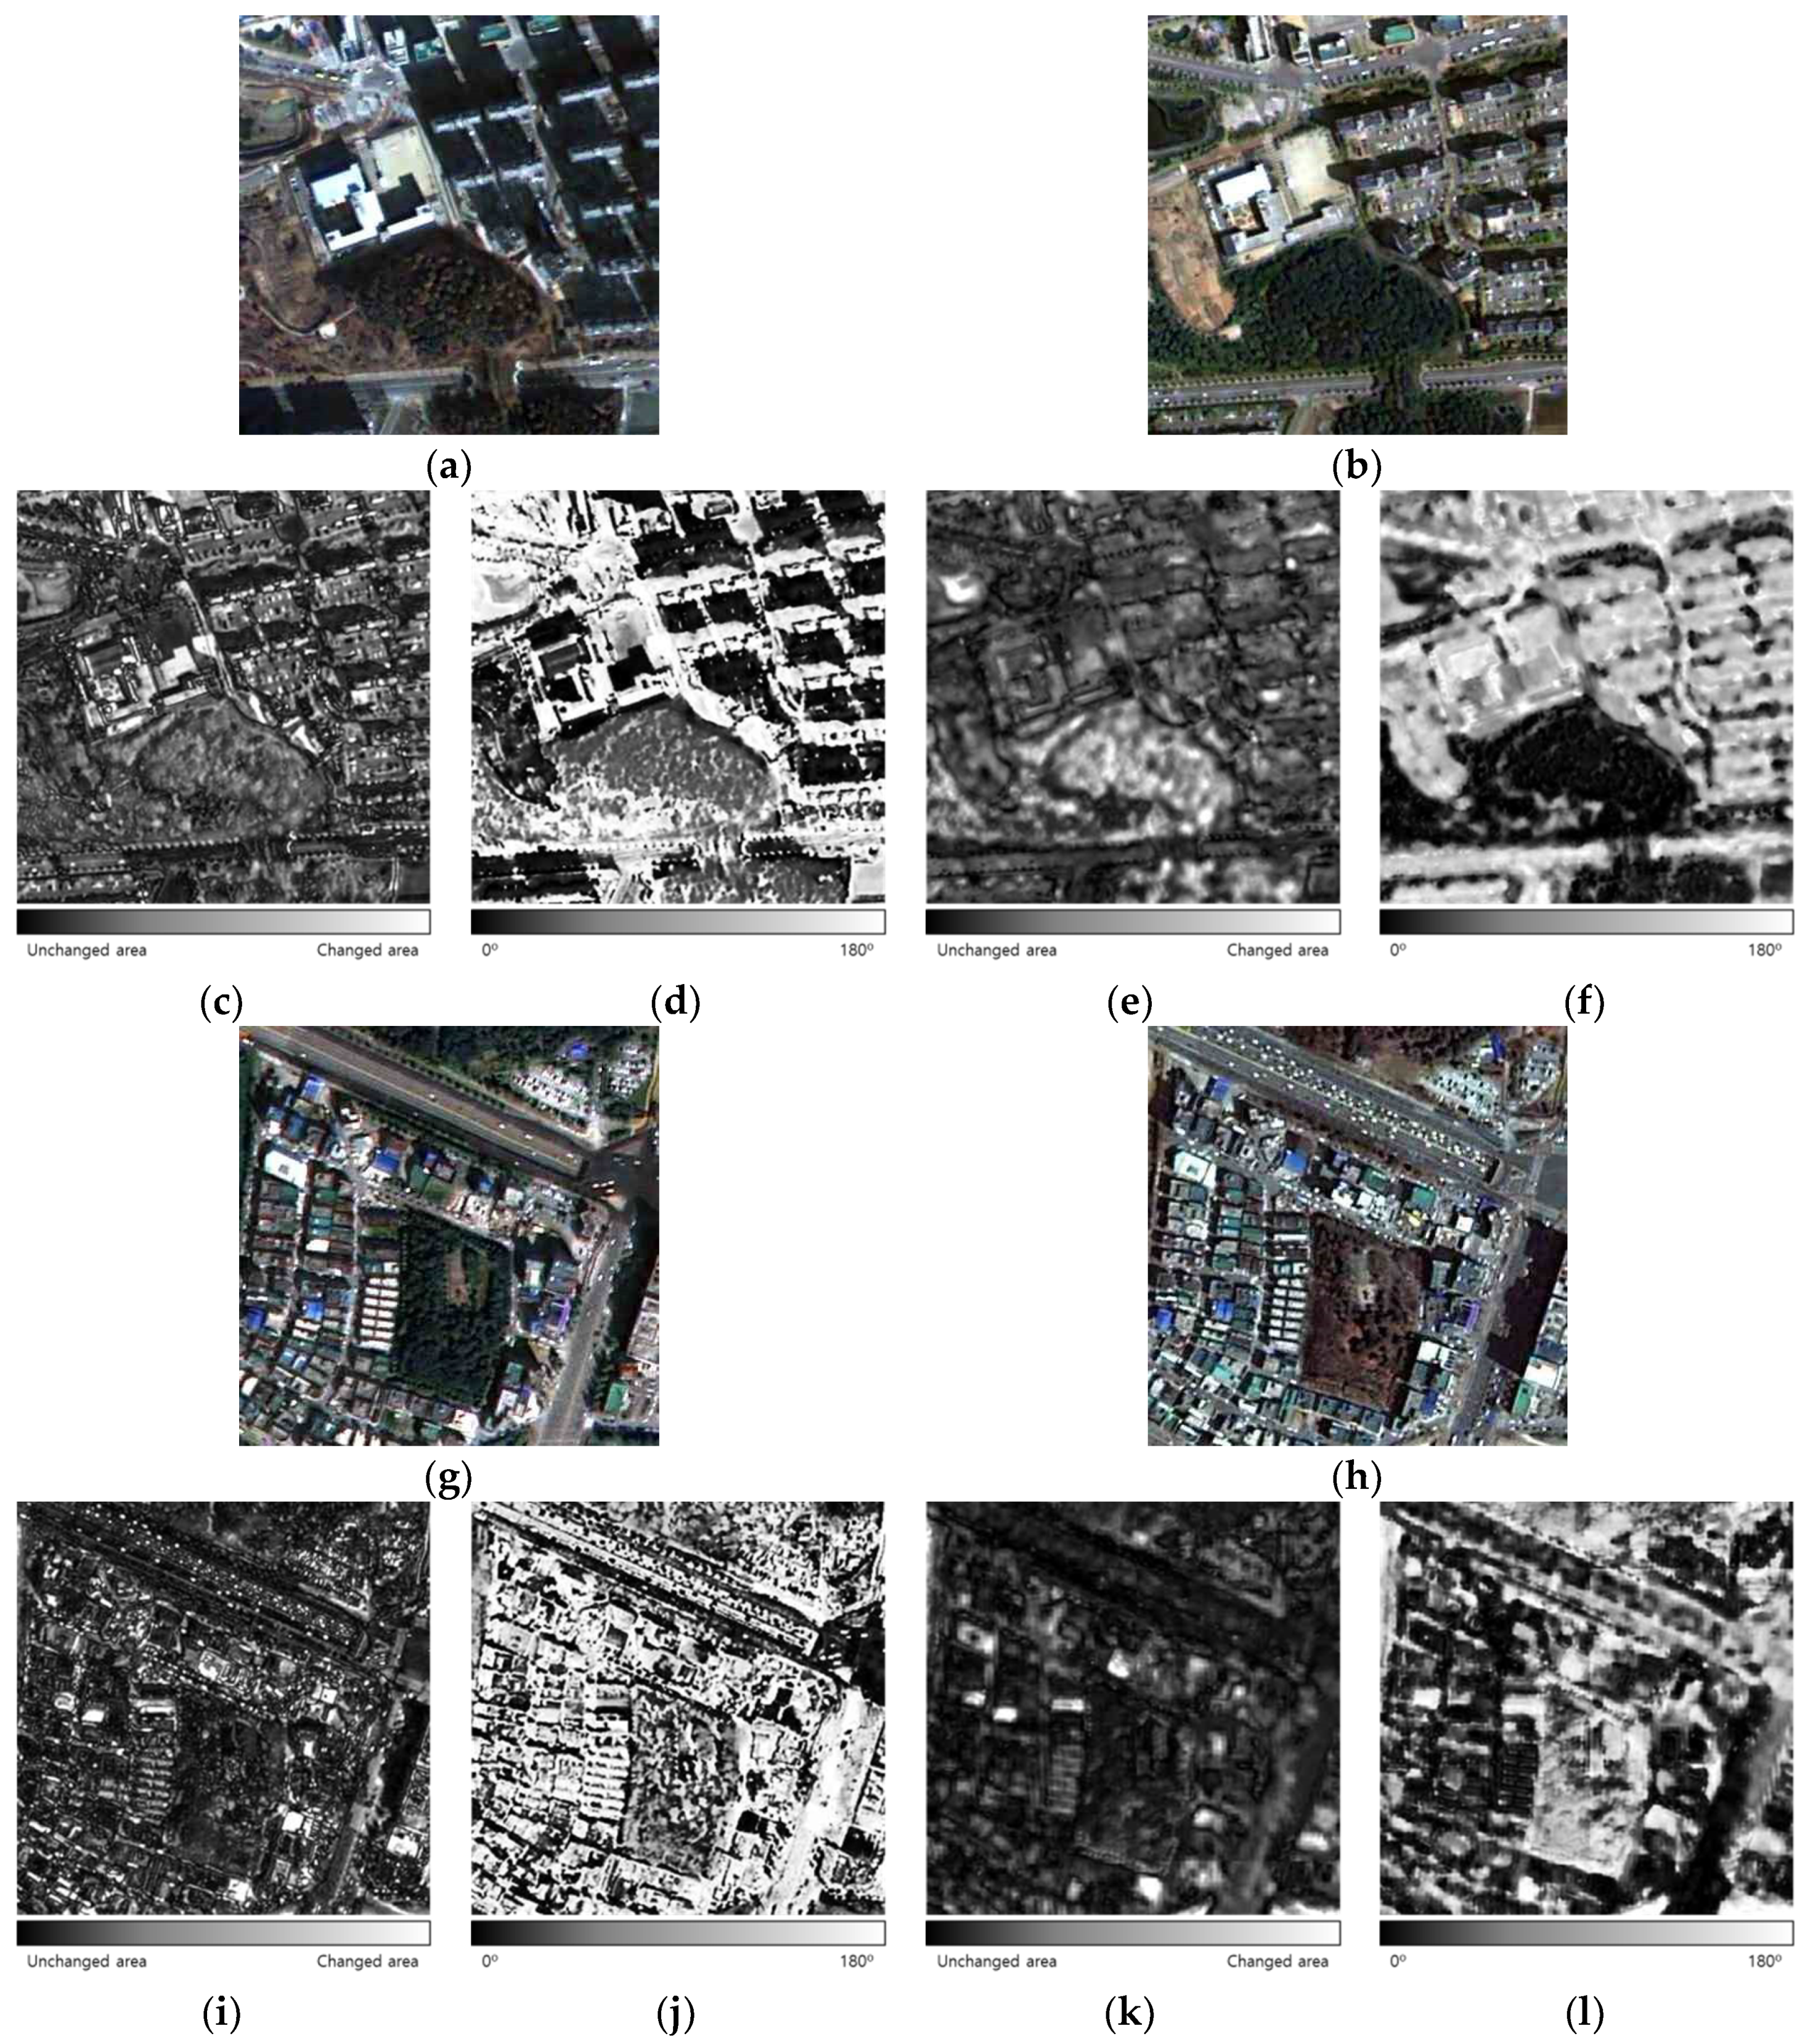
| Change detection map | Changed | 320494 | 1295246 | 103913 | 65526 | 349142 | 765278 |
| Unchanged | 210088 | 3934172 | 426669 | 5163892 | 181440 | 4464140 | |
| Detection rate | 0.604 | 0.196 | 0.658 | ||||
| False alarm rate | 0.248 | 0.012 | 0.146 | ||||
| Overall accuracy | 0.739 | 0.914 | 0.836 | ||||
| Using Only Pan-Sharpened Images | Using Only the Magnitude of Cross-Sharpened Images | Using Fused Magnitude and the Direction of Cross-Sharpened Images | |||||
|---|---|---|---|---|---|---|---|
| Ground Truth | Ground Truth | Ground Truth | |||||
| Changed | Unchanged | Changed | Unchanged | Changed | Unchanged | ||
| Change detection map | Changed | 138236 | 1138727 | 114519 | 219431 | 161276 | 605647 |
| Unchanged | 39315 | 2683722 | 63032 | 3603018 | 16275 | 3216802 | |
| Detection rate | 0.779 | 0.645 | 0.908 | ||||
| False alarm rate | 0.298 | 0.057 | 0.158 | ||||
| Overall accuracy | 0.705 | 0.929 | 0.844 | ||||
© 2018 by the authors. Licensee MDPI, Basel, Switzerland. This article is an open access article distributed under the terms and conditions of the Creative Commons Attribution (CC BY) license (http://creativecommons.org/licenses/by/4.0/).
Share and Cite
Park, H.; Choi, J.; Park, W.; Park, H. Modified S2CVA Algorithm Using Cross-Sharpened Images for Unsupervised Change Detection. Sustainability 2018, 10, 3301. https://doi.org/10.3390/su10093301
Park H, Choi J, Park W, Park H. Modified S2CVA Algorithm Using Cross-Sharpened Images for Unsupervised Change Detection. Sustainability. 2018; 10(9):3301. https://doi.org/10.3390/su10093301
Chicago/Turabian StylePark, Honglyun, Jaewan Choi, Wanyong Park, and Hyunchun Park. 2018. "Modified S2CVA Algorithm Using Cross-Sharpened Images for Unsupervised Change Detection" Sustainability 10, no. 9: 3301. https://doi.org/10.3390/su10093301
APA StylePark, H., Choi, J., Park, W., & Park, H. (2018). Modified S2CVA Algorithm Using Cross-Sharpened Images for Unsupervised Change Detection. Sustainability, 10(9), 3301. https://doi.org/10.3390/su10093301