Social Vulnerability Assessment Using Artificial Neural Network (ANN) Model for Earthquake Hazard in Tabriz City, Iran


 ,
,  ,
,  ,
, 
Abstract
1. Introduction
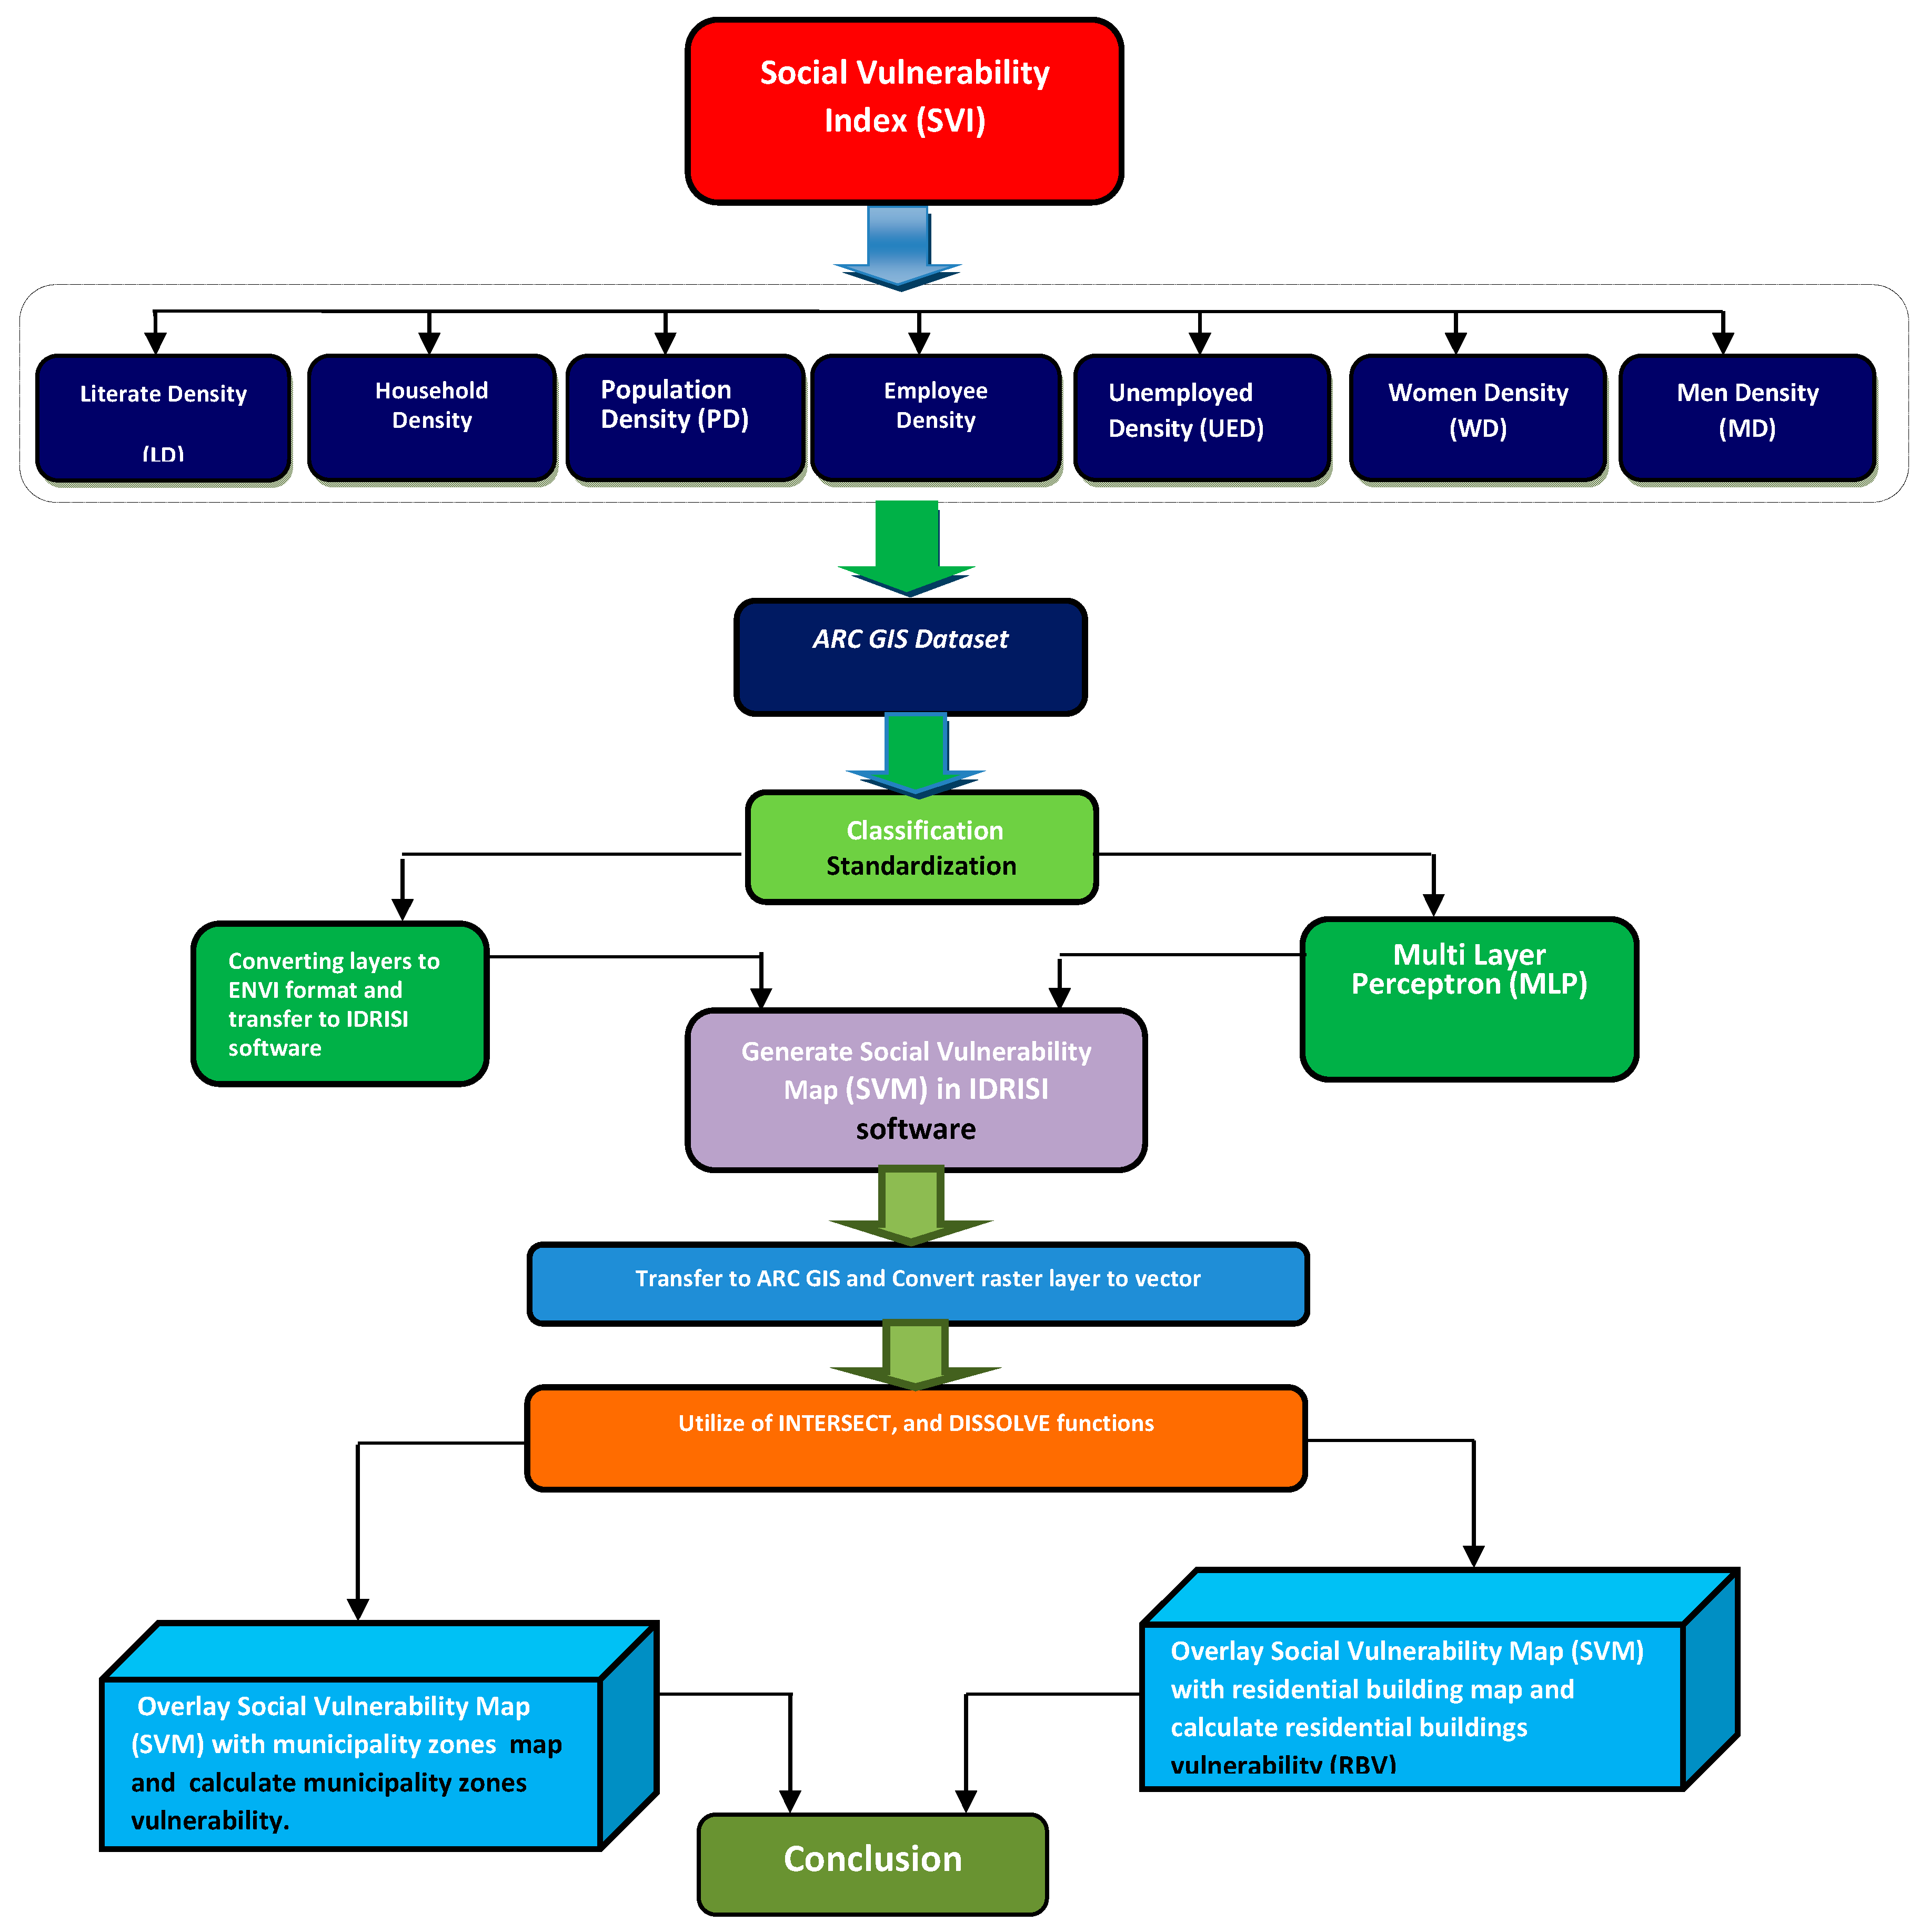
2. Materials and Methods
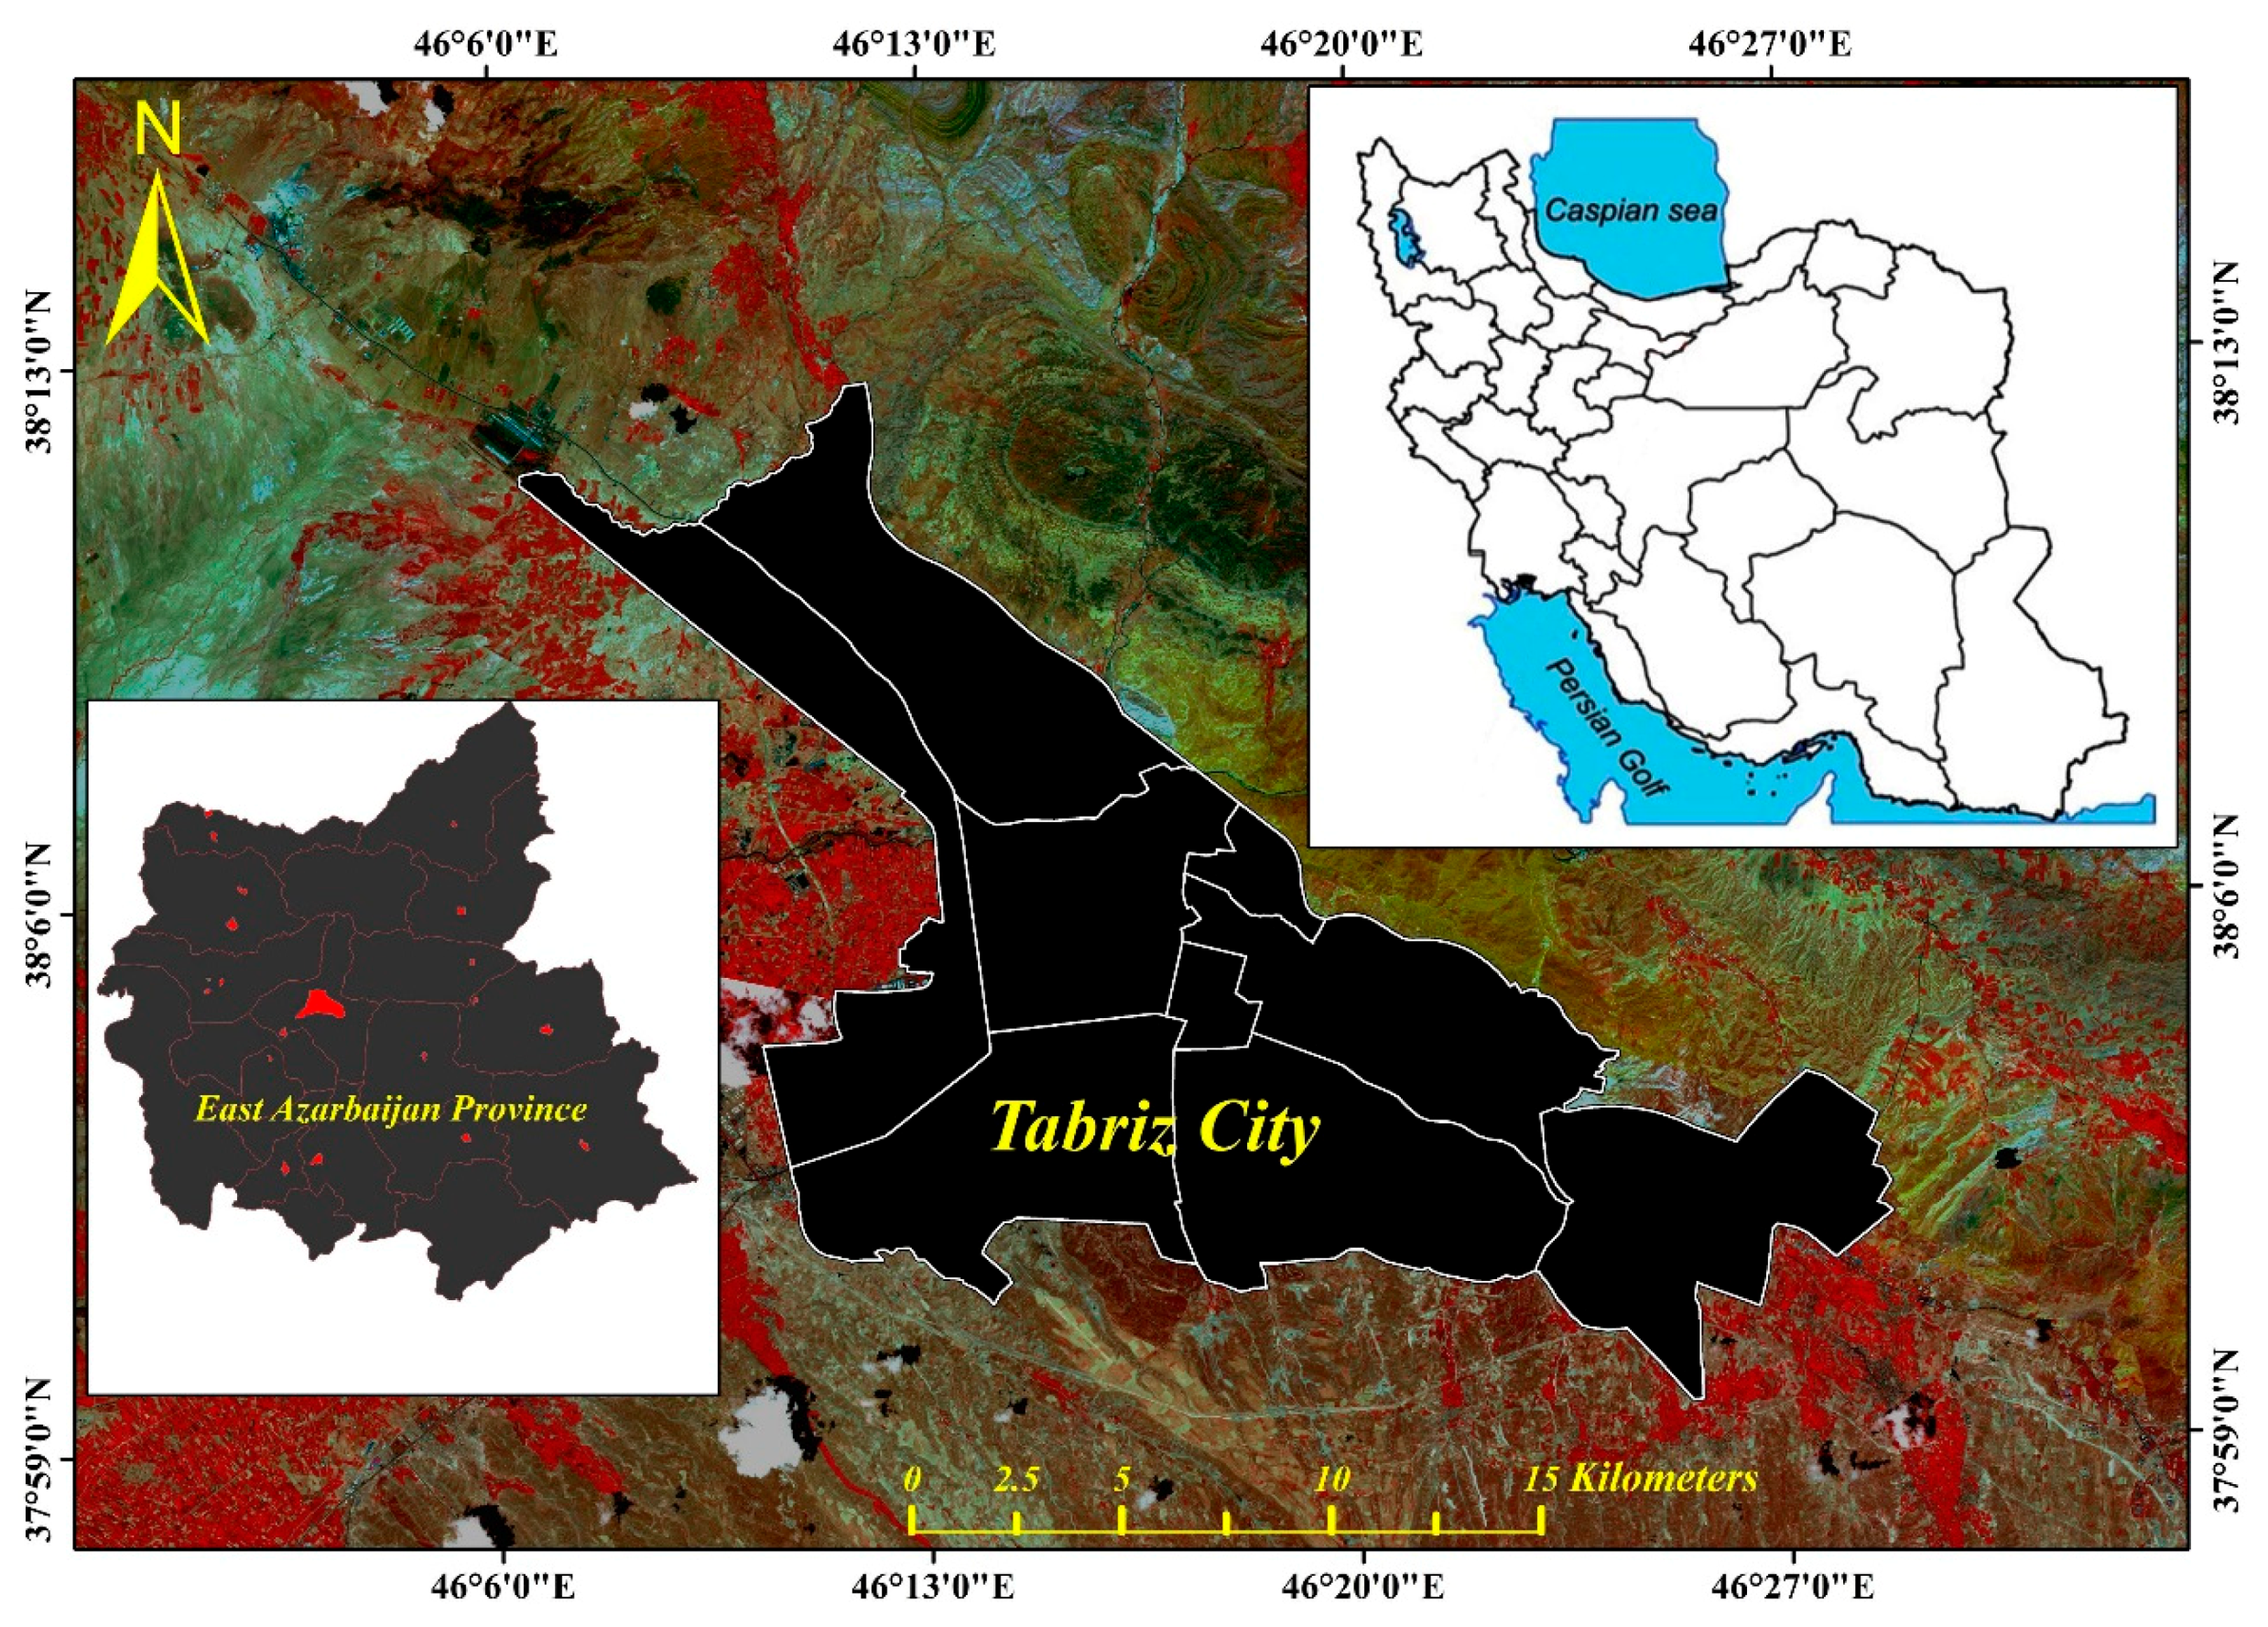
2.1. Study Area
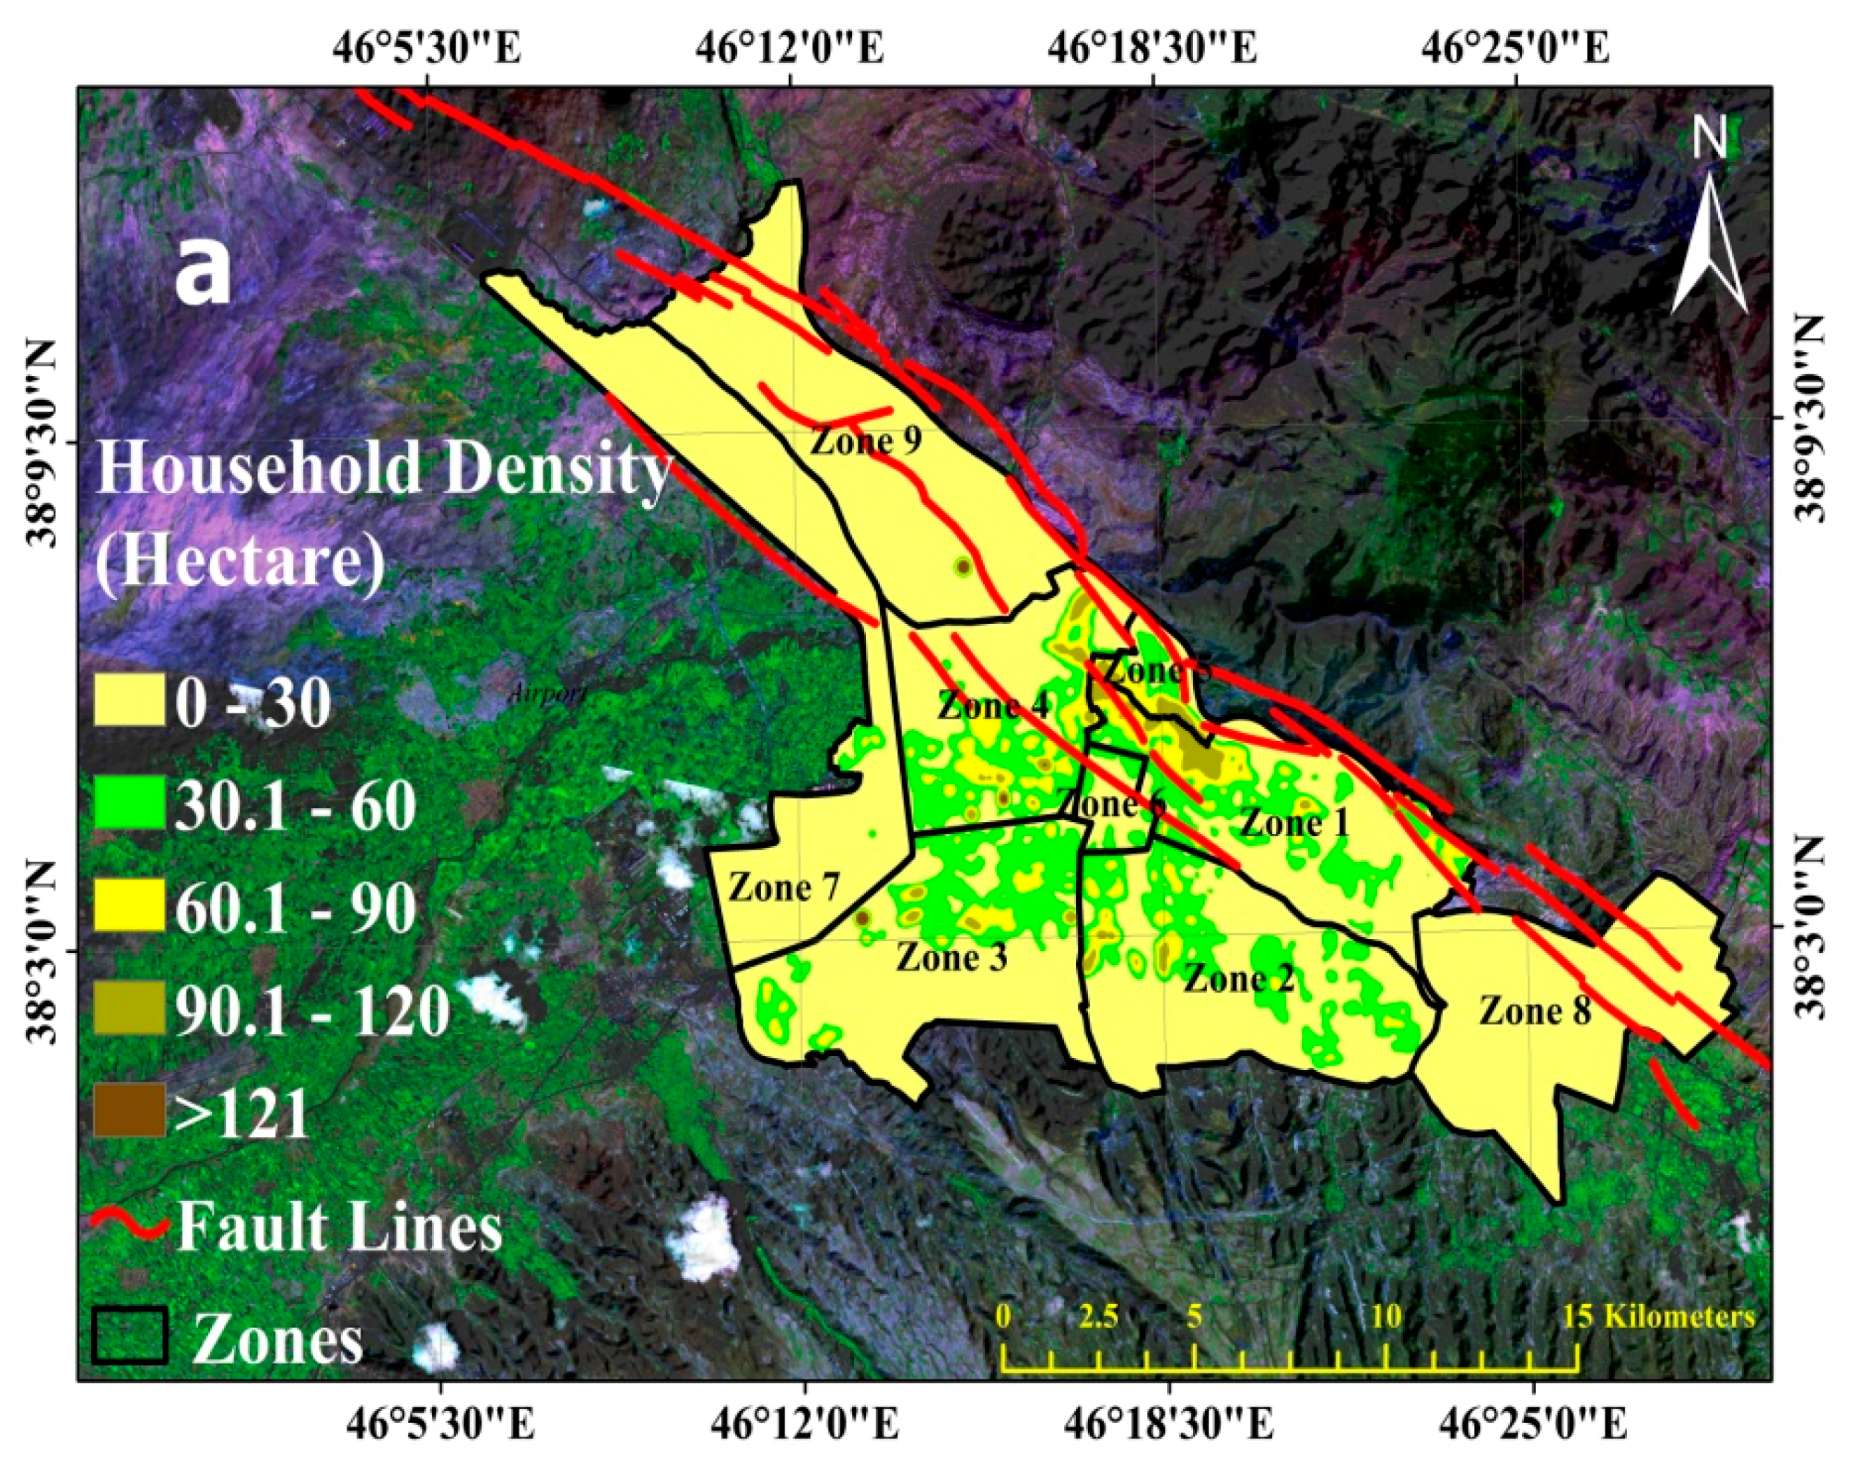
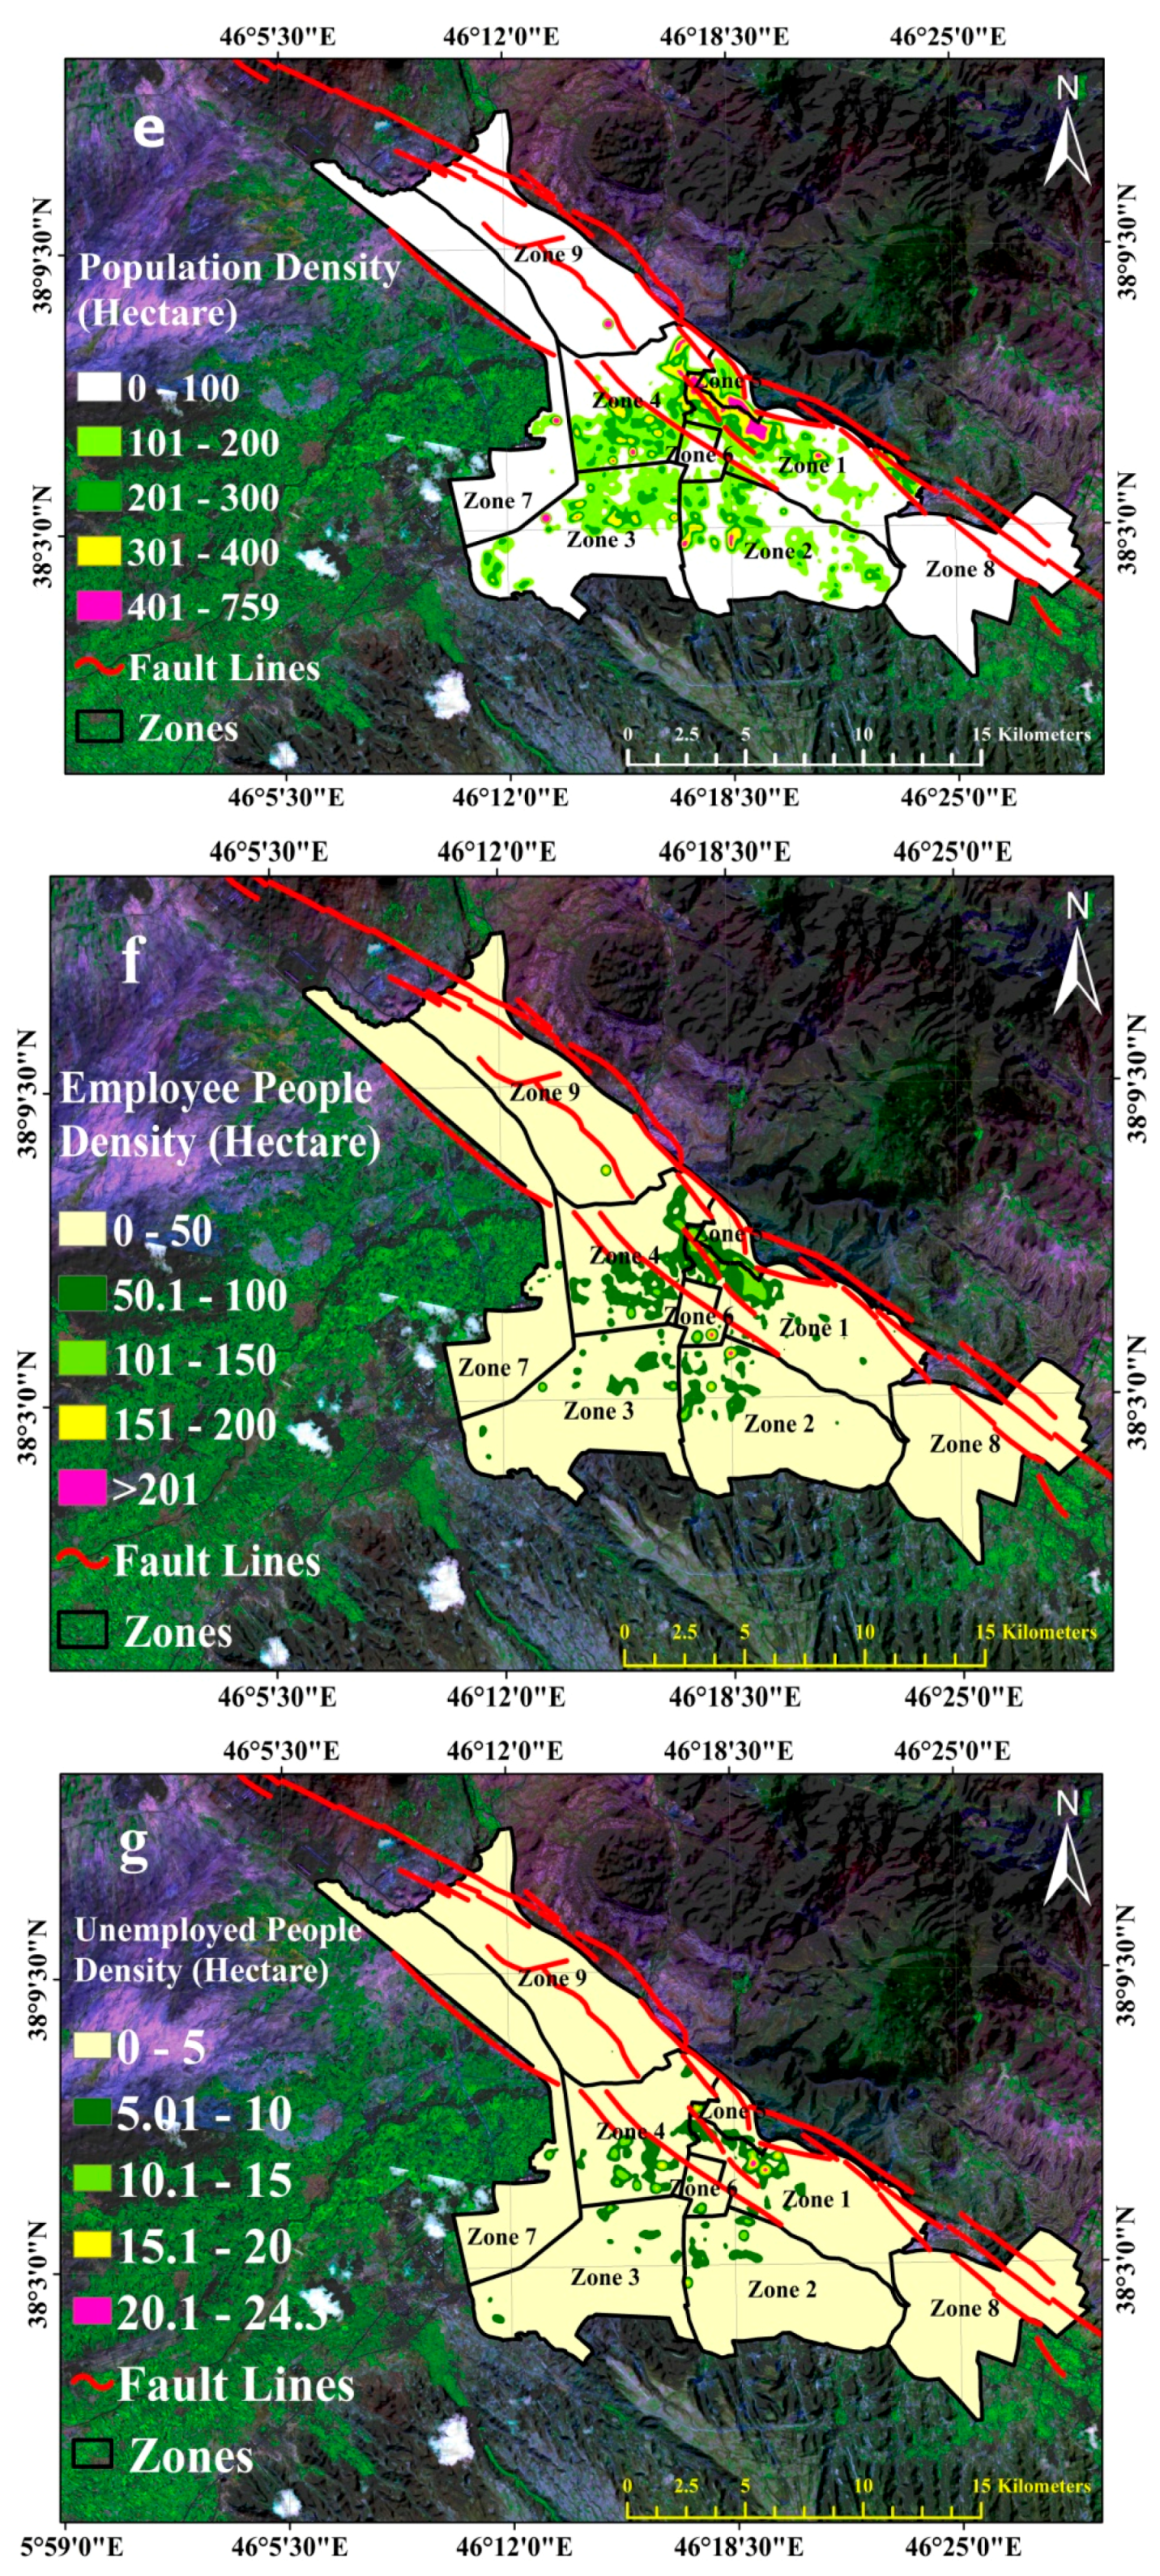
2.2. The Data Sets Used
2.3. Classification and Standardization
2.4. Artificial Neural Network (ANN)
2.5. Data Analysis
3. Results
4. Discussion
5. Investigating the Accuracy of the Obtained Results
6. Conclusions
Author Contributions
Funding
Acknowledgments
Conflicts of Interest
References
- Xu, C.; Dai, F.C.; Xu, X.W. Wenchuan earthquake-induced landslides: An overview. Geol. Rev. 2010, 56, 860–874. [Google Scholar]
- Zhang, J.S.; Jia, Z.K. The study on assessment index of urban social vulnerability to the earthquake disaster. Technol. Guide 2010, 36, 12–14. [Google Scholar]
- Zebardast, E. Constructing a social vulnerability index to earthquake hazards using a hybrid factor analysis and analytic network process (F’ANP) model. Nat. Hazards 2013, 65, 1331–1359. [Google Scholar] [CrossRef]
- Panahi, M.; Rezaie, F.; Meshkani, A.S. Seismic vulnerability assessment of school buildings in Tehran city based on AHP and GIS. Nat. Hazards Earth Syst. Sci. 2014, 14, 969–979. [Google Scholar] [CrossRef]
- Asef, M.R. Modeling the elements of country vulnerability to earthquake disasters. Disasters 2008, 32, 480–498. [Google Scholar] [CrossRef] [PubMed]
- Mahdi, T.; Mahdi, A. Reconstruction and retrofitting of buildings after recent earthquakes in Iran. Procedia Eng. 2013, 54, 127–139. [Google Scholar] [CrossRef]
- Rygel, L.; O’Sullivan, D.; Yarnal, B. A method for constructing a social vulnerability index: An application to hurricane storm surges in a developed country. Mitig. Adapt. Strat. Glob. Chang. 2006, 11, 741–764. [Google Scholar] [CrossRef]
- Ding, H.; Ding, S.F.; Hu, L.H. Research progress of attribute reduction based on rough sets. Comput. Eng. Sci. 2010, 6, 92–94. [Google Scholar]
- Birkmann, J. Risk and vulnerability indicators at different scales: Applicability, usefulness and policy implications. Environ. Hazards 2007, 7, 20–31. [Google Scholar] [CrossRef]
- Wisner, B.; Blaikie, P.; Cannon, T.; Davis, I. At Risk: Natural Hazards, People’s Vulnerability and Disasters, 2nd ed.; Routledge: Abingdon, UK, 2003; pp. 11–13. [Google Scholar]
- Box, P.; Bird, D.; Haynes, K.; King, D. Shared responsibility and social vulnerability in the 2011 Brisbane flood. Nat. Hazards 2016, 81, 1549–1568. [Google Scholar] [CrossRef]
- Toro, J.; Duarte, O.; Requena, I.; Zamorano, M. Determining Vulnerability Importance in Environmental Impact Assessment The case of Colombia. Environ. Impact Assess. Rev. 2012, 32, 107–117. [Google Scholar] [CrossRef]
- Tate, E. Social vulnerability indices: A comparative assessment using uncertainty and sensitivity analysis. Nat. Hazards 2012, 63, 1–23. [Google Scholar] [CrossRef]
- Juntunen, L. Addressing Social Vulnerability to Hazards. Disaster Saf. Rev. 2005, 4, 3–10. [Google Scholar]
- Turner, B.L., 2nd; Kasperson, R.E.; Matson, P.A.; McCarthy, J.J.; Corell, R.W.; Christensen, L.; Eckley, N.; Kasperson, J.X.; Luers, A.; Martello, M.L.; et al. A framework for vulnerability analysis in sustainability science. Proc. Natl. Acad. Sci. USA 2003, 100, 8074–8079. [Google Scholar] [CrossRef] [PubMed]
- Davidson, R.; Shah, H.C. A multidisciplinary urban earthquake disaster risk index. Earth Spec. 1997, 13, 211–223. [Google Scholar] [CrossRef]
- Davidson, D.; Freudenburg, W. Gender and environmental risk concerns. Environ. Behav. 1996, 28, 302–339. [Google Scholar] [CrossRef]
- Davidson, R.A. An Urban Earthquake Disaster Risk Index; The John A. Blume Earthquake Engineering Center Report No. 121; Blume Center: Stanford, CA, USA, 1997. [Google Scholar]
- Granger, K.; Jones, T.; Leiba, M.; Scott, G. Community Risk in Cairns: A Provisional Multi-Hazard Risk Assessment; AGSO Cities Project Report No. 1; Australian Geological Survey Organisation: Canberra, Australia, 1999.
- Adger, W.N.; Brooks, N.; Bentham, G.; Agnew, M.; Eriksen, S. New Indicators of Vulnerability and Adaptive Capacity; Tyndall Centre for Climate Change Research: Norwich, UK, 2004. [Google Scholar]
- Cutter, S.L. Vulnerability to environmental hazards. Progress Hum. Geogr. 1996, 20, 529–539. [Google Scholar] [CrossRef]
- Khan, S. Vulnerability assessments and their planning implications: A case study of the Hutt Valley, New Zealand. Nat. Hazards 2012, 64, 1587–1607. [Google Scholar] [CrossRef]
- Tierney, K. Social Inequality: Humans and Disasters. In On Risk and Disaster: Lessons from Hurricane Katrina; Daniels, R.J., Keitl, D.F., Kunreuther, H., Eds.; University of Pennsylvania Press: Philadelphia, PA, USA, 2006. [Google Scholar]
- Hosseini, A.; GHasemi, Z.; Ahadnejad, M.; Alimoradi, T. Evaluation of qualitative and quantitative indicators of social housing in the Tabriz metropolitan. Int. J. Bus. Behav. Sci. 2014, 4, 19–30. [Google Scholar]
- Beccari, B. A comparative analysis of disaster risk, vulnerability and resilience composite indicators. PLoS Curr. 2016, 8. [Google Scholar] [CrossRef] [PubMed]
- Arias, P.A.; Villegas, J.C.; Machado, J.; Serna, A.M.; Vidal, L.M.; Vieira, C.; Cadavid, C.A.; Vieira, S.C. Reducing social vulnerability to environmental change: Building trust through social collaboration on environmental monitoring. Weather Clim. Soc. 2016, 8, 57–76. [Google Scholar] [CrossRef]
- Armas, I.; Gavris, A. Social vulnerability assessment using spatial multi-criteria analysis (SEVI model) and the Social Vulnerability Index (SoVI model)—A case study for Bucharest, Romania. Nat. Hazards Earth Syst. Sci. 2013, 13, 1481–1499. [Google Scholar] [CrossRef]
- Kasperson, J.; Kasperson, R. The Social Contours of Risk: Risk Analysis, Corporations & the Globalization of Risk; Earthscan: London, UK, 2005; pp. 1–2. [Google Scholar]
- Birkmann, J. Indicators and Criteria for Measuring Vulnerability: Theoretical Bases and Requirements. In Measuring Vulnerability to Natural Hazards: Towards Disaster Resilient Societies; Birkman, J., Ed.; United Nations University Press: Tokyo, Japan, 2006; pp. 55–77. [Google Scholar]
- Masozera, M.; Bailey, M.; Kerchner, C. Distribution of impacts of natural disasters across income groups: A case study of New Orleans. Ecol. Econ. 2007, 63, 299–306. [Google Scholar] [CrossRef]
- Koks, E.E.; de Moel, H.; Aerts, J.C.J.H.; Bouwer, L.M. Effect of spatial adaptation measures on flood risk: Study of coastal floods in Belgium. Reg. Environ. Chang. 2014, 14, 413–425. [Google Scholar] [CrossRef]
- Chen, W.; Cutter, S.L.; Emrich, C.T.; Shi, P. Measuring social vulnerability to natural hazards in the Yangtze River Delta region, China. Int. J. Disaster Risk Sci. 2013, 4, 169–181. [Google Scholar] [CrossRef]
- Clark, G.E.; Moser, S.; Ratick, S.J.; Dow, K.; Meyer, W.B.; Emani, S.; Jin, W.; Kasperson, J.X.; Kasperson, R.E.; Schwarz, H.E. Assessing the vulnerability of coastal communities to extreme storms: The case of revere, MA, USA. Mitig. Adapt. Strat. Glob. Chang. 1998, 3, 59–82. [Google Scholar] [CrossRef]
- Bankoff, G.; Frerks, G.; Hilhorst, D. Mapping Vulnerability; Earthscan: London, UK, 2004. [Google Scholar]
- Burton, I.; Kates, R.W.; White, G.F. The Environment as Hazard. Contemporary Sociology; Oxford University Press: Oxford, UK, 1978. [Google Scholar]
- Flanagan, B.E.; Gregory, E.W.; Hallisey, E.J.; Heitgerd, J.L.; Lewis, B. A social vulnerability index for disaster management. J. Homel. Secur. Emerg. Manag. 2011, 8, 33–42. [Google Scholar] [CrossRef]
- Collins, T.W.; Grineski, S.E.; Aguilar, M.L.R. Vulnerability to environmental hazards in the Ciudad Jua’rez (Mexico)–El Paso (USA) metropolis: A model for spatial risk assessment in transnational context. Appl. Geogr. 2009, 29, 448–461. [Google Scholar] [CrossRef]
- Cutter, S.L.; Mitchell, J.T.; Scott, M.S. Revealing the vulnerability of people and places: A case study of Georgetown County, South Carolina. Ann. Assoc. Am. Geogr. 2000, 90, 713–737. [Google Scholar] [CrossRef]
- Wood, N.J.; Burton, C.G.; Cutter, S.L. Community variations in social vulnerability to Cascadia-related tsunamis in the U.S. Pacific Northwest. Nat. Hazards 2010, 52, 369–389. [Google Scholar] [CrossRef]
- Cutter, S.L.; Bornuff, B.J.; Shirley, W.L. Social vulnerability to environmental hazards. Soc. Sci. Q. 2003, 84, 242–261. [Google Scholar] [CrossRef]
- Bjarnadottir, S.; Li, Y.; Stewart, M.G. Social vulnerability index for coastal communities at risk to hurricane hazard and a changing climate. Nat. Hazards 2011. [Google Scholar] [CrossRef]
- Zhang, W.; Xu, X.; Chen, X. Social vulnerability assessment of earthquake disaster based on the catastrophe progression method: A Sichuan Province case study. Int. J. Disaster Risk Reduct. 2017, 24, 361–372. [Google Scholar] [CrossRef]
- Thiri, M.A. Social vulnerability and environmental migration: The case of Miyagi Prefecture after the Great East Japan Earthquake. Int. J. Disaster Risk Reduct. 2017, 25, 212–226. [Google Scholar] [CrossRef]
- Cerchiello, V.; Ceresa, P.; Monteiro, R.; Komendantova, N. Assessment of social vulnerability to seismic hazard in Nablus, Palestine. Int. J. Disaster Risk Reduct. 2018, 28, 491–506. [Google Scholar] [CrossRef]
- JICA (Japan International Cooperation Agency) and CEST (Center for Earthquake and Environmental Studies of Tehran, Tehran Municipality). The Study on Seismic Micro Zoning of the Greater Tehran Area in the Islamic Republic of Iran; Final Report; Center for Earthquake and Environmental Studies of Tehran, Tehran Municipality: Tehran, Iran, 2000; p. 403.
- Bahrainy, H. Natural Disaster Management in Iran during the 1990s—Need for a New Structure. J. Urban Plan. Dev. 2003, 129, 140–160. [Google Scholar] [CrossRef]
- Shakib, H.; Dardaei, J.S.; Pirizadeh, M. Proposed seismic risk reduction program for the megacity of Tehran, Iran. Nat. Hazards Rev. 2011, 12, 140–145. [Google Scholar] [CrossRef]
- Ferretti, V.; Montibeller, G. Key challenges and meta-choices in designing and applying multi-criteria spatial decision support systems. Decis. Support Syst. 2016, 84, 41–52. [Google Scholar] [CrossRef]
- Hinton, G.E. How neural networks learn from experience. Sci. Am. 1992, 267, 145–151. [Google Scholar] [CrossRef]
- Jensen, B. Expert Systems-Neural Networks. In strument Engineers’ Handbook, 3rd ed.; Chilton: Radnor, PA, USA, 1994. [Google Scholar]
- Pradhan, B.; Pirasteh, S. Comparison between prediction capabilities of neural network and fuzzy logic techniques for landslide susceptibility mapping. Disaster Adv. 2010, 3, 26–34. [Google Scholar]
- Bishop, C.M. Neural Networks for Pattern Recognition; Clarendon Press: Oxford, UK, 1995. [Google Scholar]
- Haykin, S. Neural Networks: A Comprehensive Foundation, 2nd ed.; Prentice Hall: Upper Saddle River, NJ, USA, 1999. [Google Scholar]
- Hizbaron, D.R.; Baiquni, M.; Sartohadi, J.; Rijanta, R. Urban Vulnerability in Bantul District, Indonesia—Towards Safer and Sustainable Development. Sustainability 2012, 4, 2022–2037. [Google Scholar] [CrossRef]
- Lee, S.; Ryu, J.H.; Won, J.S.; Park, H.J. Determination and application of the weights for landslide susceptibility mapping using an artificial neural network. Eng. Geol. 2003, 71, 289–302. [Google Scholar] [CrossRef]
- Lee, S.; Choi, J.; Min, K. Probabilistic landslide hazard mapping using GIS and remote sensing data at Boun Korea. Int. J. Remote Sens. 2004, 25, 2037–2052. [Google Scholar] [CrossRef]
- Iranian Statistics Center. Iranian Statistical Calender; Iranian Statistics Center: Tehran, Iran, 2011. [Google Scholar]
- Ahour, I. The qualities of Tabriz historical bazaar in urban planning and the integration of its potentials into megamalls. J. Geogr. Reg. Plan. 2011, 4, 199–215. [Google Scholar]
- Hessami, K.H.; Jamali, F.; Tabassi, H. Major Active Faults of Iran; International Institute of Earthquake Engineering and Seismology: Tehran, Iran, 2003. [Google Scholar]
- Tavakoli, B. Sensitivity of seismic hazard evaluations to uncertainties determined from seismic source characterization. J. Seismol. 2002, 6, 525–545. [Google Scholar] [CrossRef]
- Jackson, J. Partitioning of strike-slip and convergent motion between Eurasia and Arabiain Eastern Turkey and the Caucasus. Geophys. Res. 1992, 97, 12471–12479. [Google Scholar] [CrossRef]
- Berberian, M. Contribution to the Seism Tectonics of Iran (Part 2); Geological Survey of Iran: Tehran, Iran, 1976. [Google Scholar]
- Berberian, M. Natural hazard sand the first earthquake catalogue of Iran. Int. Inst. Earthq. Eng. Seismol. 1994, 1, 266–270. [Google Scholar]
- Karimzadeh, S.; Cakir, Z.; Osmanoglu, B.; Schmalzle, G.; Miyajima, M.; Amiraslanzadeh, R.; Djamour, Y. Interseismic strain accumulation across the North Tabriz Fault (NW Iran) deduced from InSAR time series. J. Geodyn. 2013, 66, 53–58. [Google Scholar] [CrossRef]
- Ghayamghamian, M.R.; Rajool, A. Long-period Ground Motion Simulation for NTF Fault Near-source energy released. In Proceedings of the Fifteenth World Conference on Earthquake Engineering, Lisbon, Portugal, 24–28 September 2012. [Google Scholar]
- Kenya Projects Organization. Available online: http://www.kenpro.org/sample-size-determination-using-krejcie-and-morgantable (accessed on 15 October 2014).
- Ministry of Human Resource Development. Report of All India Survey on Higher Education (AISHE). Available online: http://aishe.nic.in/aishe/viewDocument.action?documentId=199 (accessed on 18 August 2018).
- Krosnick, J.A. Survey research. Annu. Rev. Psychol. 1999, 50, 537–567. [Google Scholar] [CrossRef] [PubMed]
- Kometa, S.; Olomolaiye, P. Validation of the model for evaluating client-generated risk by project consultants. Construct. Manag. Econ. 1997, 14, 131–145. [Google Scholar] [CrossRef]
- Shash, A. Factors considered in tendering decisions by top UK contractors. Construct. Manag. Econ. 1993, 11, 111–118. [Google Scholar] [CrossRef]
- Environmental Systems Research Institute (ESRI). Arc GIS Network Analyst Routing, Closest Facility, and Service Area Analysis; ESRI: Redlands, CA, USA, 2005. [Google Scholar]
- Lek, S.; Delacoste, M.; Baran, P.; Dimopoulos, I.; Lauga, J.; Aulanier, S. Application of neural networks to modelling non-linear relationships in ecology. Ecol. Model. 1996, 90, 39–52. [Google Scholar] [CrossRef]
- Lek, S.; Gue’gan, J.F. Artificial neural networks as a tool in ecological modelling, an introduction. Ecol. Model. 1999, 120, 65–73. [Google Scholar] [CrossRef]
- Mas, J.F. Mapping land use/cover in a tropical coastal area using satellite sensor data, GIS and artificial neural networks. Estuar. Coast. Shelf Sci. 2004, 59, 219–230. [Google Scholar] [CrossRef]
- Pradhan, B.; Buchroithner, M.F. Comparison and validation of landslide susceptibility maps using an artificial neural network model for three test areas in Malaysia. Environ. Eng. Geosci. 2010, 16, 107–126. [Google Scholar] [CrossRef]
- Pradhan, B.; Lee, S. Landslide risk analysis using artificial neural network model focusing on different training sites. Int. J. Phys. Sci. 2009, 3, 1–15. [Google Scholar]
- Paola, J.D.; Schowengerdt, R.A. Review and analysis of back propagation neural networks for classification of remotely sensed multi-spectral imagery. Int. J. Remote Sens. 1995, 16, 3033–3058. [Google Scholar] [CrossRef]
- Nedic, V.; Despotovic, D.; Cvetanovic, S.; Despotovic, M.; Babic, S. Comparison of classical statistical methods and artificial neural network in traffic noise prediction. Environ. Impact Assess. Rev. 2014, 49, 24–30. [Google Scholar] [CrossRef]
- Moody, J.E.; Hanson, S.J.; Lippmann, R.P. The effective number of parameters: An analysis of generalization and regularization in nonlinear learning systems. Adv. Neural Inf. Process Syst. 1992, 4, 847–854. [Google Scholar]
- Tetko, I.V.; Livingstone, D.J.; Luik, A.I. Neural network studies. 1. Comparison of overfitting and overtraining. J. Chem. Inf. Comput. Sci. 1995, 35, 826–833. [Google Scholar] [CrossRef]
- Santi, E.; Paloscia, S.; Pettinato, S.; Notarnicola, C.; Pasolli, L.; Pistocchi, A. Comparison between SAR soil moisture estimates and hydrological model simulations over the Scrivia test site. Remote Sens. 2015, 5, 4961–4976. [Google Scholar] [CrossRef]
- Gomes, G.S.; Ludermir, T.B. Lima LMMR. Comparison of new activation functions in neural network for forecasting financial time series. Neural Comput. Appl. 2010, 20, 417–439. [Google Scholar] [CrossRef]
- Karlik, B.; Olgac, A.V. Performance analysis of various activation functions in generalized MLP architectures of neural networks. Int. J. Artif. Intell. Expert Syst. 2011, 1, 111–122. [Google Scholar]
- Abraham, A. Artificial neural networks. In Handbook of Measuring System Design; Wiley: New York, NY, USA, 2005. [Google Scholar]
- UNISDR. Hyogo Framework for Action 2005–2015: Building the Resilience of Nations and Communities to Disasters, Geneva. 2007. Available online: https://www.unisdr.org/we/inform/publications/1037 (accessed on 10 July 2017).
- Levin, S.A. Ecosystems and the biosphere as complex adaptive systems. Ecosystems 1998, 1, 431–436. [Google Scholar] [CrossRef]
- Burton, I.; Kates, R.W.; White, G.F. The Environment as Hazard, 2nd ed.; Guildford: New York, NY, USA, 1993. [Google Scholar]
- Anderson, M.B. Vulnerability. In Disaster Prevention for Sustainable Development: Economic and Policy Issue; Munasinghe, M., Clarke, C., Eds.; The International Decade for Natural Disaster Reduction (IDNDR) and TheWorld Bank: Washington, DC, USA, 1995; pp. 41–60. [Google Scholar]
- UNISDR. Disaster Risk Reduction Tools and Methods for Climate Change Adaptation. 2004. Available online: http://www.unisdr.org/files/5654_DRRtoolsCCAUNFCC.pdf (accessed on 10 July 2017).
- Jahangiri, K.; Izadkhah, Y.O.; Jamaledin Tabibi, S. A comparative study on community-based disaster management in selected countries and designing a model for Iran. Disaster Prev. Manag. Int. J. 2011, 20, 82–94. [Google Scholar] [CrossRef]


| Group | Parameter | Value |
|---|---|---|
| Input specifications | Avrg. training pixels per class | 700 |
| Avrg. testing pixels per class | 700 | |
| Network topology | Hidden Layers | 1 |
| Nodes | 10 | |
| Input Layers Node | 5 | |
| Output Layer Nodes | 5 | |
| Training parameter | Automatic training | Yes |
| Dynamic learning rate | Yes | |
| Start Learning rate | 0.001 | |
| End learning rate | 0.0001 | |
| Momentum factor | 0.5 | |
| Stopping criteria | RMS | 0.1168 |
| Iterations | 15,000 | |
| Accuracy rate | 95.66 |
| Vulnerability | Hectare | Area (m2) | Percent |
|---|---|---|---|
| Very High | 196.01 | 1,960,132.47 | 0.77 |
| High | 541.27 | 5,412,691.087 | 2.11 |
| Moderate | 1036.01 | 10,360,052.8 | 4.04 |
| Low | 4295.37 | 42,953,682.7 | 16.77 |
| Very Low | 19,550.56 | 195,505,633.7 | 76.31 |
| SUM | 25,619.22 | 256,192,192.8 | 100 |
| Vulnerability | Very High | High | Moderate | Low | Very Low | Percent |
|---|---|---|---|---|---|---|
| Zone 1 | 9.68 | 15.60 | 7.66 | 24.66 | 42.39 | 100.00 |
| Zone 2 | 0.35 | 1.74 | 5.38 | 28.05 | 64.49 | 100.00 |
| Zone 3 | 0.25 | 1.49 | 4.96 | 27.56 | 65.73 | 100.00 |
| Zone 4 | 0.93 | 41.69 | 12.93 | 25.21 | 19.23 | 100.00 |
| Zone 5 | 21.77 | 22.39 | 8.47 | 25.34 | 22.04 | 100.00 |
| Zone 6 | 0.00 | 0.00 | 1.10 | 30.75 | 68.15 | 100.00 |
| Zone 7 | 0.00 | 0.24 | 0.02 | 1.72 | 98.02 | 100.00 |
| Zone 8 | 0.00 | 0.00 | 0.00 | 0.00 | 100 | 100.00 |
| Zone 9 | 0.23 | 0.05 | 0.10 | 99.5 | 0.13 | 100.00 |
| Vulnerability | Very High | High | Moderate | Low | Very Low | Percent |
|---|---|---|---|---|---|---|
| Zone 1 | 12.53 | 16.42 | 32.03 | 37.06 | 1.95 | 100.00 |
| Zone 2 | 0.68 | 29.45 | 38.71 | 27.99 | 3.17 | 100.00 |
| Zone 3 | 0.00 | 10.81 | 5.44 | 31.67 | 52.08 | 100.00 |
| Zone 4 | 3.19 | 52.68 | 31.80 | 11.51 | 0.82 | 100.00 |
| Zone 5 | 33.50 | 25.53 | 26.76 | 14.20 | 0.01 | 100.00 |
| Zone 6 | 0.00 | 16.11 | 53.42 | 28.85 | 1.62 | 100.00 |
| Zone 7 | 0.00 | 0.00 | 3.68 | 4.36 | 91.95 | 100.00 |
| Zone 8 | 0.00 | 0.00 | 54.4 | 44.9 | 0.6 | 100.00 |
| Zone 9 | 0.00 | 0.00 | 20.78 | 79.23 | 0.00 | 100.00 |
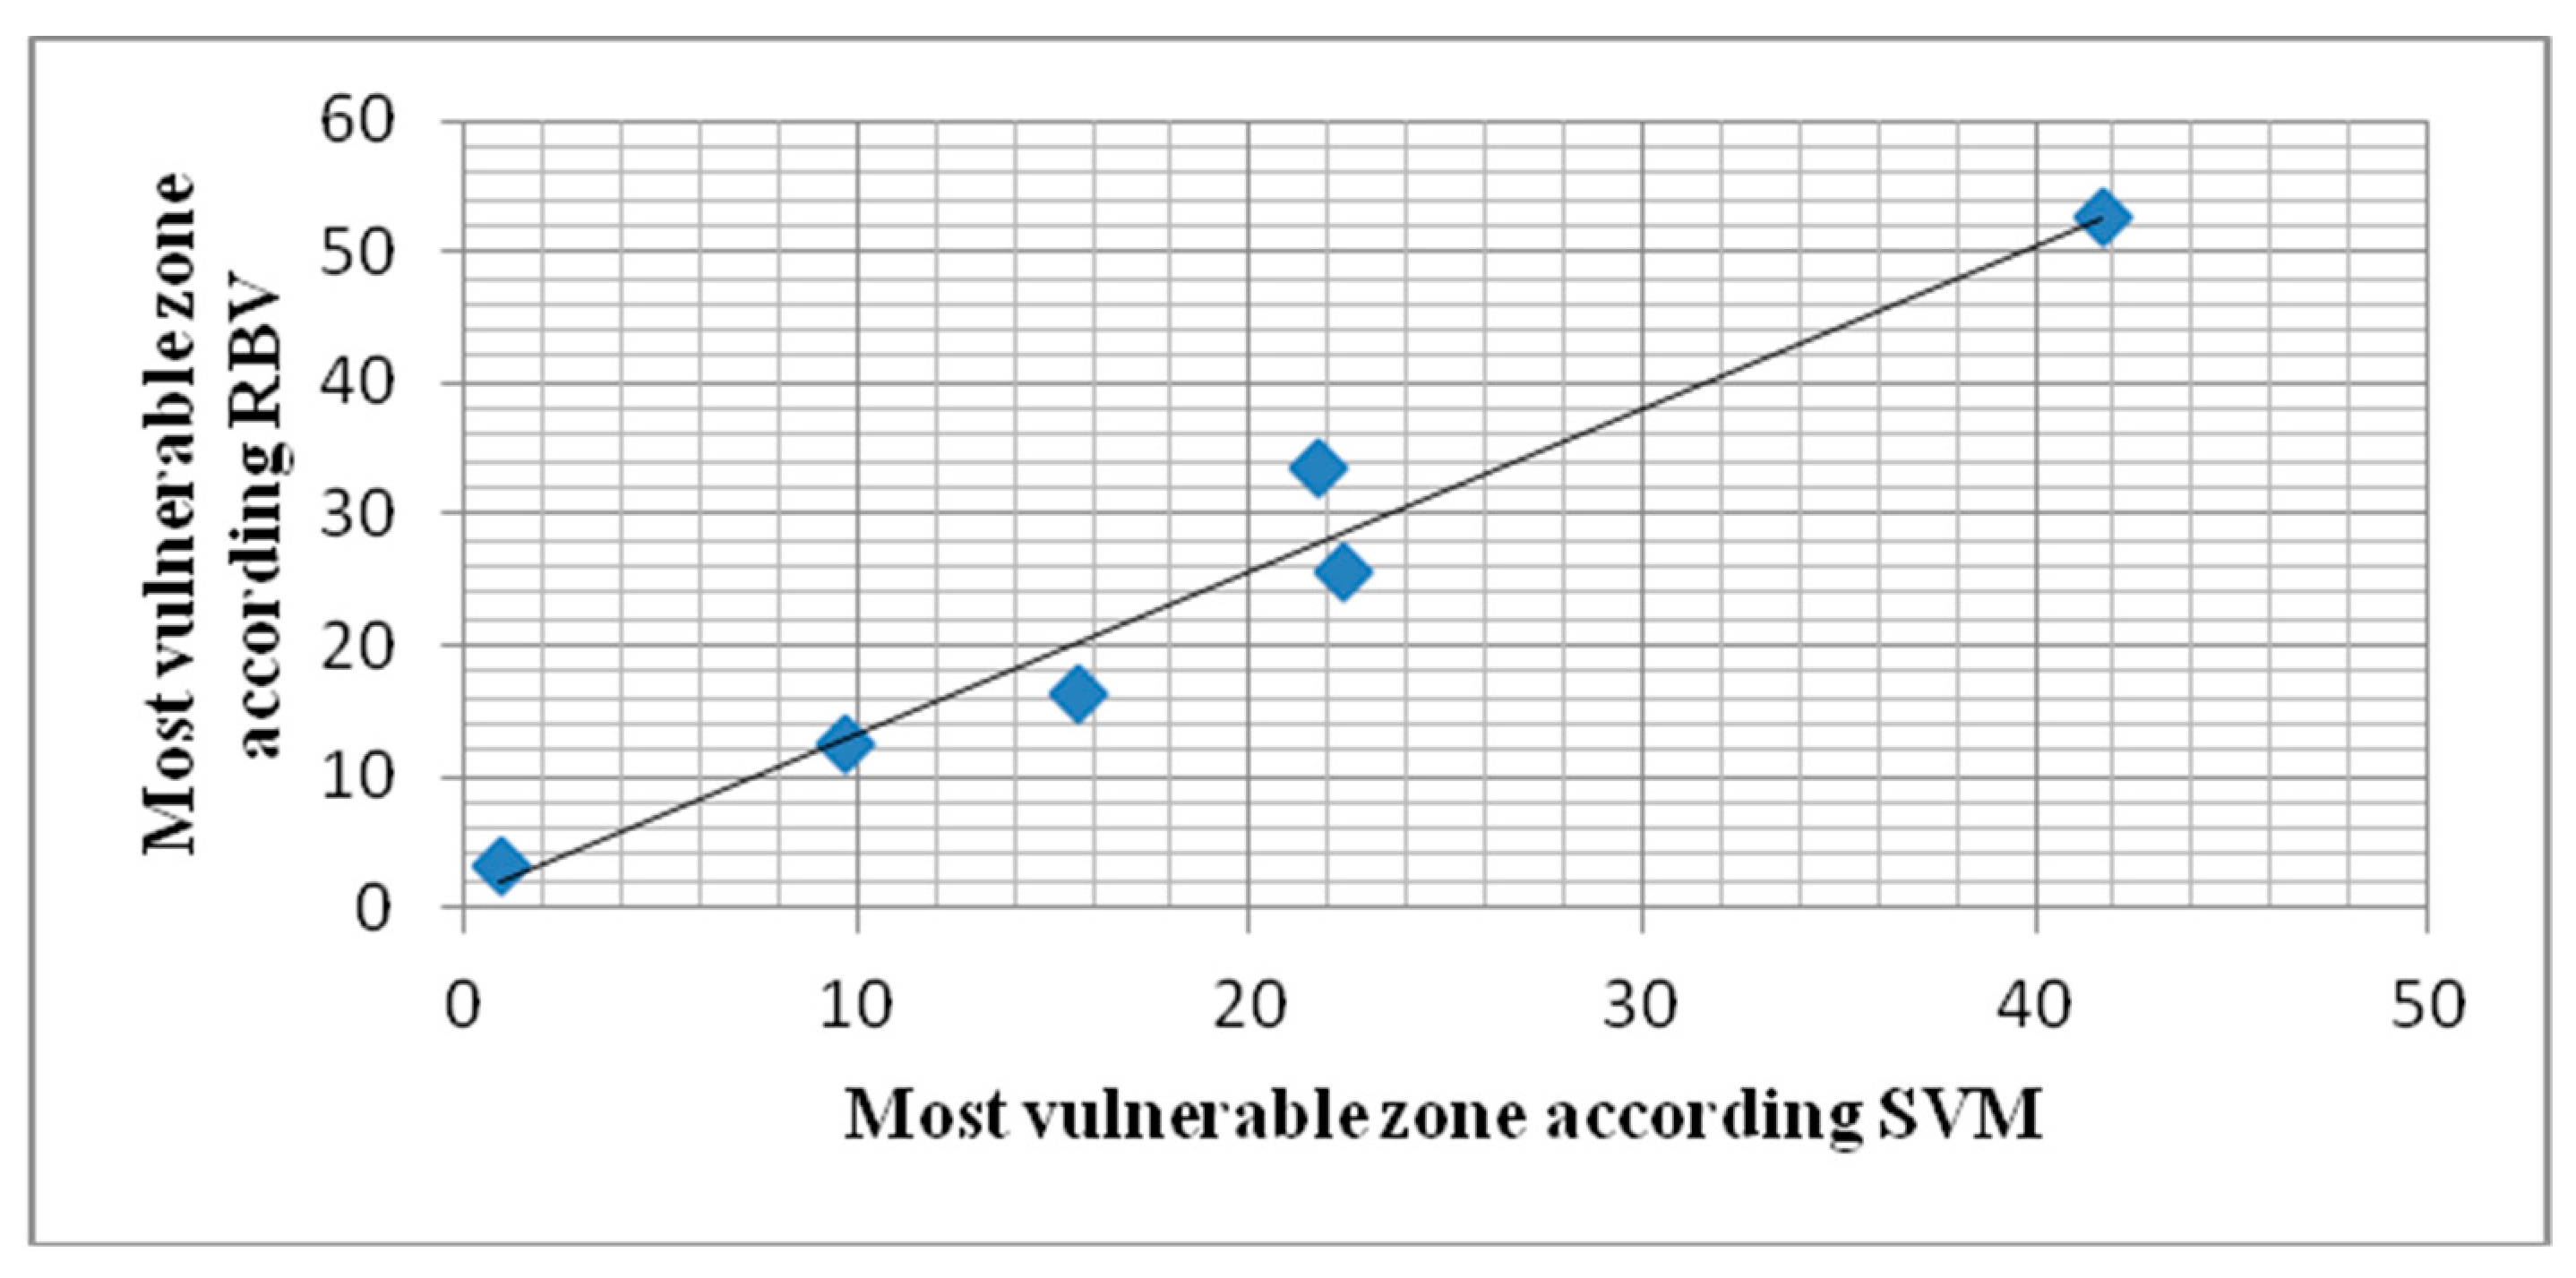
| SVM | RBV | ||
|---|---|---|---|
| SVM | Pearson Correlation | 1 | 0.997 ** |
| Sig. (2-tailed) | 0.000 | ||
| N | 6 | 6 | |
| RBV | Pearson Correlation | 0.997 ** | 1 |
| Sig. (2-tailed) | 0.000 | ||
| N | 6 | 6 | |
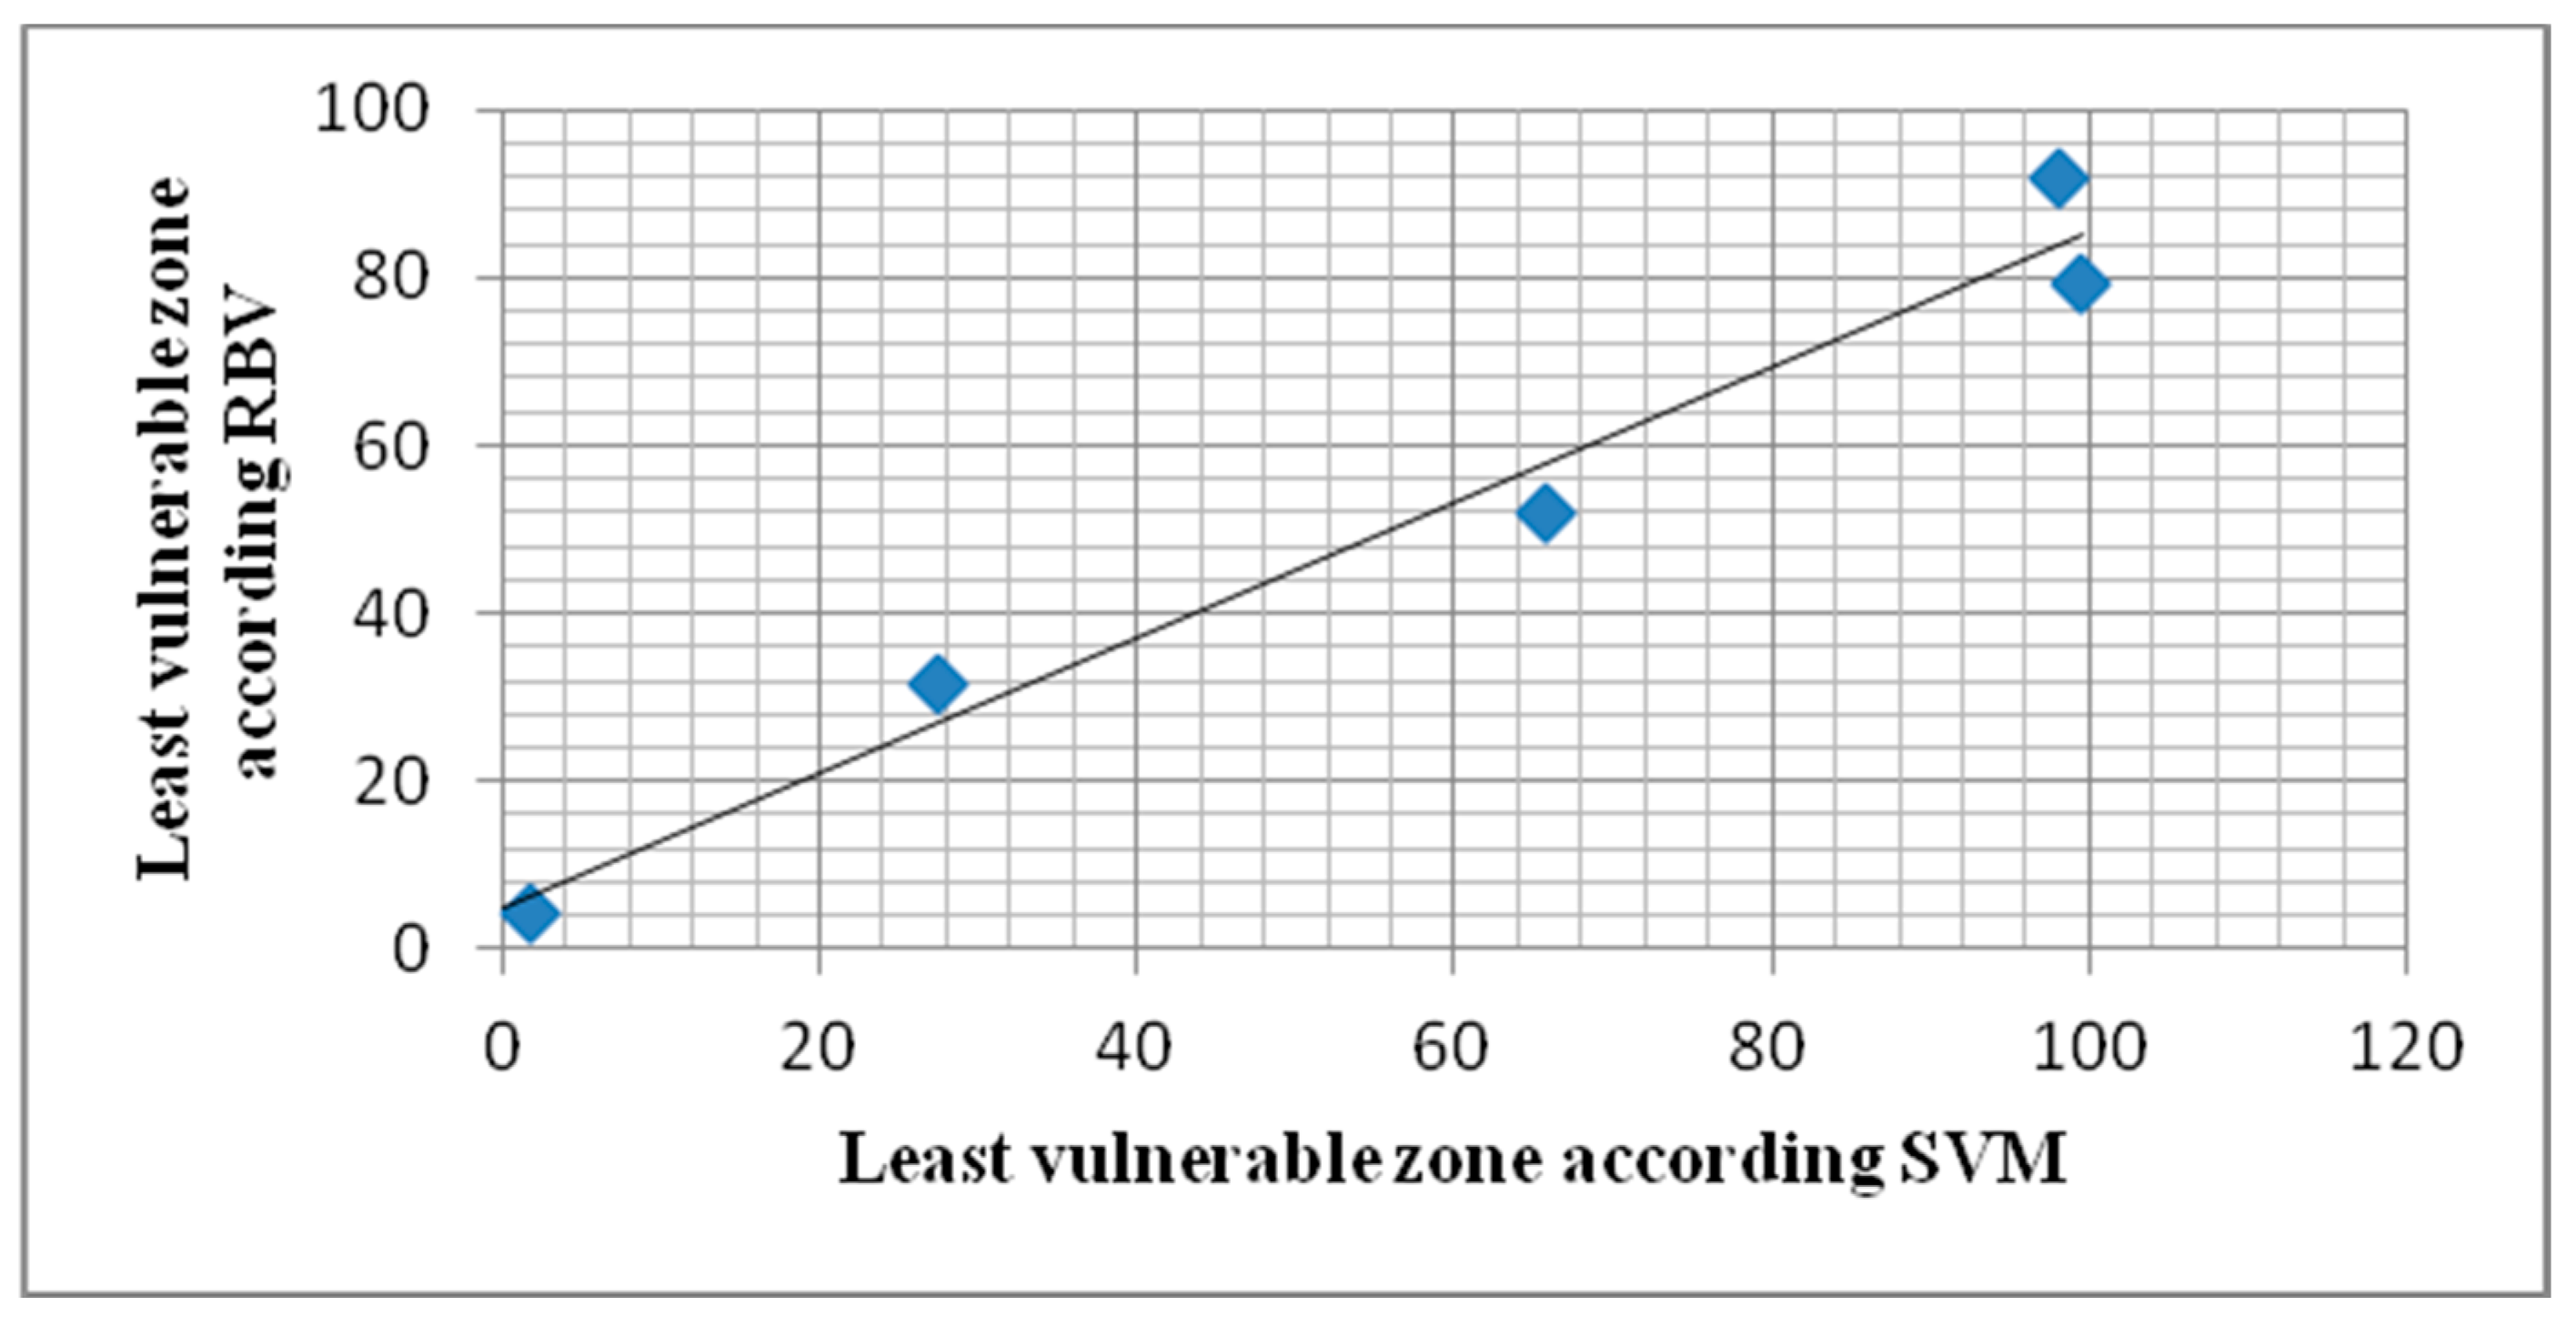
| SVM | RBV | ||
|---|---|---|---|
| SVM | Pearson Correlation | 1 | 0.921 * |
| Sig. (2-tailed) | 0.026 | ||
| N | 5 | 5 | |
| RBV | Pearson Correlation | 0.921 * | 1 |
| Sig. (2-tailed) | 0.026 | ||
| N | 5 | 6 | |
© 2018 by the authors. Licensee MDPI, Basel, Switzerland. This article is an open access article distributed under the terms and conditions of the Creative Commons Attribution (CC BY) license (http://creativecommons.org/licenses/by/4.0/).
Share and Cite
Alizadeh, M.; Alizadeh, E.; Asadollahpour Kotenaee, S.; Shahabi, H.; Beiranvand Pour, A.; Panahi, M.; Bin Ahmad, B.; Saro, L. Social Vulnerability Assessment Using Artificial Neural Network (ANN) Model for Earthquake Hazard in Tabriz City, Iran. Sustainability 2018, 10, 3376. https://doi.org/10.3390/su10103376
Alizadeh M, Alizadeh E, Asadollahpour Kotenaee S, Shahabi H, Beiranvand Pour A, Panahi M, Bin Ahmad B, Saro L. Social Vulnerability Assessment Using Artificial Neural Network (ANN) Model for Earthquake Hazard in Tabriz City, Iran. Sustainability. 2018; 10(10):3376. https://doi.org/10.3390/su10103376
Chicago/Turabian StyleAlizadeh, Mohsen, Esmaeil Alizadeh, Sara Asadollahpour Kotenaee, Himan Shahabi, Amin Beiranvand Pour, Mahdi Panahi, Baharin Bin Ahmad, and Lee Saro. 2018. "Social Vulnerability Assessment Using Artificial Neural Network (ANN) Model for Earthquake Hazard in Tabriz City, Iran" Sustainability 10, no. 10: 3376. https://doi.org/10.3390/su10103376
APA StyleAlizadeh, M., Alizadeh, E., Asadollahpour Kotenaee, S., Shahabi, H., Beiranvand Pour, A., Panahi, M., Bin Ahmad, B., & Saro, L. (2018). Social Vulnerability Assessment Using Artificial Neural Network (ANN) Model for Earthquake Hazard in Tabriz City, Iran. Sustainability, 10(10), 3376. https://doi.org/10.3390/su10103376