Article

Perceptions of Pedestrian and Cyclist Environments, Travel Behaviors, and Social Networks

1
Transport Department, School of Civil Engineering, Universitat Politècnica de València, 46022 València, Spain
2
Social Psychology Department, Faculty of Psychology, Universitat de València, 46010 València, Spain
*
Author to whom correspondence should be addressed.
Sustainability 2018, 10(9), 3241; https://doi.org/10.3390/su10093241
Submission received: 6 August 2018 / Revised: 6 September 2018 / Accepted: 7 September 2018 / Published: 11 September 2018
(This article belongs to the Section Sustainable Transportation)

Abstract

:
The research presented in this paper studied interrelationships within the perceptions of pedestrian and cyclist environments, travel behaviors, and a particular subset of social networks characterized by their being usual trip or activity companions. For this purpose, 404 individuals participated in a web-based survey and provided data related to perceptions of particular elements of pedestrian- and cyclist-specific environments (sidewalks, cycle lanes, and pedestrian crossing), sociodemographics, and characteristics of their usual activity and trip companions. Participants also completed a two-day activity-travel diary. The validity of measurements and reliability of constructs were assessed by mean of Exploratory and Confirmatory Factor Analysis (EFA and CFA) and five models were determined using Structural Equation Modeling (SEM) to identify relations among the variables of the study. Results highlight the importance of how travel behavior influences the formation of perceptions of elements related to pedestrians and cyclist-specific environments.

1. Introduction

Promoting the use of sustainable travel modes in urban areas is becoming a key issue in current transport policies. The reduction of car use and the increase of walking and cycling contribute to diminishing pollution, improving health of people, and taking greater advantage of urban space for green areas and pedestrian paths.
The design and implementation of effective actions and measures to encourage the use of sustainable travel modes in urban areas require the identification of factors that influence the decision to walk and cycle. Psychosocial factors are important in explaining travel behavior decisions [1]. Among those factors, the perception of particular elements of the built environment associated with walking and cycling has been scarcely studied in the context of sustainable travel behavior research.
Individuals’ travel behavior decisions are influenced by the people who interact with them [2]. In this context, the characteristics of activity-travel companions are particularly important.
In the following sections, psychological theories and literature review are presented, which support the definition of the research focus and conceptual framework of the present study.

2. Literature Review

2.1. Psychological Background

Perception is the process by which organisms interpret and organize sensations to produce a meaningful experience of the world [3]. The way in which human beings perceive the stimuli is selective, and will be influenced by a person’s existing beliefs, attitudes, perceptions, motivations, and personality [4]. Because humans have limited capacity to process information, there are perceptual defenses which create internal barriers that prevent stimuli incongruent with the person’s current attitudes and beliefs from passing the perception process. This process is called Selective Perception [5]. Any action requires the selection of some stimuli and not others of the environment that are action relevant, so this selection is goal-directed [6].
Perceptions of particular elements of the urban built environment that facilitate walking and biking were studied: sidewalks, bike lanes and pedestrian crossings. Together, they are referred to as perceptions of pedestrian- and cyclist-specific environments (PPCE).
Social interactions are currently being considered in travel behavior studies through the analysis of social networks. Axhausen [2] defined a social network as a set of persons who are linked pairwise, so that each person can reach any other through an active tie. It is argued that, within a traveler’s social network, the geography of the members together with the geography of the relevant activity locations determines the amount and style of travel.
Several psychological theories support the potential relationships among PPCE, social networks, and travel behavior. A brief description of those theories is presented below.
Bronfenbrenner’s Ecological Systems Theory [7,8] postulates that there are interrelationships between intercultural, community, organizational and interpersonal interactions where individual behavior is determined mostly by the social environment (e.g., community norms, values, attitudes, etc.). Thus, there will be an interaction between one’s ability to act and make decisions (e.g., deciding to travel to where an activity is going to take place), the relationships with other people (relatives, friends, and colleagues), and the physical environment (e.g., accessibility of sidewalks or bike lanes). These three factors lead to the intention to behave in a concrete way, and, influence actual behavior.
The Social Cognitive Theory [9] emphasizes reciprocal causation through cognitive or individual factors, behavioral capacity (what to do and how to do it), and environmental factors, considering the observational learning (“modeling” behaviors), reinforcements (positive or negative, and internal or external), expectations (anticipated consequences of a person’s behavior) and the concept of self-efficacy, which refers to the own-confidence on the ability to successfully perform a behavior.
Ajzen’s Theory of Planned Behavior (TPB) [10,11] theorizes that a given behavior will be determined by a person’s attitude towards the behavior, subjective norms (including the expectations of significant others) and perceived behavioral control over that particular behavior. Within this theory, attitudes refer to positive or negative evaluations of a given behavior. Subjective norms comprise one’s perceptions about significant others’ thoughts about whether one should perform the behavior. The perceived behavioral control refers to the belief about having the skills or abilities necessary to carry out a certain behavior. TPB has been used in many different scenarios trying to predict pedestrian behavior; for example, Barton et al. [12] examined adults’ intentions to cross streets under conditions of distraction and found that perceived behavioral control emerged as the most significant predictor.
The previous theories propose that there are many factors (individual, social and environmental) that lead to the intention to perform a behavior. However, intention does not necessarily lead to behavior on all occasions. In the same way, sometimes, there is no intentionality prior to the current behavior of the people. These situations have been studied by the Theory of Cognitive Dissonance [13]. Cognitive dissonance occurs when a person believes in thoughts, performs actions or consumes new information that conflicts with his or her attitudes, beliefs or behaviors. Human beings have a desire of avoid contradiction, so it is psychologically uncomfortable when an individual experiences inconsistency. Therefore, it is necessary to implement actions to reduce this dissonance. Thus, conflicting thoughts, attitudes, beliefs or behaviors are reduced to restore balance. By altering their thoughts the individual accepts that his or her original conception was mistaken and these new thoughts reinforce the new situation. Additionally, the importance of values and self-image can be changed or reduced and new information that conflicts with previous beliefs can be ignored or denied. The entire set of perceptions, including those concerning themselves, the environment, the current situations in the environment and experiences, can be agreed with each other and become congruent. For example, a person who increases their car use could adopt increasingly negative perceptions of the pedestrian- and cyclist-specific environments to reinforce their own car use.
Finally, although not a psychological theory, it is worth mentioning the space-time prism concept proposed by Hagerstrand [14], who presented the volume of the prism as an indication of accessibility, where its outline embodies the capability, coupling and authority constraints on individual activity and travel patterns. Models of space-time accessibility recognize that joint activities may constrain the performance of activities in space and time.

2.2. Previous Studies

Contrary to other psychosocial factors, the interrelationships between perceptions of particular built environments related to various transport modes and travel behavior have been rarely studied. Dill and Voros [15] found that the association between the objective measure of proximity to bike lanes and bicycling was not significant, while perceived availability of bike lanes had a positive association with bicycling. Hull and O’Holleran [16] compared different user perceptions pertaining to the comfort, speed and safety of cycling infrastructures in six European cities. They found that well design cycling infrastructures in a city will encourage more people to use bicycles. Ma et al. [17] examined the relationship between the objectively measured and perceived built environment, and their association with bicycling behavior. They found that perceptions of how easy, safe and accessible bike routes in Portland (Oregon) were had a direct and significant effect on bicycling behavior. Using the Stimuli-Organism-Response framework, Ma and Cao [18], found that objective built environments affect travel behavior through their influence on perceptions, considering also attributes of the transportation system.
There has been a growing interest in the study of social networks and their impact on personal travel behavior, travel decision making and joint scheduling both within households [19] and outside households [20]. For example, Neutens et al. [21] focused on joint activity participation and suggested that time-of-day and synchronization effects significantly affect the benefits that can be gained from opportunities for joint activities. Silvis et al. [22] found that the number of non-immediate kin at the destination affected respondents’ trip duration. Additionally, they found that both the total number of trips a respondent made and the number of different locations that a respondent visited were closely correlated both with the size of his or her social network and with the number of repeated contacts. Van den Berg et al. [23] found that social network size positively affects the number of social trips by different modes as well as social travel distance either directly or indirectly, showing that social networks generate social activities and travel. Sadri et al. [24] asserted that personal network measures, such as network density, homophily, heterogeneity, and ego-alter tie attributes exert a significant influence on the number of weekly shared trips in which an individual participates.

3. Research Focus and Conceptual Framework

We studied the interrelationships between PPCE, travel behavior during weekends, and characteristics of companions.
Unlike most existing travel behavior literature, which concentrates on general characteristics of the built environment, we studied perceptions of particular pedestrian- and cyclist-specific environments related to sidewalks, cycling lanes and pedestrian crossings. Furthermore, we considered only a subset of the social network, which consists solely of those who regularly share activities and travels with the ego. We hypothesized that these activity-travel companions have considerable influence on the person’s travel behavior. We explicitly contemplate influences in both directions between travel behavior and PPCE.
Although it is important to analyze the presence of companions both during weekdays and during weekends to deal with travel-related urban problems, in this study, weekend travel behavior was considered. Social and recreational activities are more frequent during weekends, when the presence of companions is usual. Therefore, it is more likely to find associations with characteristics of companions during weekends.
Based on psychological theories reviewed earlier and previous studies, we constructed the conceptual framework illustrated in Figure 1. We hypothesized that PPCE and travel behavior mutually affect each other. We also postulated that the characteristics of activity-travel companions, objective measures of the built environments, and socio-demographics directly affect both travel behavior and the perceptions of pedestrian- and cyclist-specific environments. Additionally, we hypothesized that travel behavior has a mediating role between perceptions of pedestrian- and cyclist-specific environments, and the rest of the explicative variables.

4. Materials and Methods

4.1. Survey Description and Data Collection

The dataset used for this research is part of the MINERVA project (“Innovative Travel Data Collection Methods for Transport Planning”) funded by the Ministry of Economy of Spain between 2016 and 2019. A web-based survey was developed ad-hoc for this project to gather information regarding personal values, activity-travel related behaviors, attitudes, perceptions, and characteristics of companions [25].
The web-based survey was distributed online. Several agreements were signed with public and private universities, companies, the local government and event organizers, all of which collaborated with the distribution.
The data collection took place between May and October 2017, excluding August to avoid non-recurrent mobility and long-distance trips executed during summer holidays. The main area of the study was Valencia (Spain) and its metropolitan area, although participants from other residential locations were also accepted.
To participate in the research, respondents were asked to create an account and log into the platform. The length of the survey was approximately 50 min and it could be completed at different times within the deadline of 10 days. Participants who completed the survey correctly were rewarded with a lottery ticket for a prize (four electronic tablets). Those who provided contact details of their social network members were given an extra ticket.
The web-based survey was designed considering user experience, flexibility, and responsiveness, so that respondents could easily access and complete the survey from any device with internet connection. Additionally, asynchronous validation provided real-time feed-back and a set of emails were prepared to set reminders based on the users’ progress.
The web-based survey was comprised of five parts. Firstly, a brief questionnaire requested information regarding demographics and socio-economic characteristics, as well as transport accessibility and the built environment attributes in the respondent’s area of residence.
Secondly, a two-day activity-travel diary was provided to collect all the activities and trips performed during a week day and one day of the weekend. The following attributes of each activity-travel episode were required: start and end points of travel, activity location, timing and duration, travel mode or type of activity, most of the fields were predefined and selectable. In addition, a text box input was displayed, and participants were asked to provide the names of those companions with whom they carried out each episode.
The third section collected information regarding characteristics of companions. For this purpose, the list of the companions already defined was displayed and a brief questionnaire concerning each person was required, including the following information: gender, age, type of relationship, social proximity, distance between residence location of ego and alter, frequency of face-to-face meetings, frequency of communication and degree of influence of the companion in the respondent’s mobility.
The fourth part collected information regarding personal values, using the Schwartz Value Survey (SVS), which was based on the Schwartz Theory of Human Values [26]. The fifth part consisted of a survey regarding attitudes and perceptions. The attitudes section used Likert scales to evaluate current travel modes, intentions to use travel modes, innovative travel solutions, semantic differentials, perceptions about the environment, use of ICTs and personal mobility.
In particular, perceptions of pedestrian- and cyclist-specific environments were assessed considering elements such as width, length and continuity, maintenance, obstacles, urban furniture, location and traffic light scheduling. For this purpose, 19 items were included: perceptions of sidewalks (5 items); perceptions of bike paths (7 items); and perceptions of pedestrian crossings (7 items).

4.2. Analysis and Measurements

This section includes the definition of variables and measurements.

Variables and Measurements

  • Demographics and socio-economic characteristics
Basic demographic and socio-economic characteristics were considered both at individual and household level (Table 1).
  • Companions
In this research, the social network consists of a subset defined by companions of trips and activities, as obtained from the two-day activity-travel diary. This list was enlarged by asking respondents to include other members of their social network with whom they usually share activities and trips. This subset was defined on the premise that it influences their travel behavior as well as their perceptions.
As shown in Table 1, several indicators were built from the data concerning the companions of each respondent. Thus, the main characteristics of the companions were defined for each participant.
  • Built environment characteristics
Information regarding attributes of built environment characteristics and accessibility was obtained from the survey responses, such as: distance to the next train station and bus stop (in minutes) and availability of bicycle lanes in the area of residence. Additionally, two indicators were created based on the address provided by respondents:
(a)
Degree of transport sustainability. This indicator ranges from 1 to 6 and it is the sum of 3 equally weighted factors:
-
Public transport availability (=2 if the tram, metro or train station is located at less than 10 min walking distance; =1.5 if any of these stations is located between 10 and 20 min walking distance; =1.0 in cases where there is not rail transport available, but there is at least one bus stop within 10 min walking distance).
-
Bicycle infrastructure availability (=2 where bicycle lanes are safe, convenient and have continuity along the entire area; =1.5 if bicycle lanes are on or alongside main roads or where such lanes are almost nonexistent, but the low traffic flow allows for safe cycling; =1 if urban design is not convenient or safe for bicycles).
-
Pedestrian conditions (=2 if pedestrian areas are wide and connected or urban design is mainly focused on pedestrians; =1.5 if pedestrian areas are less connected or urban design purpose is mixed; =1 if urban structure is car-oriented and pedestrian facilities are poor).
A correction factor of 0.5-point reduction was applied in bicycle and pedestrian oriented areas that lack sufficient amenities to make them useful.
(b)
Degree of centrality. This variable indicates how far the individual’s home is from the city center. It ranges from 1 to 5 (=1 if it is in an isolated or badly connected areas; =2 if it is in a metropolitan area farther than 15 km from the city center; =3 if it is in a metropolitan area up to 15 km from the city center; =4 if it is at the periphery of the city; and =5 if it is in the city center).
  • Perceptions of the pedestrian and cycling-specific environments
19 items were included to measure the attitudes toward sidewalks (5 items), bicycle paths (7 items) and pedestrian crossings (7 items). For this purpose, several attributes were considered: width, length and continuity, maintenance, obstacles, urban furniture, location and traffic light scheduling (see Section 5). Based on these data, three latent constructs were created, as described in Section 5.

5. Results

This section includes sample characteristics, sociodemographics, and travel characteristics. Next, descriptive analyses are presented as well as the validation of scales and reliability of constructs. Finally, the development of Structural Equation Modeling (SEM) is described. SPSS software was used for descriptive analyses, while MPlus was chosen for confirmatory factor analysis and model estimation.

5.1. Sample Characteristics

More than 3000 people provided the minimum information to participate and registered in the web-based survey. After data cleaning and validation, 1683 individuals completed at least the attitudes and perceptions part of the web-based survey, and 1382 filled out the values questionnaire as well. For this research, a subsample of this dataset was used, which includes 404 participants who also completed correctly the two-day activity-travel and provided information about their companions.
The distribution of the sample according to gender is reasonably balanced (Table 2). However, as expected, those over 50 years old are under-represented in the sample. Participants are predominantly students, although there is also a significant proportion of employed individuals.
The average number of activities and trips per person and per day are 11.4 and 3.9, respectively. Regarding active transportation, walking is predominant (45.2%), while the cycling proportion is much lower (6.8%). Among the motorized travel modes, the use of a private vehicle is the most predominant (35.6%) and public transport represents 11.7% of the trips. Overall, 44.2% of the trips were carried out during week days and 55.8% during weekends. In total, 54.3% of the trips executed were with companions (Table 3).
The average number of companions declared is 10.18 persons per respondent. However, only those alters whose questionnaire was completed were considered, which reduces this ratio to 9.12 companions. Seventy-six percent out of those were included in the diary, and the rest were added later and not linked to any activity-travel episode. Thirty-one percent of companions are family members, 37.4% are friends, 6.4% are partners and the remainders are reported as acquaintances or work colleagues. Finally, 80.2% of respondents consider that at least 50% of their companions are interrelated.

5.2. Descriptive, Exploratory and Confirmatory Factor Analysis

Descriptive analyses were carried out and basic statistics and measures of normality, symmetry and kurtosis were obtained for the information relating to perceptions. Some of the items presented signs of asymmetry and non-normality, which led us to select more robust models to take such deviations into account for the model estimation.
Cronbach’s alpha was used to measure internal consistency, which indicates how closely related a set of items are as a group. After the first analysis, it was observed that three items relating to lighting conditions were showing a low correlation with the constructs and were therefore deleted (one deletion for each latent construct). The obtained Cronbach’s alpha measurements for three latent constructs (sidewalks = 0.837; bicycle paths = 0.920; pedestrian crossings = 0.885) fall within the range of acceptable values. Thus, the scale reliability can be assumed.
The Kaiser-Meyer-Olkin Measure of Sampling Adequacy (KMO) was used to determine the proportion of variance in the variables that might be caused by the underlying factors. High values were obtained (>0.9), which indicate that the factor analysis technique may be appropriate. Bartlett’s test of sphericity assesses the hypothesis that the correlation matrix is an identity matrix, which would indicate that variables are unrelated and therefore unsuitable for structure detection. Null value is obtained, which also supports the use of factor analysis.
Pearson’s correlation matrix shows a high correlation between the three latent variables (perceptions of sidewalks, bicycle paths and pedestrian crossings). This might be because some of the items are related to the same attributes for each of the latent constructs (e.g., width or maintenance). Therefore, these correlations were later included in the formulation of the model.
After that, Exploratory and Confirmatory Factor Analysis were carried out. Factor Analysis offers not only the possibility of gaining a clear view of the data, but also the possibility of using the output in subsequent analyses [27,28].
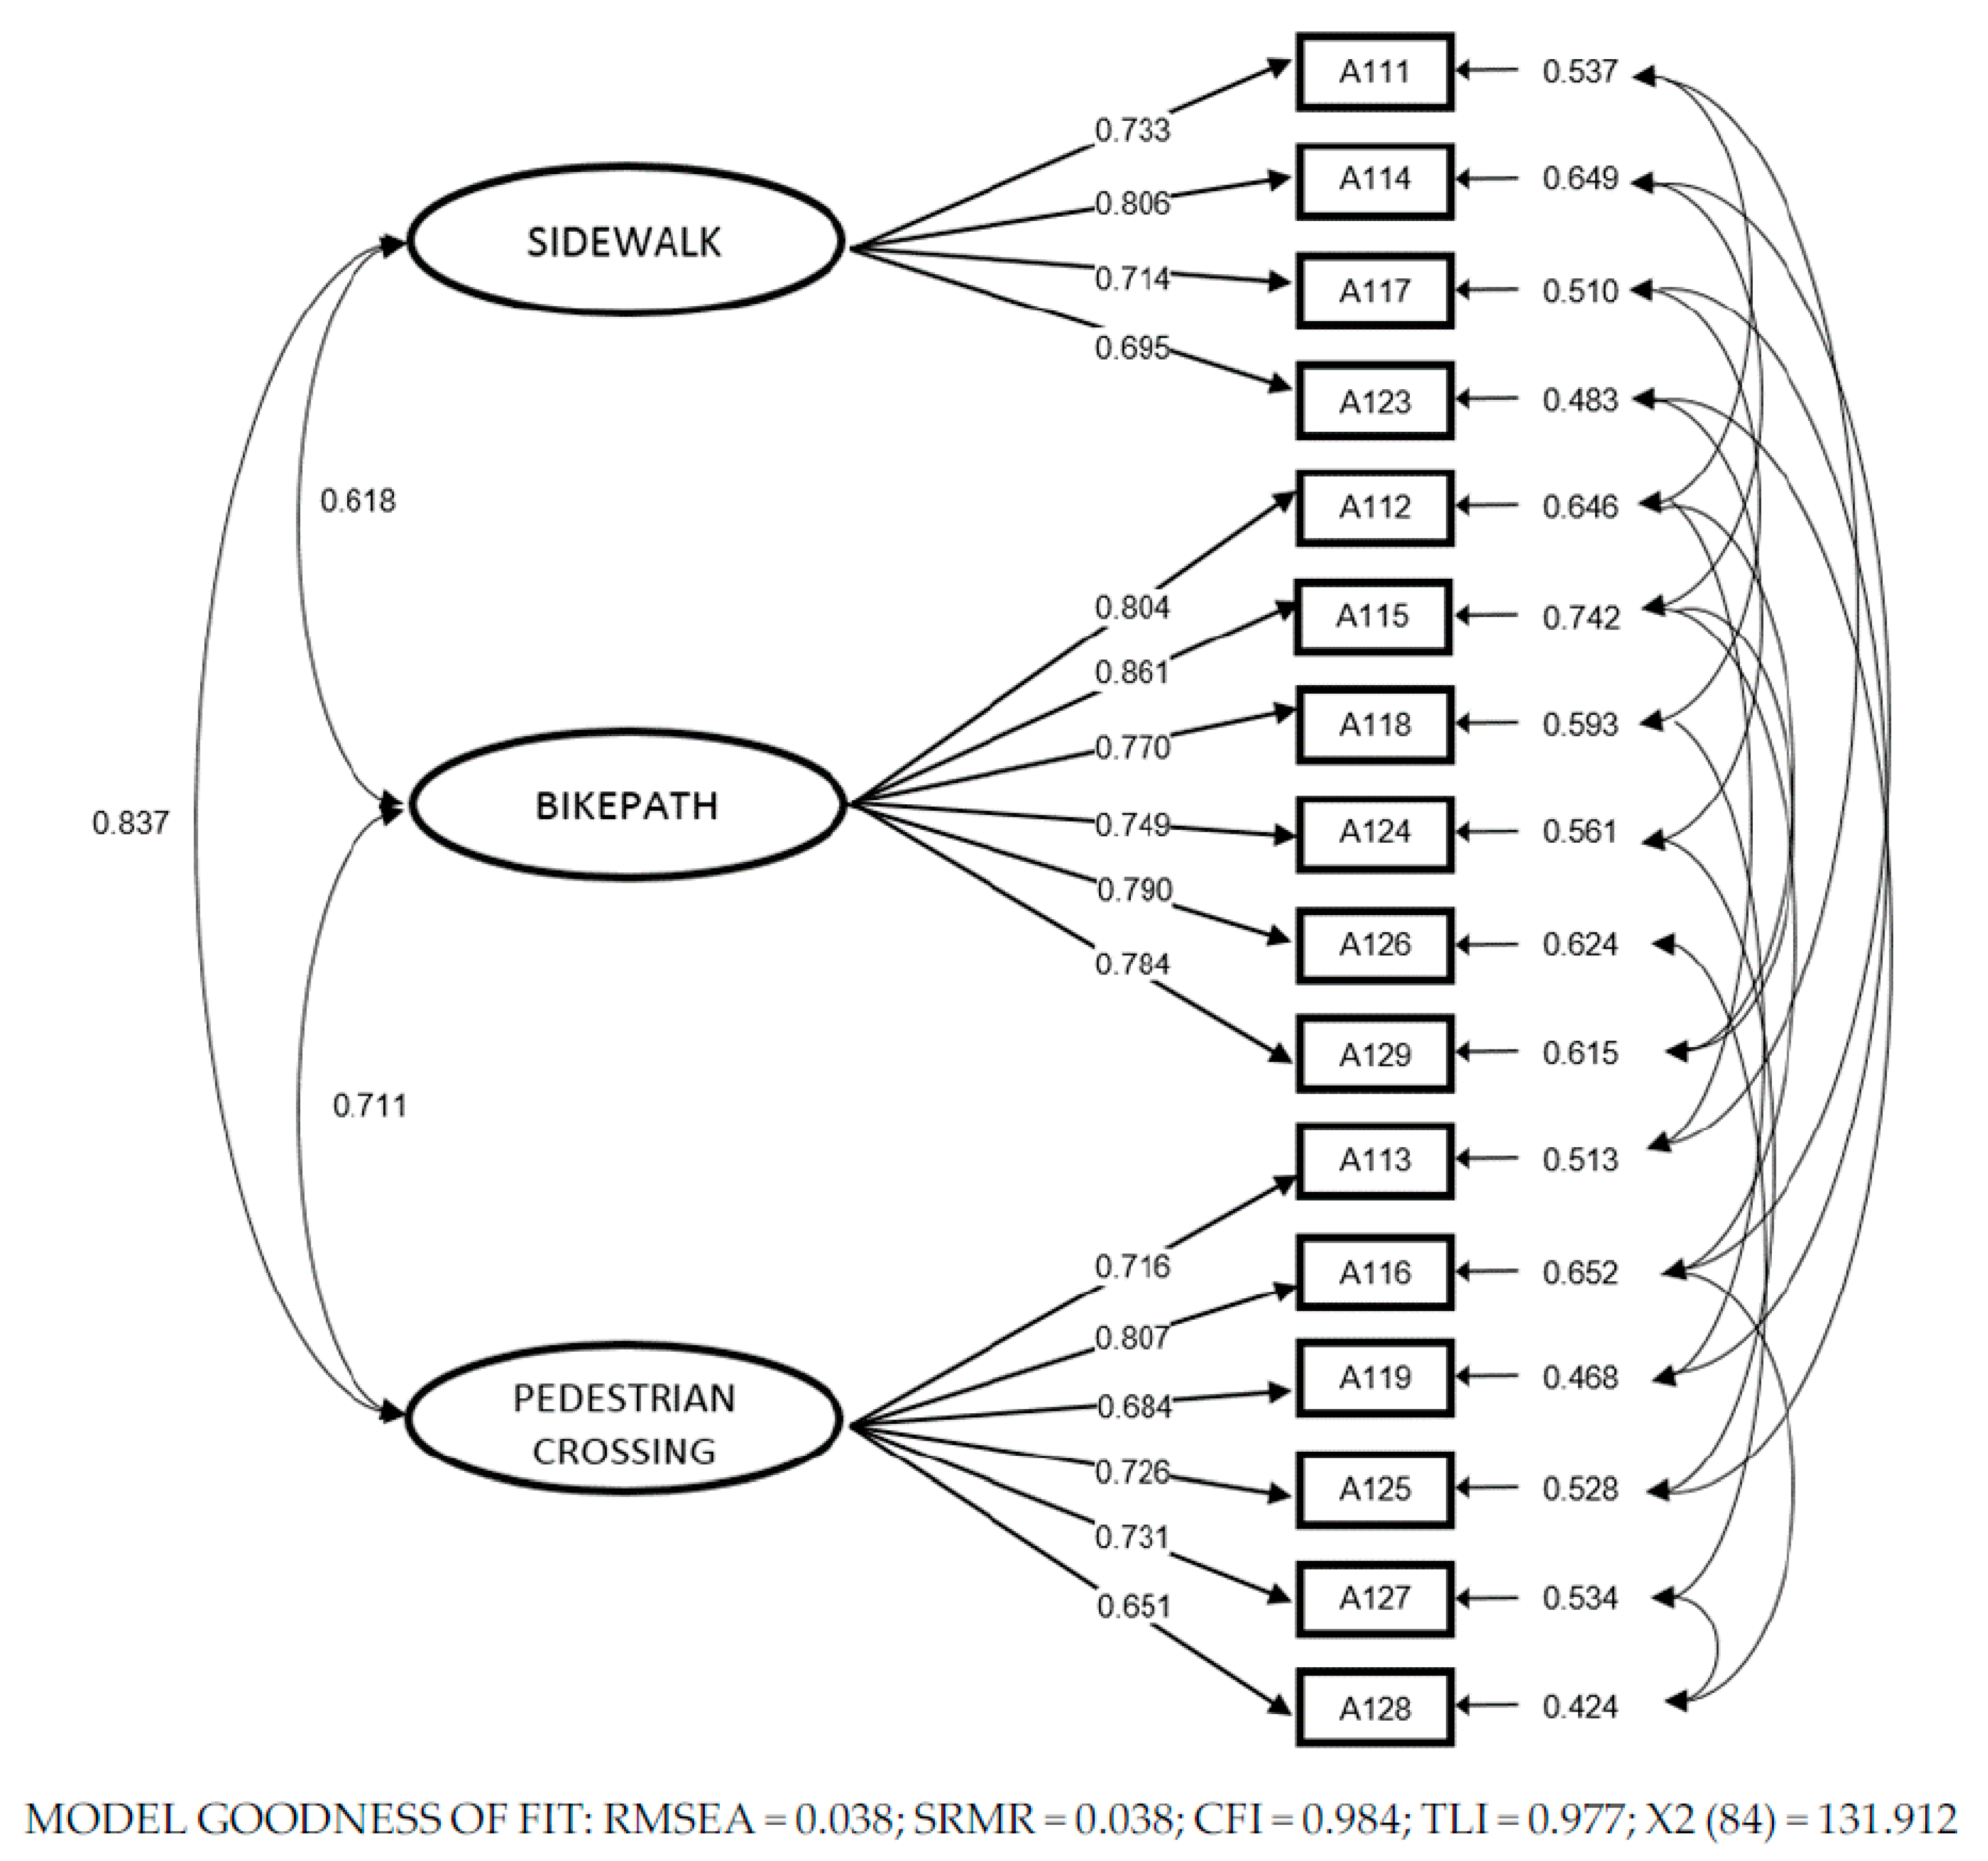
Exploratory Factor Analysis (EFA) w used to explore the possible underlying factor structure of a set of observed variables without imposing a preconceived structure on the outcome [29]. By performing EFA, the underlying factor structure is identified. To evaluate the scales and assess the formulated conceptual framework, an exploratory factor analysis (EFA) was conducted based on a theoretical construct that represents the PPCE containing 16 items. The results of EFA, using Varimax rotation and a factor loading of 0.40 as the threshold to maintain items in the factor, is shown in Table 4.
After the EFA procedure, Confirmatory Factor Analysis (CFA) specifying the posited relationships of the observed indicators to the latent variables, was conducted. CFA is used to verify the factor structure of a set of observed variables and to test the hypothesis that a relationship between observed variables and their underlying latent constructs exists.
The following goodness of fit indices were obtained: Chi square/df = 1.57; Comparative Fit Index (CFI) = 0.984; Tucker-Lewis Index (TLI) = 0.977; Standardized Root Mean Square Residual (SRMR) = 0.038; and Root Mean Square Error of Approximation (RMSEA) = 0.038. These statistics support the validity of the constructed scales. All coefficients exceed 0.6, indicating that all statements are strongly correlated with the latent variables defined (Figure 2).

5.3. Model Estimation and Results

Structural Equation Modeling (SEM) is a very powerful tool that it is increasingly used in travel behavior research [30,31,32,33,34,35]. In SEM, the relationships between theoretical constructs are represented by regression or path coefficients between the factors [36]. SEM is analyzed by drawing a path diagram consisting of boxes for observed variables and circles for latent factors, connected by arrows. Single-headed arrows or “paths” are used to define causal relationships in the model, with the variable at the tail of the arrow causing the variable at the point. Double-headed arrows indicate covariances or correlations, without a causal interpretation [36].
A complete SEM consists of three sets of equations: structural equations, measurement equations for the endogenous variables, and measurements equations for the exogeneous variables. Structural equations are used to capture causation, the weighted influence of exogenous variables on endogenous variables. If a measurement model is used, then a set of latent (unobserved) variables are measured as linear functions of other observed exogeneous or endogenous variables. In a fully specified model with latent variables, all three of these sets of equations are included. However, most applications of SEM only include one or two. In this research, the casual relationship between travel behavior and perceptions of pedestrian and cyclist environments was tested in both directions. To handle this reciprocal relationship, two structural equations and one measurement equation were needed. Therefore, the model was initially defined using the following equations:
Structural equations:
PPCE = B PPCE + C TRAVEL + Γ1 X1 + Γ2 X2 + ς
TRAVEL = D PPCE + E TRAVEL + Π1 X1 + Π2 X3 + μ
Measurement equation:
Y = Λ PPCE + ε
where PPCE: latent variable that represents the Perceptions of Pedestrian and Cyclists-specific Environments; TRAVEL: weekend use of each private vehicle/public transport/active transport; X1: vector of exogenous variables that affect both PPCE and TRAVEL; X2: vector of exogenous variables that only affect PPCE; X3: vector of exogenous variables that only affect TRAVEL; B: vector of weight coefficients predicting PPCE’s from other PPCE’s; C: vector of weight coefficients predicting PPCE’s from TRAVEL’s; D: vector of weight coefficients predicting TRAVEL’s from PPCE’s; E: vector of weight coefficients predicting TRAVEL’s from other TRAVEL’s; Γ: vector of weight coefficients predicting PPCE’s from exogeneous variables; Π: vector of weight coefficients predicting TRAVEL’s from exogeneous variables; ς: vector of residuals representing unobserved dependent variables affecting PPCE and errors and random disturbances; μ: vector of residuals representing unobserved dependent variables affecting TRAVEL and errors and random disturbances; Y: vector of endogenous variables (variables A111 to A128 in Table 4 that measured the latent variable PPCE); Λ: coefficient matrix that reflects the causal relationship between Y and PPCE; and ε: vector reflecting measurements errors in Y.
The structural equations involve two endogenous variables (PPCE and TRAVEL), exogenous variables (X), vectors of residuals (ς and μ), and several vectors of coefficients to be estimated. The measurement equation includes the endogenous variables (Y) that measure the latent variable PPCE, vector ε reflecting measurement errors and a coefficient matrix (Λ) to be estimated. Regarding structural equations, at least one excluded exogenous variable (X) is needed for the equations to be identified. That is, it must have an X2 variable that does not have an effect on the endogenous variable TRAVEL and an X3 variable that does not have an effect on the endogenous variable PPCE. These X2 and X3 variables are called instrumental variables for the causal system, and are very difficult to find. In our case, it was not possible to find those variables. Therefore, two separate non-reciprocal models were fit to simulate each relationship between PPCE and TRAVEL. Differences between coefficient estimates of the rest of the variables and global fit indexes of both models are minimum, so results are represented below in the same figure.
In this study, maximum likelihood with Huber-White covariance adjustment (MLR) was used for parameter estimation [37]. This estimator uses White’s sandwich-based method to yield test statistics that are robust in presence of non-normality (censored data from below) and non-independence (multiple data provided by a single respondent) [38]. While this robust estimator yields superior results (compared to standard maximum likelihood) when input data are non-normal, the chi-square test of absolute model fit can still be sensitive to trivial misspecifications in the model’s structure. Additionally, we also evaluated the following descriptive measures of model fit: the Standardized Root Mean Residual (SRMR) [39], the Comparative Fit Index (CFI) [40], and the Root Mean Square of Approximation (RMSEA) [41] using the recommended cutoff values of 90 for the CFI and related incremental fit indices, 08 for the RMSEA, and 10 for SRMR [42].
Based on the conceptual framework and the results of the EFA and CFA, five full SEM models were estimated for weekend travel behavior. Models 1a and 1b include the use of PV during weekend (% PV TRIPS WEEK-END). Model 2 includes the use of PT during weekend (% PT TRIPS WEEK-END). Models 3a and 3b include the use of AT during weekend (% AT TRIPS WEEK-END). Three latent variables that represent the perceptions of sidewalks, bike paths and pedestrian crossings are included in the models as well. However, indirect effects are only significant when the aggregated perception of pedestrian- and cyclist-specific environments (PPCE) is used (Models 1a and 3a). Results are described in the next subsections.

5.3.1. Models 1a and 1b: Use of Private Vehicle (PV) during Weekends

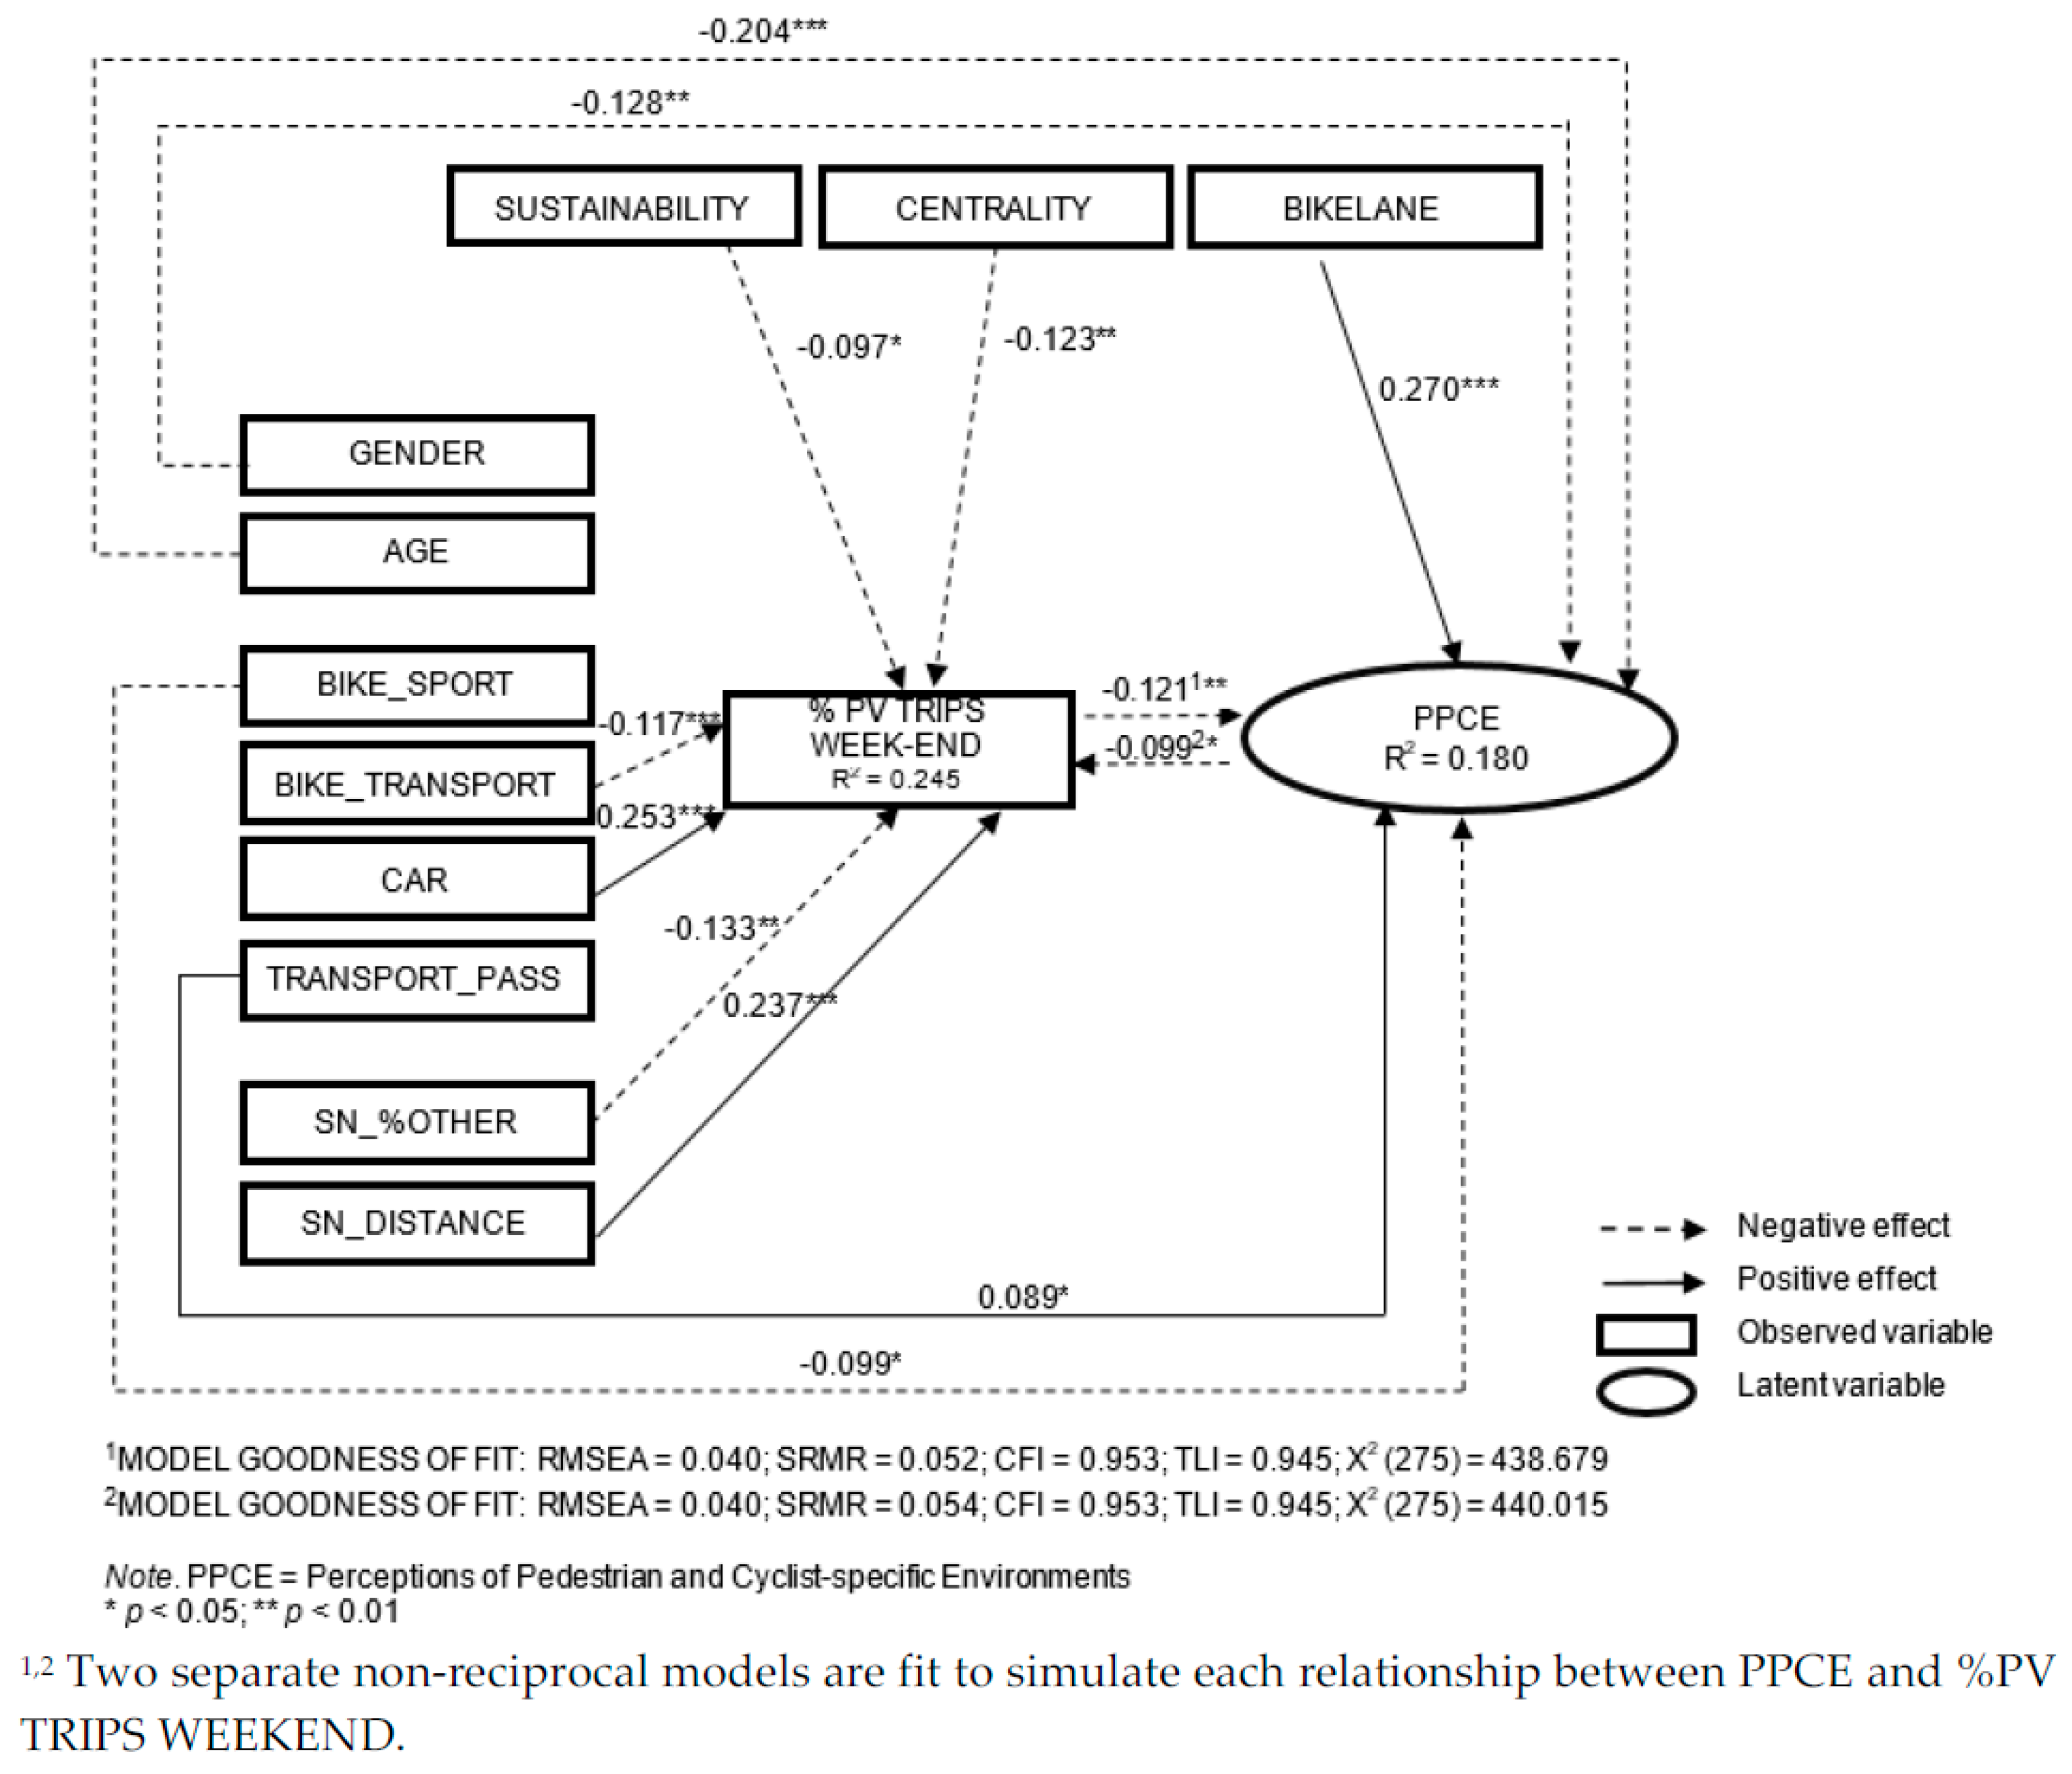
Figure 3 includes Model 1a results showing the direct effects between other variables with PPCE.
As expected, the perception of pedestrian- and cyclist-specific environments is negatively associated with the weekend use of PV (Figure 3), indicating an inverse relationship between the two variables. This association presents a low statistical significance. More interestingly, there is a strong statistically significant and negative association between the weekend use of PV and the perception of pedestrian- and cyclist-specific environments, which again indicates an inverse relationship.
The existence of bicycle lanes in a neighborhood has a positive association with the perception of pedestrian- and cyclist-specific environments. Some socioeconomic characteristics are also associated with the perception of pedestrian- and cyclist-specific environments. Gender and age have significant negative association with the perception, while ownership of a transport pass has a positive association with the perception.
In the case where bicycles are mainly used for sport there is a negative association with the perception of the pedestrian- and cyclist-specific environments. There is no significant statistical evidence that the characteristics of companions influence directly the respondents’ perceptions of pedestrian- and cyclist-specific environments.
Conversely, the degree of transport sustainability and the centrality of the residence area are inversely associated with the weekend use of PV. Logically, when bicycles are mainly used for transport, there is a negative association to the weekend use of PV. In contrast, car availability is positively associated with the weekend use of PV.
Some characteristics of companions present a significant association with the use of PV during weekends. The proportion of non-family members among companions is negatively associated with the weekend use of PV. The distance between alters’ and egos’ residences is positively associated with the weekend use of PV.
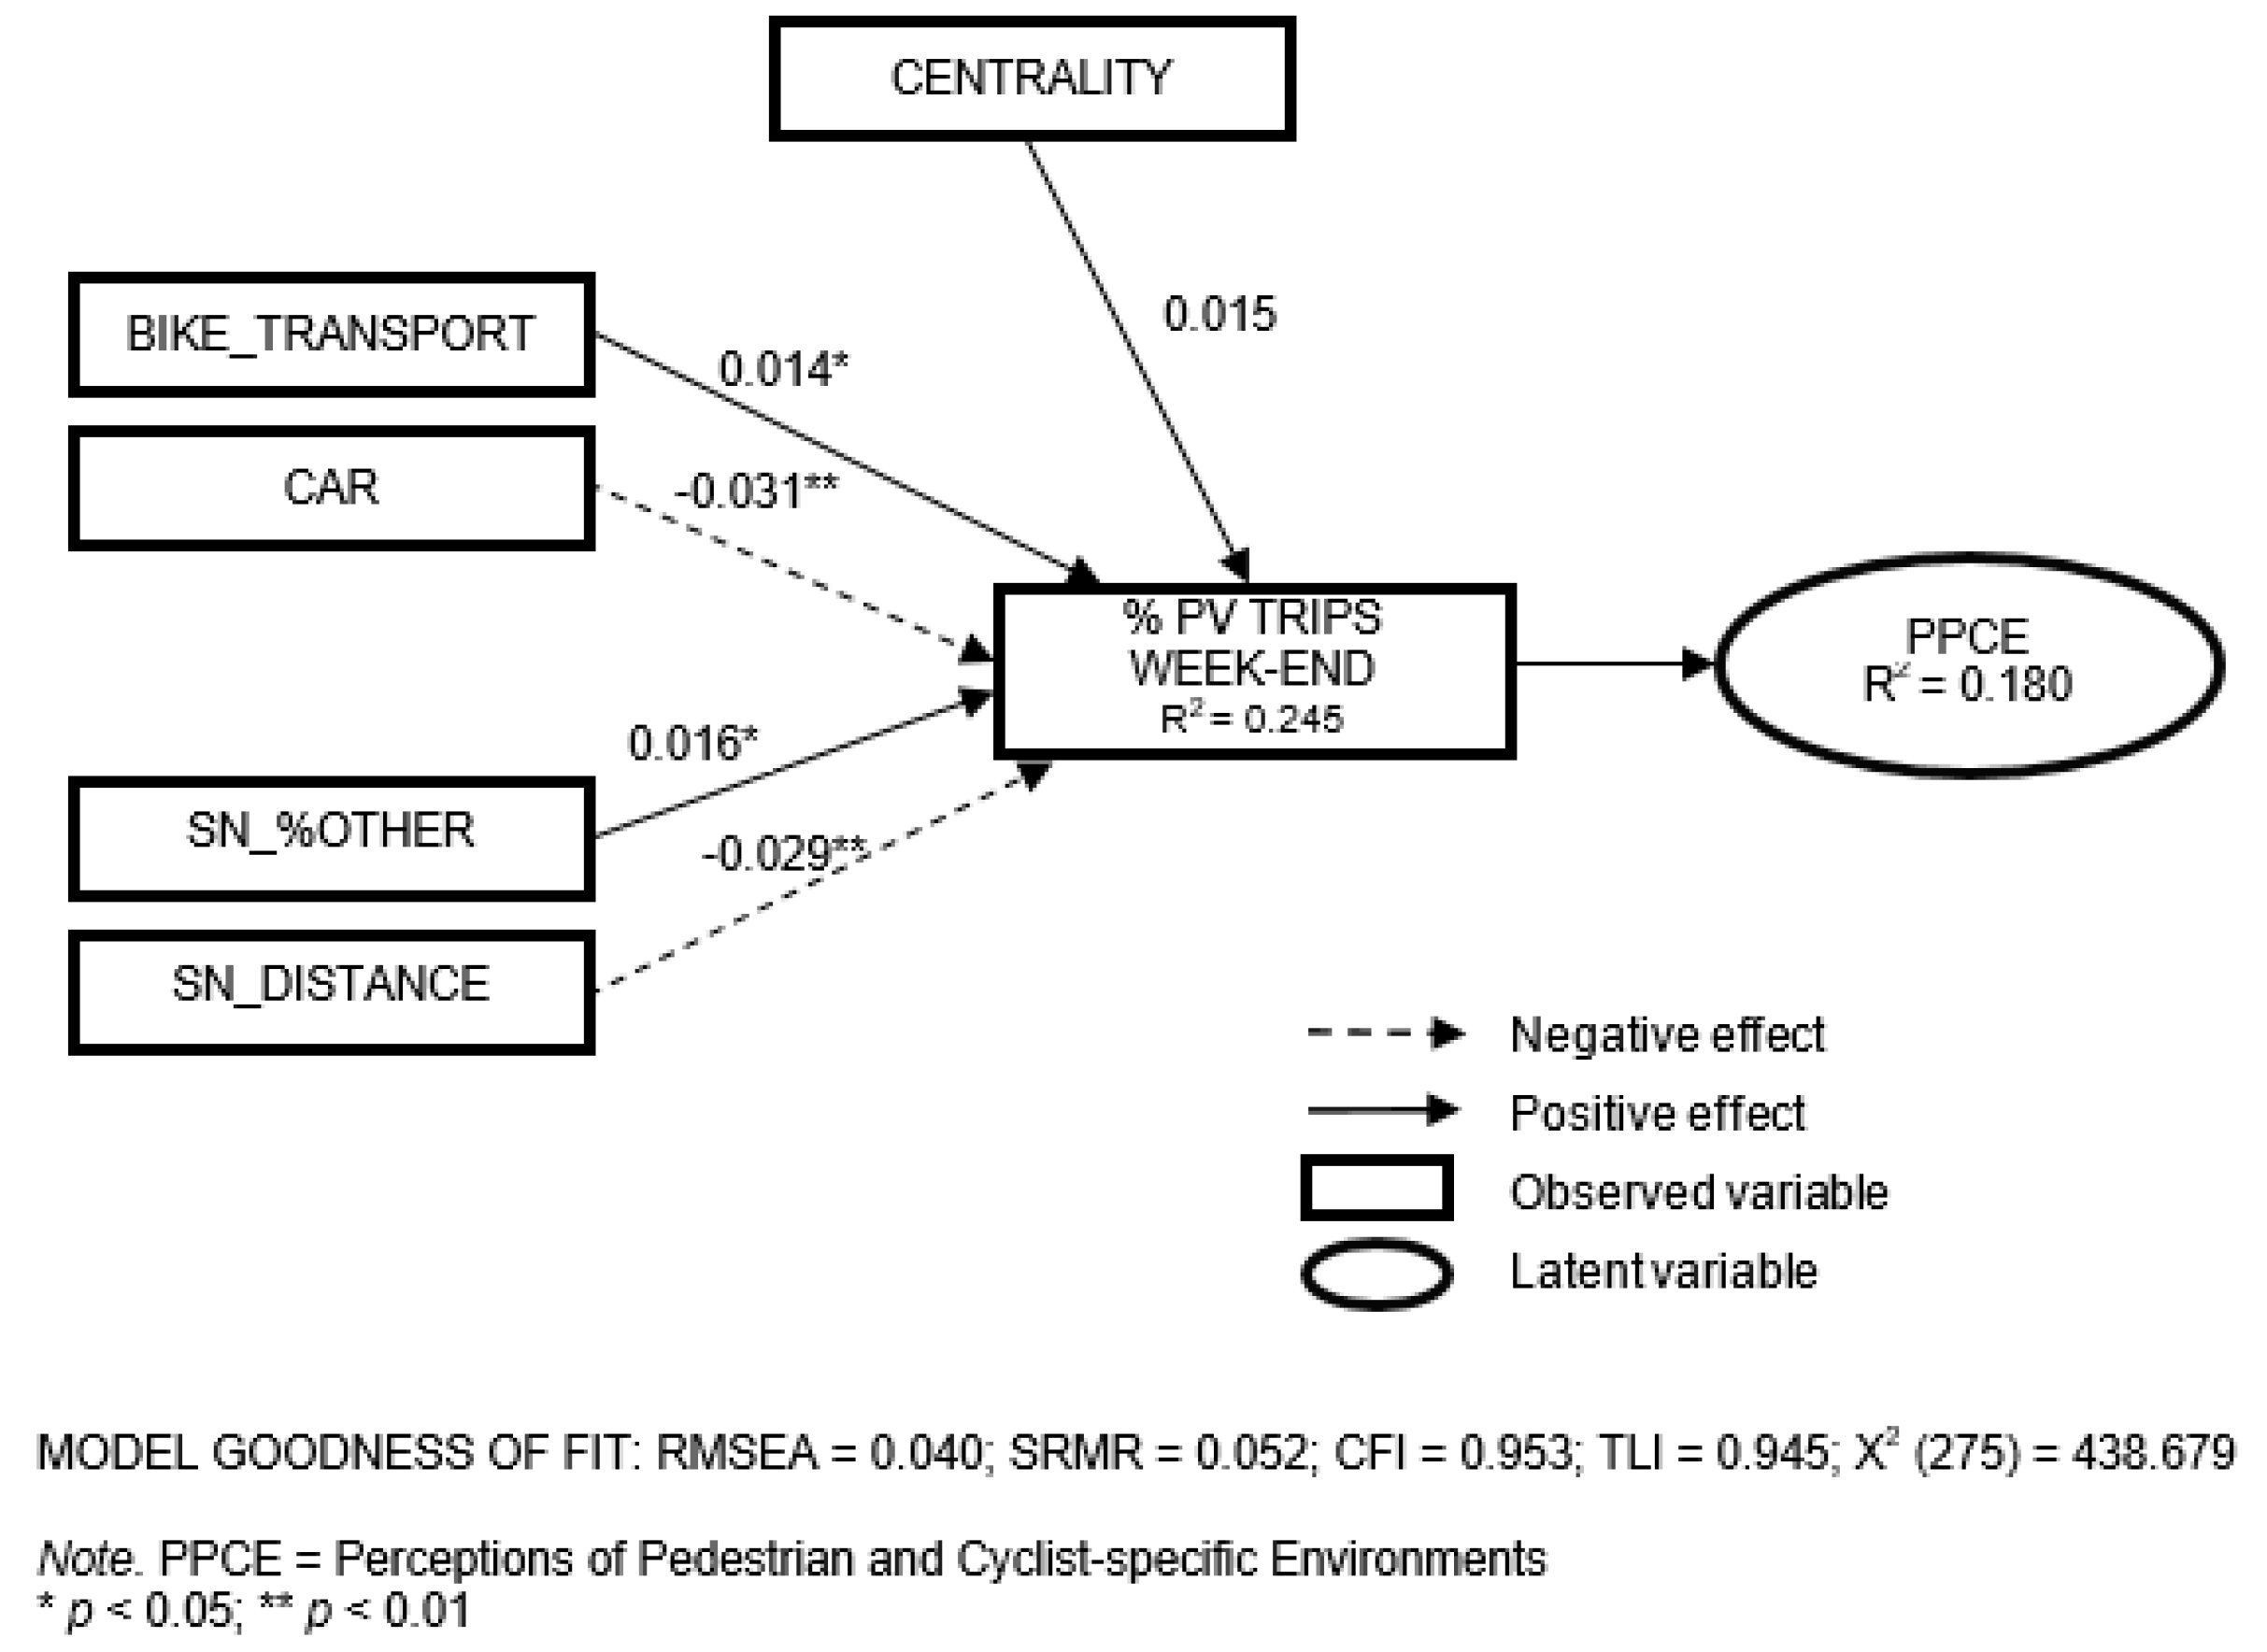
Figure 4 includes Model 1a results showing the indirect effects between other variables with PPCE. All identified effects are mediated by the weekend use of private vehicle.
The variables with a positive association with PPCE are: centrality of home locations of respondents, using bicycle mainly for transport, and the proportion of non-family members among companions. The variables with a negative association with PPCE are car ownership and the distance between companions’ and respondent’ residences.
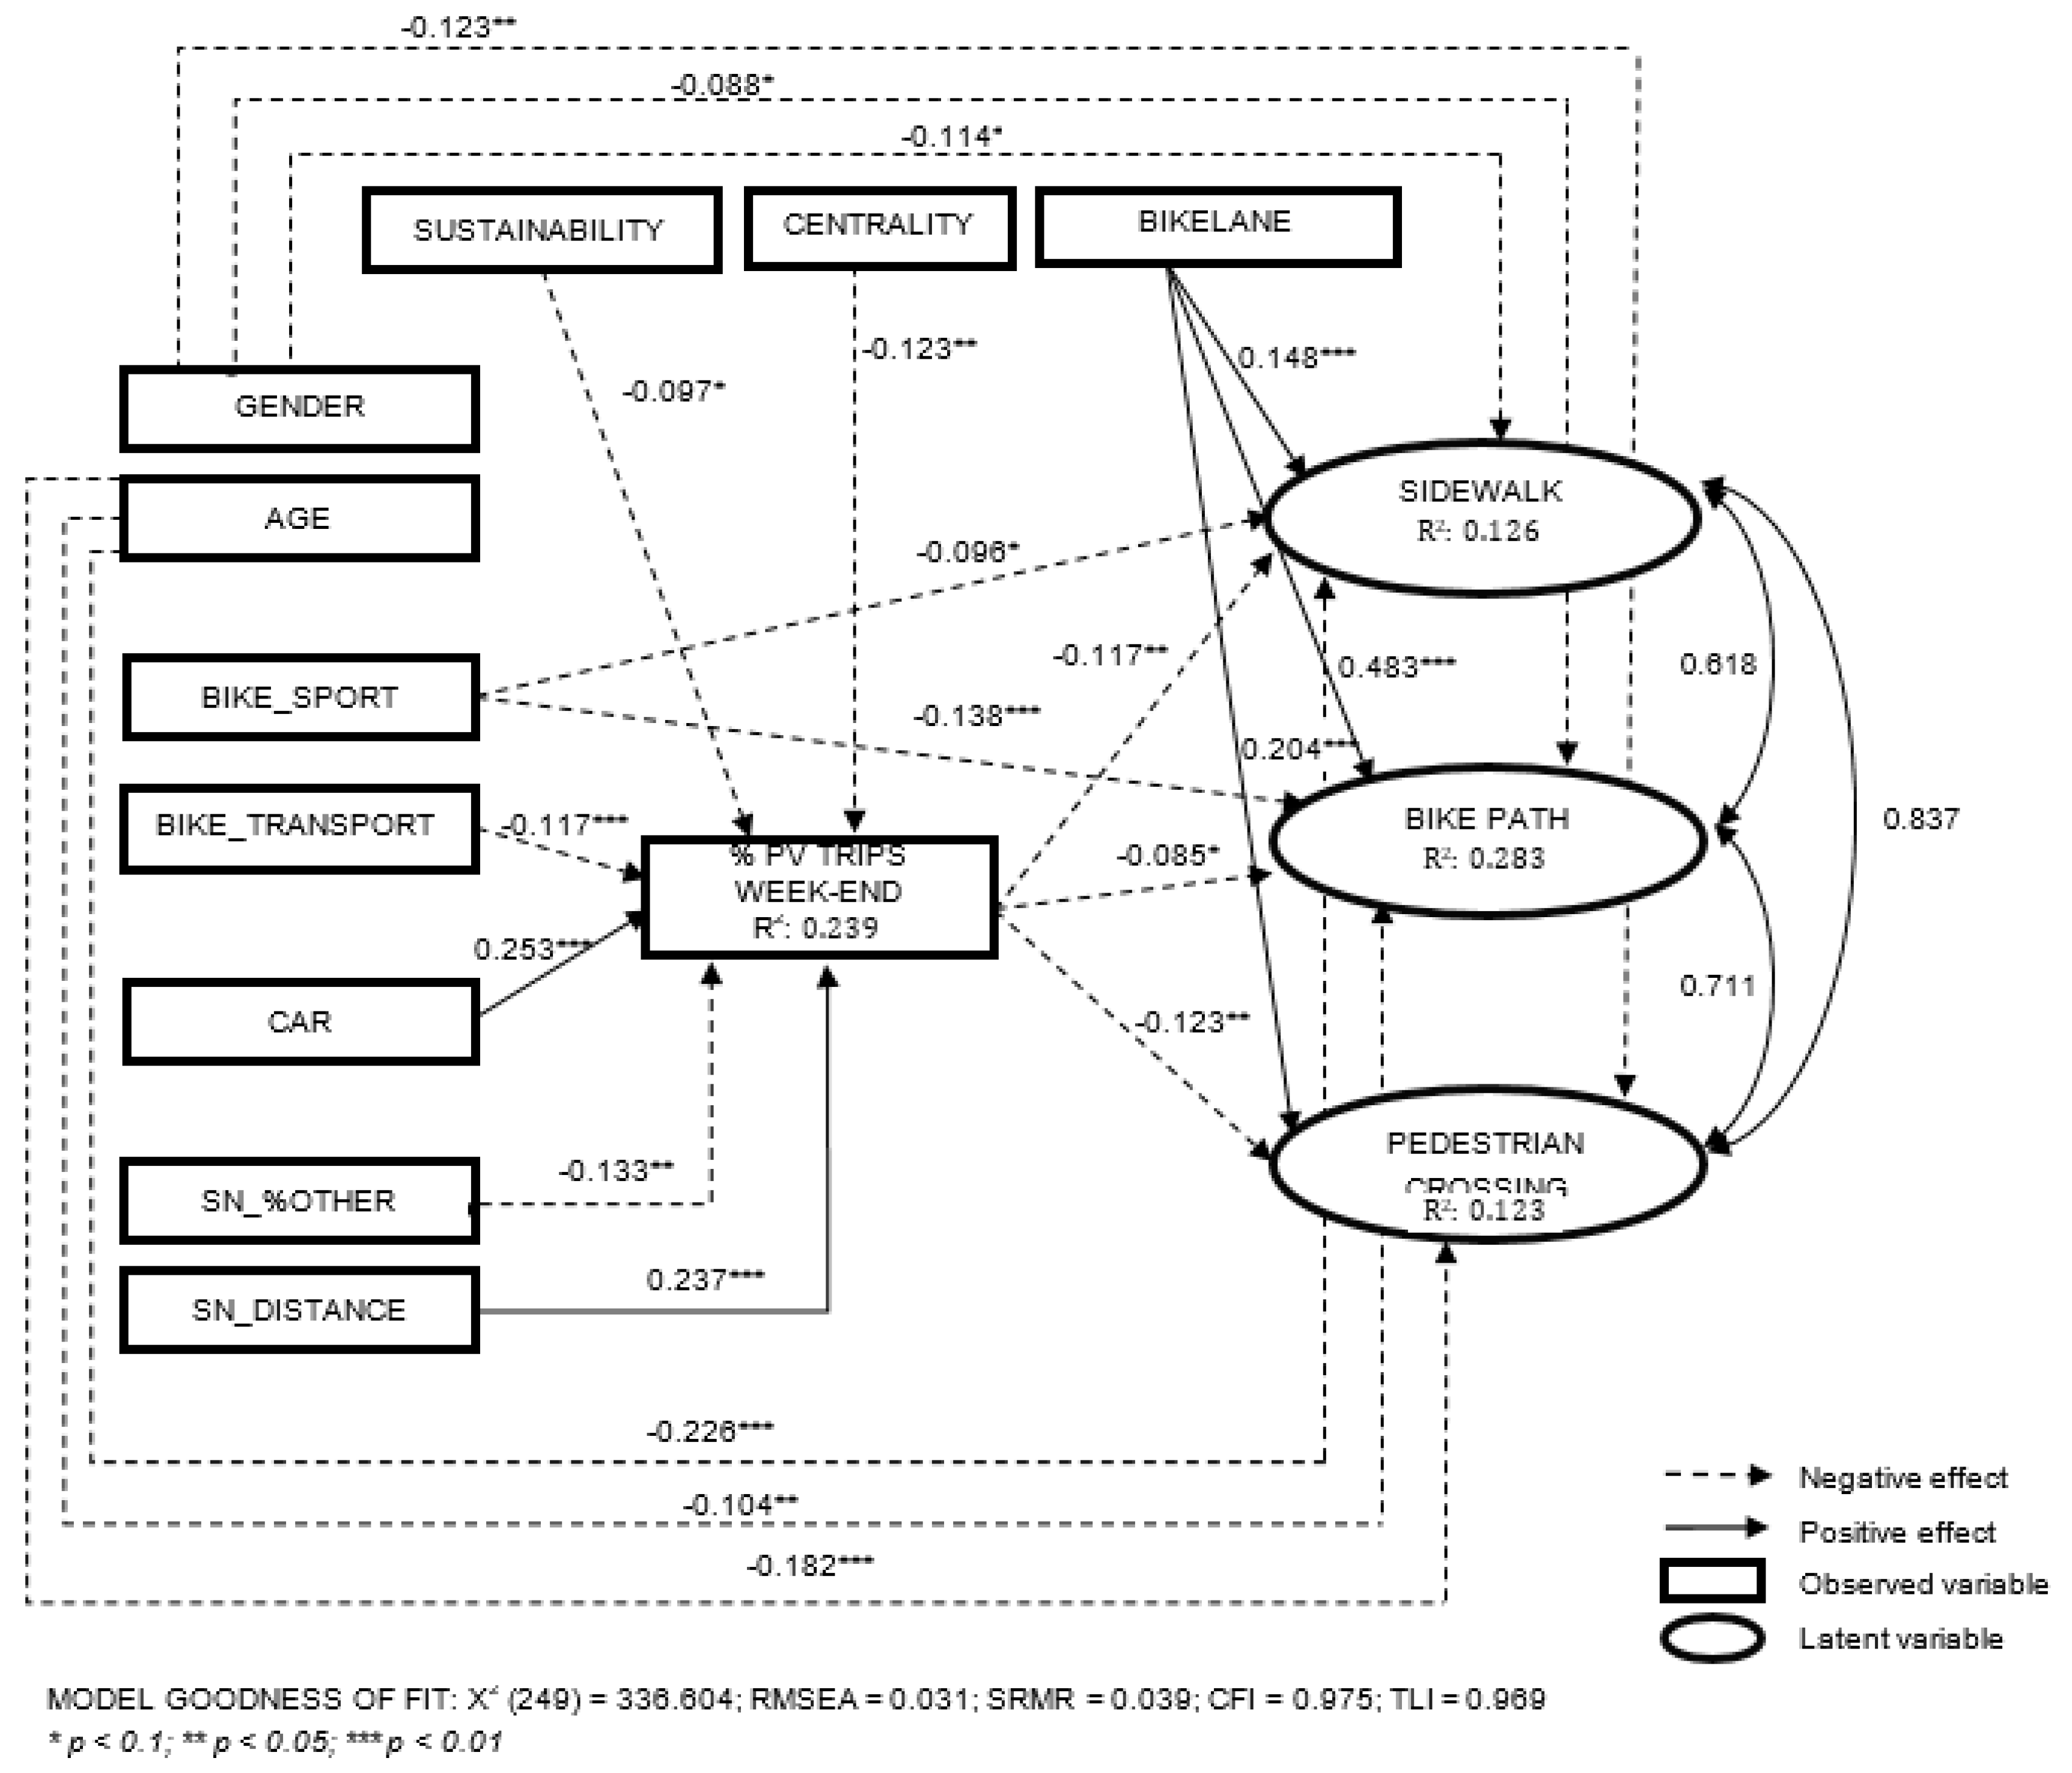
Figure 5 presents Model 1b results showing the direct effects between all other variables and the three disaggregated perceptions (sidewalks, bicycle paths and pedestrian crossings).
None of the perceptions of sidewalks, bicycle paths and pedestrian crossings present a significant association with the weekend use of PV. By contrast, there are negative statistical significant associations between the weekend use of PV and the three disaggregated perceptions.
All variables associated with the aggregated perception of pedestrian- and cyclist-specific environments (Model 1a) are also found significantly associated with the perception of sidewalks, bicycle paths and pedestrian crossings (Model 1b), with the exception of owning a transport pass.

5.3.2. Model 2: Use of Public Transport (PT) during Weekends

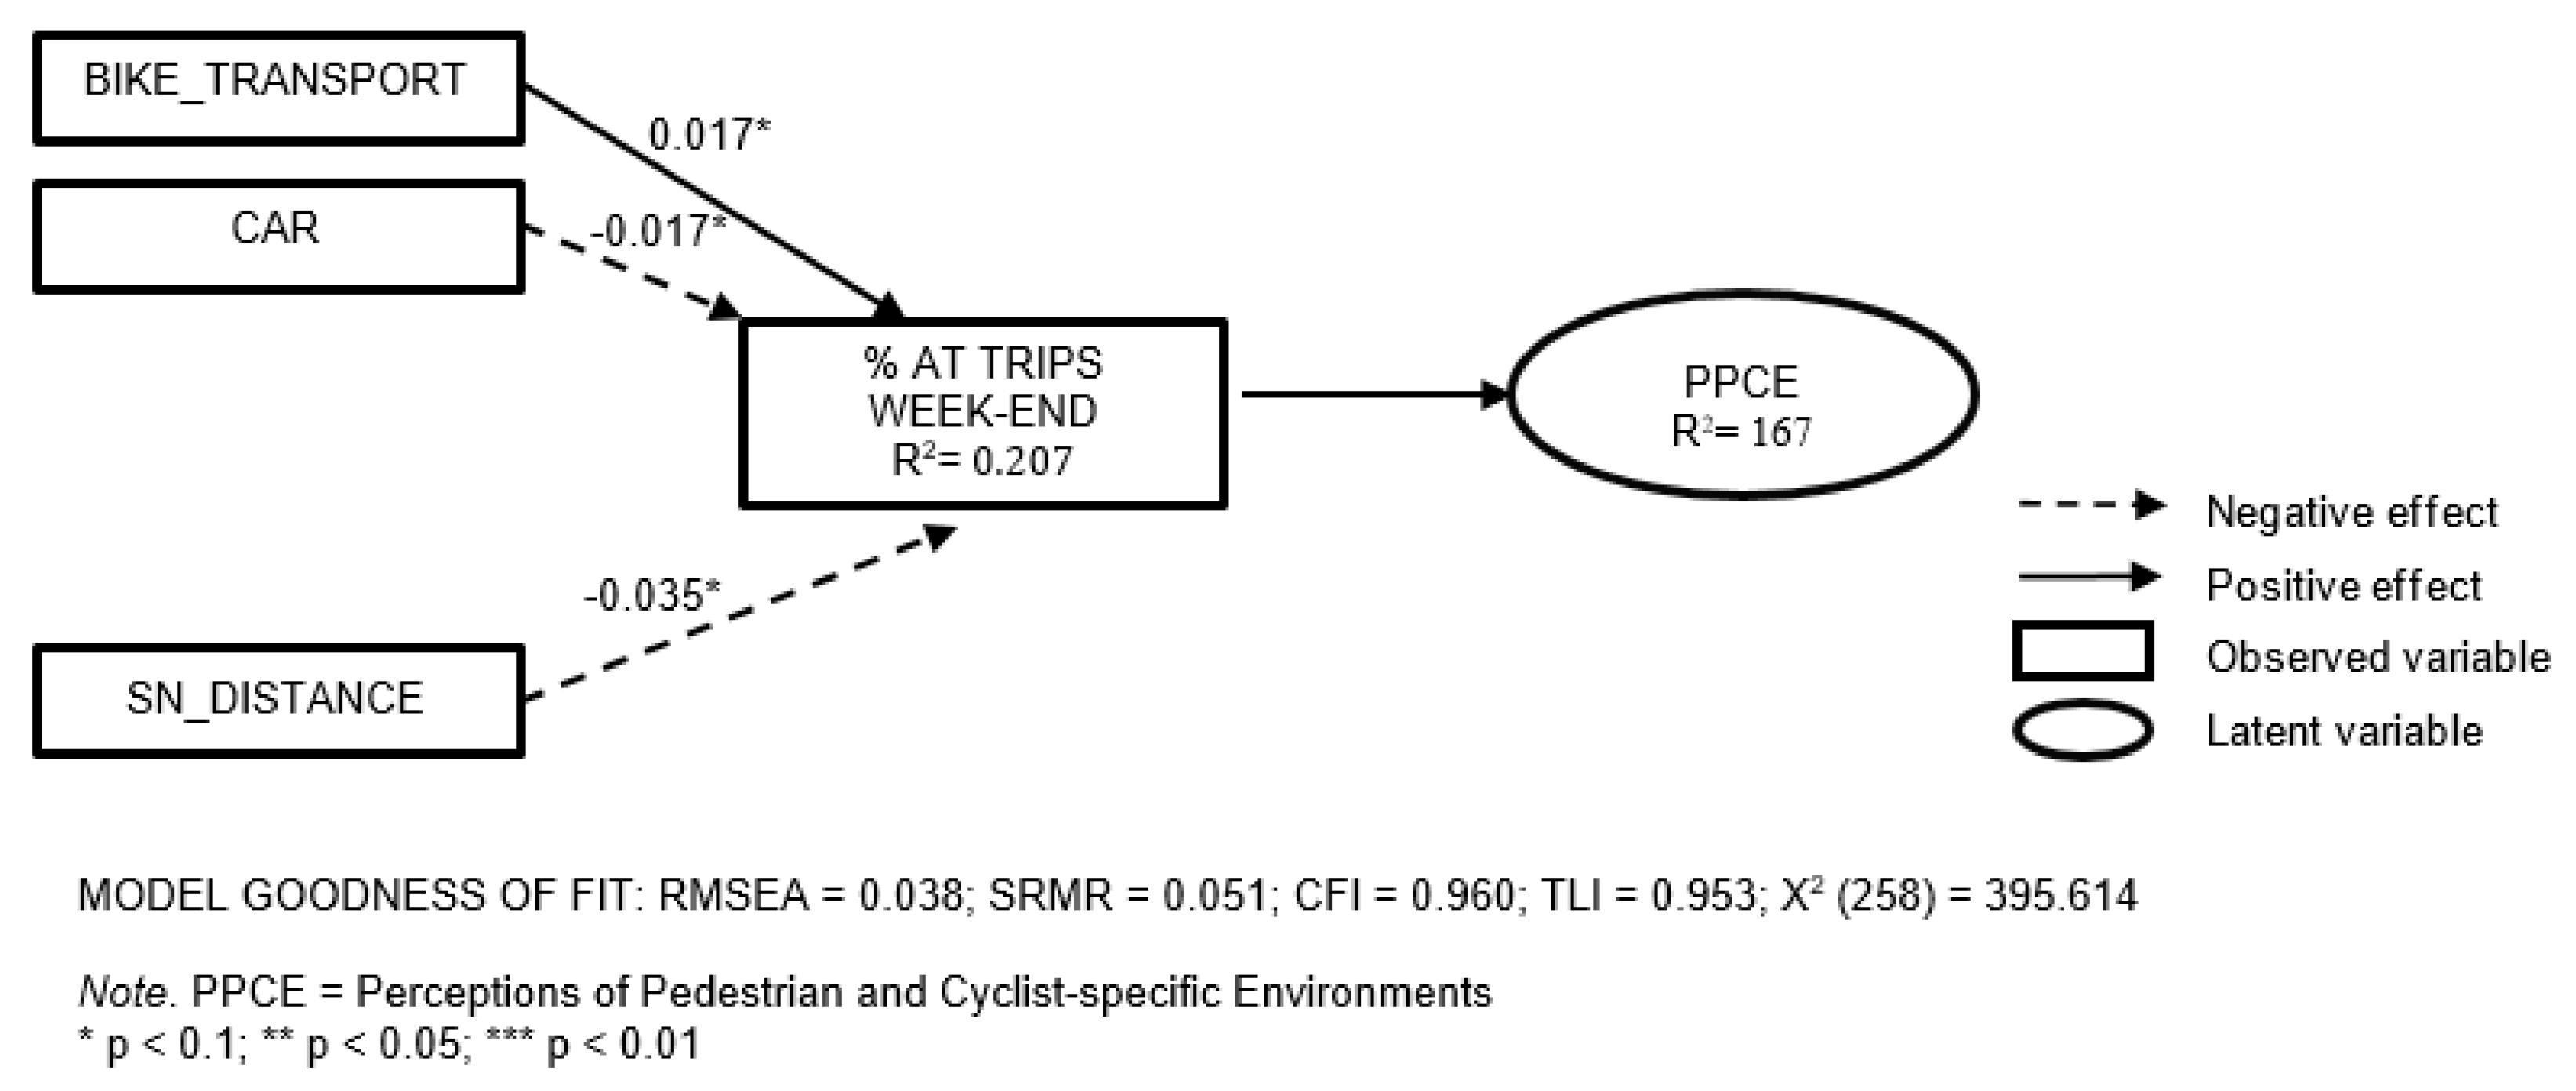
Figure 6 reports Model 2 that includes direct effects results for weekend use of PT. Since indirect effects are not significant, these results can be considered as total effects. In this case, no significant effects have been found between weekend use of PT and the aggregated perceptions of pedestrian- and cyclist-specific environments. Therefore, Figure 4 includes only disaggregated perceptions of sidewalks, bicycle paths and pedestrian crossings. Weekend use of PT does, however, affect positively only the perception of sidewalks.
Similar to the previous models’ results, the existence of bicycle lanes positively associates with the perceptions of sidewalks, bicycle paths and pedestrian crossings.
Model 2 also indicates that age has a negative effect on the perceptions of sidewalks, bike paths and pedestrian crossings. The use of bicycle for sport negatively influences the perception of sidewalks. Gender and car availability have a negative association with the weekend use of PT.

5.3.3. Models 3a and 3b: Use of Active Transport (AT) during Weekends

Figure 7 reports Model 3a direct effects results for weekend AT use, which includes the aggregated perception of pedestrian- and cyclist-specific environments. The perception of pedestrian- and cyclist-specific environments presents a non-significant association with the weekend use of AT (p > 0.1). Conversely, there is a positive statistically significant association between the weekend use of AT and the perception of pedestrian- and cyclist-specific environments.
The availability of bicycle lanes is positively associated with the perception of pedestrian- and cyclist-specific environments. Age, gender, and to a lesser extent using bicycle mainly for sport are also negatively associated with that perception. Characteristics of companions do not affect directly the perception of pedestrian- and cyclist-specific environments.
The degree of transport sustainability in residential locations, gender and bicycle mainly use for transport are positively associated with the weekend use of AT. Car availability is negatively associated with the weekend use of AT.
Some characteristics of companions also present a significant association with the use of AT during weekends. Contrary to the use of PV (Model 1a), the proportion of non-family members among companions is positively associated with the weekend use of AT. The distance between companions’ and respondents’ residences is negatively associated with the weekend use of AT. In this case, the frequency of face-to-face contact with companions is negatively associated with the use of AT during weekends.
Figure 8 includes Model 3a results showing the indirect effects between other variables with PPCE. All identified effects are mediated by the weekend use of AT.
The only variable with a positive association is using bicycle mainly for transport. The variables with a negative association are car ownership and the distance between companions’ and respondents’ residences.
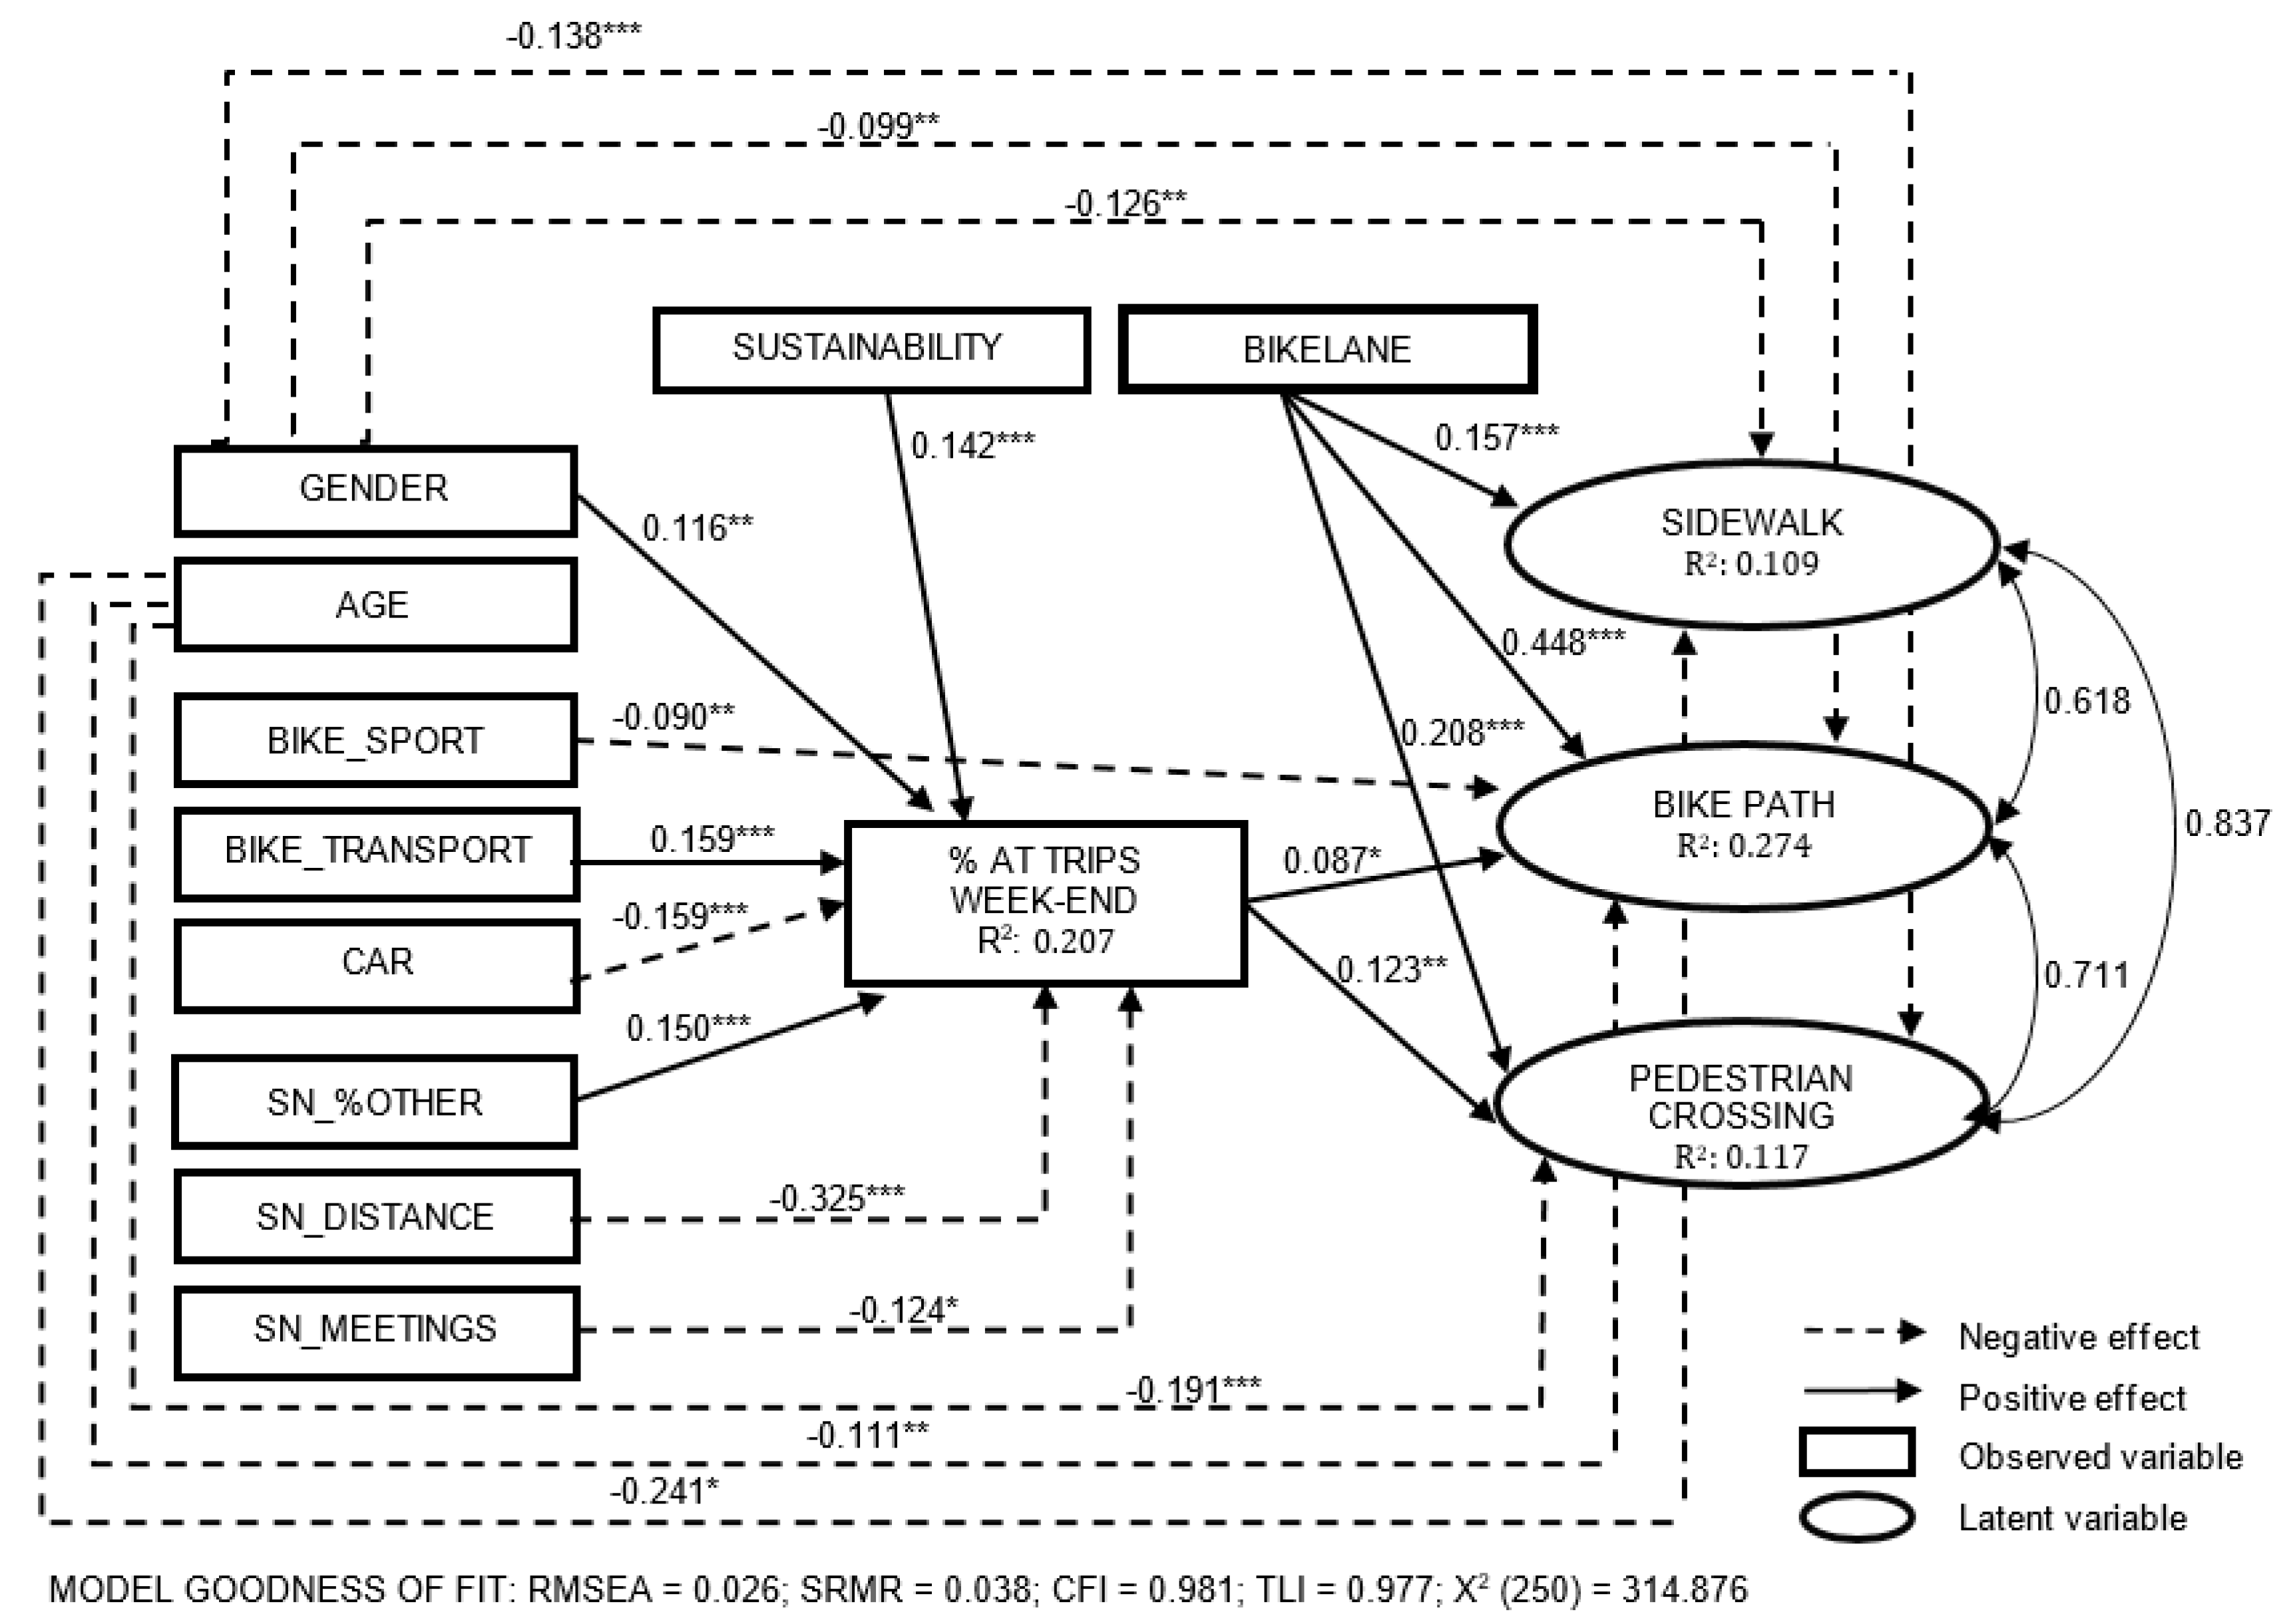
Figure 9 presents Model 3b results showing the direct effects between all other variables and the three disaggregated perceptions (sidewalks, bike paths and pedestrian crossings). Similar to the public transport model (Model 2), indirect effects are not significant. Therefore, these results can be considered as total effects.
None of the perceptions of sidewalks, bicycle paths and pedestrian crossings present a significant association with the weekend use of AT. There is, however, a statistically significant and positive association between the weekend use of AT and the perceptions of bike paths and pedestrian crossings. Surprisingly, there is no significant association between the use of AT and the perception of sidewalks.
All associations found in Model 3a that include the aggregated PPCE are also found in Model 3b where the three disaggregated perceptions are considered. Differences according to the level of significance appear between age and the perception of sidewalks.

6. Discussion

Results of the models described in Section 5 indicate that not all the hypothesized relationships in the conceptual framework are confirmed. Built environment characteristics and sociodemographics and travel characteristics are both associated with the PPCE and travel behavior. However, the characteristics of companions only directly influence the weekend use of PV and AT. However, we have found indirect effects that associate the characteristics of companions with perceptions mediated by travel behavior.

6.1. Travel Behavior and the PPCE and the Disaggregated Perceptions

The PPCE and the weekend use of PV, PT and AT mutually influence each other in the conceptual model. However, only a weak association between the PPCE and the use of PV during weekend has been found. Ma and Cao [18] also found significant associations between perceptions and travel behavior in the context of civil/religious and shop travel. This is also in line with the Ecological Systems Theory.
On the contrary, the effects of weekend use of PV and AT on the PPCE and the disaggregated perceptions of sidewalks, bike paths and pedestrian crossings are significant. These results are in line with Kroesen et al. [43], who found stronger effect of travel behaviors on attitudes than vice versa. Similarly, De Vos et al. [44] found that the evaluation of walking and cycling trips positively affects the respondents’ attitude towards the respective mode, which in turn has a positive effect on choosing that mode. According to Goldstein [45], one of the variables affecting human perception is the experience associated to the perceived object. In other words, the more PV is used, the more awareness of its positive characteristics. Therefore, there is a better perception of PV. Additionally, these results could be explained by the Cognitive Dissonance Theory [13]. Individuals may adapt their perceptions to their current behavior to reduce the possible dissonance and keep their psychological consistency.
In this study, the weekend use of PV is negatively associated with both the PPCE, and the disaggregated perceptions of sidewalks, bicycle paths and pedestrian crossing. In contrast, the weekend use of AT is positively associated with those perceptions. Interestingly, the weekend use of PT only affects the perceptions of sidewalks with a positive sign. Access and egress displacements to and from PT stops and stations are carried out mainly using sidewalks, which may help public transport users to form a positive perception of this part of the pedestrian environment.

6.2. Social Networks and Perceptions

Although there is not a direct effect association between the characteristics of companions and PPCE, we have found indirect effects through travel behavior. The proportion of non-family members among companions is positively associated with PPCE through the weekend use of PV. The activity-travel behavior with non-family companions is less routine, visiting more non-habitual locations, which may facilitate be more aware of pedestrian- and cyclist-specific environments. The distance between participants’ and their companions’ residences is negatively associated with PPCE through the weekend use of both PV and AT. Long displacements increase the likelihood of encountering poor pedestrian or cyclist-specific environments.

6.3. Built Environment, Sociodemographics, Travel Characteristics and Perceptions

As expected, the existence of bicycle lanes is positively associated with PPCE and the disaggregated perceptions. Considering that other elements of the built environment do not provide significant relations with any of the specific perceptions, we can conclude that bike infrastructure has a wider impact on global perceptions of the built environment related to pedestrians and cyclists than the rest of attributes of the area.
Females and older people have more negative associations with the PPCE and the disaggregated perceptions. This result may be explained because women and older people are more sensitive to the presence of obstacles in sidewalks and bicycle paths.
Respondents who use the bike for sport have a negative association with the PPCE, and particularly of bike path and to a lower extent of sidewalks. This could be explained by the design of cycling-specific environments, which might not be convenient for sport activities due to their different requirements.

6.4. Social Networks and Travel Behavior

Several characteristics of the activity-travel companions are associated with travel behavior. The proportion of non-family members among companions is negatively associated with the weekend use of PV, and positively associated with the weekend use of AT. As explained earlier, activity-travel with family companions is more routine including maintenance trips, which tend to be carried out more by car than by bicycle or foot.
As expected, the distance between participants’ and their companions’ residences is negatively associated with the weekend use of PV, and positively associated with the weekend use of AT. This finding confirms that distance is a deterrence of walking and cycling [46].
The frequency of face-to-face meeting with companions is negatively associated with the weekend use of AT. Cycling and particularly walking are used to perform short displacements that are usually solo trips, which are carried out to fulfill mainly maintenance activities that do not require companionships.

6.5. Built Environment, Sociodemographics, Travel Characteristics and Travel Behavior

As expected, the degrees of transport sustainability and centrality of the respondent’s residence area are both negatively associated with the weekend use of PV, and positively associated with the use of AT. The provision of high quality public transport and pedestrian itineraries is of paramount importance to promote sustainable travel behavior.
Females are negatively associated with the weekend use of PT and positively associated with the weekend use of AT. Women usually travel more by PT than men when weekday commute trips are considered. In contrast, during weekends, the use of PT diminishes to a great extent, particularly among females. Regarding the use of AT, women usually walk more than men any day of the week. This is not true for bike use. However, the number of walking trips is much greater than bike trips.
Logically, car availability is positively associated with the weekend use of PV, and negatively associated with the weekend use of AT. Using bike for transport is negatively associated with the weekend use of PV, and positively associated with the weekend use of AT. This result makes clear that PV and bike are substitute travel modes.

7. Conclusions

This paper presents a study of the interrelationships within the perception of pedestrian- and cyclist-specific environments, travel behaviors, and a particular subset of social networks, characterized by their being usual trip or activity companions. To this end, data collected with a web-based survey were analyzed using Structural Equation Modeling.
Among the variables that present important associations with perceptions of pedestrian- and cyclist-specific environments, travel behavior characteristics is the most outstanding. This result suggests that people tend to adapt their perceptions to their current travel behavior to reduce the possible dissonance and keep their psychological consistency. In other words, the more people walk and use bicycle, the more attractive are these travel modes. It is easier to convince people to use AT when performing non-compulsory activities. Therefore, the use of AT should be encouraged through better infrastructure, adequate land-use developments, and information campaigns.
Another important finding is the associations found between several characteristics of activity-travel companions and weekend use of PV and AT. Our hypothesis related to the influence of that subset of individuals’ social network on their travel behavior is confirmed. An important application of this finding is that transport surveys should include questions to collect basic characteristics of companions, which would help improve travel studies and modeling efforts.
In this study, a subsample of the social network was used, which consisted on an enlarged list of activity and trips companions. Our hypothesis related to the influence of that subset of individuals’ social network on their travel behavior is confirmed. Information regarding activity-travel companions can be obtained in a costly-effective way, compared to the exhaustive studies on social networks available found in travel behavior literature. Transport surveys and activity studies should include questions to collect basic characteristics of companions, which would help improve activity-travel studies and modeling efforts.
Limitations of this research include possible residential self-selection bias to the extent that participants’ travel preferences and perceptions might also influence where to live. However, this limitation may not be relevant because only perceptions of particular elements of pedestrian and cyclist environments are considered, instead of global perceptions of the built environment.

8. Ethical Code

The dataset used in this study will be provided during review. Universitat Politècnica de València (UPV) gave the corresponding ethical approval code, if all participants explicitly gave their consent, and the database was stored and secured conveniently. Spanish data protection law regulations are respected.

Author Contributions

The authors confirm contribution to the paper as follows: study conception and design, T.R. and L.M.; data collection, T.R., R.A. and L.M.; analysis and model estimation, R.A.; and interpretation of results and draft manuscript preparation, T.R., R.A. and L.M. All authors reviewed the results and approved the final version of the manuscript.

Funding

This research was funded by Ministerio de Economía, Industria y Competitividad MINERVA project, grant number [TRA2015-71184-C2-1-R].

Conflicts of Interest

The authors declare no conflict of interest.

References

  1. Paulssen, M.; Temme, D.; Vij, A.; Walker, J.L. Values, attitudes and travel behavior: A hierarchical latent variable mixed logit model of travel mode choice. Transportation 2014, 41, 873–888. [Google Scholar] [CrossRef]
  2. Axhausen, K.W. Social factors in future travel: A qualitative assessment. IEE Proc. Intell. Transp. Syst. 2006, 153, 156–166. [Google Scholar] [CrossRef]
  3. Lindsay, P.H.; Norman, D.A. Human Information Processing; Academic Press: New York, NY, USA, 1977. [Google Scholar]
  4. Assael, H. Consumer Behavior and Marketing Action, 5th ed.; South Western College Publishing: Nashville, TN, USA, 1995. [Google Scholar]
  5. Sherif, M.; Cantril, H. The psychology of attitudes: I. Psychol. Rev. 1945, 52, 295–319. [Google Scholar] [CrossRef]
  6. Neumann, O. Beyond Capacity: A Functional View of Attention. In Perspectives on Perception and Action; Heuer, H., Sanders, A.F., Eds.; Erlbaum: Hillsdale, NJ, USA, 1987; pp. 361–394. [Google Scholar]
  7. Bronfenbrenner, U. Toward an experimental ecology of human development. Am. Psychol. 1977, 32, 513–531. [Google Scholar] [CrossRef]
  8. Bronfenbrenner, U. The Ecology of Human Development: Experiments by Nature and Design; Harvard University Press: Cambridge, UK, 1979. [Google Scholar]
  9. Bandura, A.; National Inst of Mental Health. Prentice-Hall Series in Social Learning Theory. Social Foundations of Thought and Action: A Social Cognitive Theory; Prentice-Hall: Englewood Cliffs, NJ, USA, 1986. [Google Scholar]
  10. Ajzen, I. From intentions to actions: A theory of planned behavior. In Action Control: From Cognition to Behavior; Kuhl, J., Beckmann, J., Eds.; Springer: Berlin/Heidelberg, Germany, 1985; pp. 11–39. [Google Scholar]
  11. Ajzen, I. The theory of planned behavior. Organ. Behav. Hum. Decis. Process. 1991, 50, 179–211. [Google Scholar] [CrossRef]
  12. Barton, B.K.; Kologi, S.M.; Siron, A. Distracted pedestrians in crosswalks: An application of the Theory of Planned Behavior. Transp. Res. Part F 2016, 37, 129–137. [Google Scholar] [CrossRef]
  13. Festinger, L. A Theory of Cognitive Dissonance; Stanford University Press: California, CA, USA, 1957. [Google Scholar]
  14. Hägerstrand, T. What about People in Regional Science? Pap. Reg. Sci. 1970, 24, 7–21. [Google Scholar] [CrossRef]
  15. Dill, J.; Voros, K. Factors affecting bicycling demand: Initial survey findings from the Portland, Oregon region. Transp. Res. Rec. 2007, 2031, 9–17. [Google Scholar] [CrossRef]
  16. Hull, A.; O’Holleran, C. Bicycle infrastructure: Can good design encourage cycling? Urban Plan. Transp. Res. 2014, 2, 369–406. [Google Scholar] [CrossRef]
  17. Ma, L.; Dill, J.; Mohr, C. The objective versus the perceived environment: What matters for bicycling? Transportation 2014, 41, 1135–1155. [Google Scholar] [CrossRef]
  18. Ma, L.; Cao, J. How perceptions mediate the effects of the built environment on travel behavior? Transportation 2017. [Google Scholar] [CrossRef]
  19. Miller, E.J.; Roorda, M.J. Prototype model of household activity-travel scheduling. Transp. Res. Rec. 2003, 1831, 114–121. [Google Scholar] [CrossRef]
  20. Habib, K.N.; Carrasco, J.A. Investigating the role of social networks in start time and duration of activities: A trivariate simultaneous econometric model. Transp. Res. Rec. 2011, 2230, 1–8. [Google Scholar] [CrossRef]
  21. Neutens, T.; Schwanen, T.; Miller, H.J. Dealing with timing and synchronization in opportunities for joint activity participation. Geogr. Anal. 2010, 42, 245–266. [Google Scholar] [CrossRef]
  22. Silvis, J.; Niemeier, D.; D’Souza, R. Social Networks and Travel Behavior: Report from an Integrated Travel Diary. Presented at the 11th International Conference on Travel Behavior Research, Kyoto, Japan, 16–20 August 2006. [Google Scholar]
  23. Van den Berg, P.E.W.; Arentze, T.A.; Timmermans, H.J.P. A path analysis of social networks, telecommunication and social activity-travel patterns. Transp. Res. Part C 2013, 26, 256–268. [Google Scholar] [CrossRef]
  24. Sandri, A.M.; Lee, S.; Ukkusuri, S.V. Modeling Social Network Influence on Joint Trip Frequency for Regular Activity Travel Decisions. Trans. Res. Rec. 2016, 2495, 83–93. [Google Scholar] [CrossRef]
  25. Arroyo, R.; Ruiz, T.; Mars, L.; Serna, A. Web-based survey to measuring social interactions, values and attitudes, and travel behavior. Presented at the 11th International Conference on Transport Survey Methods, Estérel, QC, Canada, 24–29 September 2017. [Google Scholar]
  26. Schwartz, S.H. Are there universal aspects in the structure and contents of human values? J. Soc. Issues 1994, 50, 19–45. [Google Scholar] [CrossRef]
  27. Field, A. Discovering Statistics Using SPSS for Windows; Sage publications: London, UK; Thousand Oaks, CA, USA; New Delhi, India, 2000. [Google Scholar]
  28. Rietveld, T.; Van Hout, R. Statistical Techniques for the Study of Language and Language Behaviour; Mouton de Gruyter: Berlin, Germany; New York, NY, USA, 1993. [Google Scholar]
  29. Child, D. The Essentials of Factor Analysis, 2nd ed.; Cassel Educational Limited: London, UK, 1990. [Google Scholar]
  30. Böcker, L.; Dijst, M.; Faber, J.W. Transport mode choices and emotional travel experiences. Transp. Res. Part A 2016, 94, 360–373. [Google Scholar] [CrossRef]
  31. Brende Lind, H.; Nordfjærn, T.; Halvard Jørgensen, S.; Rundmo, T. The value-belief-norm theory, personal norms and sustainable travel mode choice in urban areas. J. Environ. Psychol. 2015, 44, 119–125. [Google Scholar] [CrossRef]
  32. Dinga, C.; Wangb, D.; Liuc, C.; Zhangd, Y.; Yang, J. Exploring the influence of built environment on travel mode choice considering the mediating effects of car ownership and travel distance. Transp. Res. Part A 2017, 100, 65–80. [Google Scholar] [CrossRef]
  33. Sharmeena, F.; Arentze, T.; Timmermans, H. An analysis of the dynamics of activity and travel needs in response to social network evolution and life-cycle events: A structural equation model. Transp. Res. Part A 2014, 59, 159–171. [Google Scholar] [CrossRef]
  34. Tae-Hyoung, T.G. SEM application to the household travel survey on weekends versus weekdays: The case of Seoul, South Korea. Eur. Transp. Res. Rev. 2018, 10, 11. [Google Scholar] [CrossRef]
  35. Ye, R.; Titheridge, H. Satisfaction with the commute: The role of travel mode choice, built environment and attitudes. Transp. Res. Part D 2017, 52, 535–547. [Google Scholar] [CrossRef]
  36. Hox, J.J.; Bechger, T.M. An introduction to structural equation modeling. Fam. Sci. Rev. 1998, 11, 354–373. [Google Scholar]
  37. Yuan, K.-H.; Bentler, P.M. Three likelihood-based methods for mean and covariance structure analysis with nonnormal missing data. In Sociological Methodology; Sobel, M.E., Ed.; American Sociological Association: Washington, DC, USA, 2000; pp. 165–200. [Google Scholar]
  38. White, H. A heteroskedasticity-consistent covariance matrix estimator and a direct test for heteroskedasticity. Econometrics 1980, 48, 817–838. [Google Scholar] [CrossRef]
  39. Bollen, K.A. Structural Equations with Latent Variables; John Wiley and Sons, Inc.: New York, NY, USA, 1989. [Google Scholar]
  40. Hu, L.; Bentler, P.M. Cutoff criteria for fit indexes in covariance structure analysis: Conventional criteria versus new alternatives. Struct. Equ. Model. 1999, 6, 1–55. [Google Scholar] [CrossRef]
  41. Browne, M.; Cudeck, R. Alternative ways of assessing model fit. In Testing Structural Equation Models; Bollen, K., Long, S., Eds.; Sage: Newbury Park, NJ, USA, 1993. [Google Scholar]
  42. Vandenberg, R.J.; Lance, C.E. A review and synthesis of the measurement invariance literature: Suggestions, practices, and recommendations for organizational research. Org. Res. Methods 2000, 3, 4–69. [Google Scholar] [CrossRef]
  43. Kroesen, M.; Handy, S.; Chorus, C. Do attitudes cause behavior or vice versa? An alternative conceptualization of the attitude-behavior relationship in travel behavior modeling. Transp. Res. Part A Policy Prac. 2017, 101, 190–202. [Google Scholar] [CrossRef]
  44. De Vos, J.; Mokhtarian, P.L.; Schwanen, T.; Van Acker, V.; Witlox, F. Travel mode choice and travel satisfaction: Bridging the gap between decision utility and experienced utility. Transportation 2016, 43, 771–796. [Google Scholar] [CrossRef] [Green Version]
  45. Goldstein, E.B. Sensation and Perception, 8th ed.; Wadsworth: Pacific Grove, CA, USA, 2010. [Google Scholar]
  46. Ferrer, S.; Ruiz, T.; Mars, L. A qualitative study on the role of the built environment for short walking trips. Transp. Res. Part F 2015, 33, 141–160. [Google Scholar] [CrossRef]
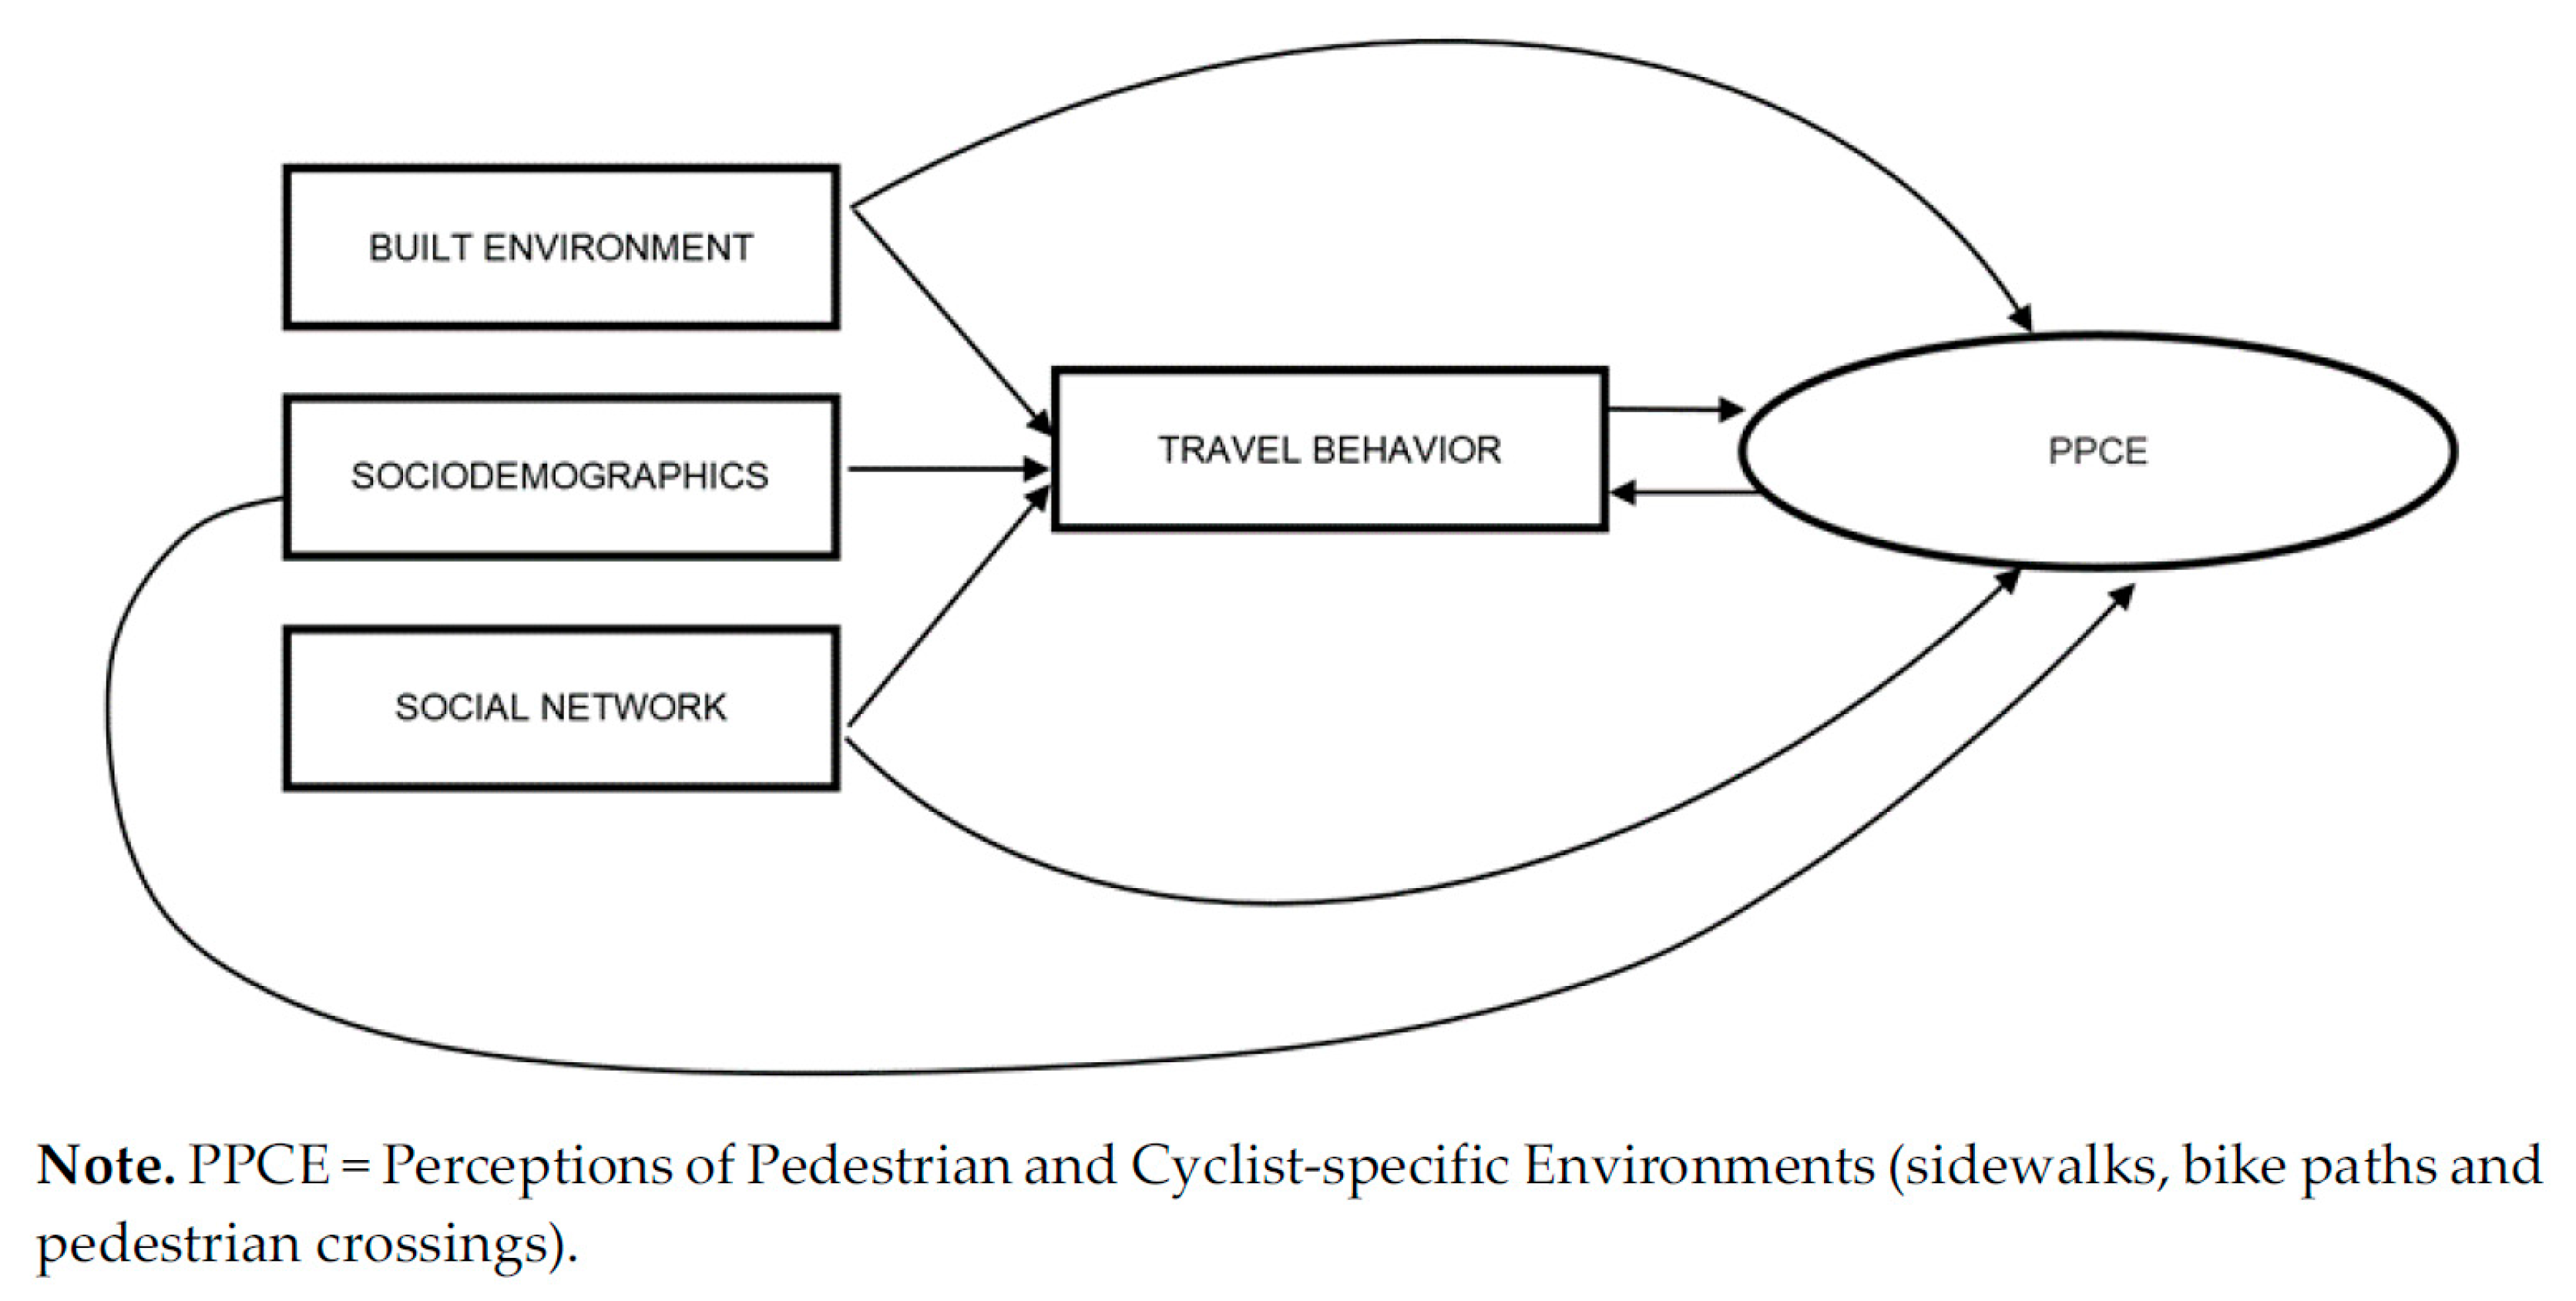
Figure 1. Conceptual model.
Sustainability 10 03241 g001
Figure 2. Confirmatory Factor Analysis.
Sustainability 10 03241 g002
Figure 3. Model 1a. Direct effects.
Sustainability 10 03241 g003
Figure 4. Model 1a. Indirect effects.
Sustainability 10 03241 g004
Figure 5. Model 1b. Direct effects.
Sustainability 10 03241 g005
Figure 6. Model 2. Total effects.
Sustainability 10 03241 g006
Figure 7. Model 3a. Direct effects.
Sustainability 10 03241 g007
Figure 8. Model 3a. Indirect effects.
Sustainability 10 03241 g008
Figure 9. Model 3b. Total effects.
Sustainability 10 03241 g009
Table 1. Definition of variables.
VariablesDescriptionType
Demographics
Gender0 = male; 1 = femaleCategorical
AgeAge of the respondentContinuous
Transport Pass1 = respondent has an integrated public transport pass; 0 = otherwiseCategorical
CarCar availability (0 = low to 5 = high)Continuous
BikeBicycle availability (0 = low to 5 = high)Continuous
MotorbikeMotorbike availability (0 = low to 5 = high)Continuous
Bikes in HHNumber of bicycles available in the householdContinuous
Cars in HHNumber of cars available in the householdContinuous
Marital status1 = single; 2 = married; 3 = civil partner; 4 = couple; 5 = widow; 6 = divorced; 7 = otherCategorical
Education level1 = no studies; 2 = primary level; 3 = vocational training; 4 = secondary level; 5–6 = higher education; 7 = university degree or higherCategorical
Occupation1 = student only; 2 = employed; 3 = self-employed; 4 = student and employed; 5 = unemployed; 6 = retired; 7 = housekeeper; 8 = otherCategorical
Income1 = any income; 2 = less than 500 €; 3 = 500–1000 €; 4 = 1000–1500 €; 5 = 1500–2000 €; 6 = 2000–2500 €; 7 = 2500–3000 €; 8 = more than 3000 € (net monthly)Categorical
Bicycle Use
Bike transport1 = bicycle used mainly for travel; 0 = otherwiseCategorical
Bike sport1 = bicycle used mainly for sport; 0 = otherwiseCategorical
Built Environment and Accessibility
Bike lane1 = bicycle lane available in the respondent’s residence area; 0 = otherwiseCategorical
CentralityDegree of centrality of the respondent’s residence area. (See indicator definition)Continuous
SustainabilityDegree of transport sustainability of the respondent’s residence area. (See indicator definition)Continuous
MetroWalking distance to the closest metro station: 1 = less than 5 min; 2 = 5–10 min; 3 = 10–15 min; 4 = 15–20 min; 5 = 20–30 min; 6 = more than 30 minCategorical
BusDistance to the closest bus stop: 1 = less than 5 min; 2 = 5–10 min; 3 = 10–15 min; 4 = 15–20 min; 5 = 20–30 min; 6 = more than 30 minCategorical
Companions
SN sizeNumber of companionsContinuous
SN %malePercentage of males in the companionsContinuous
SN %familyPercentage of family members companionsContinuous
SN %otherPercentage of not family members companionsContinuous
SN distanceAverage distance of residence between the respondent and his/her companionsContinuous
SN meetingsFrequency of face-to-face meeting with companionsContinuous
SN ageAverage age of companionsContinuous
SN connectivityConnection degree among companions (0 = low to 5 = high)Continuous
HH minorsNumber of persons under 18 living in the householdContinuous
HH membersNumber of people living in the householdContinuous
SN influenceAverage degree of influence of companions in the ego’s mobilityContinuous
Table 2. Sample distribution.
RespondentsPercentage
Gender
Male18245.1%
Female22254.9%
Age
16–2514435.6%
26–3510024.7%
36–5010225.2%
>505814.3%
Occupation
Student only14134.9%
Employed18846.5%
Student & employed409.9%
Unemployed194.7%
Retired71.7%
Other92.2%
Table 3. Modal split and companions.
TripsTrips/PersonTrips/Person-DayPercentage
Modal Split
Private Vehicle11322.8021.40135.62%
Public Transport3720.9210.46011.71%
Cycling2170.5370.2696.83%
Walking14373.5571.77845.22%
Other200.0500.0250.63%
Companions
Trips with companions14533.601.8045.72%
Solo trips17254.272.1354.28%
Total
31787.873.93100%
Table 4. Exploratory and Confirmatory Factor Analyses. Disaggregated perceptions of sidewalks, bicycle paths and pedestrian crossings.
StatisticEFACFA
VariableItemMeanSDMedianModeFactor LoadingSTDYX Standardized Loadings (S.E.)
Perception of Sidewalks
A111Width and length are appropriate3.671.19440.7510.733 (0.030)
A114Maintenance conditions are good3.531.18440.8110.806 (0.031)
A117They are free of any obstacle3.121.30340.7210.714 (0.034)
A123Urban furniture is appropriate3.501.18440.6840.695 (0.037)
Perception of Bicycle Pahts
A112Width and length are appropriate2.921.37320.8460.804 (0.022)
A115Maintenance conditions are good3.261.32340.8350.861 (0.022)
A118They are free of any obstacle3.151.34340.7470.770 (0.029)
A124Urban furniture is appropriate3.121.32340.7490.749 (0.031)
A126They are placed conveniently2.941.34340.7940.790 (0.028)
A129They have sufficient continuity2.731.41310.8150.784 (0.026)
Perception of Pedestrian Crossings
A113Width and length are appropriate3.851.03440.6910.716 (0.032)
A116Maintenance conditions are good3.701.06440.7640.807 (0.025)
A119They are free of any obstacle3.781.13440.6990.684 (0.039)
A125Urban furniture is appropriate3.671.07440.7730.726 (0.032)
A127They are placed conveniently3.701.07440.7620.731 (0.033)
A128Traffic light scheduling is adequate3.571.19440.6440.651 (0.041)
Correlations—Disaggregated Perceptions
Bicycle paths WITH Sidewalks 0.618 (0.045)
Pedestrian crossings WITH Sidewalks0.837 (0.028)
Pedestrian crossings WITH Bicycle paths0.711 (0.035)
Note. All CFA factors are statistically significant (p < 0.01).