Article

Influence of Perceptual Range on Human Perceived Restoration

Department of Landscape Architecture, Kongju National University, Chung Nam 32439, Korea
Sustainability 2018, 10(9), 3139; https://doi.org/10.3390/su10093139
Submission received: 19 June 2018 / Revised: 17 August 2018 / Accepted: 28 August 2018 / Published: 3 September 2018
(This article belongs to the Special Issue Human–River Interactions in Cities)

Abstract

:
In daily living environments, an individual’s different state of mind influences their spatial perception. The current study, based on Attention Restoration Theory, aimed to explore differences in the health utility of nature according to individual differences in spatial perception. It focused on Cheonggyecheon stream in Seoul, South Korea. Cognitive mapping and the Perceived Restorativeness Scale (PRS) were used to assess two groups’ different perceived spatial ranges and the restorative effect of the environment. After gathering data, two groups were defined: one describing only the internal area of the research site (composed of green materials), and the other illustrating the external area of the site, including buildings and roads. The former had higher overall PRS, Being Away, Fascination, and Compatibility scores. The latter had higher scores only on the Coherence subscale. These results illustrate that the frequency of nature visits and time spent traveling influence the two groups’ attentional restoration, which has great implications for highly stressful urban environments.

1. Introduction

In general, urban parks have been good places for enhancing physical health because they encourage the use of outdoor fitness facilities and promote various activities [1,2,3,4,5,6]. Moreover, urban parks have proven successful in the psychological remediation of residents in terms of reducing their urban stress [7,8,9]. Urban riverscape usually belongs to the urban parks in the city, and it has a similar function. According to a meta-analysis, Riverscape brings direct health contribution, mental and emotional restoration [10].
Attention restoration theory (ART) explains the restoration of mental fatigue by virtue of exposure to the elements of nature [8,9,11]. This theory supports the belief that people use urban parks because they provide mentally valuable experiences. Previous studies related to this theory have focused on the positive effects of greenery in nature as opposed to the greyness of urban spaces [12,13,14]. Some studies have used slides and images and other experimental settings to demonstrate the physical and mental benefits of nature and its elements [15,16,17,18,19,20], while a few have demonstrated mental health benefits by using actual sites [18].
Real sites provide a more extensive spatial perceptual range compared to experimental settings [21,22,23]. According to Kaplan and Kaplan [8], ART also explains the presence of various spatial perception differences associated with the elements of nature. According to Kaplan and Kaplan [8], people can experience “Being Away” and “Fascination” even with a small plant. Therefore, attention restoration relates to the individual’s perceptual range.
Although there is a large body of literature focusing on the restorative theory, there are few studies linking the theory and other effects such as social and individual factors.
The factors that promote environmental restorative effects (restoration) are found in a social context, as well as in natural settings [24,25]. The companion of certain individuals can provide Kaplan’s attention restoration during an outdoor experience because of the assured sense of safety [26,27]. Moreover, the frequency of visits to certain spaces relates to the attention restoration [28]. Often, this frequency is associated with experiences of lower fascination, higher senses of being away, and self-reported restoration [29]. The time spent traveling to a site is associated with the frequency of the visits.
Mental fatigue distorts and narrows spatial perception and decreases perceptual range [30,31,32,33]. These effects can be measured by cognitive mapping, which shows locational information and subjective perception of space [34].
Hypothesis 1.
People with narrow spatial perception would have a higher attention restoration rate than people with broader spatial perception.
Hypothesis 2.
Being with companion and the frequency of visits would positively affect the attention restoration rate.
The present study explores how perceptual range influences urban park users’ fatigue restoration. Moreover, it considers social context in analyzing the differences between the two spatial perception groups. Therefore, it was hypothesized that the perceptual group with a narrow range, whose cognitive map focused on a relatively small area, would have a higher attention restoration rate than the group with a broad range. Additionally, being with companion and the frequency of visits would be associated with the degree of restoration.

2. Materials and Methods

Cheonggyecheon, in central Seoul, has relatively more elements of nature (trees, shrubs, stream and natural rocks) than does the highly modernized area nearby, which is enclosed by tall buildings. The stream has been restored ecologically and historically. The current research site was in the 1.5 km between Cheonggye Plaza and the area under Seun Bridge. This linear urban stream park has been known to reduce the urban central temperature [35]. It is lower than the adjacent ground level by about 4–5 m. Its sunken shape helps to function as an urban nature site consisting of water flow up to knee level, with greenery and freely swimming fish that are easily observable (Figure 1). Pedestrian walkways 2–6 m wide line both sides of the stream.
Respondents who sat at the research site were selected by the fieldworkers because the people who sat on the site are more connected to the site in terms of symbolic ownership [36]. The researcher trained the investigators to avoid any errors such as non-sampling errors. Both the PRS survey and cognitive mapping of the location were conducted simultaneously (supplementary materials). Cognitive mapping helped the researcher understand the meaning of individuals’ psychological expressions through their drawings [37]. Drawings collected as raw data, especially in a spatial setting, can be used to classify respondents into different groups based on their contents and drawing patterns [38,39]. This study classified the different patterns of cognitive maps based on the positions occupied by the participants. Respondents were required to draw in an 18 cm × 12 cm box on the survey sheet, which presented a map of the site adjacent to their position, the orientation of which was clarified by the top view of a person being placed at the center of the drawing box.
The Perceived Restorativeness Scale (PRS) evaluates the degree of attentional restoration at a setting [12,13]. Previous studies have measured the degree of attentional restoration using photographs, video, imagination, and surveys of real settings [14,15,17,18]. According to Hartig’s classification for showing the attention restoration, this study used the four-factor (Being Away, Fascination, Coherence, and Compatibility) Korean version of the PRS survey with 16 questions [12,13,40,41]. Responses were made on an 11-point Likert scale (ranging from 0 = not at all to 10 = completely). Four trained investigators conducted the PRS questionnaire surveys with cognitive mapping for 19 days in September. For analysis, this study used data from 203 respondents, whose characteristics are presented in Table 1.
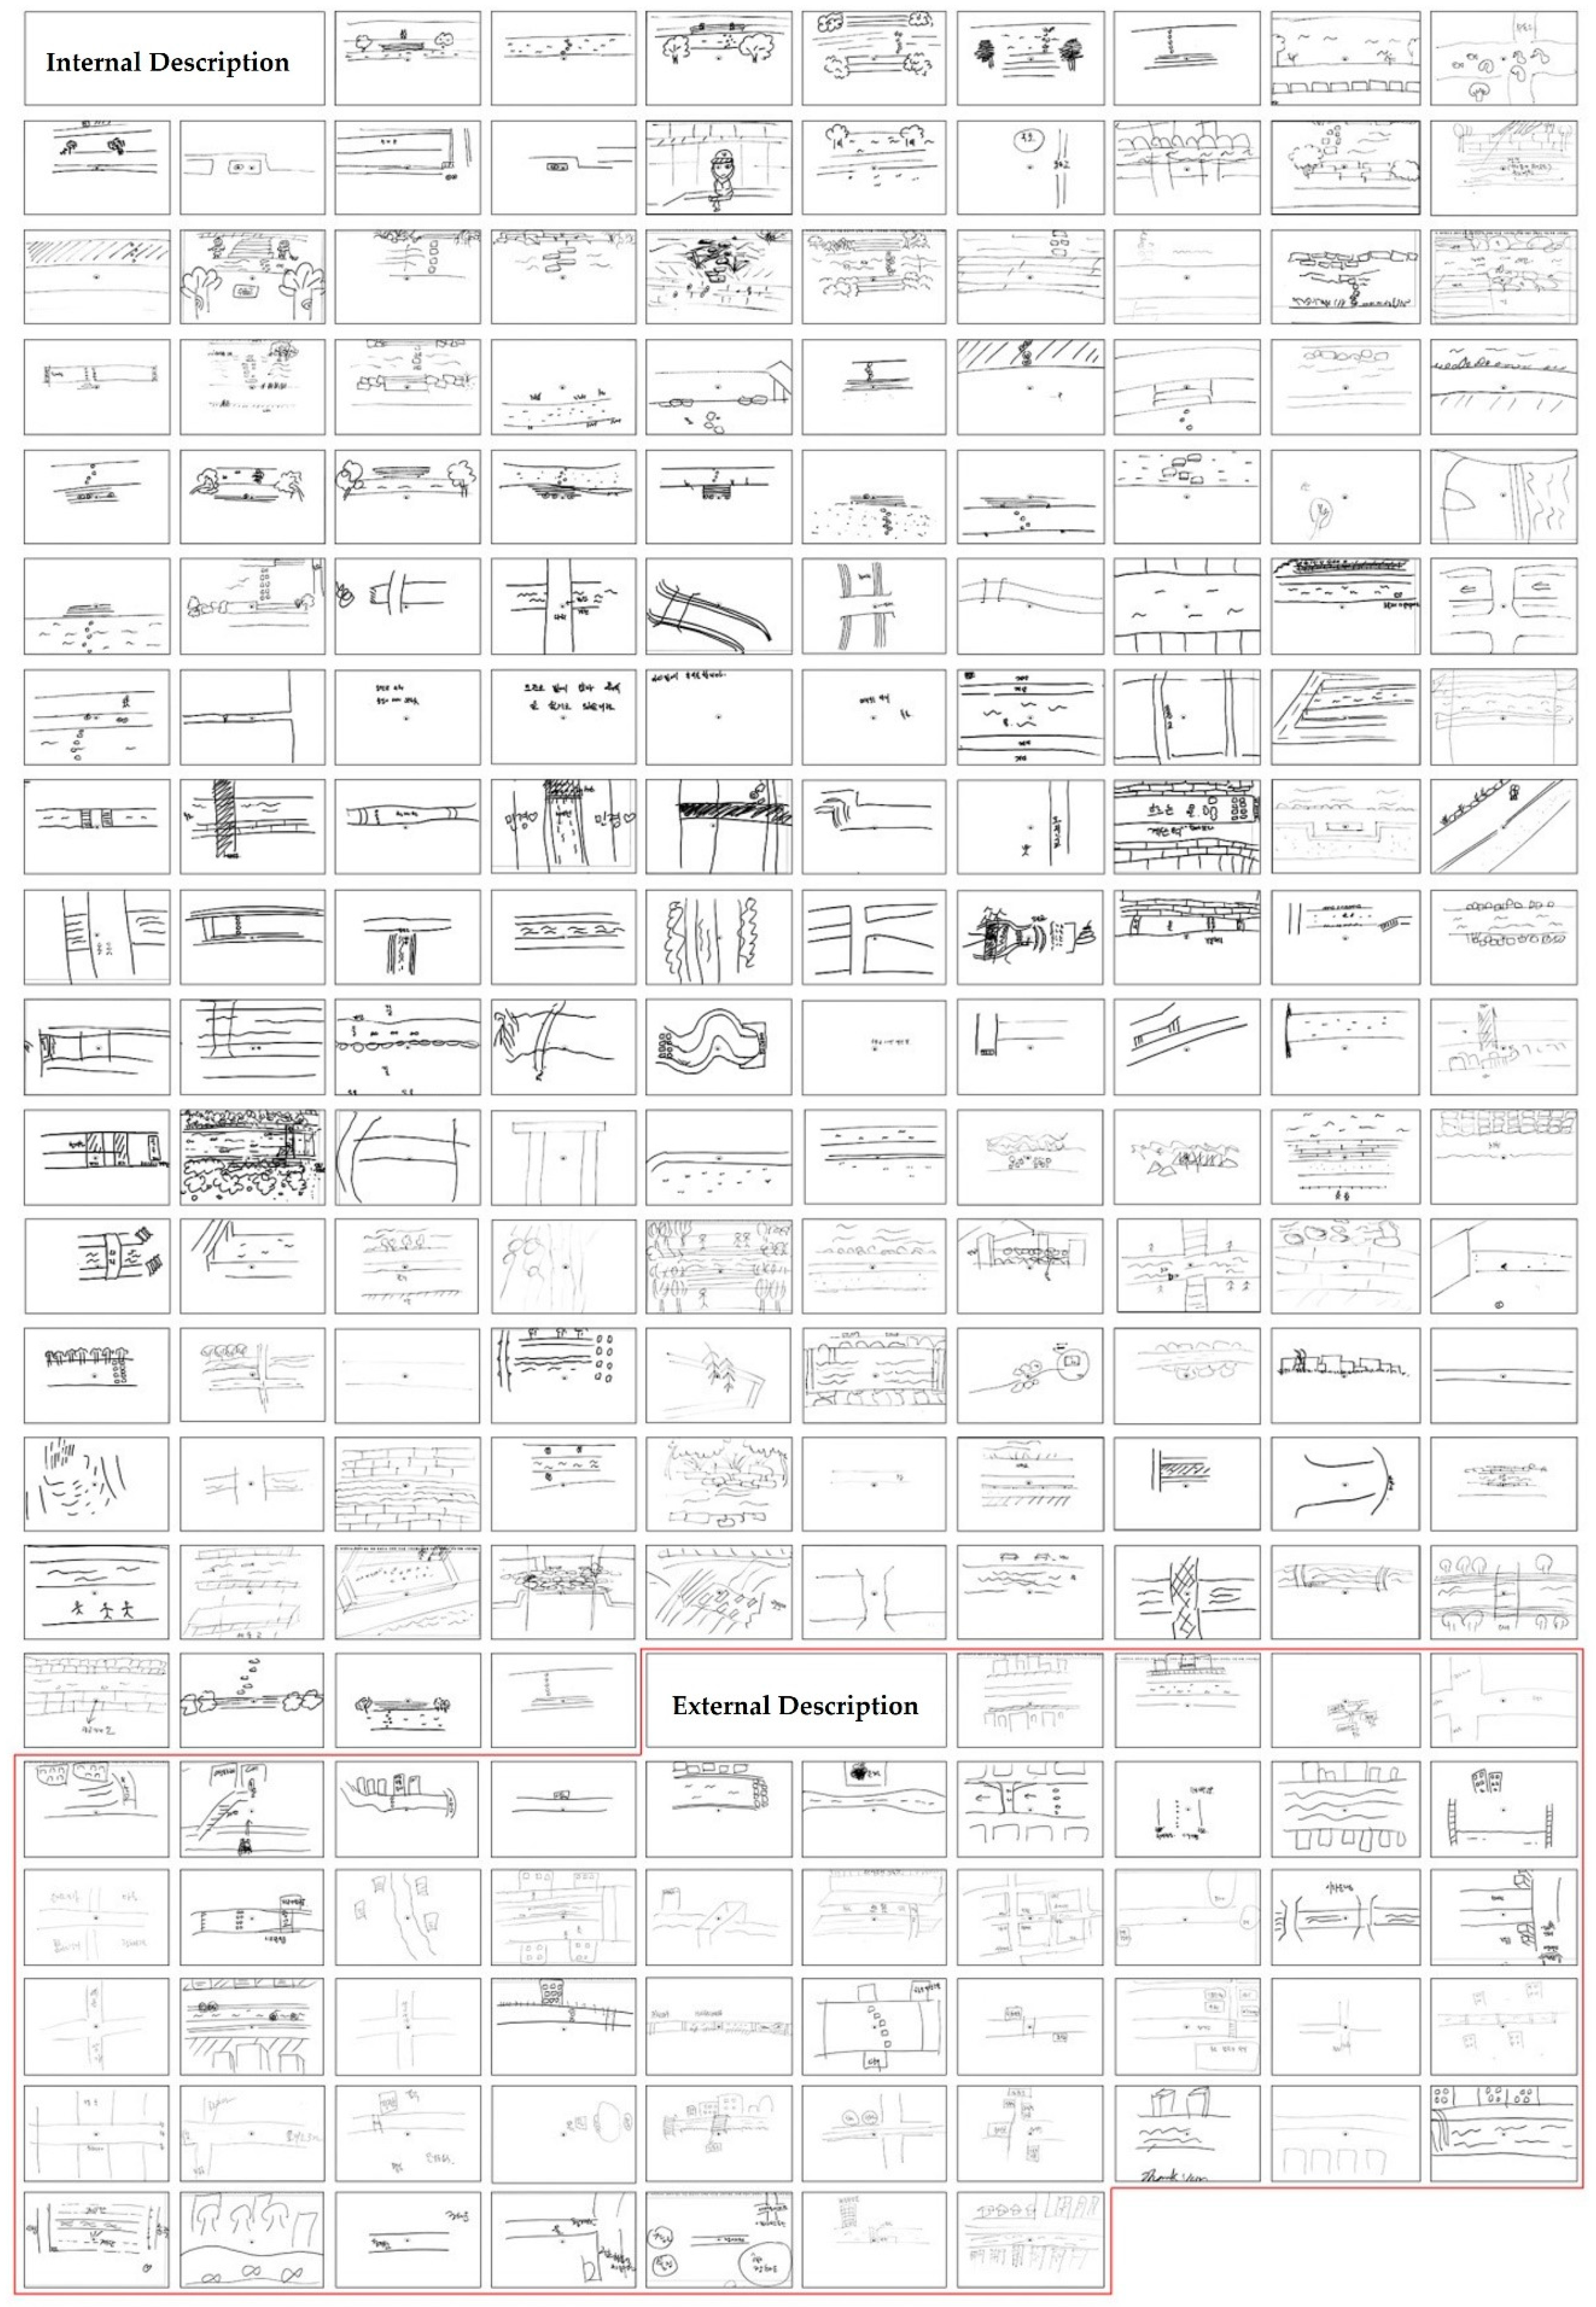
In their cognitive maps, respondents in the internal spatial perception group (the “internal group”; n = 153) illustrated only the internal area at Cheonggyecheon, showing water, greenery, and the enclosed place in their descriptive drawings. In their cognitive maps, the respondents in the external spatial perception group (the “external group”; n = 50) drew buildings and streets found in the external area of the research site (Figure 2). The differences between illustrations of the buildings and urban contexts beyond and those inside the 4-m sunken wall were crucial for distinguishing the different groups. Therefore, this is part of a qualitative content analysis according to structure, scale, and elements.

3. Results

3.1. Redefined Contents of the PRS

A Principal Axis Factor (PAF) with Varimax (orthogonal) rotation was conducted on 14 of the 16 Likert scale responses from the PRS. The sample was deemed factorable according to the Kaiser–Meyer–Olkin measure of sampling adequacy (KMO = 0.882). Three factors, with eigenvalues larger than 1, were extracted [39]. The estimated factor loadings are reported in Table 2, and the loadings higher than 0.05 are marked in gray. Eight items loaded on Factor 1. This factor was named “BA + COM (Being Away and Compatibility perceptions of one’s surrounding environment).” Four items loaded on a second factor related to participants’ reported perceptions of their surrounding environment. Two of the four questions in this factor were reverse scored to check and avoid insincere responses; hence, the coded data were reversed again to compare to the original meaning of Fascination. This factor was named “FA (perceived Fascination with one’s surrounding environment).” The two items loaded on Factor 3 related to Coherence concerning the respondents’ environment. The two questions were reverse scored; thus, the coded data were reversed again to compare to the original meaning of Coherence. This factor was named “CH (Coherent perception of one’s surrounding environment).” Similar PRS research subclasses follows these four factors [12,13,18] (Figure 3).

3.2. Two Different PRS Scores

An independent-samples t-test was conducted to compare the two spatial perception groups, and significant differences were found. Table 3 illustrates results of each t-test, which suggest spatial perception is positively associated with PRS (at the margin of statistical significance, p < 0.07), BA + COM (p < 0.05), and FA (<0.05) scores. However, Coherence (CH) perception was negatively associated with spatial perception (p < 0.01) (Table 3).

3.3. PRS with Social Context

3.3.1. Overall PRS

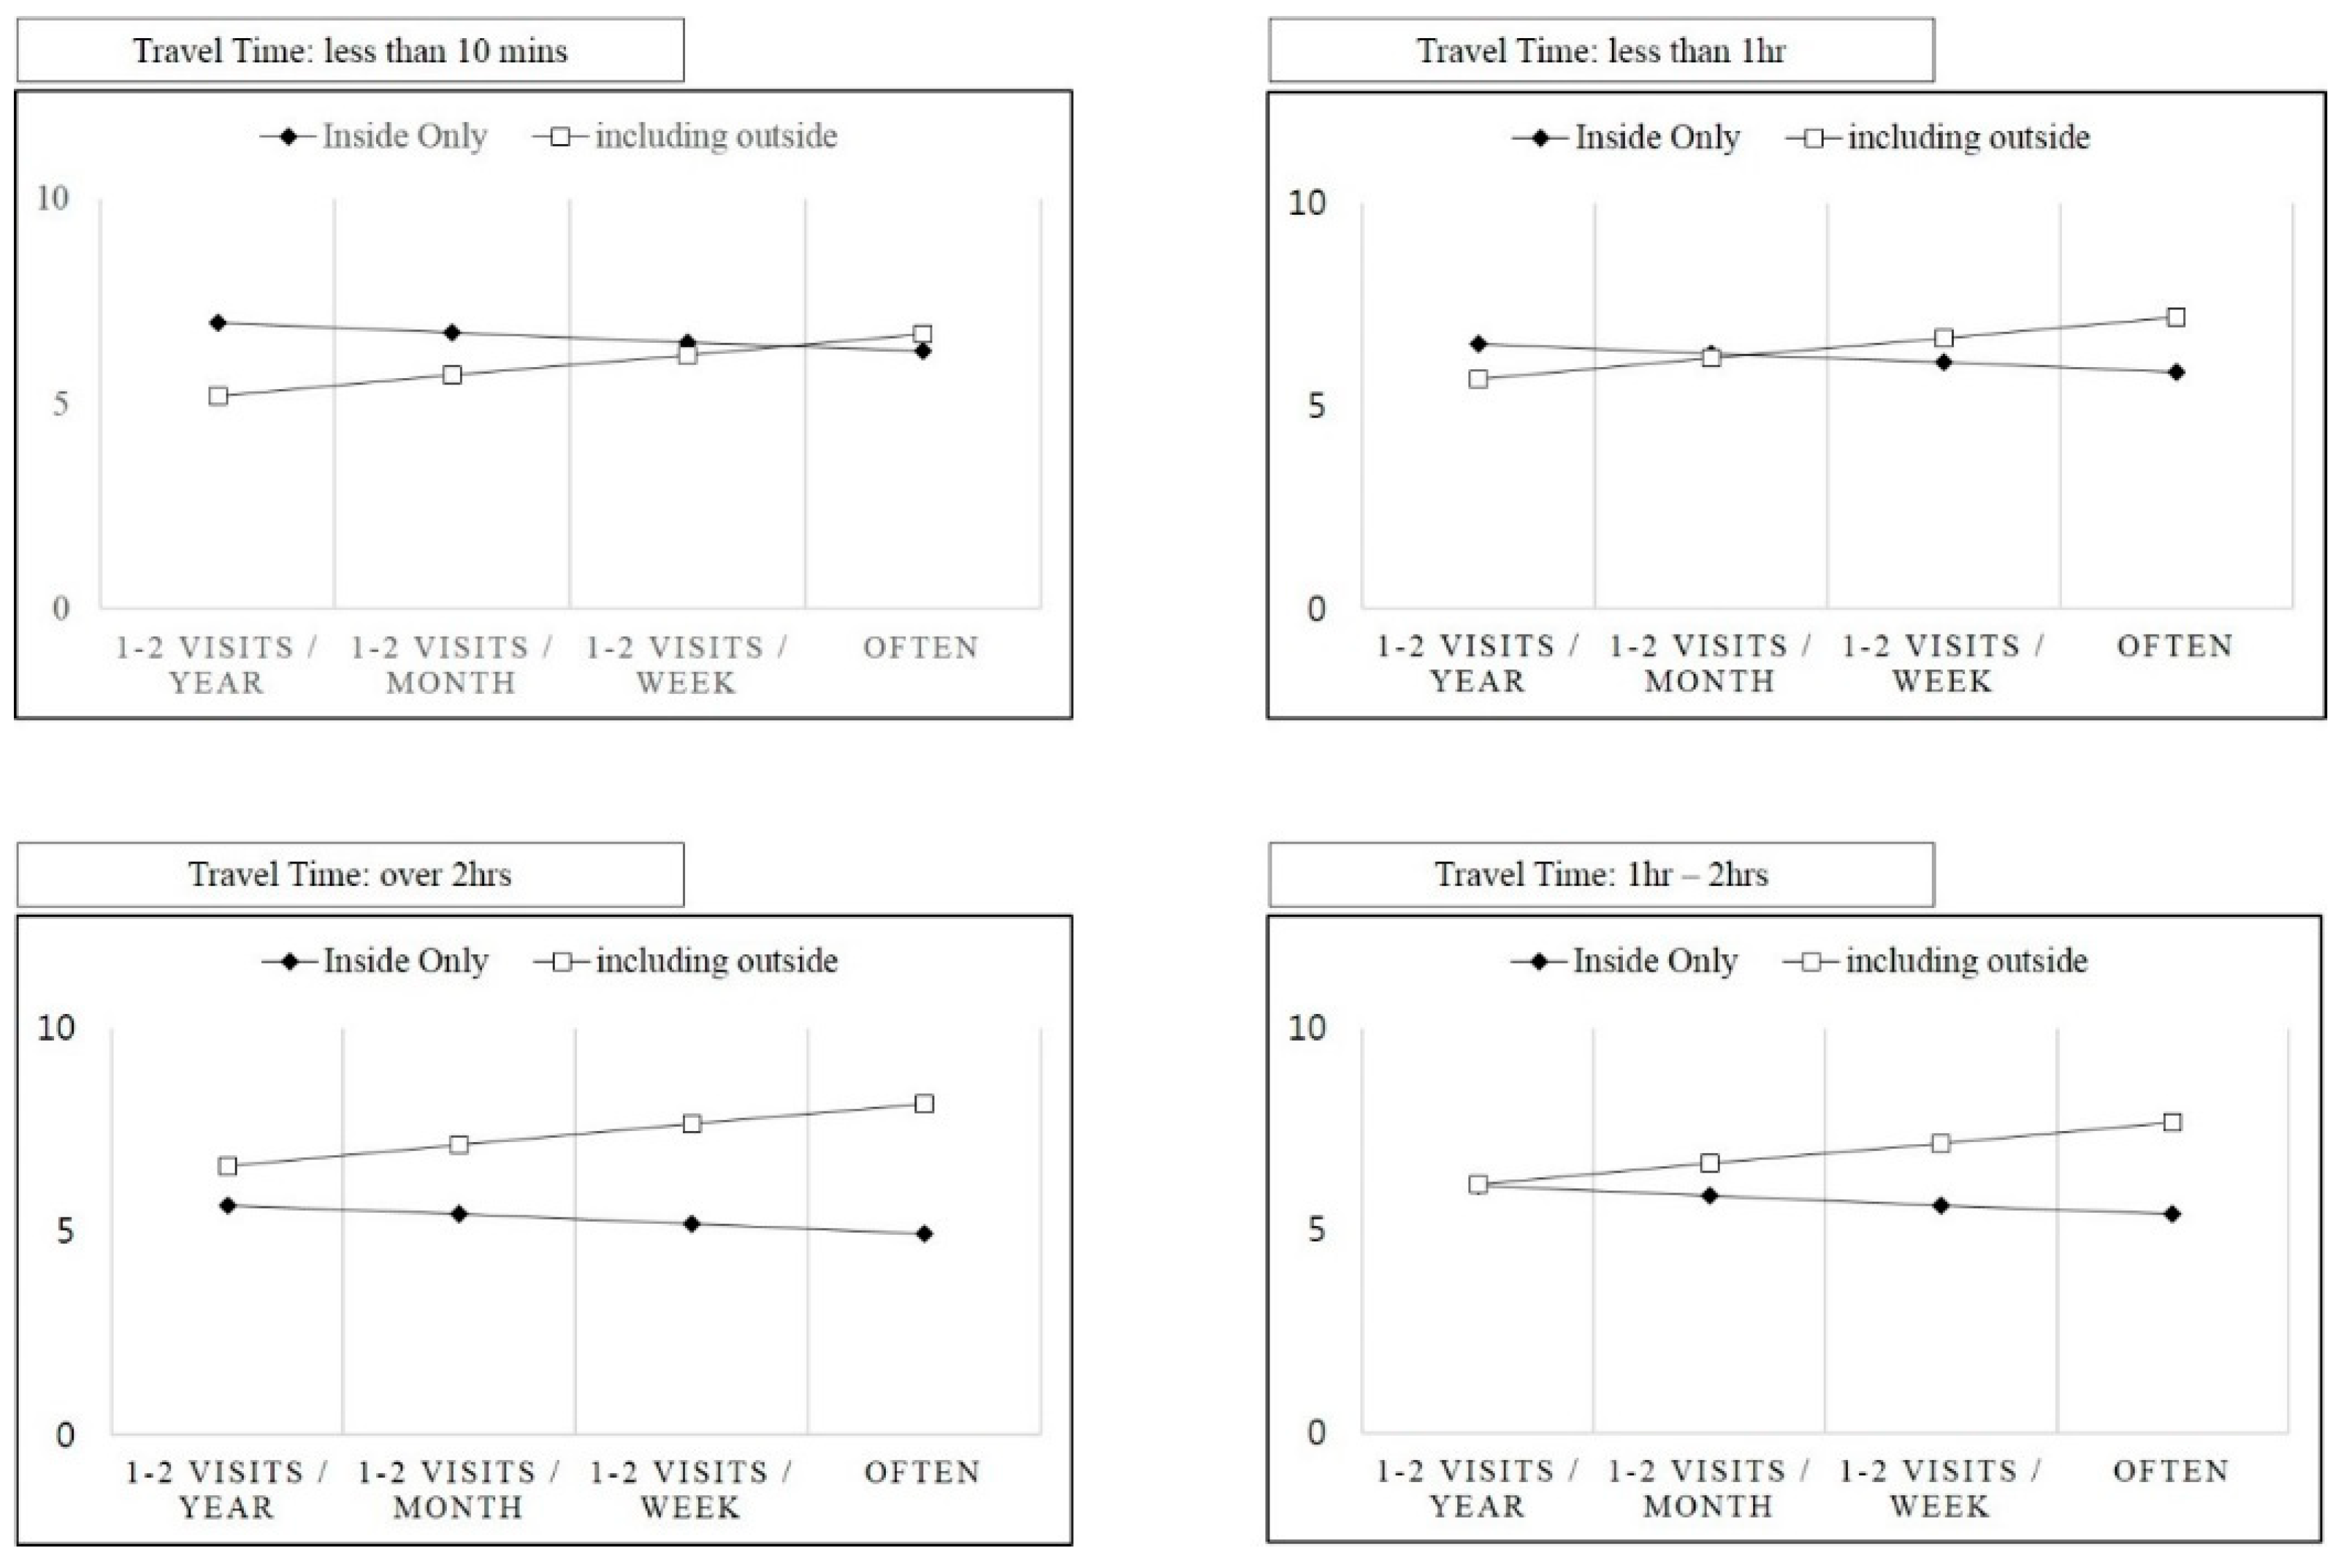
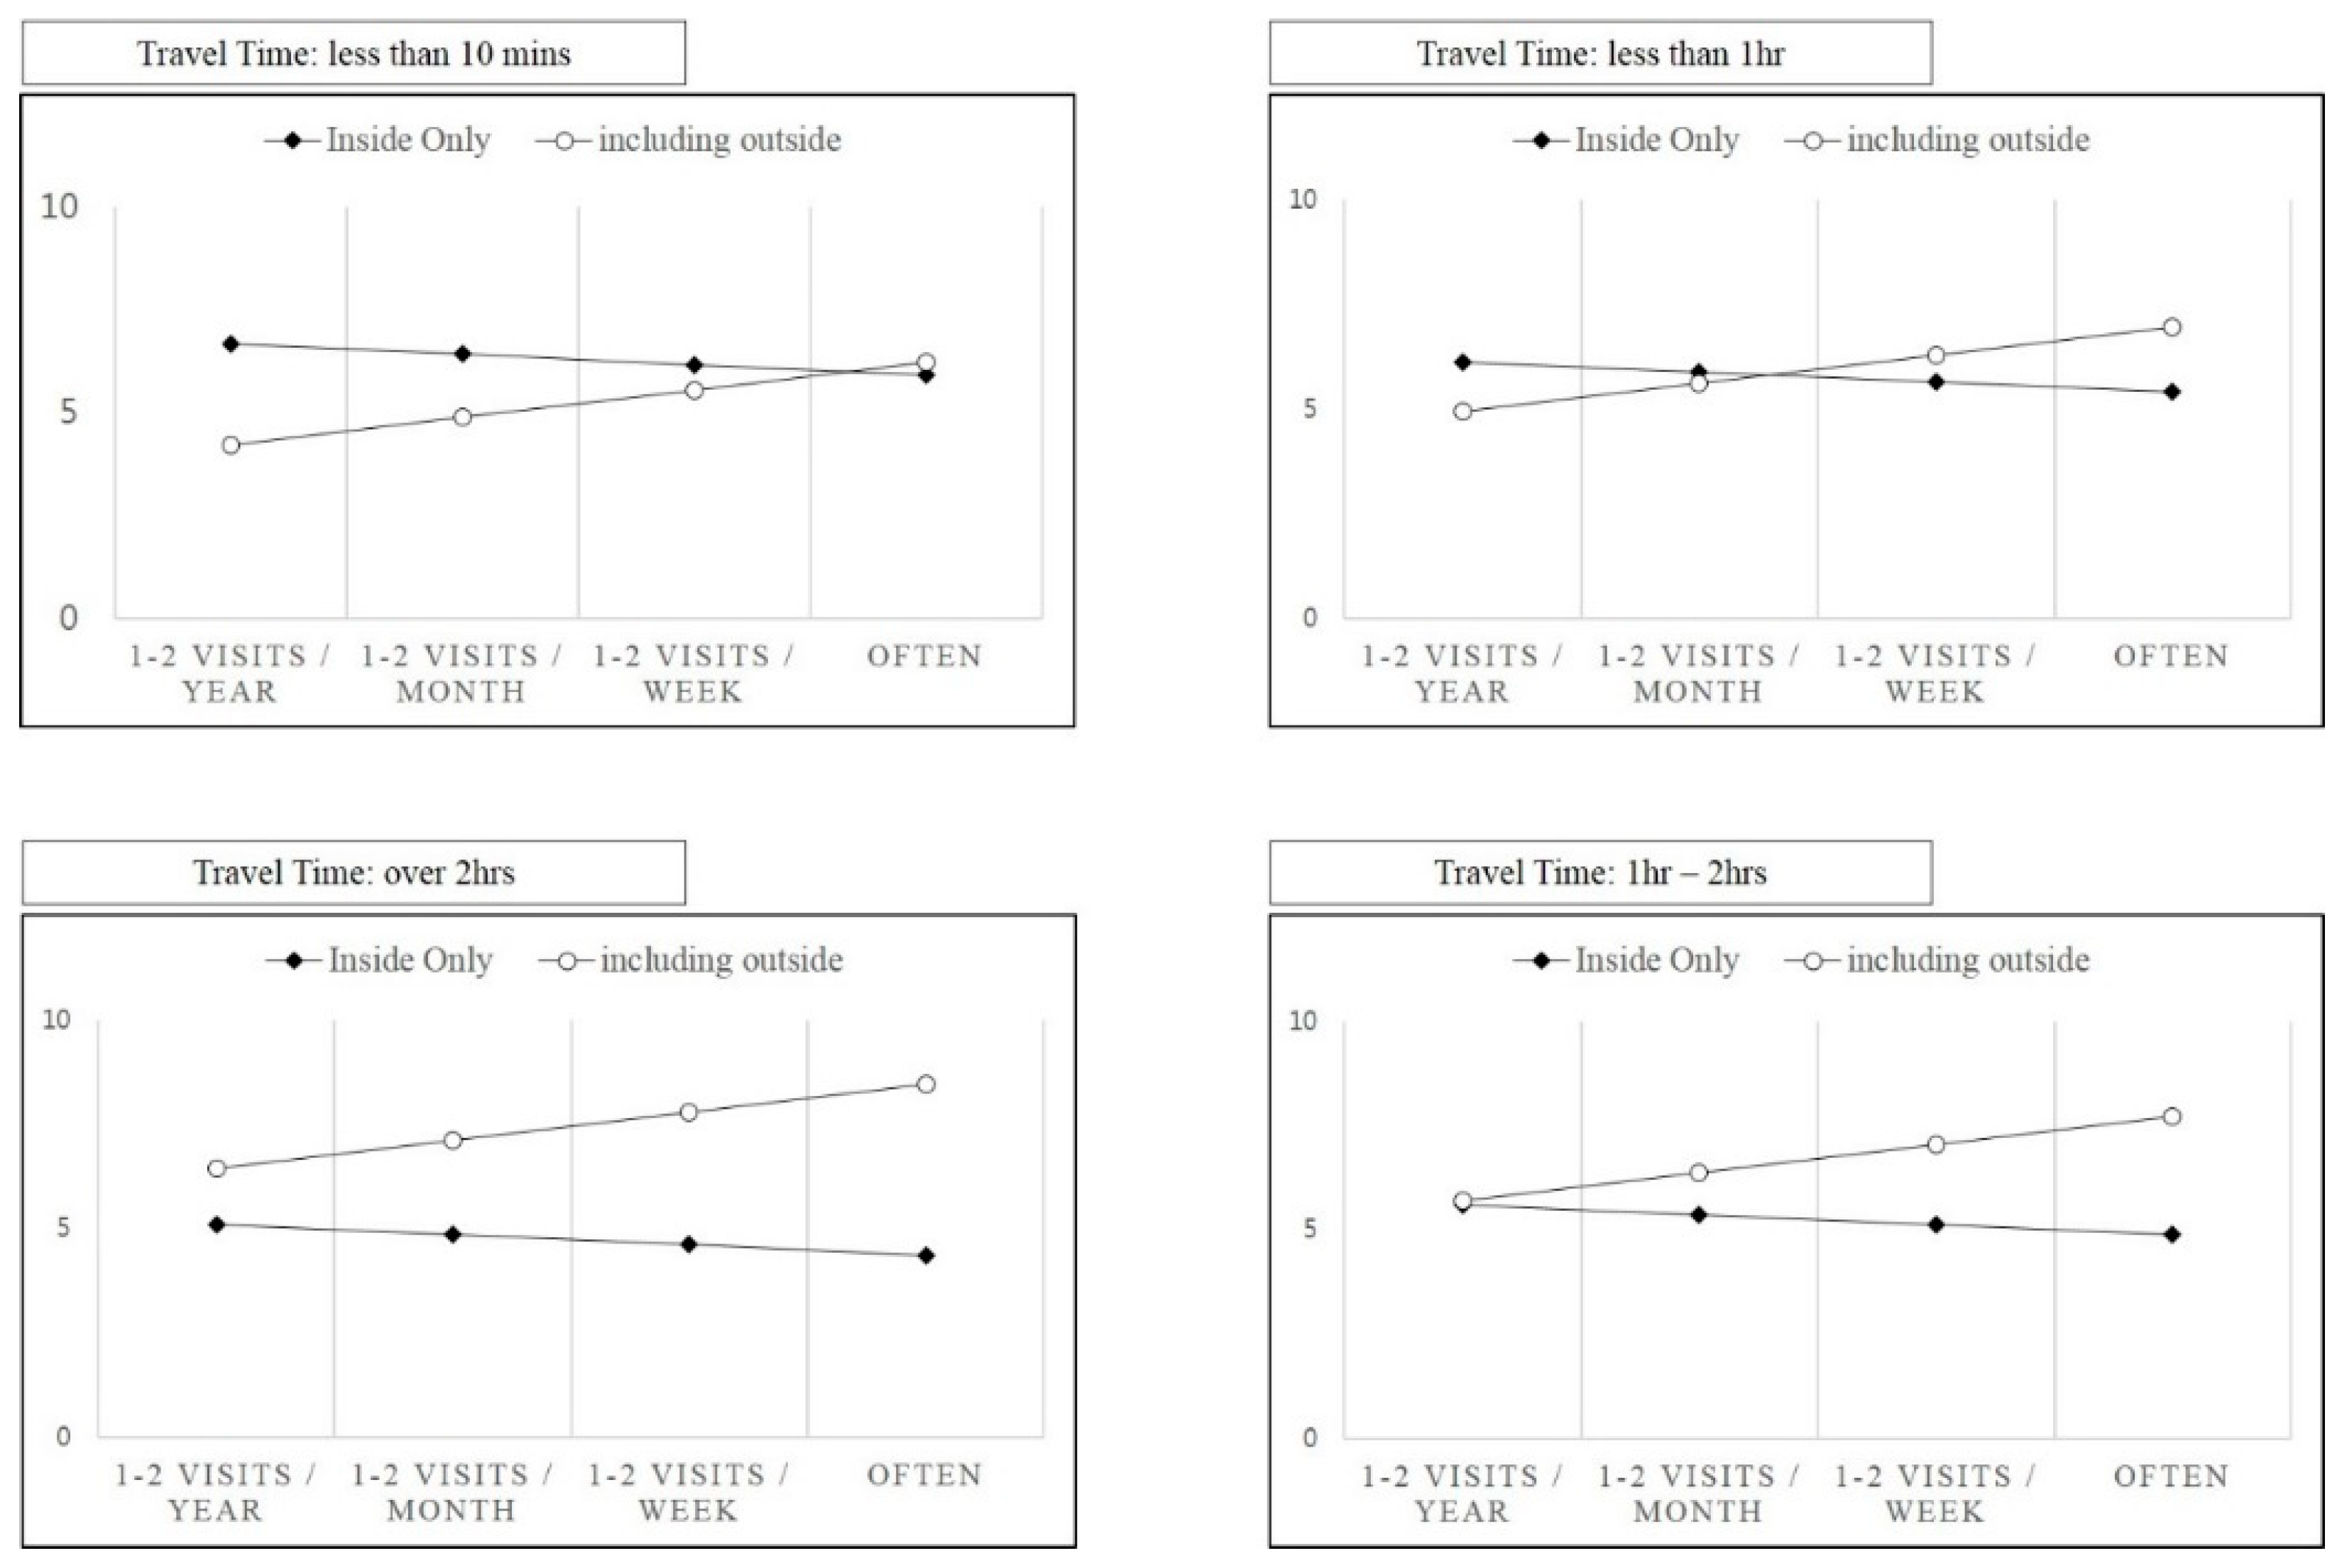
To assess the relationship between the social context and attention restoration rate, a multiple regression model was conducted with all five predictors: “internal group,” “visiting frequency,” “travel time,” “internal group × visiting frequency,” and “internal group × travel time” (R2 = 0.081, F (5, 197) = 3.474, p < 0.01). As Table 3 shows, the Analytic and Quantitative differences in spatial perception had significant positive regression weights, indicating that the internal group with higher scores on the scale was expected to have higher “Overall PRS scores” after controlling for other variables in the model. The scores of the internal group on the visiting frequency show a significant negative weight, indicating a lower “Overall PRS score” (a suppressor effect). The scores of the internal group on travel time to the destination also indicate a significant negative weight. However, visiting frequency and travel time both have significant positive weight, indicating a higher “Overall PRS score.” As this study had a “working” model to predict Overall PRS score, we decided to apply it to the next set of visitors. Hence, we used a raw score model to compute our predicted scores (Figure 4).
Overall PRS score = 4.209 + 3.451 × (internal group) + 0.505 × (visiting frequency) + 0.476 × (travel time) − 0.738 × (internal group × visiting frequency) − 0.922 × (internal group × travel time).

3.3.2. Being Away + Compatibility (BA + COM)

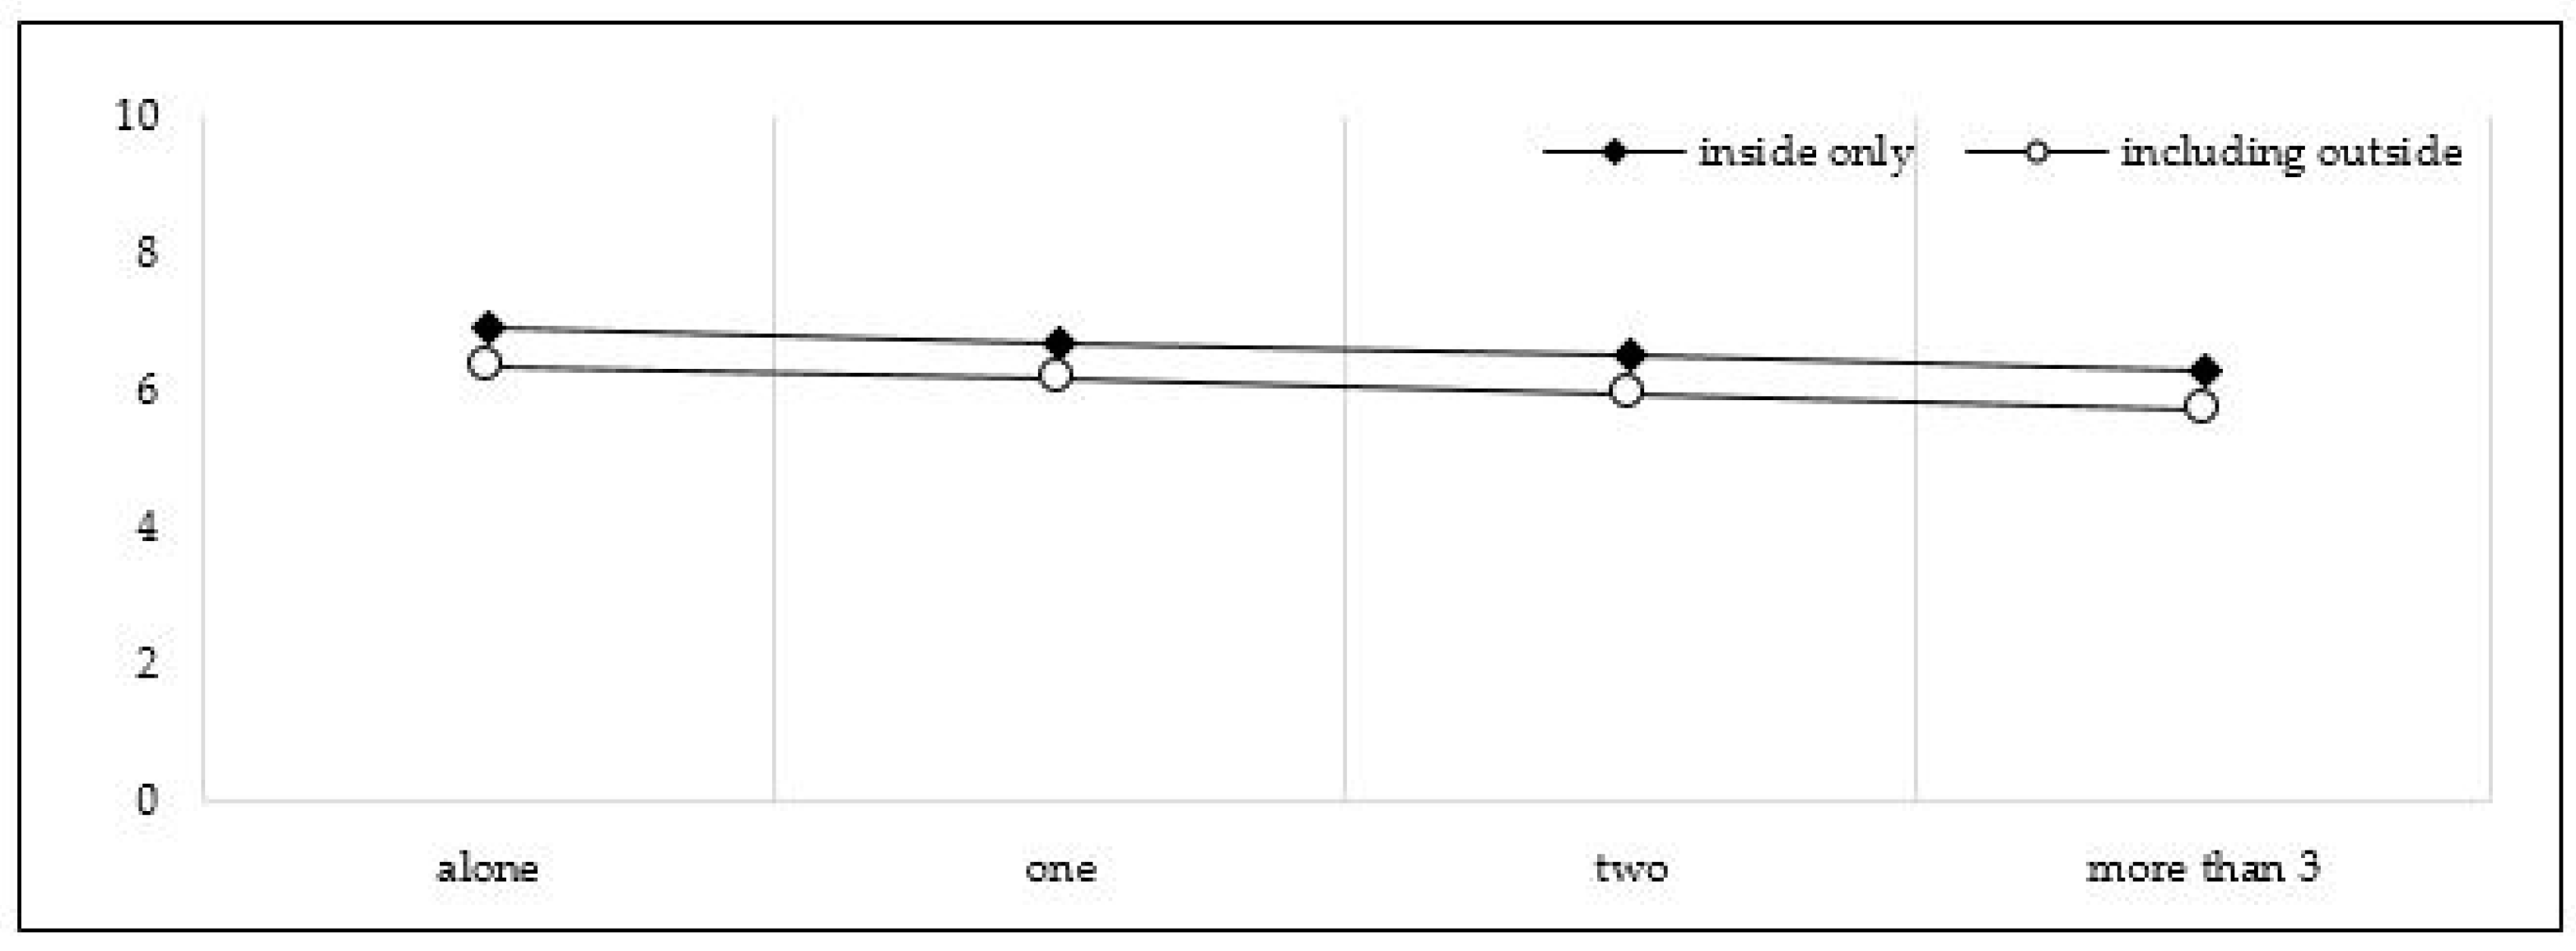
The multiple regression model was conducted with two predictors: “internal group,” “the number of companions” (R2 = 0.047, F (2, 200) = 4.897, p < 0.01). The Analytic and Quantitative differences in spatial perception had significant positive regression weights, indicating that the internal group with higher scores on the scale was expected to have higher “Being Away + Compatibility scores (BA + COM)” after controlling for other variables. The number of companions has a significant negative weight, indicating a lower “BA + COM” score (a suppressor effect). As this study had a “working” model to predict the “BA + COM” score, we decided to apply it to the next set of visitors. Hence, we used a raw score model to compute our predicted scores (Figure 5).
BA + COM = 6.372 +0.558 × (internal group) − 0.207 × (the number of companions).

3.3.3. Fascination

The multiple regression model was used with all five predictors: “internal group,” “visiting frequency,” “travel time,” “internal group × visiting frequency,” and “internal group × travel time” (R2 = .084, F (5, 197) = 3.620, p < 0.01). The Analytic and Quantitative difference in spatial perception had significant positive regression weights, indicating that the internal group with higher scores on the scale was expected to have higher “Fascination scores (FA)” after controlling for other variables. The visiting frequency scores of the internal group have a significant negative weight, indicating a low “Fascination (FA)” score (a suppressor effect). The internal group’s travel time scores also have a significant negative weight. However, visiting frequency and travel time have significant positive weight, indicating a higher FA score. As this study had a “working” model to predict the Fascination score, we decided to apply it to the next set of visitors. Thus, we used a raw score model to compute our predicted scores (Figure 6).
Fascination = 2.796 + 4.605 × (internal group) + 0.667 × (visiting frequency) + 0.749 × (travel time) − 0.907 × (internal group × visiting frequency) − 1.265 × (internal group × travel time).

4. Discussion and Conclusions

The two spatial perception groups illustrate statistically different PRS mean scores; the internal group experienced a greater restorative effect than did the external one. However, the Coherence subscale exhibited opposite results, similar to previous findings [42]. For this reason, the study excluded coherence scores in discussing restoration.
The internal group exhibited higher restoration scores on “Being Away + Compatibility,” “Fascination,” and “Overall PRS,” which supported the hypothesis. The internal group can thus be considered to be influenced by environmental restoration settings.
In addition to spatial perception, regression analysis was conducted to identify the influence of additional factors such as visit frequency and travel time. BA + COM scores were high in the internal group. Thus, restoration through the site was observed among respondents in this group. That is, people whose range of spatial perception had become narrow due to stress experienced a sense of Being Away and Compatibility, which is seen to be highly associated with the restoration of spatial perception. Second, there were group differences in the spatial perception of sites’ attractiveness, and these were affected by visit frequency and time spent on the site. The lower the visit frequency, the higher the scores of the internal group compared to the external group. However, the gap decreased according to the required travel time: longer travel times were associated with higher scores among the external group. Among infrequent visitors (only one or two visits per year) who reported having the shortest travel times, the internal group scored higher on perceived attractiveness. Conversely, in the case of frequent visitors, the external group scored higher on perceived attractiveness among respondents who reported having the longest travel times. Third, the overall PRS score shows a similar pattern to the perceived attractiveness outcomes. Greater familiarity with and time required to arrive at the site positively affected the external group and negatively affected the internal group.
From the results of this study, it is appropriate to conclude that familiarity with the site positively influenced restoration in the external group and negatively influenced it in the internal group. Additionally, the two groups also differed in terms of how travel time influenced their perceptions. However, when it takes a long time to get to the green space and visiting frequency is higher, its effectiveness is expected to be higher still. To sum up the overall outcomes, those who acquire narrowed spatial perception due to fatigue are expected to score higher in Being Away and Compatibility subscales and lower on the Fascination subscale and overall PRS as they gain familiarity with a site. This result shows several different points from previous research: individual attention restoration can be affected by social factors and perceived place size or scale.
The current study has some limitations, which may be improved through further research. First, as this study is based on theory and empirical outcomes, further research is required on the effects of the association between stress and cognitive mapping on spatial perception. Second, the inclusion of more spatial types may allow for a broader understanding of the outcomes and relationships.
Despite these limitations, this study provides a reference for urban planning of green spaces to support individuals in high-stress areas high-density Asian urban areas similar to this research site. The findings confirm that restoration is influenced by individual differences in the perceptual ranges of natural elements, the time required to travel to such places, and visiting frequency.

Supplementary Materials

The following are available online at https://www.mdpi.com/2071-1050/10/9/3139/s1. S1: the survey sheet for this research.

Funding

This research was funded by the Ministry of Education [grant number 2015042723] in South Korea.

Acknowledgments

This research was supported by the Basic Science Research Program through the National Research Foundation of Korea (NRF), funded by the Ministry of Education (2015042723) in South Korea.

Conflicts of Interest

The author declares no conflict of interest.

References

  1. Cohen, D.A.; McKenzie, T.L.; Sehgal, A.; Williamson, S.; Golinelli, D.; Lurie, N. Contribution of public parks to physical activity. Am. J. Public Health 2007, 97, 509–514. [Google Scholar] [CrossRef] [PubMed]
  2. Floyd, M.F.; Spengler, J.O.; Maddock, J.E.; Gobster, P.H.; Suau, L.J. Park-based physical activity in diverse communities of two US cities: An observational study. Am. J. Prev. Med. 2008, 34, 299–305. [Google Scholar] [CrossRef] [PubMed]
  3. Hartig, T. Three steps to understanding restorative environments as health resources. In Open Space: People Space; Thompson, C.W., Travlou, P., Eds.; Taylor & Francis: London, UK, 2007; pp. 163–179. [Google Scholar]
  4. Hill, K. Design and Planning as Healing Arts: The Broader Context of Health and Environment; Island Press: Washington, DC, USA, 2002; Volume 1, pp. 203–214. [Google Scholar]
  5. Kaplan, R. The role of nature in the urban context. In Behavior and the Natural Environment; Altman, I., Wohlwill, J.F., Eds.; Springer: New York, NY, USA, 1983; pp. 127–161. [Google Scholar]
  6. Shores, K.A.; West, S.T. Rural and urban park visits and park-based physical activity. Prev. Med. 2010, 50, S13–S17. [Google Scholar] [CrossRef] [PubMed]
  7. Grahn, P.; Stigsdotter, U.A. Landscape planning and stress. Urban For. Urban Green. 2003, 2, 1–18. [Google Scholar] [CrossRef]
  8. Kaplan, R.; Kaplan, S. The Experience of Nature: A Psychological Perspective; Cambridge University Press: Cambridge, UK, 1989. [Google Scholar]
  9. Kaplan, S. The restorative benefits of nature: Toward an integrative framework. J. Environ. Psychol. 1995, 15, 169–182. [Google Scholar] [CrossRef] [Green Version]
  10. Völker, S.; Kistemann, T. The impact of blue space on human health and well-being–Salutogenetic health effects of inland surface waters: A review. Int. J. Hyg. Environ. Health 2011, 214, 449–460. [Google Scholar] [CrossRef] [PubMed]
  11. Ulrich, R.S. Natural versus urban scenes some psychophysiological effects. Environ. Behav. 1981, 13, 523–556. [Google Scholar] [CrossRef]
  12. Hartig, T.; Böök, A.; Garvill, J.; Olsson, T.; Gärling, T. Environmental influences on psychological restoration. Scand. J. Psychol. 1996, 37, 378–393. [Google Scholar] [CrossRef] [PubMed]
  13. Hartig, T.; Kaiser, F.G.; Bowler, P.A. Further Development of a Measure of Perceived Environmental Restorativeness; Institutet för Bostadsforskning: Fagersta, Sweden, 1997. [Google Scholar]
  14. Purcell, T.; Peron, E.; Berto, R. Why do preferences differ between scene types? Environ. Behav. 2001, 33, 93–106. [Google Scholar] [CrossRef]
  15. Berto, R. Exposure to restorative environments helps restore attentional capacity. J. Environ. Psychol. 2005, 25, 249–259. [Google Scholar] [CrossRef]
  16. Chang, C.Y.; Hammitt, W.E.; Chen, P.K.; Machnik, L.; Su, W.C. Psychophysiological responses and restorative values of natural environments in Taiwan. Landsc. Urban Plan. 2008, 85, 79–84. [Google Scholar] [CrossRef]
  17. Ivarsson, C.T.; Hagerhall, C.M. The perceived restorativeness of gardens–Assessing the restorativeness of a mixed built and natural scene type. Urban For. Urban Green. 2008, 7, 107–118. [Google Scholar] [CrossRef]
  18. Korpela, K.M.; Hartig, T.; Kaiser, F.G.; Fuhrer, U. Restorative experience and self-regulation in favorite places. Environ. Behav. 2001, 33, 572–589. [Google Scholar] [CrossRef]
  19. Laumann, K.; Gärling, T.; Stormark, K.M. Rating scale measures of restorative components of environments. J. Environ. Psychol. 2001, 21, 31–44. [Google Scholar] [CrossRef]
  20. Ulrich, R.S.; Simons, R.F.; Losito, B.D.; Fiorito, E.; Miles, M.A.; Zelson, M. Stress recovery during exposure to natural and urban environments. J. Environ. Psychol. 1991, 11, 201–230. [Google Scholar] [CrossRef]
  21. Clements, T.L.; Dorminey, S.J. Spectrum matrix landscape design and landscape experience. Landsc. J. 2011, 30, 241–260. [Google Scholar] [CrossRef]
  22. Devlin, A.S.; Bernstein, J. Interactive way-finding: Map style and effectiveness. J. Environ. Psychol. 1997, 17, 99–110. [Google Scholar] [CrossRef]
  23. Ward, T.B.; Foley, C.M.; Cole, J. Classifying multidimensional stimuli: Stimulus, task, and observer factors. J. Exp. Psychol. 1986, 12, 211–225. [Google Scholar] [CrossRef]
  24. Staats, H.; Jahncke, H.; Herzog, T.R.; Hartig, T. Urban options for psychological restoration: Common strategies in everyday situations. PLoS ONE 2016, 11, e0146213. [Google Scholar] [CrossRef] [PubMed]
  25. Kim, M.; Gim, T.H.T.; Sung, J.S. Applying the Concept of Perceived Restoration to the Case of Cheonggyecheon Stream Park in Seoul, Korea. Sustainability 2017, 9, 1368. [Google Scholar] [CrossRef]
  26. Herzog, T.R.; Rector, A.E. Perceived danger and judged likelihood of restoration. Environ. Behav. 2009, 41, 387–401. [Google Scholar] [CrossRef]
  27. Staats, H.; Hartig, T. Alone or with a friend: A social context for psychological restoration and environmental preferences. J. Environ. Psychol. 2004, 24, 199–211. [Google Scholar] [CrossRef]
  28. Cutt, H.; Giles-Corti, B.; Knuiman, M.; Burke, V. Dog ownership, health and physical activity: A critical review of the literature. Health Place 2007, 13, 261–272. [Google Scholar] [CrossRef] [PubMed]
  29. Von Lindern, E.; Bauer, N.; Frick, J.; Hunziker, M.; Hartig, T. Occupational engagement as a constraint on restoration during leisure time in forest settings. Landsc. Urban Plan. 2013, 118, 90–97. [Google Scholar] [CrossRef]
  30. Dirkin, G.R.; Hancock, P.A. Attentional narrowing to the visual periphery under temporal and acoustic stress. Aviat. Space Environ. Med. 1984, 55, 457. [Google Scholar]
  31. Hancock, P.A.; Szalma, J.L.; Weaver, J.L. The distortion of perceptual space-time under stress. In DoD Multidisciplinary Research Program: MURI Operator Performance Under Stress (OPUS), White Paper; Stanford Medicine: Stanford, CA, USA, 2002. [Google Scholar]
  32. Koelmel, E. The Interaction between the Physical Environment and Metaphysical States: The Role of Social Anxiety and Stress in Informing Spatial Perception; The College of Wooster Libraries: Wooster, OH, USA, 2013; Available online: http://openworks.wooster.edu/cgi/viewcontent.cgi?article=6439&context=independentstudy (accessed on 5 May 2018).
  33. Paul, M.; Lech, R.K.; Scheil, J.; Dierolf, A.M.; Suchan, B.; Wolf, O.T. Acute stress influences the discrimination of complex scenes and complex faces in young healthy men. Psychoneuroendocrinology 2016, 66, 125–129. [Google Scholar] [CrossRef] [PubMed]
  34. Downs, R.M.; Stea, D. Image and Environment: Cognitive Mapping and Spatial Behavior; Aldine Transaction Publishers: Moncton, NB, Canada, 1973. [Google Scholar]
  35. Han, S.G.; Huh, J.H. Estimate of the heat island and building cooling load changes due to the restored stream in Seoul, Korea. Int. J. Urban Sci. 2008, 12, 129–145. [Google Scholar] [CrossRef]
  36. Hester, R.T. Design for Ecological Democracy; MIT Press: Cambridge, MA, USA, 2006. [Google Scholar]
  37. Zweifela, C.; Van Wezemaela, J. Drawing as a qualitative research tool an approach to field work from a social complexity perspective. Tracey J. Draw. Knowl. 2012, 5, 1–16. [Google Scholar]
  38. Lynch, K. Good city form. In Sensuous Criteria for Highway Design; MIT Press: Cambridge, MA, USA, 1994. [Google Scholar]
  39. Sacks, H. Lectures on Conversation; Jefferson, G., Schegloff, E.A., Eds.; Wiley-Blackwell: Hoboken, NJ, USA, 1992; Volume 2. [Google Scholar]
  40. Korpela, K.; Hartig, T. Restorative qualities of favorite places. J. Environ. Psychol. 1996, 16, 221–233. [Google Scholar] [CrossRef]
  41. Lee, S.H.; Hyun, M.H. The comparison of natural environment and restorative environment in stress-buffering effects. Korean J. Health Psychol. 2004, 9, 609–632. [Google Scholar]
  42. Hipp, J.A.; Gulwadi, G.B.; Alves, S.; Sequeira, S. The relationship between perceived greenness and perceived restorativeness of university campuses and student-reported quality of life. Environ. Behav. 2016, 48, 1292–1308. [Google Scholar] [CrossRef]
Figure 1. Cheonggyecheon section diagram and a site photograph; the internal area is composed of green space (trees, shrubs, stream, and natural rocks) and the external area is gray (such as buildings and roads).
Sustainability 10 03139 g001
Figure 2. Cognitive maps of the two groups (internal description shows the inside of site ‘Cheonggyecheon’ containing water, trees, and so on; external description have buildings, adjacent roads showing urban scale).
Sustainability 10 03139 g002
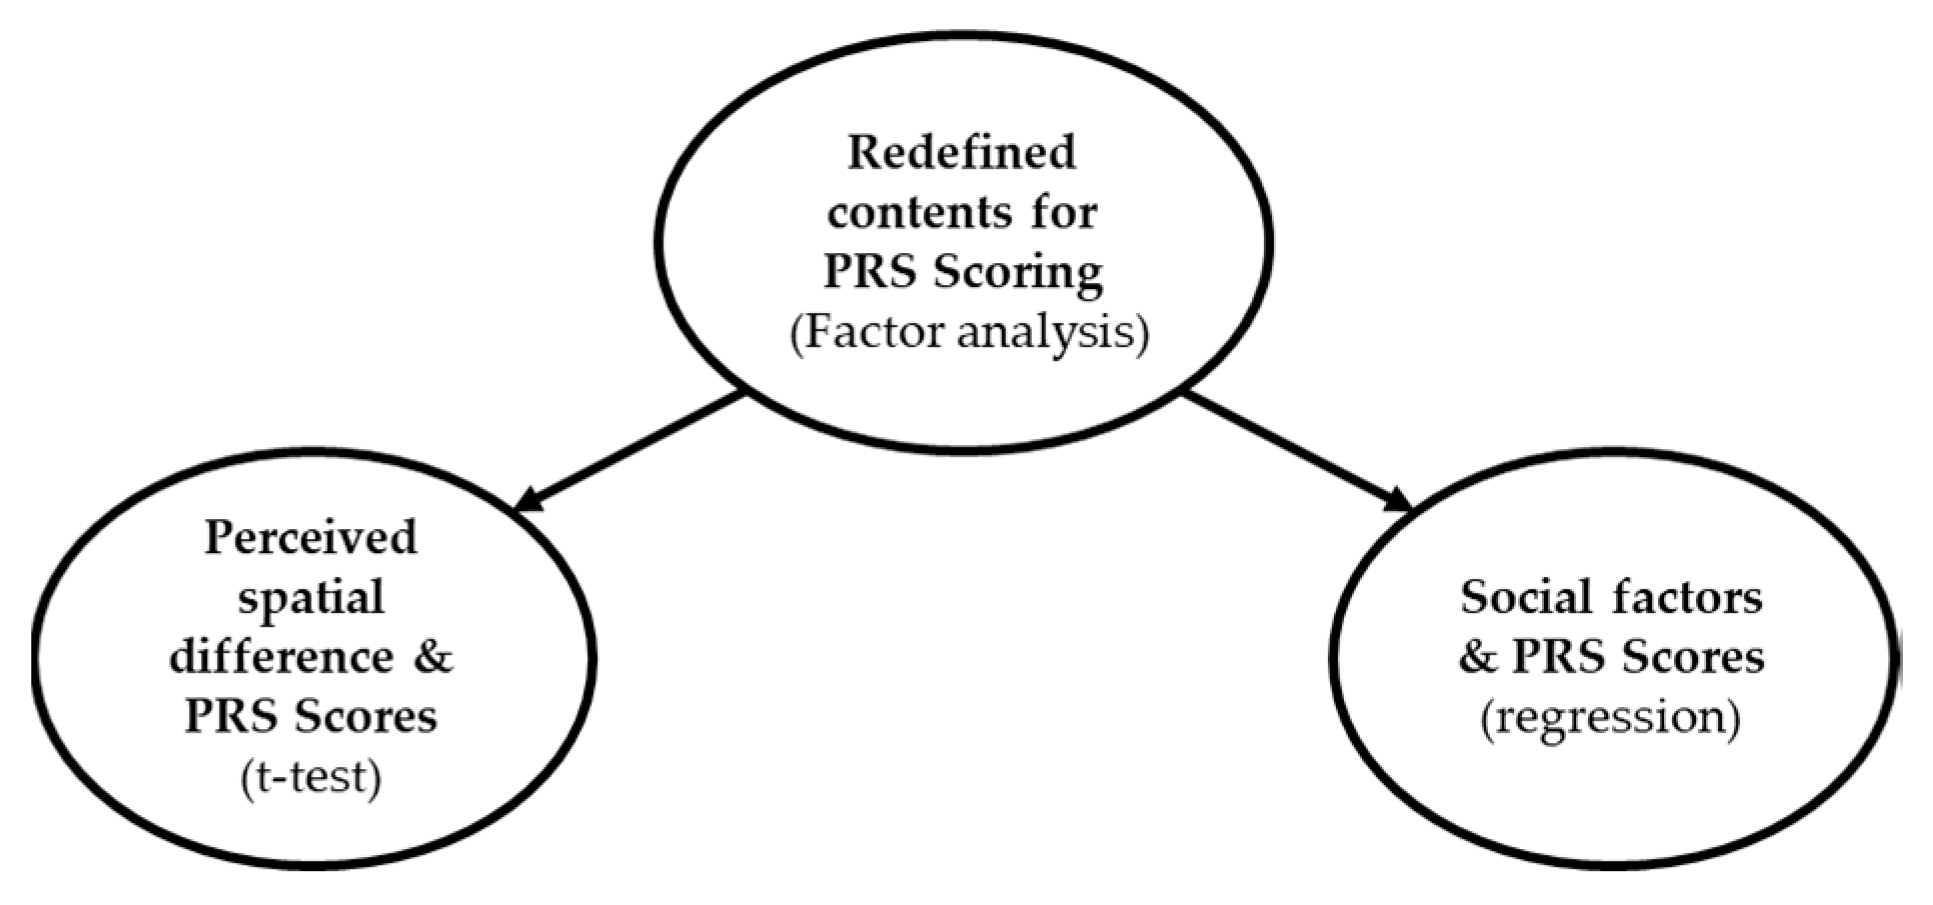
Figure 3. Flow diagram for analysis steps.
Sustainability 10 03139 g003
Figure 4. Summary statistics, regression analysis results (overall PRS).
Sustainability 10 03139 g004
Figure 5. Summary statistics, regression analysis results (BA + COM).
Sustainability 10 03139 g005
Figure 6. Summary statistics, regression analysis results (FA).
Sustainability 10 03139 g006
Table 1. Participants’ characteristics (N = 203).
ContentsNumber%X2 (p)
GenderMale9345.80.001 (0.976)
Female11054.2
Age (years)11–202411.81.552 (0.907)
21–309144.8
31–404723.2
41–502311.3
51–60136.4
60+52.5
Number of companions0157.42.811 (0.422)
110350.7
24019.7
3+4522.2
Frequency of visitsonce a year11355.92.333 (0.506)
once a month6029.7
once a week178.4
twice a week or more125.9
Travel time<10 min3316.34.154 (0.245)
10 min–1 h13265.0
1–2 h3014.8
over 2 h83.9
Table 2. Obliquely rotated component loadings for 14 survey items (two of 16 items are eliminated according to the factor analysis. The reverse items are referenced with the literature.).
PRS SubclassQuestionnairesIIIIII
Being AwayIt is an escape experience.0.738
Spending time here gives me a good break from my day-to-day routine.0.726
FascinationThe setting has fascinating qualities.0.662
My attention is drawn to many interesting things. 0.687
I would like to get to know this place better. 0.588
There is nothing worth looking at here (Reverse). 0.781
This place is boring (Reverse). 0.680
CoherenceThere is a great deal of distraction (Reverse). 0.741
It is chaotic here (Reverse) 0.775
CompatibilityBeing here suits my personality.0.774
There is accordance between what I like to do and these surroundings.0.760
I have a sense that I belong here.0.738
I can do things I like here.0.683
I have a sense of oneness with this setting.0.716
Eigenvalues 6.8112.1131.144
Percentage of total variance 42.57013.2077.147
Number of test measures 842
Table 3. Summary of the t-test results (* p < 0.07, ** p < 0.05, *** p < 0.01).
Internal Spatial Perception Group N = 153 Mean (Standard Deviation)External Spatial Perception Group N = 50 Mean (Standard Error)t-Test
Overall6.34 (1.243)5.93 (1.324)1.94 *
BA + COM6.62 (1.381)6.01 (1.502)2.53 **
FA6.02 (1.820)5.40 (1.648)2.24 **
CH5.88 (1.617)6.65 (1.782)−2.70 ***