1. Introduction
Climate change, characterized by global warming, is one of the greatest threats to the realization of global sustainable development. As such, carbon, which plays a significant role in global warming, is drawn the attention of both researchers and governments. The global response to the threat of global warming includes the United Nations Framework Convention on Climate Change, which aims to control greenhouse gas emissions (e.g., carbon dioxide), and the Paris Agreement, adopted at the United Nations Climate Conference in 2015. The objective of these initiatives is the coordinated development of the economy, the environment, and society. According to the Global Carbon Budget Report, China accounts for 28% of the world’s carbon emissions. As a country with dual identities as a “carbon emitter” and a developing country, China has taken the initiative to mitigate climate change based on common, but differentiated principles. On 19 December 2017, the National Development and Reform Commission announced the official launch of the national carbon emissions trading system, which aims to reduce the carbon intensity by 60–65% by 2030, compared with 2005 levels. Therefore, we examine whether the carbon trading policy based on a market mechanism can aid in the economic and social development of China in order to integrate the economy, the environment, and society. The manufacturing industry is the foundation of China’s national economy, but at the same time, consumes a significant amount of energy and has high levels of carbon emissions. The industry’s low efficiency in terms of the use of resources and energy means environmental pollution is a serious problem. With the development of the “Made in China 2025” strategy, China’s manufacturing industry requires innovation, intelligent manufacturing, a strong industrial base, and green development. The carbon emissions trading rights policy can help to develop the manufacturing industry in China, while reducing manufacturing carbon emissions, improving the efficiency of enterprise production, and transforming the use of energy within the manufacturing sector.
Before implementing the carbon emissions trading rights policy fully, China conducted carbon trading pilot projects in eight major industries in Beijing, Tianjin, Shanghai, Chongqing, Hubei, Guangdong, and Shenzhen from 2013 to 2015, including the petroleum, chemical, building materials, iron and steel, non-ferrous metals, and paper industries. This provides us with an objective natural experiment to test carbon trading policies. In the domestic literature, only Fan Dan et al. [
1] have analyzed the effect of a carbon emissions trading rights policy at the industry level using an empirical analysis and a difference-in-differences model. But in the global campaign to cope with climate change, “carbon emissions trading” is not a new word. The European Union Emission Trading Scheme (EU ETS) is the first multinational emissions trading system in the world [
2]. It is also the world’s largest total carbon emissions control and trading system. A lot of contributions have been made. Sun Rui et al. [
3] obtain the best carbon price by constructing a social accounting matrix (SAM). Fu Jingyan et al. [
4] use the zero-sum DEA model and consider regional demographic and economic differences. Oestreich et al. [
5] based on the empirical research on the effect of European Union emissions trading system on German stock returns. It is concluded that the enterprises that get free carbon emission quotas have better returns than those without carbon emission quotas. Bebbington [
6] studies the accounting impact of the carbon trading market. Based on a comparative analysis of a carbon tax and carbon trading rights, Murray et al. [
7] conclude that carbon trading rights have the advantage of a relatively stable long-term price. While this work is motivated by past research, most of these previous studies discuss the feasibility and influence of the carbon emissions trading rights mechanism from a theoretical perspective at the macro level. Few studies examine the impact of the policy at the micro-enterprise level. In addition, the introduction of the pilot policy inevitably affects the behavior of manufacturing enterprises with high levels of carbon production, leading directly to the implementation of innovation activities and emission reduction measures. However, few studies have examined the impact of the carbon trading policy on the behavior of firms within the manufacturing industry. Therefore, we focus on Chinese manufacturing enterprises.
Based on the dual-differential model, and from the perspective of corporate behavior, carbon emissions trading rights as an environmental policy can help to transform the Chinese manufacturing industry. The purpose of this paper is to test whether the pilot policy on carbon trading rights can adapt to and serve the development of manufacturing in the stage of its transformation and upgrading. Furthermore, we investigate the impact of carbon emission trading rights on manufacturing enterprises of different sizes and with different property rights. Lastly, based on the findings of the empirical analysis, we propose several policy suggestions to enrich the current literature and to improve the economic and social development of environmental policies.
2. Theoretical Analysis and Research Hypothesis
2.1. Theoretical Analysis
According to the carbon trading rights policy, the government issues carbon quotas to companies, capping their carbon emissions [
8,
9]. Then, companies can sell surplus quotas and purchase additional quotas when needed so that unregulated carbon rights are allocated artificially. As a means of environmental regulation, the policy aims to achieve an efficient allocation [
10,
11] through market trading, promote sustainable economic and social development, and fulfill the international commitments made by China to manage climate change. This study examines whether carbon emissions trading rights can help to transform the manufacturing industry, thus, improving the productivity of manufacturing enterprises. Past studies have tended to make two errors when measuring the index of transformation. The first is using the ratio of R&D input to GDP to measure the performance of transformation, ignoring the actual effect of inputs and outputs [
12,
13]. The second is using the proportion of emerging strategic industries as the index of transformation, which neglects older industries that are still pillars of China’s economic development [
14,
15,
16]. Emerging industries are not sufficiently competitive and provide products with low added value. Therefore, Liu and Chen propose measuring economic transformation using “improving productivity” as the policy standard and goal, and putting this into practice at the enterprise level. The task of transformation and upgrading is to use innovation to hedge against rising overall factor prices [
17]. Only by relying on technological progress, improving the quality of workers, and raising the level of management can enterprises realize the necessary transformation [
17,
18]. Therefore, the productivity of enterprises is a more comprehensive measure of the transformation of manufacturing enterprises [
19,
20,
21]. Based on the literature on the impact of environmental regulation on productivity, this study investigates three main points of view.
First, we examine the Porter hypothesis. Driven by the maximization of benefits, reasonable and strict environmental regulations can encourage enterprises to carry out technological innovation in order to improve their productivity and competitiveness. At the same time, the benefits of innovation activities can compensate for the pressure on cost and production resulting from the environmental regulations. Research on realizing environmental and economic dividends, energy savings and emission reductions, and economic development has proved the above viewpoint [
22,
23].
Second, we investigate support for the “follow the cost theory”. The costs of human, financial, and technical resources resulting from environmental regulations will hinder the improvement of enterprise productivity, have a negative impact on the efficiency of enterprise resource utilization, and be unfavorable to the improvement of enterprise competitiveness [
24]. Enterprises that cannot withstand the pressure of environmental protection may even transfer polluting enterprises to countries with less stringent environmental regulations (i.e., the “pollution shelter hypothesis”), which has been investigated extensively in the literature [
25]. The high cost of avoiding environmental regulations can lead to carbon leakage [
26,
27], which renders a country’s efforts to control carbon emissions and mitigate climate change meaningless and can cause international disputes.
Third, we investigate the theory of uncertainty. According to this view, the relationship between environmental regulation and enterprise productivity is uncertain, positive or negative, or not significant, depending on industry and regional differences and on the internal and external environments of enterprises. For example, Shen found that environmental regulations and technological innovation have a U-type relationship [
28]; that is, when the intensity of environmental regulations exceeds a certain threshold, they can promote technological innovation.
Findings in the literature on the nature of the relationship between environmental regulation and productivity are inconclusive, possibly resulting from different research methods, data, and definitions of variables. If variables cannot explain environmental regulations accurately and comprehensively, measurement errors will inevitably occur, leading to incorrect results. As a means of environmental regulation, the carbon emissions trading rights policy offers a natural experiment. Compared with using measured or calculated environmental regulation variables, the carbon trading policy can effectively avoid such measurement errors and make the results more robust [
29,
30]. In addition, the advantage of using a double-differential model to study the impact of carbon trading rights on the productivity of manufacturing enterprises is that it enables us to control for non-observable factors and differences between groups that do not change over time. Thus, it avoids the endogeneity problem caused by using the policy variable as the explanatory variable.
2.2. Research Hypotheses
First, the introduction of a carbon trading policy will affect the behavior of manufacturing enterprises and, consequently, their productivity. The impact of carbon trading on enterprise behavior is reflected in three aspects: production behavior, investment behavior, and innovation behavior [
31,
32,
33]. With the introduction of the policy, enterprises with carbon emissions above the carbon quota can buy quotas through the carbon trading market, while those with emissions levels below the quota can sell quotas. On the one hand, in order to grasp this “carbon opportunity,” enterprises that maximize profits will proactively improve their production processes, reduce the use of equipment and manufacture fewer products with large carbon emissions, and invest in assets with low levels of pollution [
34,
35,
36]. In order to encourage the production of low energy products, we should strengthen independent innovation and develop new technologies that protect the environment. These behaviors will directly or indirectly improve the productivity of enterprises and promote their transformation. On the other hand, the carbon trading market is an open and fair platform that can be used to promote the image of an enterprise within society. As consumers become increasingly aware of carbon emissions, they tend to purchase products that reduce such emissions [
37]. In order to maintain an environment-friendly image and to win consumers’ preferences and trust, manufacturing enterprises will actively develop energy-saving and emission-reducing products to reduce their carbon emissions [
38,
39,
40]. In addition, in order to reduce the cost of an emissions reduction, some enterprises agglomerate to promote their transformation [
41,
42]. Based on the above analysis, we hypothesize as follows.
Hypothesis 1 (H1). A carbon emissions trading rights policy can boost the transformation and upgrading of China’s manufacturing industry.
In a carbon market system, large-scale and small-scale enterprises co-exist. However, the technical conditions, management levels, capital reserves, and economic environments of these firms vary. Therefore, the constraints imposed by the size of an enterprise mean that their corporate behavior varies as well. In a carbon market environment, large companies have advantages that small businesses may not be able to match.
For example, the degree of internationalization is high. Although the carbon trading market is relatively new in China, such markets have existed for longer in other countries. As a result, larger enterprises receive information on the carbon market relatively early, enabling them to better understand and support China’s carbon trading policy. Foreign carbon trading markets provide valuable experience and advanced carbon asset management technologies, resulting in many large enterprises exploring potential business opportunities [
43]. Second, large enterprises often have dedicated carbon asset management departments, whereas smaller enterprises typically need to employ third-party agents owing to constraints on their human, financial, and technical resources, thus, increasing the cost of reducing carbon emissions. Therefore, small businesses will be less motivated to trade in carbon quotas, and may even withdraw from the market. Third, larger organizations have a higher level of management and advanced technology and equipment. The marginal cost of this advantage enables large enterprises to reduce emissions relatively easily and to carry out energy-saving emission-reduction activities. Thus, large-scale enterprises are more willing to cooperate with the implementation of carbon trading policy, increase their investment in innovation, reduce the number of high-pollution products, and enhance the efficiency of their resource use. In this way, they improve their productivity and promote their own transformation. Based on the above analysis, we propose the following hypothesis.
Hypothesis 2 (H2). In the pilot provinces, the total factor productivity (TFP) of large manufacturing enterprises will improve significantly, which will promote their transformation.
According to General Secretary Xi Jinping, “State-owned enterprises are the backbone of national economic development and the pillars of socialism with Chinese characteristics.” The capital of state-owned enterprises is controlled by the state and, thus, their behavior is restricted by the government. Therefore, given the government’s goals of saving energy, reducing emissions, mitigating the effects of climate change, and sustainable development, state-owned enterprises will play a leading role in responding positively to the implementation of the carbon trading policy in order to meet the dual political and economic needs. The example set by state-owned enterprises will also encourage private enterprises to join the carbon trading market, which will increase activity in the market. Furthermore, the management teams of state-owned enterprises are highly educated, have a strong awareness of environmental protection, have a long-term vision of enterprise development, are not limited to immediate small profits, and realize the inevitable trend of low-carbon development. Furthermore, their role as a “backbone” of the economy and their high levels of carbon emissions mean that state-owned enterprises are under greater pressure to reduce their carbon emissions. Therefore, state-owned enterprises should strive for innovation in terms of production technology and, thus, improve their efficiency of resource utilization and productivity. Non-state-owned enterprises exhibit varying levels of management, productivity, economic efficiency, and economic benefits. Therefore, the response of such firms to the carbon trading policy is uneven. Based on this analysis, we propose the following hypothesis.
Hypothesis 3 (H3). In the pilot provinces, the TFP of state-owned manufacturing enterprises will increase significantly.
3. Research and Design
3.1. Sample Selection and Data Sources
Considering the availability of data, we select 2011–2015 as the sample period. Based on a difference-in-differences model and the exogenous event of the carbon emissions trading rights pilot policy in 2013, manufacturing enterprises in the pilot provinces are set as the experiment group and those in the non-pilot provinces are set as the control group [
44,
45]. The carbon trading pilot policy was first incorporated into eight major industries, six of which were manufacturing industries (petroleum, chemical, building materials, iron and steel, non-ferrous metals, and paper. Therefore, we select manufacturing enterprises within these six industries as the research sample. In order to ensure the complete disclosure of enterprise data, we exclude enterprises that lack data and that have a poor financial situation and ST (Special treatment by the Stock Exchange). The final sample comprises 682 A-share-listed manufacturing enterprises, including 192 in the pilot provinces and 490 in the non-pilot provinces, with a total of 2743 observed values. The data are taken from the Wind database, and missing enterprise data are added manually based on firms’ annual reports.
3.2. Model Setting and Variable Definition
3.2.1. Model of TFP
TFP reflects the effective use of production factors, and is an objective index used to measure enterprise status upgrades. There are three general approaches to measuring TFP: the parametric methods, semi-parametric method, and non-parametric method [
46]. Given the availability of data, we select the parameter method to measure TFP, using the calculation method for the Solow residual value. Solow proposed the classic production function model, Y
it = A
itK
itαL
itβ, where Y
it represents total output, A
it is TFP, K
it denotes capital, and L
it is the labor input. Then, we take the natural logarithm of both sides of the equation of the model:
Thus, the function expressing the Solow residual value is
where
is the total factor productivity (TFP). That is the total measure of the contribution of other factors other than capital and labor to economic growth, which is usually expressed by economists as the contribution rate of technological progress to economic growth. This estimation accords with the measurement requirements of this paper on the index of enterprise transformation and upgrading. This estimate can be estimated with the aid of OLS.
3.2.2. Empirical Model
According to the research hypothesis, a difference-in-differences model is established, which is divided into an experiment group and a control group based on time and region, to test the hypotheses. By using the externality of explanatory variables, the difference-in-differences model can control the unobservable individual heterogeneity between samples and the influence of total factors over time. Therefore, it generates an unbiased estimate of the policy effect [
47]. The model is given as follows:
In the model (Formula (3)), the dependent variable TFP represents the total factor productivity of the enterprise, obtained using an OLS regression according to the above Formula (2) (that is in Formula (2)); the independent variables include the treated provincial and municipal variables of carbon emissions trading rights and the period. The term Treated * Period indicates the interaction of the two independent variables.
We test whether the productivity of the experiment group (manufacturing enterprises in the pilot provinces) increased compared with that of the pre-pilot control group (manufacturing enterprises in non-pilot provinces) as a result of the carbon trading pilot policy. In order to test whether carbon emissions trading rights are suitable for the transformation and development of manufacturing enterprises, the control variables include regional variables, industry variables, enterprise size, enterprise age, growth, and government subsidy. Then, μ is a random error term. The specific meaning of the relevant variable is explained in detail in the next section.
3.2.3. Definition of Variables
(a) Explained Variable
The explain variable is the TFP of enterprises. In order to measure the TFP, we consider factors such as the availability of data, and use Solow residuals to express the total factor production interest rate. In this model, the main business income represents the output Y, net fixed assets represent the capital input K, and the employment scale represents the labor input L. The data are all from the enterprise Wind database and related to enterprise annual reports. The TFP is estimated using an OLS regression with Stata13.
(b) Explanatory Variables
The carbon emissions trading rights of the provincial and municipal variables group (Treated). Manufacturing companies in Beijing, Tianjin, Shanghai, Hubei, Chongqing, and Guangdong were set to one, while those in the non-pilot provinces were set to zero, according to the carbon trading rights pilot policy. In order to test hypotheses H2 and H3, the manufacturing enterprises in the pilot provinces are screened out. Based on ownership, state-owned enterprises are defined as one, non-state-owned enterprises are defined as two. Based on the scale of enterprises, large-scale enterprises are defined as one, and small-scale enterprises are defined as two, where the scale is compared to the median of an industry.
The period. The carbon trading policy sets 2013–2015 as the pilot period. Thus, we define 2013–2015 as the pilot period (value of one), and 2011–2012 as the pre-pilot period (value of zero).
Independent variable interaction term (Treated × Period). The regression coefficient is the main difference-in-differences observation. This variable is used to test whether the productivity of the experiment group (manufacturing enterprises in the pilot provinces) increased compared with that of the control group (manufacturing enterprises of the non-pilot provinces) after the carbon trading right pilot in order to test the effect of the policy.
(c) Control Variable
In the model regression, we need to control for variables that are closely related to the productivity of an enterprise. The following six variables are selected as control variables. The geographical location of enterprises affects the human resources available, market competitiveness, and so on, and thus the productivity of enterprises [
48]. Therefore, we control for the regional variable. The industry variable is limited by different industries, and the development mode and direction of enterprises are also different. Thus, the productivity of enterprises will vary. As an extremely important dominant characteristic of the enterprise, enterprise behavior is greatly restricted by the size of the enterprise [
49]. In general, the larger an enterprise is, the more able it is to support R&D in energy-saving and emission-reduction technologies. Growth reflects the growth ability of an enterprise. The stronger this ability is, the more an enterprise can adapt to changes in the external environment, such as the market and government policy, to ensure steady and sustained growth. As a basic characteristic of an enterprise, age is an important variable that affects the productivity of enterprises. The variables are defined in
Table 1.
4. Empirical Results and Analysis
4.1. Descriptive Statistics
Table 2 shows the statistical results of the total sample. The results show that the productivity levels of the experiment group and the control group are quite different. The average productivity of the enterprises in the pilot provinces and cities is significantly higher than that in the non-pilot provinces and cities. Enterprises with high production efficiency gather in the pilot production area, resulting in high pollution. Thus, the carbon trading pilot must be implemented in these provinces and cities.
Table 3 shows the descriptive statistics for each variable before and after the carbon emissions trading rights pilot. By comparing the data of the variables before and after the pilot, it is clear that the productivity of manufacturing enterprises after the pilot has declined. In addition, the average values of the experiment group and the control group are significantly negative (0.416%) after the experiment, indicating that the productivity of the experiment group decreased significantly compared with the control group, which is contrary to the above hypothesis. Therefore, we rely on the subsequent empirical results to re-position the relationship between carbon trading rights and the transformation and upgrading of manufacturing enterprises in order to evaluate the policy effect objectively and scientifically. In addition, we can see from
Table 3 that there are significant differences in the medians of company size and company age between the two groups, before and after the pilot, and that there are also significant differences between the company growth indicators and the government subsidy index after the pilot. Therefore, these variables are controlled in the subsequent empirical regression.
4.2. The Correlation Coefficient
Table 4 reports the phase relationship between the variables as an indicator. The correlation coefficient is far less than the variables in the table (0.5), and the variance inflation factor (VIF) is much less than 10. Thus, a multiple collinearity problem is not obvious.
4.3. Regression Analysis
4.3.1. Total Sample Regression Analysis
Table 5 reports the total sample (sample of all manufacturing enterprises in pilot industries) regression results, which are mainly used to observe the productivity changes of manufacturing enterprises before and after the carbon emissions trading rights pilot in order to test whether the policy can transform the manufacturing industry. Therefore, we focus on the coefficient of Treated × Period, which reflects the change in productivity of manufacturing enterprises in the pilot provinces as a result of carbon trading policy. According to hypothesis H1, the expected symbol is positive. A simplified model without a control variable is reported in
Table 5 (1). A model with firm size, firm age, and enterprise growth as control variables is reported in (2). Regional variables are added to the above three control variables in (3) in order to control the local fixed effect, which does not change over time.
We add the regional variable and the industry variable at the same time in (4). For the sake of simplicity, the regression coefficients of the two variables are not shown in (3) and (4).
From the results of the full sample regression, we can see that the interaction item, with or without control variables, is positive, but not statistically significant, which indicates that carbon trading rights have a weak effect on enterprise productivity. The “Porter hypothesis” states that the implementation of carbon emission trading rights cannot coordinate with the development of the manufacturing industry in order to achieve win–win development of enterprise production efficiency, social energy saving, and emissions reduction (i.e., (1) is not established). Period indicates the possible impact of other events in the same period after the pilot on enterprise productivity. The regression coefficients after adding the time variables and industry variables are not significant, but both are negative. This is consistent with the descriptive statistics in
Table 3. This further explains why the carbon emissions trading rights pilot policy does not show the Porter effect. Considering the reality in China, the result is unexpected, but reasonable. The pilot period of the carbon trading policy is short, and the Porter effect, which forces enterprises to carry out technological innovation and reduce emissions production, is not apparent in the short term. In addition, not all enterprises can consciously carry out technological reform and low-carbon production under the pressure of carbon trading policies. If the carbon quota transaction price is long below the input cost of technological innovation in low-carbon production, some enterprises will choose to pay extra for quotas or carry out a pollution transfer. Therefore, it is impossible to realize the Porter effect for environmental regulation on enterprise productivity.
Other control variables have a significant relationship with the productivity index. There is a significant positive correlation between size and productivity at the 1% level, which indicates that an expansion of firm size means an increase in productivity, which is in line with the scale effect. There is a significant negative correlation between age and productivity at the 1% level, which may be due to the lack of new internal management in older companies. Thus, enterprises should consider their management structure, mode of production, and management concept, because the growth of enterprises is significantly positively related to productivity. This shows that the higher the growth ability, the higher the productivity is of the firm, which indicates that the healthy operation of an enterprise directly affects its productivity.
4.3.2. Subsample Regression Analysis
According to hypotheses H2 and H3, the overall sample is further divided into two groups of subsamples, based on the size of the enterprise and the nature of the enterprise.
Table 6(1)–(3) shows the subsample regressions by firm size. The size of the division is based on the median of their respective industries, where values above the median are large enterprises (defined as one), and zero otherwise. From these three columns, we can see that the interaction coefficient is negative, but not significant. Assumption 2 does not hold, which indicates that the carbon trading pilot policy has not improved the productivity of large-scale manufacturing enterprises; that is, it has failed to promote the transformation and upgrading of large-scale enterprises. The pilot period of the carbon trading policy is only three years, and the government is likely to require that enterprises, especially large enterprises, in the industry join the carbon trading system to assume corporate social responsibility for the goal of energy saving and emission reduction. According to the annual report on China’s policies and actions to deal with climate change, by the end of August 2015, the cumulative local quota for trading seven carbon emissions trading units in China was about 40.24 million tons, with a turnover of about 1.2 billion yuan. Furthermore, the cumulative auction quota was about 16.64 million tons. Here, the turnover was about 800 million yuan, and the compliance rate of the pilot provinces reached 96% and 98% in 2014 and 2015, respectively. Thus, the carbon trading pilot has had an effect [
50]. However, in order to achieve emission reductions in a shorter period, some enterprises with less developed technological means may adopt other methods, such as reducing production or purchasing quotas separately, owing to the high cost and long cycle of technological transformation of emission reductions. These will have a negative impact on the productivity of enterprises. In addition, carbon trading forced companies to undertake long-term clean technology transformation, but this failed to materialize in short pilot period.
Table 6 is a subsample regression based on the nature of enterprise ownership. The interaction items are significantly negative, which is contrary to hypothesis 3, which indicates that the pilot policy reduces the productivity of state-owned enterprises. Here, state-owned enterprises must take the lead in the environment of the carbon emission trading right policy. In order to achieve the emission-reduction target, enterprises need to sacrifice capital for low-carbon development and emission-reduction technology transformation, which has a temporary impact on their productivity. Secondly, if an enterprise fails to carry out an effective and reasonable plan, when the emission reduction policy is carried out, it will be overwhelmed, thus having a negative impact on enterprise transformation. In addition, the starting point of the carbon trading right policy itself is to achieve China’s 2020 carbon emissions reduction target. However, companies are profit maximizers, and so if emission-reduction policies affect their interests, it may result in “bad money driving out the good.” Therefore, the carbon trading rights policy formulation needs further reform. The symbols and significance of the coefficients of the control variables in
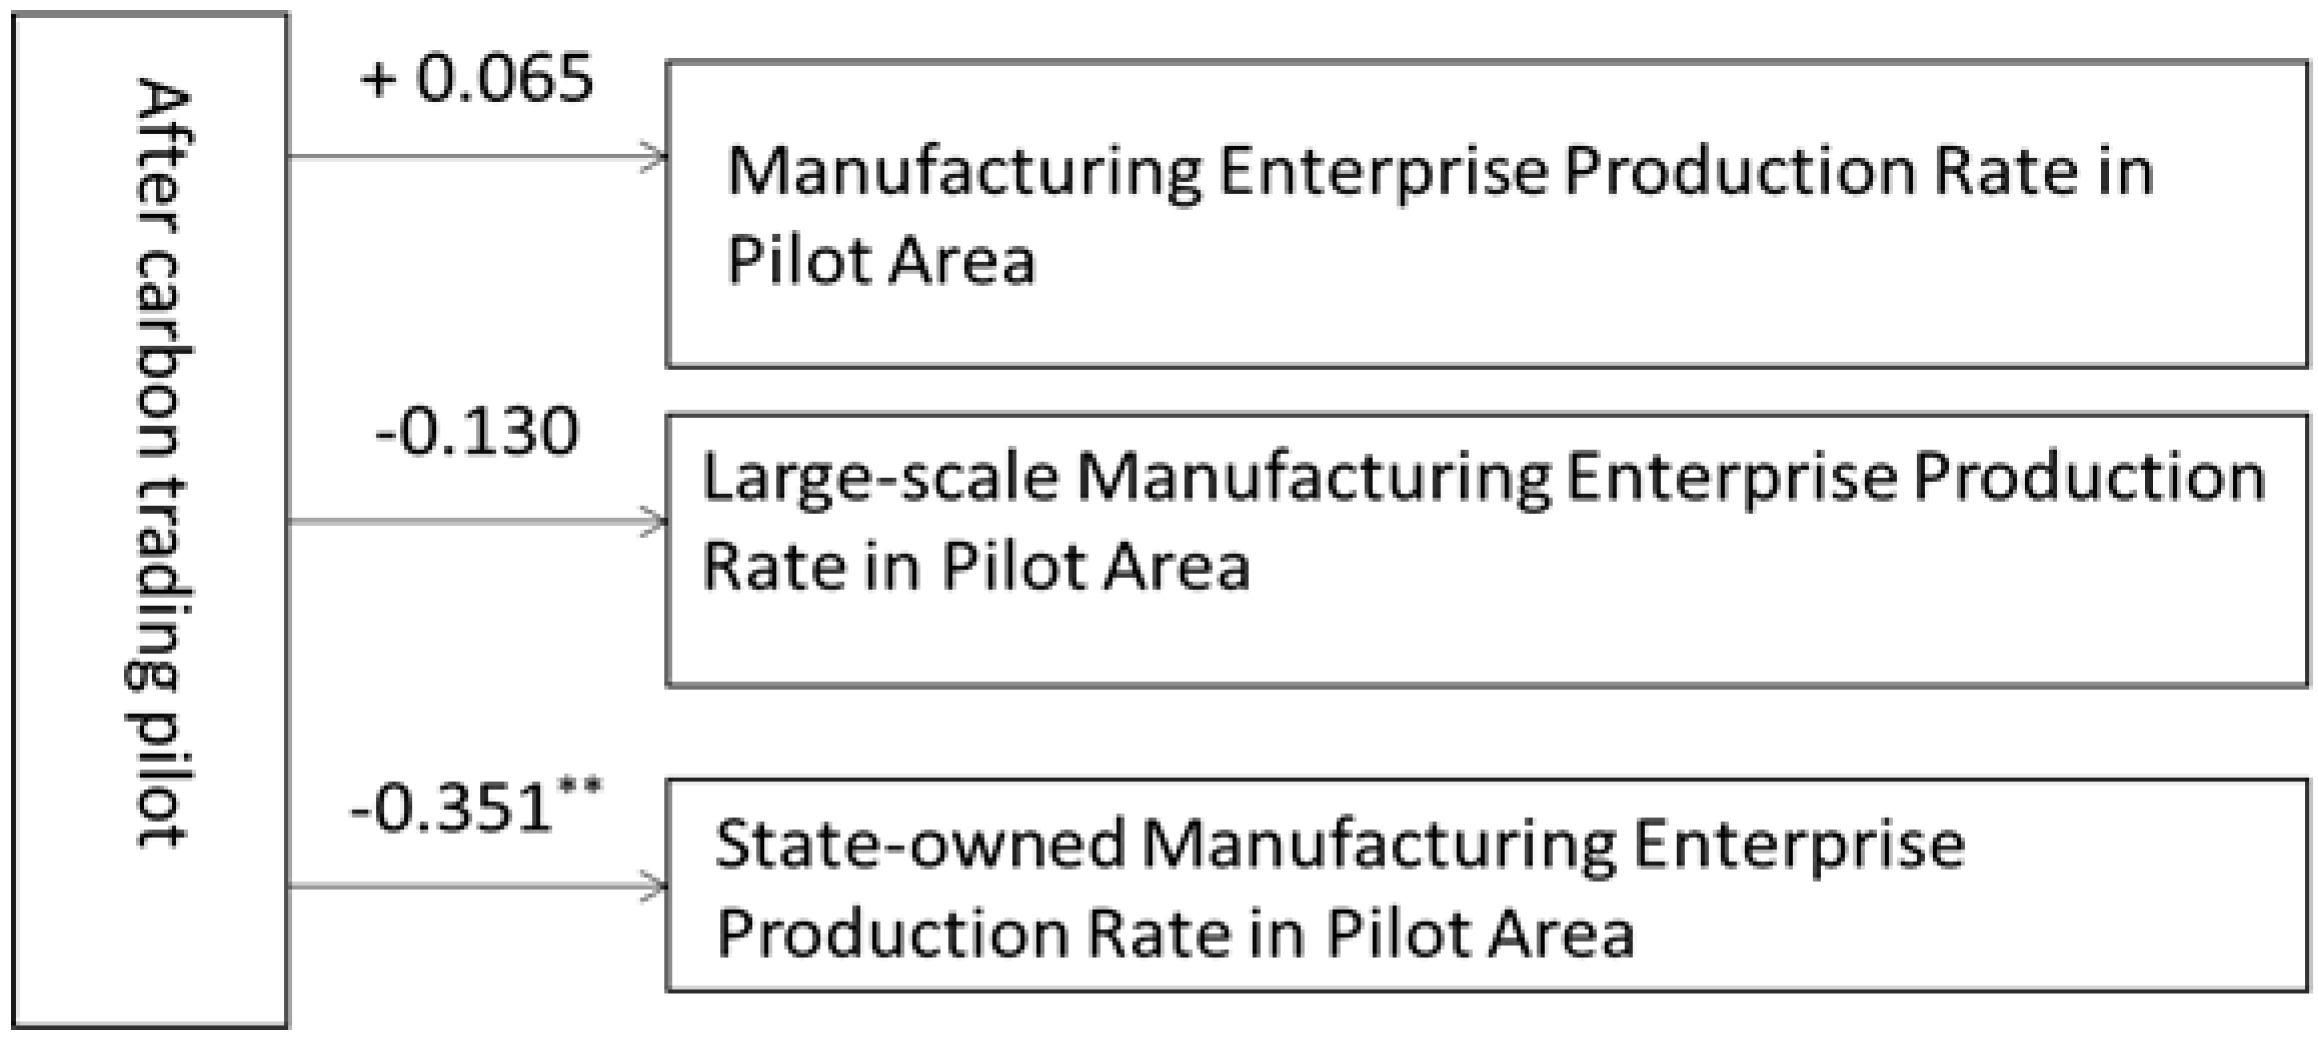
Table 6 are largely consistent with the results of the overall sample regression. To more intuitively reflect all of the above assumptions and regression results, the schematic diagram of the influence mechanism of carbon emission trading pilot policy on manufacturing enterprises in pilot regions is shown in
Figure 1. The coefficients reported in the graph are the regression coefficients of (4) column in
Table 5 and (3), (6) column interaction item in
Table 6.
4.4. Robustness Test
In order to ensure the robustness of our results, a placebo test [
51] was carried out using a difference-in-differences test to determine whether the change in productivity was due to the carbon trading policy, or whether productivity was decreasing before the implementation of the policy. A sample of firms for the period 2010–2012 were selected to test the robustness of the model, assuming that 2011 was the start of the pilot (see
Table 7).
Table 7 reports the regression results with the addition of regional and industry variables, in which column (1) is the full sample regression, column (2) is the subsample regression result by scale, and column (3) is the subsample regression by ownership. The symbols and significance of the interaction item are inconsistent with the regression results above. Therefore, the results are robust.
5. Conclusions and Discussion
From an enterprise behavior perspective, this study used a difference-in-differences model to examine whether the pilot carbon trading rights policy can boost the transformation of manufacturing enterprises and realize the Porter effect. The subsample regression results according to size show that the interaction term coefficient (Treated × Period) is negative, indicating that the carbon trading pilot policy does not increase the productivity of large-scale manufacturing enterprises. According to the subsample regression results based on ownership, the interaction term coefficient (Treated × Period) is significant and negative, indicating that the pilot policy reduced the productivity of the state-owned enterprises, and verifies the “compliance cost hypothesis.” It must be acknowledged that the sample time span of this paper is only five years, and it is impossible to examine the impact of carbon trading rights on the productivity of enterprises in the long run. Therefore, the empirical results will inevitably produce errors, which should be paid attention to and improved in the future.
The introduction of a policy is a significant event. The best effect of an environmental policy is to achieve coordinated economic, social, and environmental development, but the carbon trading pilot has yet to achieve this effect. Therefore, the carbon trading policy has drawbacks or areas for improvement. Because of the high uncertainty in the carbon market, its establishment will take time [
52], which needs to be explored and improved on by researchers. Thus, based on our results, we propose feasible suggestions on the formulation and implementation of a carbon emissions trading policy from the perspective of the government, enterprises, and society. Such a policy should promote carbon trading to better adapt to the development of manufacturing enterprises in China, and promote the green transformation of the manufacturing industry.
First, From the perspective of the government, relevant supporting measures should be set up to improve the carbon emission trading policy, in order to form comprehensive and complete set of carbon trading laws and regulations system. For example, (1) Setting up a special working group scientifically account carbon quotas in view of the industry, region, and even the burden of enterprise ability and other characteristics, in order to guide enterprises implementing their carbon emission reduction work step by step. (2) Establishing rewards and punishment mechanism to arouse the activity of the carbon market: giving a complete set of preferential tax to the enterprises which active implementation of carbon reduction, to reduce the pressure of productivity reduction caused by the environmental cost of carbon emissions in the short term; On the contrary, enterprises that fail to meet the requirements of environmental protection and energy consumption standards should be included in a list to be strictly controlled, so as to avoid the phenomenon of “bad currency driving out good ones”. Furthermore, the government should play a macro-guiding role, and strengthen the concept of low-carbon production propaganda. For example, we should give publicity to enterprises that sell carbon quotas through energy saving and emission reduction measures, and enhance their social reputation and popularity through the help of carbon market platform, so as to encourage more enterprises to join the ranks of energy saving and emission reduction. Finally, the government should implement the carbon trading market management mechanism and clearly define the relevant responsibilities to the municipal people’s government. For example, increasing budgetary financial support for low-carbon development and enforcing accountability for the use of funds will ensure the efficient use of funds and maintain transparency in carbon trading platforms, both at the central and local levels.
Second, enterprises need to focus on their management, production, and investment decisions to grasp the opportunity of green transformation while meeting the challenge of the carbon trading policy. Enterprises should incorporate the concept of green development throughout the organization; train management teams on low carbon production, mode, and social responsibility; strictly control production; and strive to control pollution. Enterprises with funds and manpower can train carbon asset management teams to evaluate and monitor the carbon emissions of enterprises to control costs under the premise of meeting the performance requirements. In addition, enterprises should persist in green production, green management, developing of clean technology, adjusting their product structure, reducing production of high energy consumption products, and promoting development by innovation. Third, enterprises should consider investment decisions from a long-term perspective, increase R&D investment in energy saving and environmental protection products, reduce the carbon emissions of enterprises, and use innovation to take the lead in the growing carbon market.
Finally, from the point of view of society, each social class should develop its awareness of a low-carbon environment and environmental protection. This will lead to a preference for green products, which will drive firms to produce green products, accelerate emission-reduction targets, improve their economic efficiency, and realize green transformation, innovation, and transformation.

