1. Introduction
The reduction of postharvest losses (PHL) reduction has become a central pillar of sustainable global food systems. PHL reflect a missed opportunity in the fight against global food insecurity. The reviews “The Future of Food and Farming” [
1] and the “Missing Food” report [
2] recommend PHL reduction as a critical response to global food availability concerns. FAO (Food and Agriculture Organization of the United Nations) [
3] estimates that one-third, which amounts to 1.3 billion tonnes, of all the food that is produced for human consumption is lost globally. The World Bank [
2], for instance, estimates that up to USD 4 billion in value of cereals is lost to PHL in sub-Saharan Africa (SSA); this exceeds the value of food aid received in SSA over the last decade [
4]. In such a case, reducing PHL is crucial if the food demands of the ever growing world population are to be met [
5,
6]. Pedrick [
7] asserts that even without increases in agricultural production, PHL reduction can make a significant contribution to combating hunger and increasing farm incomes. Reduction of PHL is even more crucial in SSA, where approximately 218 million people live on the margins of food insecurity [
8]. In light of this, PHL reduction has become a central component of development policy in Africa. PHL reduction is an integral component of the Comprehensive Africa Agriculture Development Plan (CAADP). In Uganda, for instance, PHL reduction is an essential pillar of the second National Development Plan [
9].
Despite policy prioritization, operationalization of PHL policies and strategies remains a challenge. One of the main constraints to operationalization of PHL reduction policies and strategies is the lack of clear and empirical information on the magnitudes, distribution, and determinants of these losses. This information is crucial in the identification of solutions and in guiding priorities of action [
3,
4,
10]. In this study, we contribute to PHL literature by analysing the extent and determinants of PHL in the green cooking banana (
matooke) value chain in Uganda.
Banana is an important source of food and nutrition security for smallholder farmers in Uganda. Annual country production is 8.9 million metric tons [
11]. Banana provides 17% of Uganda’s daily caloric requirements [
12]. Similarly, on average, each banana cultivating household earns USD 1244 per annum [
13]. Uganda is the largest consumer of cooking bananas in the world [
14], with an annual per capita consumption of 172 kg [
15]. However, because of a short shelf life, bananas are highly vulnerable to postharvest deterioration [
16]. Information on the extent of these losses in bananas is limited. Affognon et al. [
4] in a meta-analysis of PHL literature in SSA note that, whereas evidence on PHL in cereals is increasingly available [
3,
17], only scanty information exists on the extent, distribution, and drivers of PHL in vegetables, roots, and tubers, and fruits, like bananas. Where available, evidence on PHL in banana is mixed: losses of up to 80% are reported in Rwanda [
18]; on season and off-season market losses of 6.6% and 2.2% are reported in Nigeria [
19]; total value chain losses of 26.5% are reported in Ethiopia [
20]. In the Ugandan context, only TRIAS [
21] has attempted to quantify PHL in bananas. However, estimates from this study are anecdotal and are based on secondary review of literature. The study is also silent about the distribution of losses at the different value chain nodes, yet such information is essential in the identification of loss hotspots and can guide targeting of loss reduction strategies. Using a value-chain approach, the current study, first: estimates the extent of postharvest losses in the cooking banana value chain; and, then identifies the factors that affect PHL at value chain nodes with the highest losses. In doing so, the study will underscore strategies and recommendations for reducing PHL, and in turn, will contribute to make the value chain more efficient and sustainable.
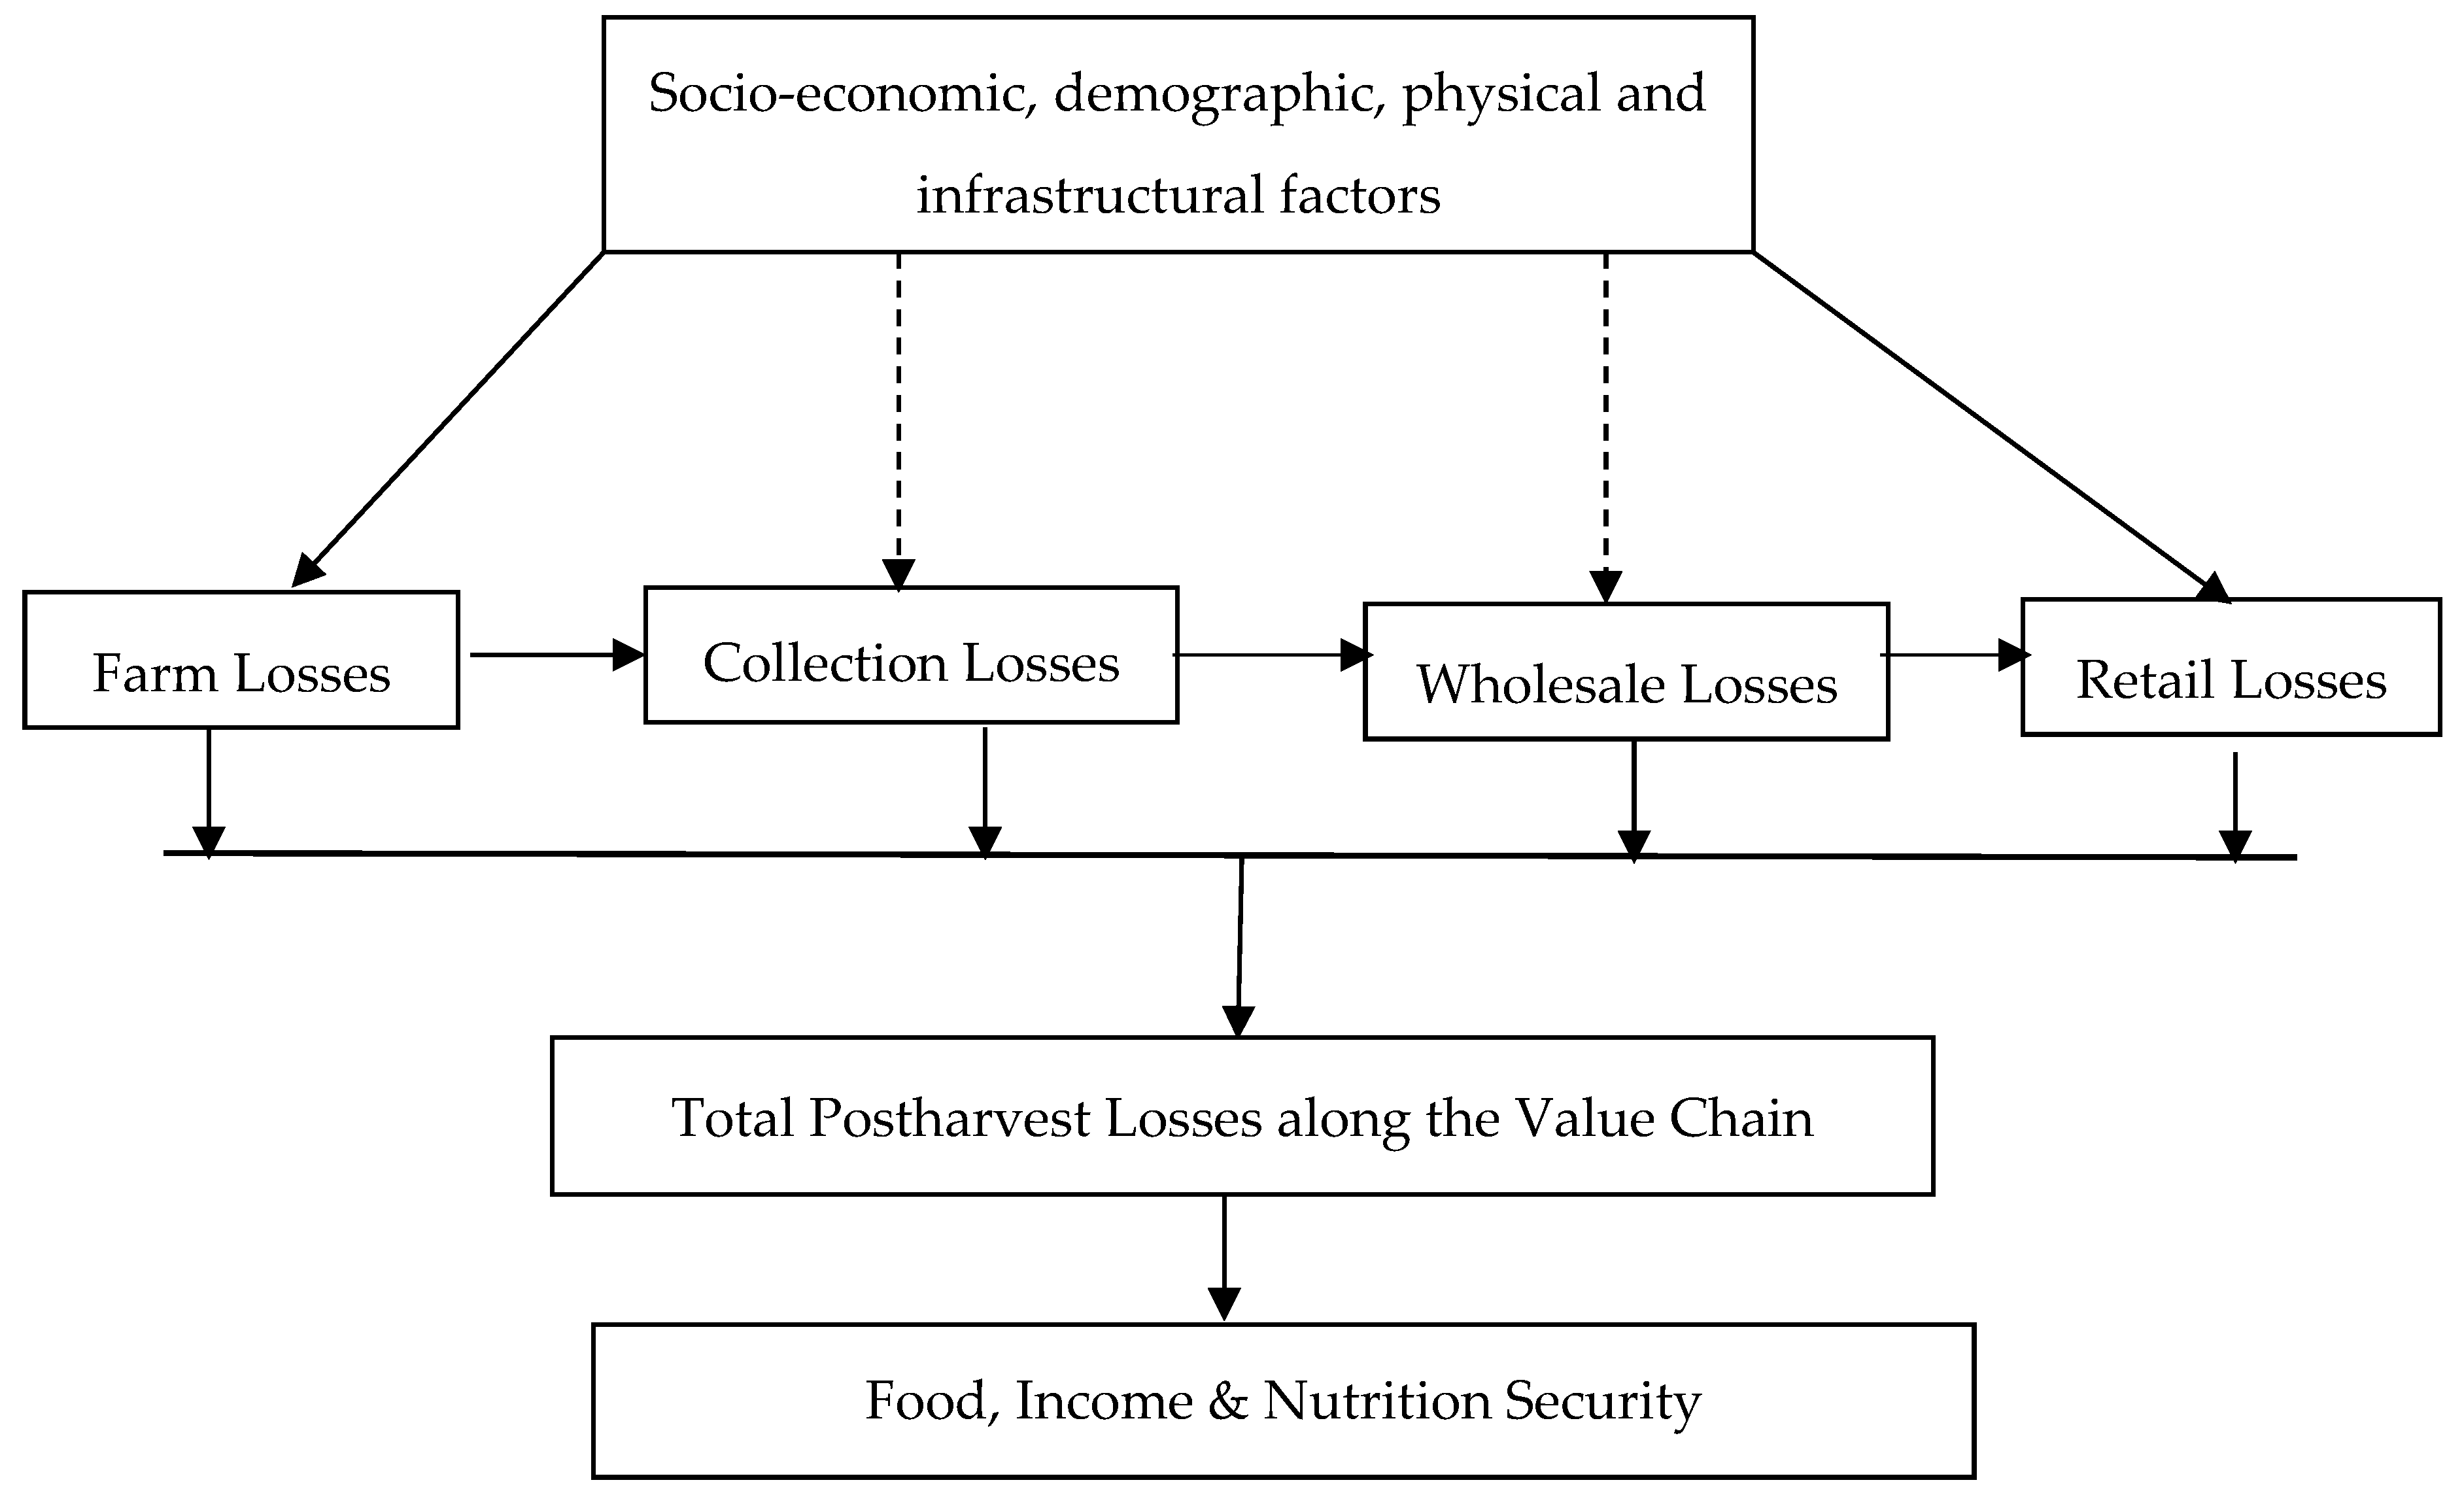
The article is structured as follows. In the next section, we present a conceptual framework to show how PHL can be estimated along with the factors that underlie these. We then describe the survey data and the econometric methods of analysis used to identify the determinants of PHL. Finally, we present and discuss the main results and draw conclusions for future research and development efforts.
3. Results and Discussion
3.1. Structure of the Cooking Banana Value Chain
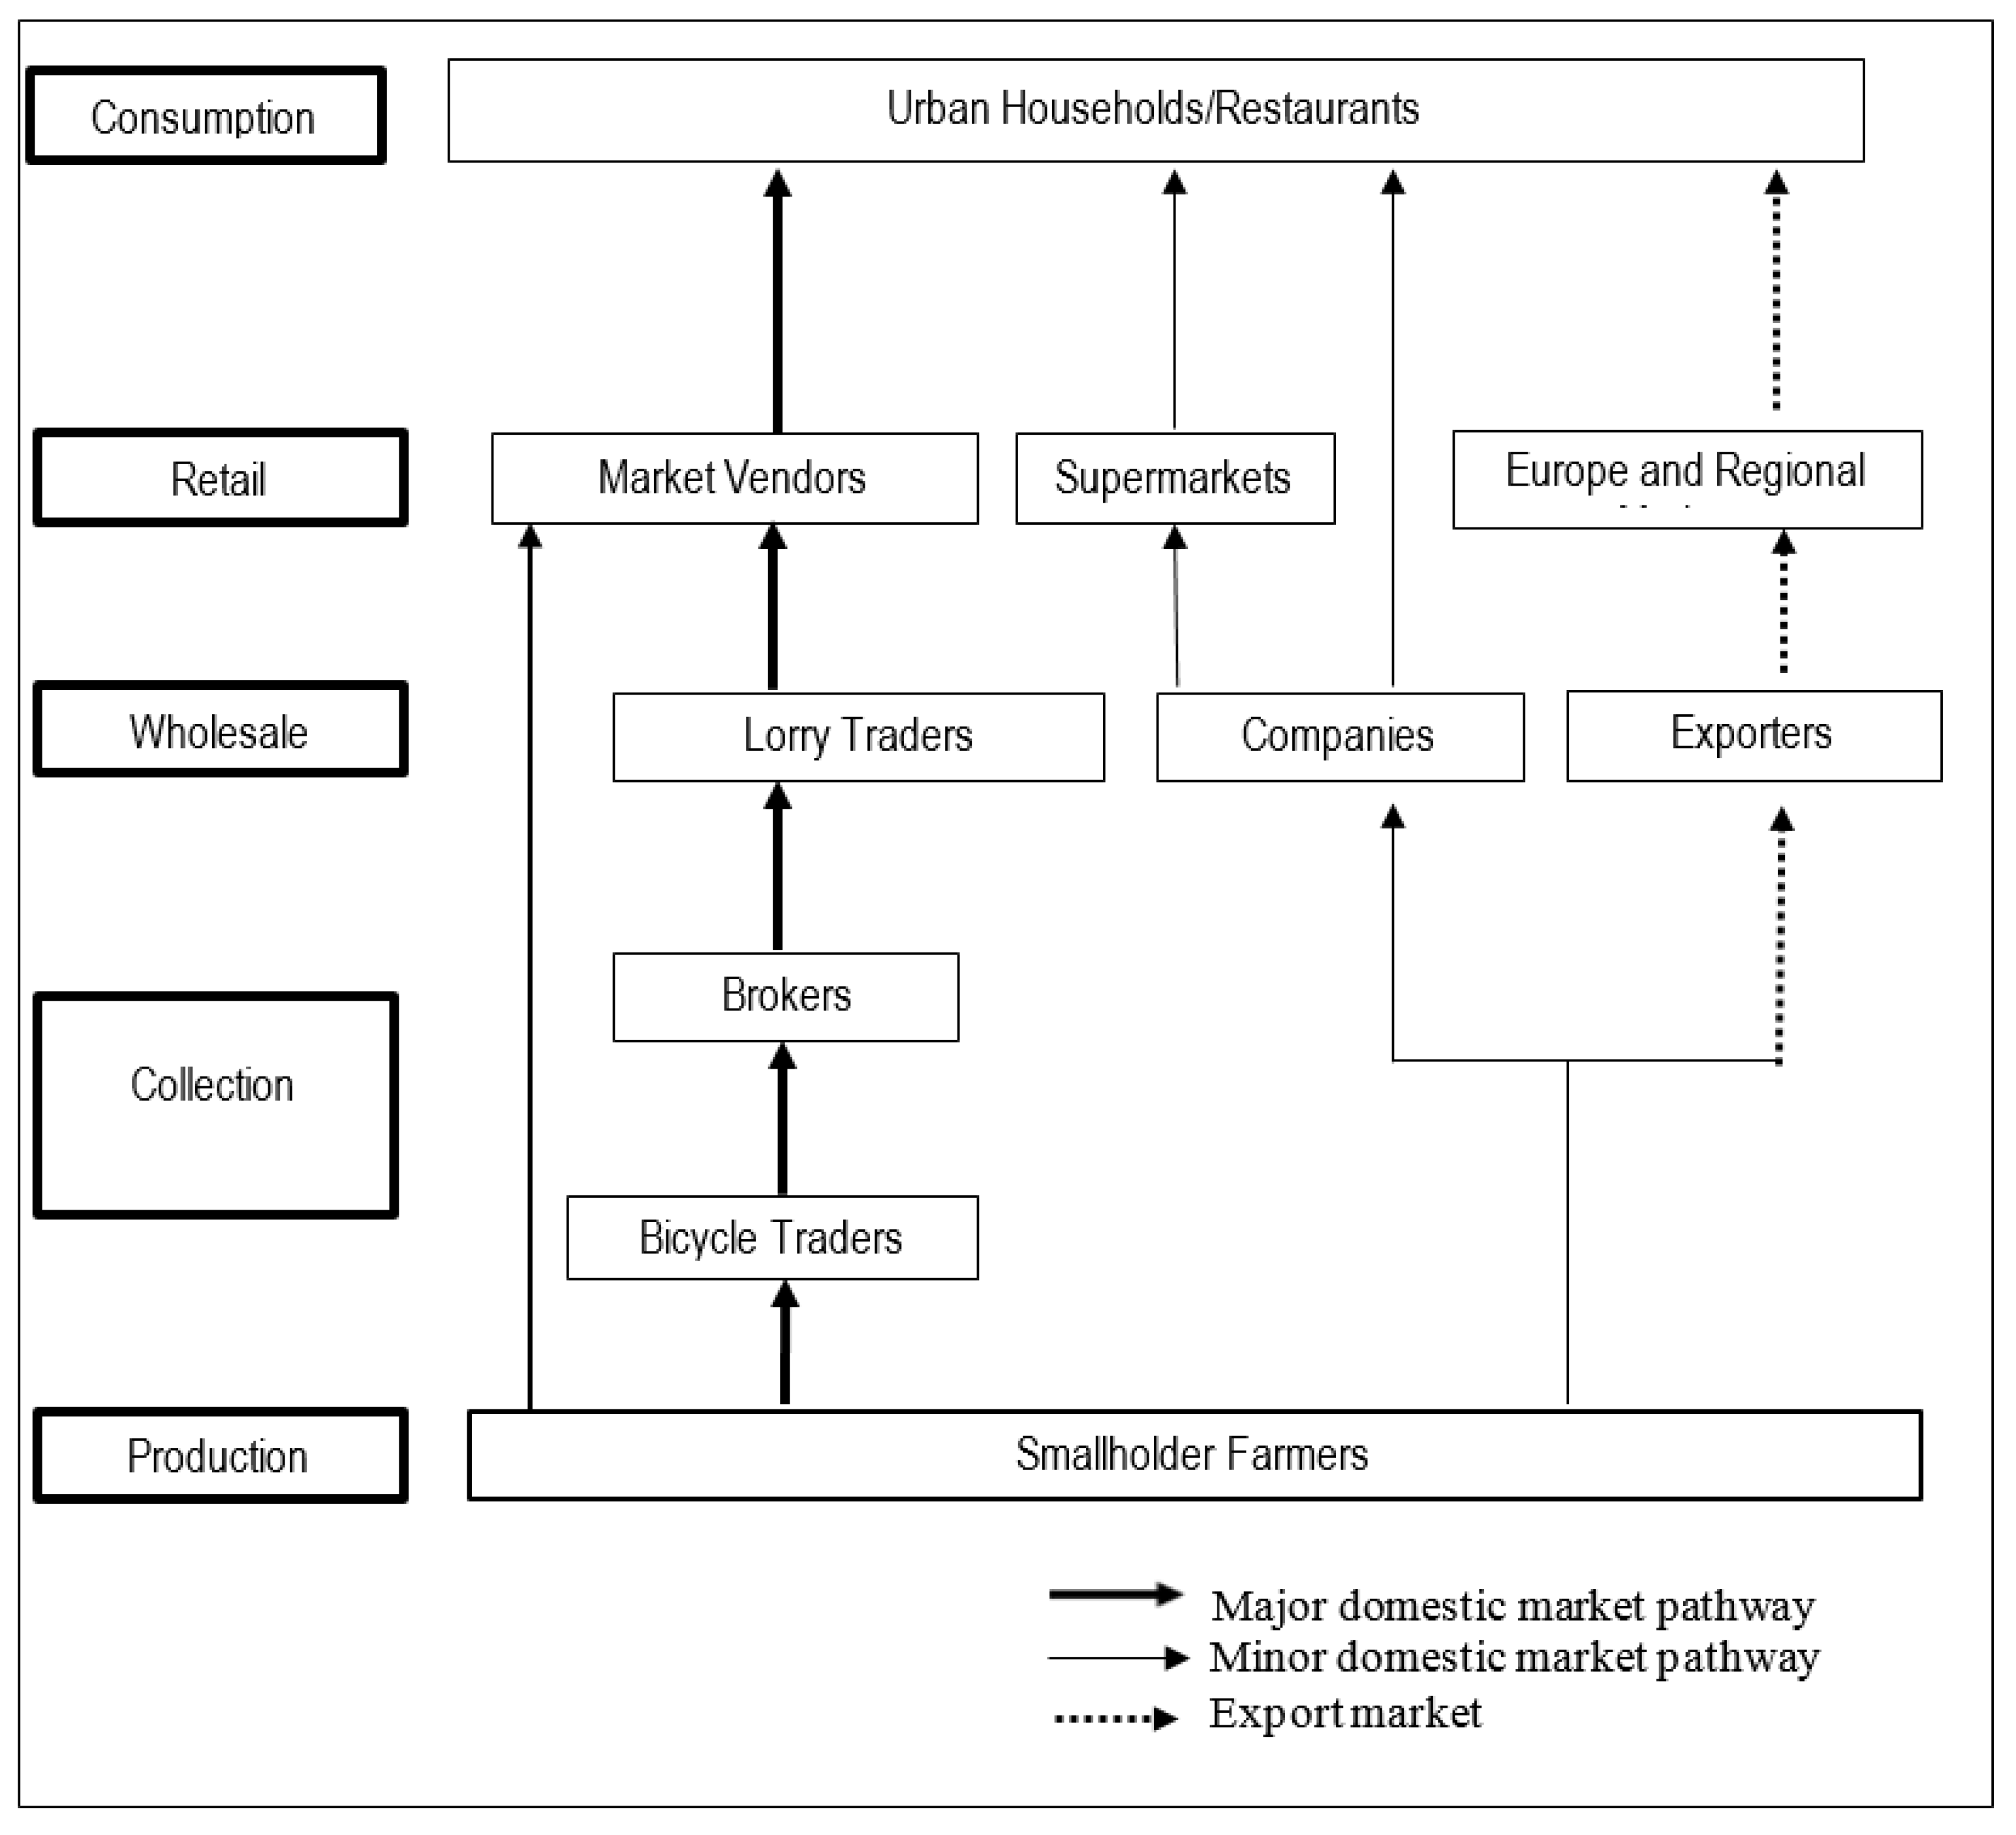
The chain is made up of producers, collectors (brokers and bicycle traders), wholesalers, retailers, consumers, and exporters, as explicated in
Figure 2 below. Bananas move from producers to lorry traders (wholesalers) directly or through collectors (brokers and bicycle traders). The lorry traders then transport and distribute the bananas to the retailers who then sell to the final consumers in the domestic market. Some bananas move directly from producers to exporters, who mostly sell to Europe and regional markets, especially South Sudan. The volume of bananas exported however remains very small (estimated at less than 5% of total production) and this is not included for this study. This study focused mainly on the domestic cooking-banana market.
Bicycle traders, which are common in Rakai district, buy bananas from farmers that were dispersed within the village; they act as initial collecting agents. Bicycle traders are well-known members of the community and have established relationships with the farmers. Competition exists amongst bicycle traders as barriers to entry are low. Bicycle traders sell most of their produce to brokers at collection centre that are found at sub-county or district trading centers. Smaller percentages (20%) of their sales go to local consumers, market vendors, or lorry traders directly. At times, brokers collect bananas directly from farmers though they buy most of their bananas from bicycle traders. Brokers, in turn, supply the bananas to lorry traders (wholesalers); they are commission agents linking bicycle traders to lorry traders. In a few circumstances, brokers engage in the transportation of banana to urban markets.
Retailers (vendors) operate in small stalls in major urban markets. The major key banana markets in Kampala city are Kalerwe, Nakawa, Kasubi, and Nakasero, but there are several other smaller markets in the Kampala metropolitan area where retailers operate. Retailers purchase most of their stock from lorry traders (wholesalers), while a few purchase directly from producers (who doubles as traders) or other large retailers in the same or neighbouring markets. Vendors have long term strong relationships with lorry traders and they usually negotiate banana prices on phone before the bananas are delivered in the markets. Retailers, in turn, sell bananas mostly to individual urban household consumers and restaurants.
3.2. Socio-Economic Characteristics of Value Chain Actors
From
Table 2, male dominance at most value chain nodes is evident. At wholesale and collection, all of the traders in the study were males. Our findings are similar to Mebratie et al. [
20] who find males to dominate the banana value chain in Ethiopia. The results also show that most of the respondents were married. Retailers were found to be the most educated, followed by the producers, while wholesalers were the least educated.
Producers were more likely to belong to a farmers’ group. Only a handful of retailers, wholesalers, and bicycle traders belonged to any group. Brokers did not belong to any group. Results further show producers, wholesalers, and brokers to be older and retailers and bicycle traders to be younger. This may be because production, brokerage, and wholesale activities are capital intensive (in form of land or cash). Older people with more resource endowments are more likely to participate in resource intensive activities, like the production and wholesale of bananas. Younger people with limited capital endowments may only afford to participate in less capital-intensive activities. This may explain the lower mean age for retailers and bicycle traders. Retailing and bicycle trading are also labor intensive and may be more suited to younger people who are usually more energetic. The mean overall proportion of land under banana was 23% (33% in Isingiro district and 15% in Rakai district).
3.3. PHL in the Cooking Banana Value Chain
3.3.1. Seasonal Variation of PHL at Each Node
Postharvest losses are proportionally higher in the high production (surplus) season than in the low production (scarce) season. At times of scarcity, physical losses and economic losses affect about 1.2% and 1.9% of harvested bananas, respectively, on farm (
Table 3). Due to quality deterioration (economic losses), a bunch is sold at a discount rate of about 25% in the scarce season at farm level. The major causes of physical losses at farm level are theft and ripening, while the causes of economic losses are mainly selling of immature bananas, followed by poor postharvest handling and ripening. Selling immature bananas is attributed to the high demand in the market that cannot be met by the available farm production during times of scarcity. Immature bananas are considered to be of low quality and thus buyers pay less than the normal price of a mature bunch. During the surplus season, physical losses are estimated at 3.4%, while economic losses affect approximately 2.8% of harvested bananas that are sold at 65% price discount. The major cause of postharvest (physical and economic) losses during the surplus season is ripening. During the surplus season, there are many producers offering bananas to the market yet buyers are few. As a result, some farmers fail to sell their bananas, while others store their bananas for longer periods predisposing them to ripening.
At the collection level, proportionally larger losses are incurred during the surplus season (3.9% and 4.6% of bananas affected by physical and economic losses, respectively, resulting into a 20% price discount for the latter) when compared to the scarcity season (1.8% and 2.2% of bananas affected by physical and economic losses, respectively, with a 16% price discount for the latter). Bruising, ripening, and overstaying are the lead causes of physical and economic losses in both the surplus and scarcity seasons. It must be noted that the economic losses reported at collection, wholesale, and retail levels in
Table 3 are cumulative and are not actual (net) economic losses that are incurred at those particular nodes. For example, during scarcity, the observed economic losses at the collection level was 2.2%. However, this includes economic losses incurred at farm level (1.9%). The actual economic losses incurred at this node, therefore, is only 0.3%. That is to say, all of the economic losses reported in this section are cumulative. Actual losses are discussed in estimating the extent of postharvest losses in the chain later in the paper.
At the wholesale level, physical losses during scarcity are estimated at 6.7% and economic losses at 3.2%. Due to quality deterioration, a bunch is sold at about 13% price discount. The major causes of such losses are thefts and bruising for physical losses and bruising and ripening for economic losses. However, in the surplus season, both physical and economic losses increase to 8.7% and 7.5%, respectively, and they are mainly caused by ripening and bruising. Quality deterioration leads to selling each bunch at a discount rate of approximately 33%.
At retail level physical losses during periods of scarcity are estimated at about 6.2%, while economic losses affect approximately 6.5% of traded banana whose price is reduced by about 52%. At times of surplus physical losses increases to 9.8% and volumes affected by economic losses almost double to 11.9%, resulting into 60% discounted selling price per damaged bunch. Physical losses are mainly caused by ripening, bruising, and thefts, while economic ones are caused by ripening, bruising, and finger plucking in scarcity seasons. Generally, workers who load (and offload) bananas onto (from) the truck are not paid cash. So at any point of loading and offloading these workers pull out (pluck) some banana fingers as their in-kind payment. On average about 10 fingers are removed per bunch. Retailers are very dissatisfied with the act of plucking out fingers from the bunch and about 57% of the retailers reported tremendous losses (due to weight loss and accelerated quality deterioration) from finger plucking. Bruising and ripening are the lead causes of postharvest (both physical and economic) losses during the surplus season at the retail level. Bruising results into discoloration and exposes the banana to infections thus shortening the shelf life and lowering the quality. Other causes that have been mentioned include overstaying, scotching (drying/shrinking due to exposure to prolonged sunlight), and finger plucking.
3.3.2. Weighted PHL at the Value Chain Nodes
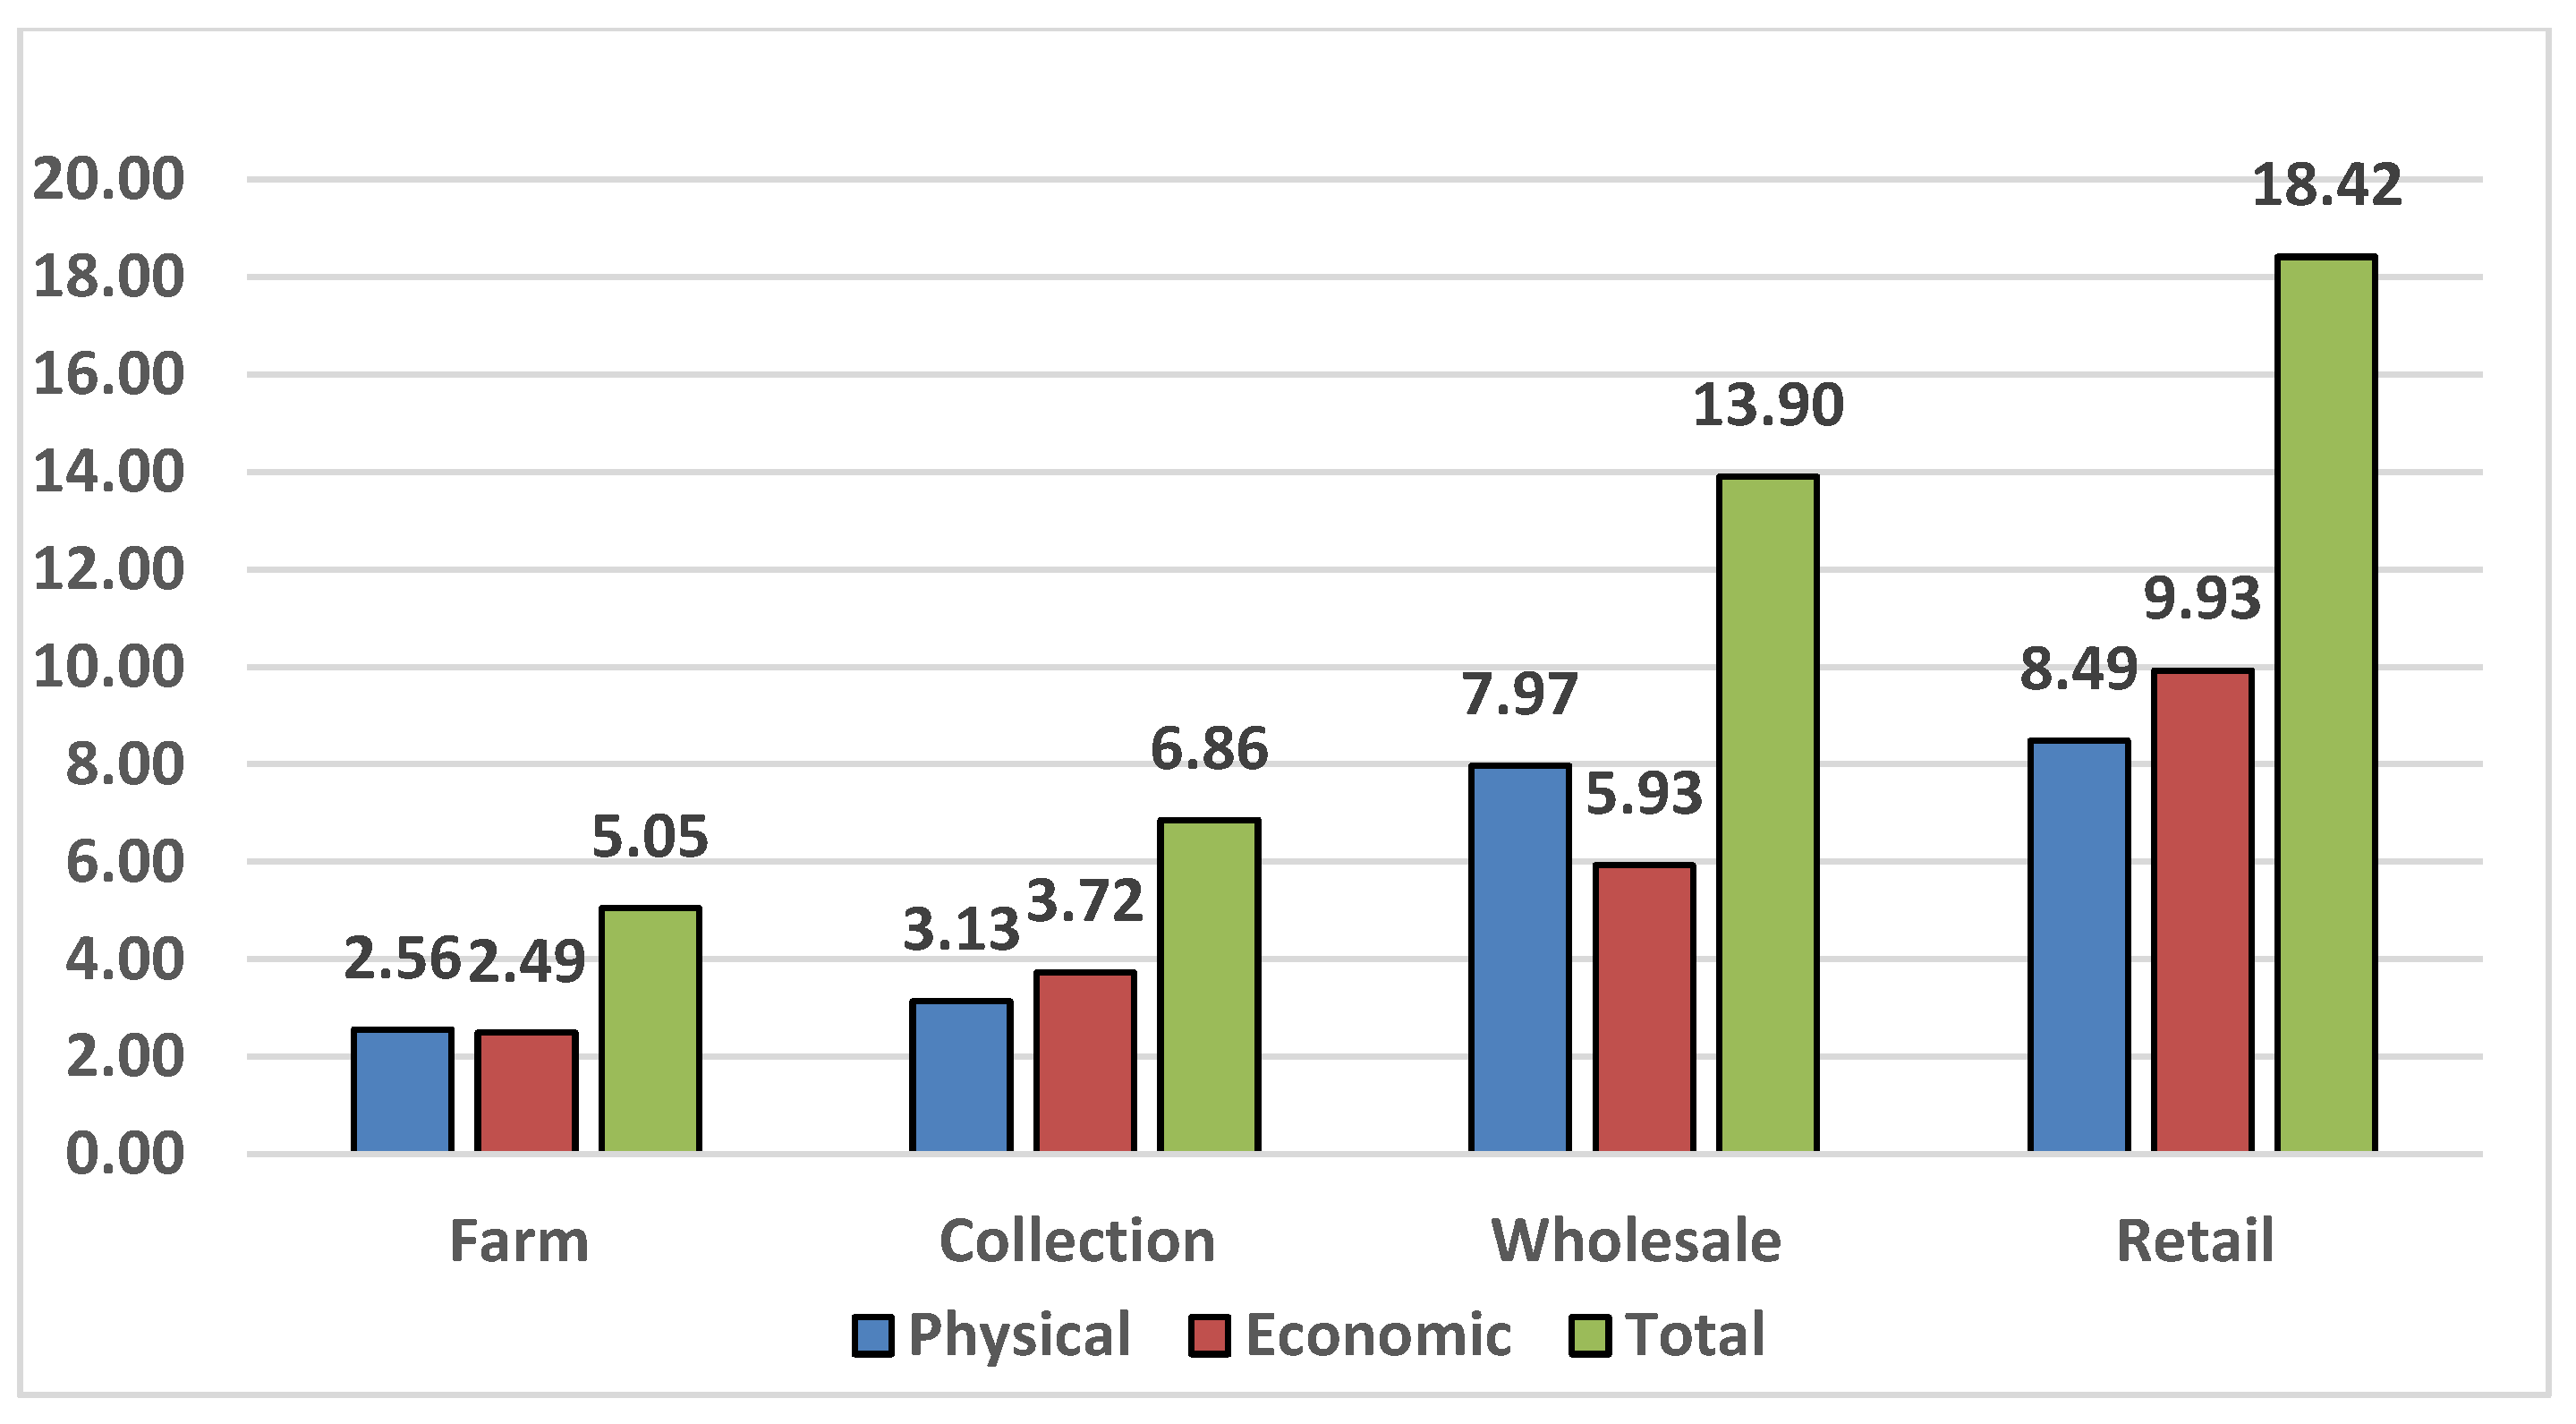
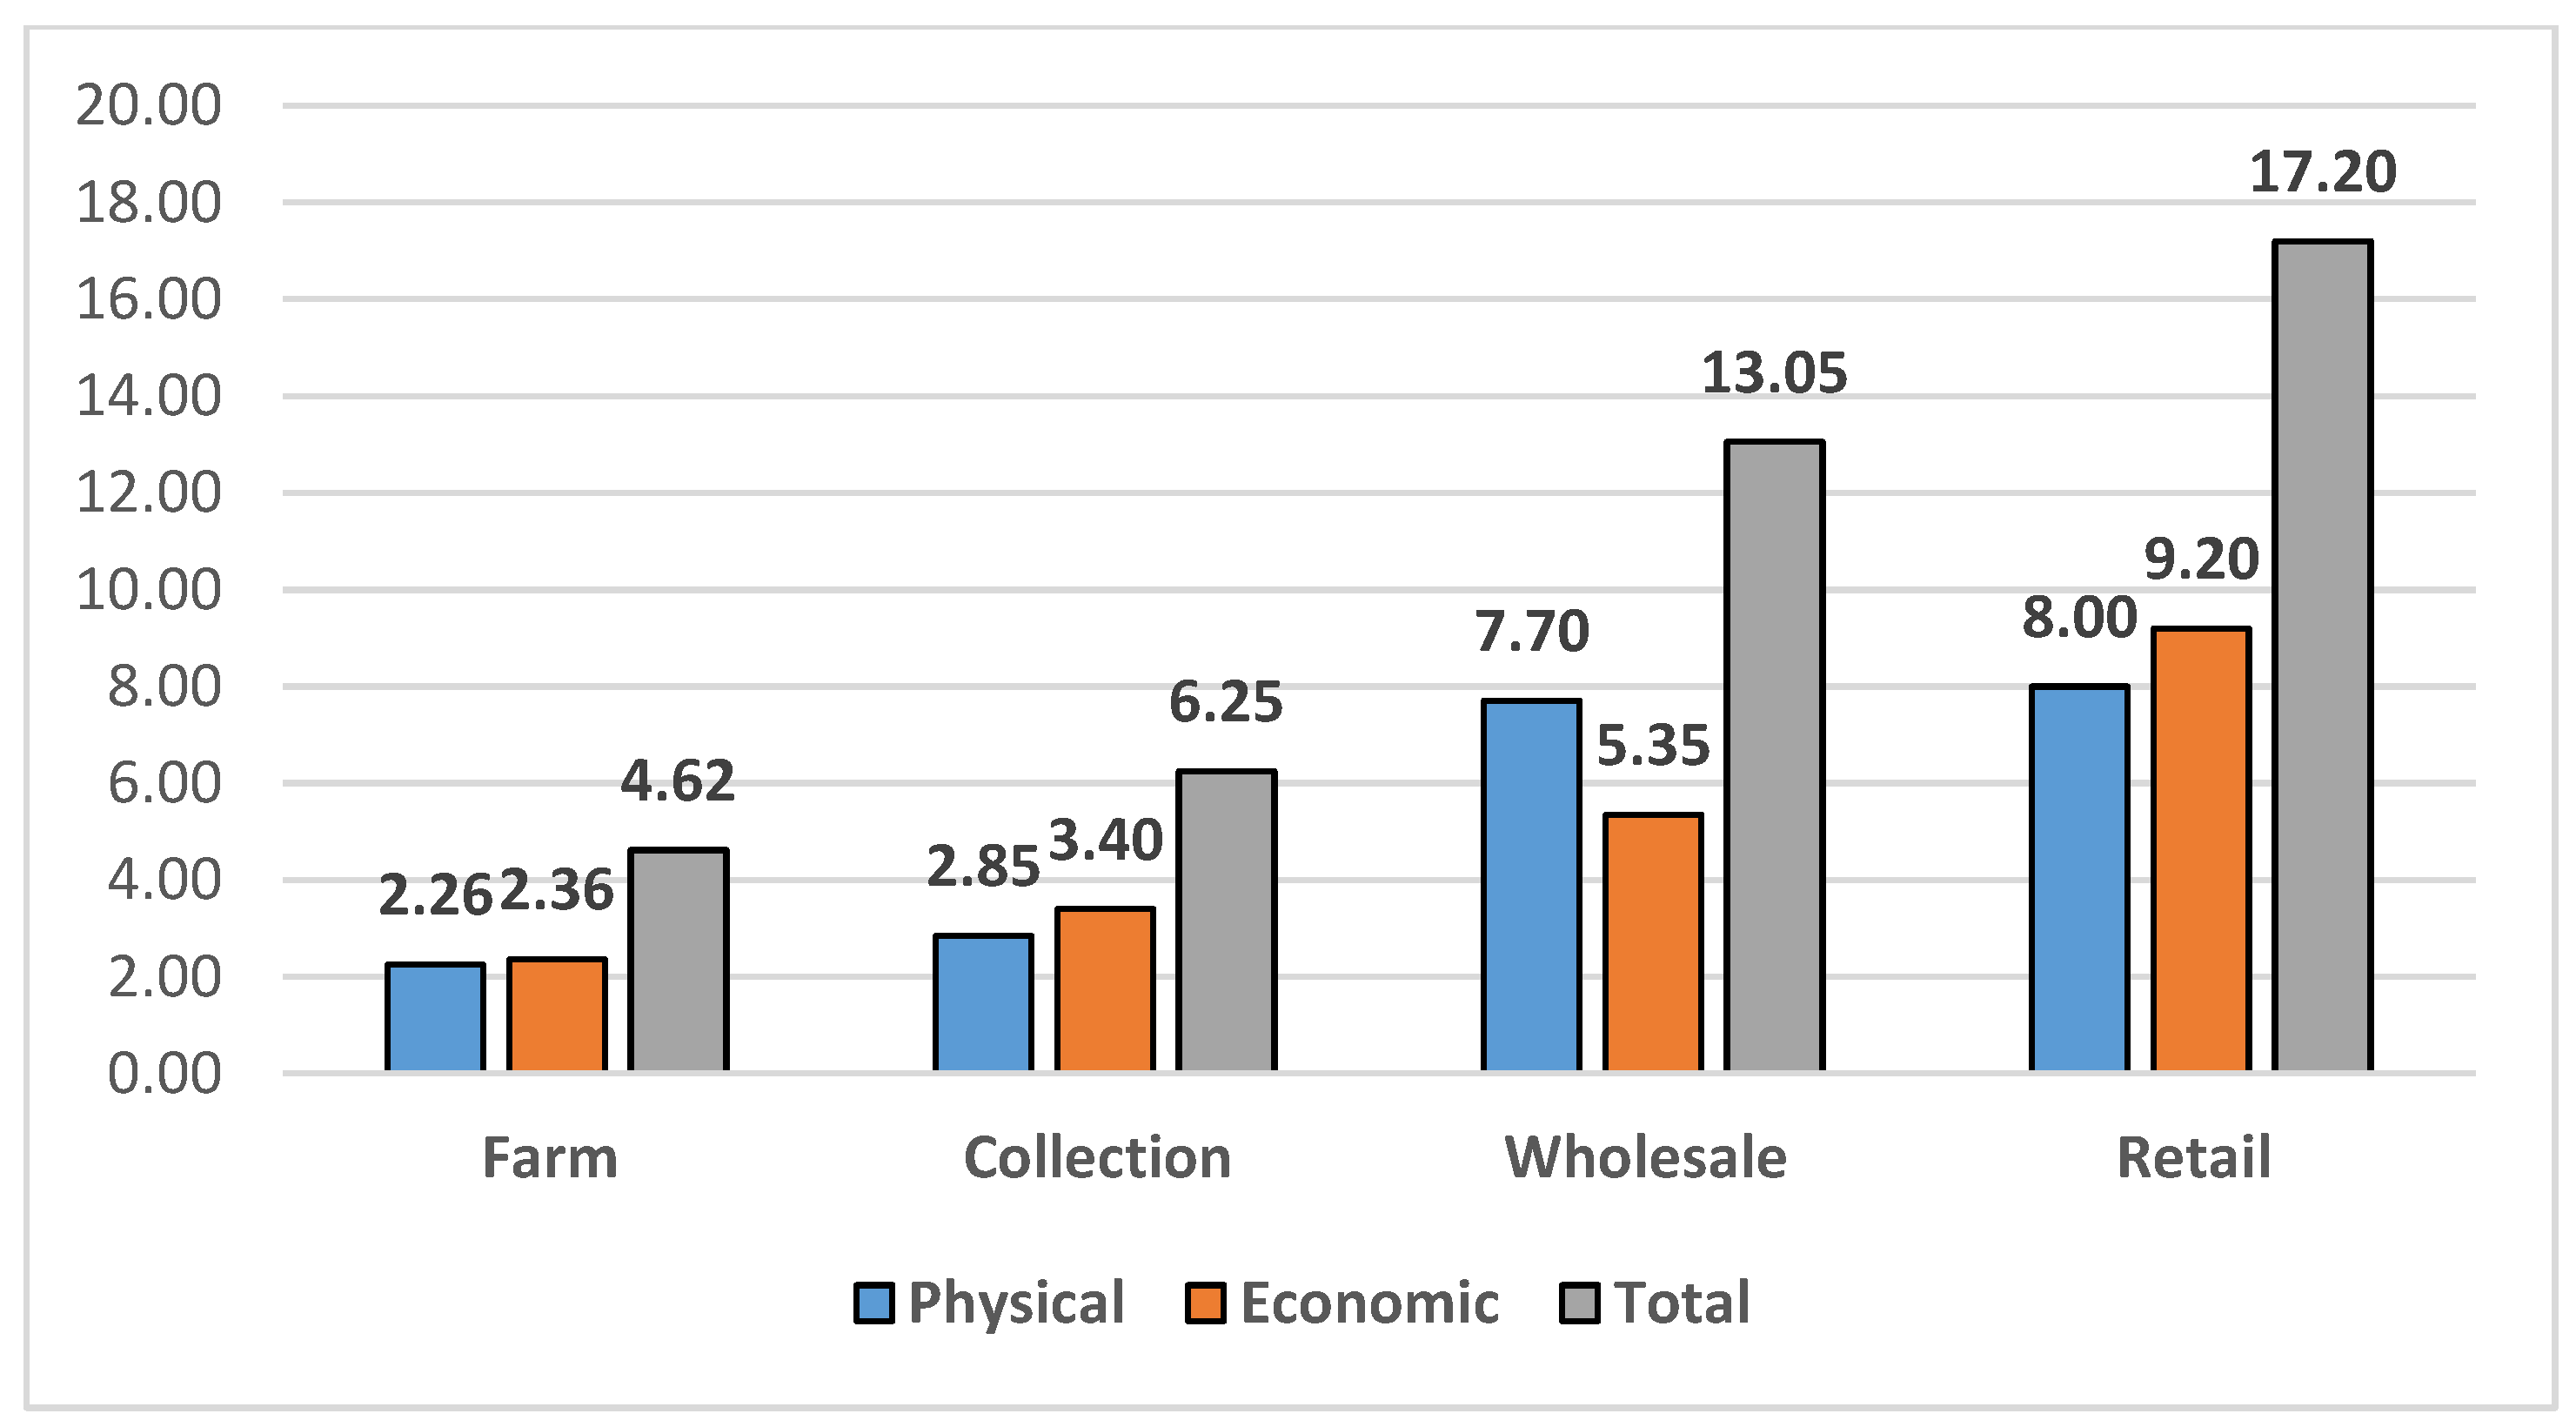
Survey data shows that approximately 36.5% of cooking bananas are produced and marketed in the scarce season, while 63.5% are produced and traded during the surplus season. The proportions of bananas in these two seasons were used as weights for calculating the average amount of banana affected by physical and economic losses at the various nodes of the value chain, as shown in
Figure 3. As hypothesized, the weighted means gave better estimates than simple unweighted means, which underestimate the losses. PHL from simple means are attached in
Figure A2 for comparison.
Results show that substantial amounts of banana are lost on farm. Losses at this level are caused by pests and diseases, poor harvesting practices, poor husbandry practices, and excessively long storage periods as farmers look for market. These result into bruising, ripening and splitting of banana fingers. Off the farm, bananas spoil more as they move along the value chain with cumulative effects of mishandling manifesting more as bananas move along the value chain. As a result, bruising and ripening are therefore more prevalent at retail level. From
Figure 2, it can be observed that most PHL (both physical and economic) occur at the retail level. Our findings are similar to Mebratie et al. [
20] in Ethiopia who report banana PHL at retail level to be 14.9% and Wanjari & Ladaniya [
28] who report physical banana losses at retail level to be 2.85% in India. In contrast, collectors and wholesalers handle mostly greener and fresher bananas that suffer less deterioration; this may explain why they incur relatively lower losses when compared to retailers. Collectors suffer the lowest losses in the value chain. This may be because they handle the crop for only limited periods transporting it over very short distances as they connect producers to wholesalers.
3.3.3. Extent of Postharvest Losses in the Banana Value Chain
In this study, the extent of postharvest losses in the banana value chain is estimated as the sum of the total physical and total actual economic losses in the value chain. However, it is extremely important to take into account that we found that on average, only about 35% of the total harvested cooking bananas actually leaves the farm for the market, the rest being consumed by the farm household.
Therefore, in calculating the total extent of physical losses in the chain, it was assumed that 65% of harvested banana incurs only on-farm losses (2.6%), while the remaining 35% (i.e., marketed banana) is affected by losses at all stages of the value chain, including on-farm. In computing the proportion of marketed bananas affected by physical losses we net off losses that are incurred at previous value-chain nodes since the produce lost at one node does not move to the next node (and cannot be lost again). Our results show that that 20.6% of traded banana is lost along the chain (1 − 0.974 × 0.969 × 0.920 × 0.915). It is worth noting that a direct sum of physical losses at the respective value-chain nodes without netting off losses at previous chains would have overestimated the physical losses at 22.2%. If the physical losses value of 20.6% obtained is extrapolated for all of the bananas produced in Uganda, it translates into a physical losses value of 8.9%.
The total PHL value of economic losses was calculated as a direct sum of the actual (net) economic losses at farm, collection, wholesale, and retail levels, resulting into a value of 9.9% (2.5 + 1.3 + 2.2 + 4.0), translating into an overall economic losses value of 3.5% for all of the cooking bananas produced in the country.
We then sum up the physical and economic losses to obtain the extent of PHL in the entire chain approximating to 12.4% of harvested bananas (corresponding to 30.5% of the traded bananas), of which 8.9% are completely lost, while 3.5% are sold at a discount due to quality deterioration.
PHL estimates from our study are considerably lower than the ones that were reported by the National Agricultural Research Organization, which estimates that over 35% of fruits and vegetables that are produced in Uganda are lost after harvest [
29]. Our PHL estimates are also lower that the ones that were reported by FAO [
3], which estimates the global value of PHL for fruits and vegetables to be 45% of total production. The low value of our estimates can be attributed to our adoption of a more rigorous estimation methodology, which eliminates double counting and controls for the bananas that are auto-consumed by the producing households. In addition, our results show that PHL in Uganda are lower than in Ethiopia where losses of 26.5% are reported in plantains [
20].
Our results also show that PHL in cooking bananas are approximately threefold the losses that are incurred in cereals in Uganda. Kaminski & Christiaensen [
17] report PHL for maize in Uganda to be 5.9%. Findings from our study fit into Aulakh et al.’s [
30] argument that perishables, like fruits and vegetables, are subject to the greatest proportions of PHL in developing countries because of the underdeveloped links between supply chain nodes in these countries.
3.4. Differences Between Producers and Retailers
Table 4 shows the descriptive statistics for the common variables used in econometric analysis. For the outcome variable, the proportion of banana incurring either physical or economic PHL, results show that retailers suffer higher PHL than producers. For the independent variables, education and sex were not significantly different between producers and retailers. However, differences in age and group membership are observed. Producers are more likely to belong to a group when compared to retailers. The data also shows that older people are more likely to engage in the production of bananas, while younger ones are more in retailing. This maybe because retailing in Kampala markets is a labour- rather than capital-intensive activity, which is more suited for younger people.
3.5. Mitigation Measures for Postharvest Losses
At production level, farmers suggested that if they can even out the supply throughout the year, then the tremendous losses in the surplus season will be reduced. All of the value-chain actors agreed that producing and marketing varieties with longer shelf life (as well as those that are more demanded by the market) can help to reduce losses that are caused by ripening. Farmers suggested that training in proper harvesting time can reduce immature harvests, thus reducing losses arising from selling immature bananas. Similarly, farmers hinted that fencing off banana plantations can help to reduce losses due to theft, but it would be costly to implement. Lorry traders suggested that improving roads in rural areas, transporting bananas at night (when temperatures are low) and proper packing of bananas on trucks can reduce losses during transportation. At the retail level, about half of the vendors also suggested that avoiding overloading could reduce bruising during transportation to the market. All of the value-chain actors believe that proper handling of bananas right from the farm to the market can reduce bruises. Finally, covering bananas with tarpaulins (perforated to avoid heat build-up) after harvest at farm level, during transportation, and at retail markets can reduce the exposure of bananas to direct sunlight, which in turn, can minimize losses as a result of scorching.
3.6. Determinants of Postharvest Losses at Farm Level
In determining the factors that affect postharvest losses at the farm level, we used both ordinary least squares (OLS) regression and Tobit regression. The R squared value for the OLS model was 0.637, and the model passed all the diagnostic tests performed. The DFBETAs, student, and standard residuals for the OLS model, were all within the prescribed limits. However, because 24 observations of the dependent variable had zero observations, a Tobit model was estimated. This is because using the common linear specification for models, such as OLS with a censored dependent variable, may result in biased estimates [
31]. The Tobit model fitted better than OLS model (i.e., χ
2(15) = 86.3; Prob > χ
2 = 0.000). As explained, the determinants of PHL at farm level are discussed based on the Tobit estimates. The factors influencing postharvest losses at the production level are presented in
Table 5. These estimates build on Equation (5), with total annual PHL as the dependent variable.
Results show that sex of the household head, household size, education, monthly production of bananas, specialization (proxied by the proportion of total land under bananas), and an interaction between district (Rakai = 1) and distance to tarmac road significantly influence the level of PHL at farm level. First, female headed farm households experience higher levels of PHL than the male-headed ones. This might be because of the intensive nature of banana production and marketing. Males in male-headed households are usually in charge of looking for markets, and, thanks to their greater mobility; that is, they tend to travel long distances away from their respective villages searching for markets for their produces, inputs, and other household needs when compared to female farmers [
31,
32,
33]. In so doing, men can even sell their banana to distant markets and this can reduce the level of physical losses, especially through ripening when compared to their female counterparts who mostly sell their bananas on farm. These results are similar to Mebratie et al. [
20] who found female headed households to incur higher postharvest losses than male headed households in Ethiopia. Contrary to findings by Aidoo et al. [
34], our results find that household size has a positive and significant coefficient. This could be that larger households (a proxy for labor) are more likely to grow more banana, and in turn, more likely to experience higher PHL, especially during surplus seasons. Furthermore, access to markets (proxied by distance to market and distance to tarmac roads) was found to have insignificant negative effects on PHL, but an interaction between distance to tarmac with the district variable (where Rakai district = 1 and Isingiro district = 0) resulted into a significant negative effect. This implies that farmers who are far from tarmac roads in the Rakai district (i.e., mean distance to tarmac is 14.4 km) have lower losses than Isingiro farmers who are further away from tarmac roads (i.e., mean distance to tarmac road of 39.7 km). This could be attributed to the levels of production in the two sites. Descriptive statistics shows that households in Isingiro produced approximately 450 more banana bunches (on 33% of the total land owned) per month when compared to the surveyed households in Rakai (occupying only 15% of the land owned). Similarly, UBOS (Uganda Bureau of Statistics) [
23] rank Isingiro as the biggest banana producing district in Uganda, and most of its banana producing farmers are far away from the tarmac road. Most farmers in Isingiro are therefore likely to incur more losses than Rakai district farmers with lower monthly production. Similarly, our results show that farmers producing more bananas per month experience significantly higher PHL than those that are producing fewer bunches per month. PHL have been found to be positively associated with the level of production [
19,
24]. In addition, farmers with at least secondary education have lower PHL than their counterparts with less education. Lastly, farmers who are more specialized and commercially orientated, (whose land is mostly occupied by banana) experience less PHL. In fact, commercial farmers are more aggressive at searching for markets, and this can help in reducing the physical losses they are likely to encounter. However, other factors, such as age of the household head, banana variety (using Kibuzi, with a longer shelf life), wealth (measured as total land), and group membership have no significant effects on PHL.
3.7. Determinants of Postharvest Losses at Retail Level
We used ordinary least squares regression to determine the factors that influence postharvest losses at the retail level. The R-squared of the model was 0.584, implying that 58.4% of the retailers’ losses were explained by the explanatory factors in the model. The mean VIF was 1.34, meaning that the explanatory factors were independent of each other. The DFBETAs, student, and standard residuals were within the acceptable limits of −2 and 2. The Cook’s distance values of all the explanatory variables in the model were also between the acceptable ranges of 0 and 1. This means that no one single explanatory variable had a great effect on the dependent variable (postharvest losses).
Regression results in
Table 6 show that sex, group membership, source of bananas, and information shared with suppliers are key factors in determining PHL at the retail level. The negative coefficient for sex shows that female vendors have lower losses in comparison to their male counterparts. This finding is consistent with Mebratie et al. [
20], who report female banana retailers to have lower losses in Ethopia. The underlying reason could be that female retailers are better handlers of bananas. Results further suggest that retailers who are in groups have lower PHL than non-members. Through collective action, group members usually purchase in bulk at lower prices directly from producers, this gives group members access to clean, mature, and fresh banana fruits at lower prices, which may allow for them to have a higher turnover and lower losses. Furthermore, sources of banana bunches/fingers and the information shared with suppliers also affected the level of PHL significantly. Retailers who source banana bunches from nearby markets and directly from producers have lower PHL than those who purchase from suppliers who are mostly wholesalers from distant areas. It can be argued that retailers who source their own bananas (for instance from the farm) do more quality assurance, and therefore purchase bananas with less damage, and this directly translates into lower PHL. Depending on the type of information shared with suppliers, results further show that retailers who mostly sought information on prices have higher losses than those who seek for information on quality (quality measured as freshness of the banana bunch/fingers). Traders that are mostly interested in prices may pay less attention to inspection and quality assurance, and, as a result, experience higher losses resulting from bruising and ripening.
4. Conclusions
This study examined the extent and determinants of postharvest losses in the cooking banana value chain in Uganda. The results show that reliable estimation of PHL along the chain depend not only on the quality of the data collected—often a major challenge in the midstream and downstream segments of a value chain—but also on adequately taking into account specific value chain characteristics, such as storage and handling at the farm level, during transport, and at the retail outlets. We have shown that a solid estimation that helps to prioritize interventions and policy change should: (1) be mindful of the end-use destination of the crop (market vs. own-consumption); (2) focus on both physical and economic losses as the latter affect a higher proportion of traded produce; (3) determine the physical and economic losses along the different stages of the chain and for the chain as a whole; and, (4) account for the relative and absolute weight of a given crop across different types of production systems. PHL need to be understood in a broader context, including economic considerations, environmental externalities (e.g., avoidable greenhouse gas emissions linked to the produce that eventually is lost), and social aspects (e.g., labor that could have been invested in alternative farming or income generating activities). The total volume of PHL will be a critical parameter for such integrated assessments.
In the case of our study, PHL affects 14.9% of the produced volume of cooking bananas, translating into 1.1 million tons/year lost in terms of physical or economic losses along the value chain. This represents significant food losses to consumers, equivalent to 21.3 kg per person per year, along with considerable income losses to producers, wholesalers, and retailers. Strategies to reduce PHL need to focus on the different stages where these occur, particularly at the retail level, but also at the farm, transport, and wholesale levels. Such integrated strategies would include, for example, utilising ripened cooking banana fingers as a source of raw material for processing into another product, such as pancakes (locally known as Kabalaga). This would contribute to transform some of the physical losses into economic losses at the farm and retail levels, as there is still a product to sell, even if at lower price. Further interventions include the development of product and handling standards from production through consumption. At the transport level, moving bananas in boxes would protect against bruising, minimizing both physical and economic losses. At retail level, interventions can foster innovations, such as selling of bananas as fingers and clusters, as opposed to bunches, using ripening control chemicals, like ethylene for timebound selling, and offering packed and peeled bananas for increased shelf life and as convenience food. Peeled bananas have numerous advantages, as the peels can be used for on-farm production of organic manure, reducing transport weight, and minimizing waste in urban consumption areas. This is particularly important in countries, like Uganda, where waste disposal is largely uncontrolled (e.g., large quantities of waste are deposited in water channels with far reaching effects on human and ecosystem health). Further reduction of PHL can be achieved through processing of bananas into semi-elaborated (e.g., banana flour) or elaborated products (e.g., convenience food ready for cooking or direct consumption). This requires investment in processing technologies and equipment, for example, in the framework of public-private partnerships.
The principal determinants for PHL at farm level were sex of household head, household size, education, monthly production, and proportion of land under banana. At the retail level, they included sex of the vendor, participation in traders’ groups, source of bananas, and information shared with suppliers. Complementary interventions targeting producers need to focus on increasing farmer mobility (particularly of female headed households) to access bulk markets, farmer organization, and infrastructural improvements. Similarly, interventions at retail level can contribute to enhanced organization of traders and use of modern information and communication technologies for improved linkages with the sourcing areas and tracing of the produce along the value chain.
There is a need to sensitize key value chain stakeholders on PHL and their economic implications, and to involve them in the co-creation of strategies that are aimed at minimizing such losses. The pay-off of viable, co-designed strategies will come in the form of increased food security, particularly in areas where cooking banana is a staple, and reduced pressure on natural resources as less farmland and inputs are needed. Finally, reduced PHL imply higher value chain efficiency, and, consequently, lower costs that can translate into higher trader margins and lower consumer prices, making banana production more sustainable altogether.

 ,
, 


