Article

Environmental Proactivity and Firms’ Performance: Mediation Effect of Competitive Advantages in Spanish Wineries

by
Beatriz Junquera
1 and
Virginia Barba-Sánchez
2,*
1
Department of Business Administration, University of Oviedo, Avda. Cristo S-N, E-33071 Oviedo, Asturias, Spain
2
Department of Business Administration, University of Castillla-La Mancha, ESII, Paseo de los Estudiantes s/n, 02006 Albacete, Spain
*
Author to whom correspondence should be addressed.
Sustainability 2018, 10(7), 2155; https://doi.org/10.3390/su10072155
Submission received: 24 May 2018 / Revised: 15 June 2018 / Accepted: 20 June 2018 / Published: 25 June 2018
(This article belongs to the Special Issue Sustainability in SMEs)

Abstract

:
The main aim of this paper is to show the extent to which environmental proactivity is able to generate competitive advantages in a firm in order to improve their economic-financial performance by introducing the role of managerial perception into the analysis. This study focuses on Spanish wineries and their environmental practices and covers a total of 4598 wineries with a sample of 142 valid responses during the month of November 2015. The results can be summarized as follows. Firstly, there is positive environmental proactivity in terms of obtaining both cost-based and differentiation-based competitive advantages. Likewise, this proactivity has a positive impact on the manager’s perception of performance. Secondly, obtaining differentiation-based competitive advantages has a positive impact on the manager’s perception of performance although a negative impact on performance itself. There is, however, no significant evidence of the impact of cost-based competitive advantages on financial performance nor on the perception of performance itself, nor the impact of environmental proactivity on financial performance.

1. Introduction

Environmental management involves both technical and organizational actions which aim to reduce environmental impacts and minimize their consequences on the natural environment [1]. Moreover, environmental management today must be considered from a strategic perspective so that it does in fact have a positive effect on competitiveness [2].
In this context, environmental proactivity is defined as “the voluntary implementation of practices and initiatives to improve environmental performance” [3] (p. 88). This environmental proactivity includes environmental management systems, the design and development of more environmentally-friendly products and processes, and finally informing the public about the firm’s environmental impacts.
The positive influence of proactive environmental approaches on competitiveness can be examined by means of their impact on costs and differentiation, generally based on the results of specific innovations and activities undertaken by proactive enterprises [4]. It is therefore possible to distinguish two ways in which environmental action can act as a source of competitive advantage. The first way concerns the emergence of market niches where special value is added when attempts are made to enrich the environmental dimension [5,6]. Similarly, market place differentiation can emerge through the commercialization of environmentally-friendly products or thanks to a firm’s green image [7,8]. In fact, business opportunities arising from accepted environmental products offer useful tools to gain a competitive advantage linked to an environmental action [9,10].
However, there can also be an indirect improvement in competitiveness based on environmental activity. Various articles refer specifically to the fact that innovative activity in the natural environment field probably creates and reinforces a firm’s unique capabilities [11,12,13]. Environmental action can therefore affect non-environmental factors [14,15,16,17]. Environmental actions may well be able to boost a company’s reputation [18] by improving product quality [19]. Environmental action can also generate knowledge that contributes to the firm’s overall innovative capacity [18]. Likewise, environmental practice results in an improvement in efficiency [20,21]. Firms that are able to create capabilities will be more likely to embrace investment to protect their natural surroundings in a different way [22]. Based on these lines of thinking, various publications indicate the need to conduct studies to analyze the learning processes for tackling environmental problems [23].
The influence of environmental activity on different dimensions of competitiveness is connected with the fact that environmental activity is interdisciplinary by nature [24,25]. Many studies have already emphasized that environmental problems must be tackled from within the company as a whole [26]. On another level, Banerjee [27] highlighted the importance of functional strategies including Research & Development & Innovation (R&D&I). It is important to remember that managers face growing demand to develop not only new, environmentally-friendly products [28,29,30,31], but also new processes, which in recent decades have then been incorporated into the supply chain [32] with their subsequent effect on cost-based competitive advantages.
Very few studies, however, have explored the connection between environmental proactivity and the generation of competitive advantages, examining cost-based and differentiation-based advantages separately [33], and not have any conclusive results been obtained about the impact of this relationship on business performance [20,34,35,36], and only a fiew authors have analyzed the mediating factors that might affect such relationships.
In this context, the main contributions of this paper are firstly to analyze the effects of environmental proactivity on the generation of competitive advantages distinguishing between cost-based and differentiation-based advantages; secondly, to contribute to the debate about the impact of environmental proactivity on business performance distinguishing and comparing the impact both on the manager’s perception of performance and on economic-financial performance; and thirdly, studying the mediating role that the generation of competitive advantages can have on both types of results. In particular, there are only a few studies on this subject in the winery sector.
In order to realize these objectives, the article is organized as follows: Section 2 presents the theoretical approach; Section 3 examines the methodology used; Section 4 discusses the results; and, finally, Section 5 outlines our conclusions.

2. Theoretical Approach

Environmental proactivity is defined as “the voluntary implementation of practices and initiatives aiming at improving environmental performance” [3] (p. 88). It has also been conceptualized as competitive capabilities that characterize the best environmental practices, which advance and prepare companies for future changes in regulations and social trends [37] with the aim of improving, redesigning and/or transforming operations, processes and products to continuously combat the negative impacts on the natural environment [11,38,39,40].
By pursuing actions to implement proactive environmental strategies, companies endeavor to prevent pollution, minimize their environmental impact, reduce waste, optimize consumption, and use clean technologies [13,41,42]. From the managerial perspective, such actions include planning and control [43,44,45] and also employee involvement given the key role that human capital plays in the implementation of the most successful environmental strategies [11].
Companies can achieve a sustainable competitive advantage developing proactive cost-based and differentiation-based environmental strategies, so that the positive influence of environmental management on competitiveness can be valued through its impact on costs and differentiation [2], generally because of innovative performance and specific capabilities developed by proactive businesses [20]. In the same way, the positive impact of environmental management on competitiveness can be examined in terms of its impact on costs and differentiation [2] generally as a result of innovations and on the specific capabilities developed by proactive companies [20].
The concept of green differentiation rests on the idea that reducing pollution will result in increased demand by environmentally-aware consumers, whose purchase decisions are influenced by the product’s environmental features [46,47]. In turn, this will also enhance the company’s reputation [48], leading to an increase in sales and in turn prices [49].
The environmental result can also enable an innovation-based competitive advantage to be achieved thanks to product differentiation [20,50], selling pollution control technology [50], creating entry barriers [38,51] and developing new opportunities and better market access [50].
Green differentiation concept is supported based on the idea that the demand by eco-sensitive consumers, whose purchasing decisions are influenced by environmental product characteristics, can be increased by pollution reduction [46,47]. On the other hand, it could strengthen business’ reputation [48], which means that these businesses increase their revenues, although simultaneously prices do the same [49].
Likewise, environmental performance may allow for achieving an innovation-based competitive advantage by product differentiation [4,50], as well as selling pollution control technologies [50], creating entrance barriers [38,51] and developing new opportunities and better access to new markets [50]. Consequently, we can deduce the following hypothesis:
Hypothesis 1a (H1a).
Environmental proactivity has a positive impact on the generation of differentiation-based competitive advantages.
The concept of eco-efficiency entails the creation and development of goods while reducing their negative impact on the natural environment [52], with pollution being considered as a sign of inefficiency [20]. Actually, pollution is perceived as a sign of inefficiency [20]. In order to improve their efficiency, businesses can create standarised ecological designs, use clean technologies or conserve resources, among other actions. As a result, these actions lead to environmental performance and, simultaneously, contribute to cost reduction. On the one hand, using clean technologies allows businesses to comply with regulation, new product designs lead to reducing resource use and, consequently, improving productivity. On the other hand, and as a consequence of these actions, businesses can reduce and avoid legal responsibilities [50]. As a result, we can deduce the following hypothesis:
Hypothesis 1b (H1b).
Environmental proactivity has a positive impact on the generation of cost-based competitive advantages.
The first key reason for environmental proactivity is to improve a firm’s profitability in the long term [53]. This means that a company can reduce costs thanks to its proactive environmental strategy, either in terms of complying with legislation, reducing or avoiding legal responsibilities and the amount of waste, and also improving efficiency and productivity [11,12]. This all impacts the firm’s performance directly so that we could formulate the following hypothesis:
Hypothesis 2a (H2a).
Environmental proactivity positively impacts the company’s economic-financial result.
The impact of external agents (e.g., competitors) can at times be so important that it might even exceed that of the company itself. As a result, competitors together with other external pressure groups are seen as more environmentally proactive. Managers therefore consider that environmental proactivity will make their companies better than others thanks to the improvement in their firm’s reputation [11]. Not only that, but managers will also be motivated competitively, even though their environmental proactivity might be more symbolic than substantive in order to enhance their company’s reputation without this entailing a cost advantage arising from a better environmental performance [54]. In this way, the following hypothesis can be formulated:
Hypothesis 2b (H2b).
Environmental proactivity has a positive impact on the manager’s perception of performance.
As mentioned previously, the improvement in reputation arising from the implementation of more proactive environmental approaches leads to an increase in sales accompanied by a simultaneous rise in prices [49]. That is, when proactive environmental strategies are carried out, companies improve their reputation by their image among population and by their products’ image in the market, so that this business’ products are valued better and consumers accept to pay much more for its products. As a result, these businesses are capable of increasing their products’ prices increasing their sales simultaneously their sales because of their better reputation. This can be achieved in two ways linked to the environmental question. Firstly, the people who reduce pollution can increase demand for environmentally-friendly manufacturers whose purchase decisions will be influenced by the “greenness” of their products [46,47], which in turn strengthens their reputation [48]. The second way is by means of differentiation by offering ecological products [20,47], selling pollution-control technology [47], creating green-based entry barriers [35,48] and developing opportunities for accessing markets based on this green dimension [47]. This enables the following hypothesis to be formulated:
Hypothesis 3a1 (H3a1).
Differentiation-based competitive advantages arising from environmental management mediate the relationship between environmental proactivity and economic-financial performance.
Nevertheless, what differentiates a company does not only depend on its own ability to manufacture something different or cleaner since consumers themselves are often not capable of either valuing or distinguishing this differentiation [55]. In these cases, this green differentiation is negatively associated with business performance, although industries where ‘green’ differentiation is not well-accepted in the market is more feasible. Similarly, in sectors such as wineries, for example, this has been suggested by the results of certain work, although no definitive relevant results exist [56]. From this, the following hypothesis can be formulated:
Hypothesis 3a2 (H3a2).
Environmental competitive advantages negatively mediate the relationship between differentiation-based competitive advantages and economic-financial performance.
Companies with differentiation strategies can base this differentiation on the idea that ecological actions are the most suitable from a moral and ethical perspective. Company managers are aware that they and they are only responsible for this situation based on their own management and ethical values. in a business. These managers therefore convert the green question into part of their organizational routine and something that senior management considers to be the best way to do things [53]. Managers therefore consider their responsibility to be paramount to improve a company’s reputation and consequently simultaneously achieving financial and environmental benefits in the long term. From this, we can formulate the following hypothesis:
Hypothesis 3b (H3b).
Environmental, differentiation-based competitive advantages mediate the relationship between environmental proactivity and the manager’s perception of performance.
Although the development of environmental technologies to achieve an environmental competitive advantage increases costs in the short term as a result of the green technologies that must be purchased or developed, social pressure groups mobilizing public opinion against the company with strike action, public protests and calls for involvement [57] could damage a firm’s reputation [58] and this would entail an immediate loss of revenue due to reduced sales. It is therefore possible to formulate the following hypothesis:
Hypothesis 3c1 (H3c1).
Environmental, cost-based competitive advantages mediate the relationship between environmental proactivity and economic-financial performance.
Certain environmental technologies can provide companies with an environment-based competitive advantage. Depending on various surrounding factors, such as the type of legislation in force either to control waste and emissions or to plan risks of environmental damage, companies can encounter the need to use relatively costly technologies to achieve this environmental competitive advantage which cannot offer a sustainable competitive advantage because they are readily available on the market [59]. In this framework, we can formulate the following hypothesis:
Hypothesis 3c2 (H3c2).
Environmental, cost-based competitive advantages negatively mediate the relationship between environmental proactivity and economic-financial performance.
In order to achieve environmental, competitive advantages, it is essential for managers to have the capacity to influence general company decision-making affecting the results of their environmental approach and competitive advantages will be achieved if managers fully embrace these actions [60]. If they do not, the only consequences will be limited to compliance with legislation and so the competitive environmental advantage obtained (which will benefit cost reduction) will be perceived by the managers as their exclusive responsibility, so that they will feel directly responsible for these achievements [61]. When an environmental manager has no authority in the company to make decisions, they are not made in a competitive level, but a functional one. When a new environmental technology is implemented in a functional level, it could improve environmental performance, but the lack of the manager’s authority avoids achieving a better financial performance. When environmental managers are senior managers, they have authority to linked environmental actions to competitive strategy, so that they can use this kind of technology to improve competitiveness in a business. We can therefore formulate the following hypothesis:
Hypothesis 3d1 (H3d1).
Environmental, cost-based competitive advantages mediate the relationship between environmental proactivity and the manager’s perception of performance.
Despite the fact that environmental approaches might give rise to competitive cost-based advantages, various managerial factors might create a barrier to discovering such opportunities [62]. In this context, the responses of the different organizational levels depend on the values of the firms [63].
Managerial approaches in relation to how managers perceive performance vary according to how environmental issues are interpreted [64] and whether these are interpreted by managers as threats or opportunities [65], and whether managerial, organizational drivers exist that are specifically concerned with environmental matters and which in turn are capable of boosting green-based competitive advantages [66]. As a result, if managers in a business do not know how to discover opportunities in an environmental action, their capability to achieve an improvement (a cost-advantage, for example) diminishes. It is a specific Pigmalion effect. Consequently, if managers cannot perceive opportunities, it is difficult for them to implement actions with this aim because of their lack of training. The following hypothesis can therefore be formulated:
Hypothesis 3d2 (H3d2).
Environmental, cost-based competitive advantages negatively mediate the relationship between environmental proactivity and the manager’s perception about performance.
To sum up, stemming from the above arguments we expect that differentiation-based and cost-based competitive advantages are mediating variables in the relationship between environmental proactivity and company performance. Figure 1 depicts the theoretical model proposed in our study. As the figure shows, we examine the relationship between environmental proactivity (superordinate multidimensional construct composed of its EPA, ERO and EMC dimensions) and competitive advantages (Hypotheses 1). In addition, we analyze the influence of the environmental proactivity on company performance (Hypotheses 2). Finally, we evaluated the mediating effects of the two types of competitive advantages on the relationship between environmental proactivity and company performance (Hypotheses 3). Firm size and age were used as control variables in order to eliminate their effects on firm performance [67].

3. Materials and Methods

3.1. Data Collection and Sample

This study focuses on Spanish wineries and their environmental practices. According to Camerdata [68], there are a total of 4598 wineries spread unevenly throughout Spain. Information about the population has been gathered in two stages. In the first stage, a questionnaire was compiled, tested and completed by Spanish winery managers during the month of November 2015 to obtain 312 valid answers (see [69]). In the second stage, this information was supplemented by searching for the wineries that had completed the questionnaire in the SABI database (System of Analysis of Iberian Balances). [70] to obtain financial data during the month of September 2017. Two sources of supplementary information were chosen to measure the results, since as Feng et al. [71] (p. 785) state “respondents were more open to offering their perceptions rather than offering precise quantitative data”. The reason for the time gap between the two stages was due to the delay in the publication of data for the SABI database, although financial data also covers the 2015 year. Full information for 142 wineries was eventually obtained and this represented a sampling error of 8.1% (p = q = 0.5) for a confidence level of 95%. This was considered to be acceptable since it was between 5% and 10% [72].
We analyzed the data using structural equation modelling (SEM) because this has certain advantages over traditional multivariate techniques [73]. More specifically, we used the partial least squares (PLS) technique with SmartPLS3 software (version 3, SmartPLS GmvH, Boenningstedt, Germany) [74]. This technique has been used previously in similar studies because of its ability to predict one or more dependent variables of a model with a limited theoretical base [75]. Additionally, SEM techniques are particularly recommended for testing the mediation hypothesis [76,77].

3.2. Measures

In order to measure all the variables except for the ones relating to financial performance (FP), a 5-point scale was used so that the respondents could express their level of agreement or disagreement with a series of statements, where 1 represented “strongly disagree’’ and 5 ‘‘strongly agree’’. This scale was chosen as it is easier for decision makers to mark compared to other point scales [45]. All the constructs and variables together with their sources are detailed in Appendix A.

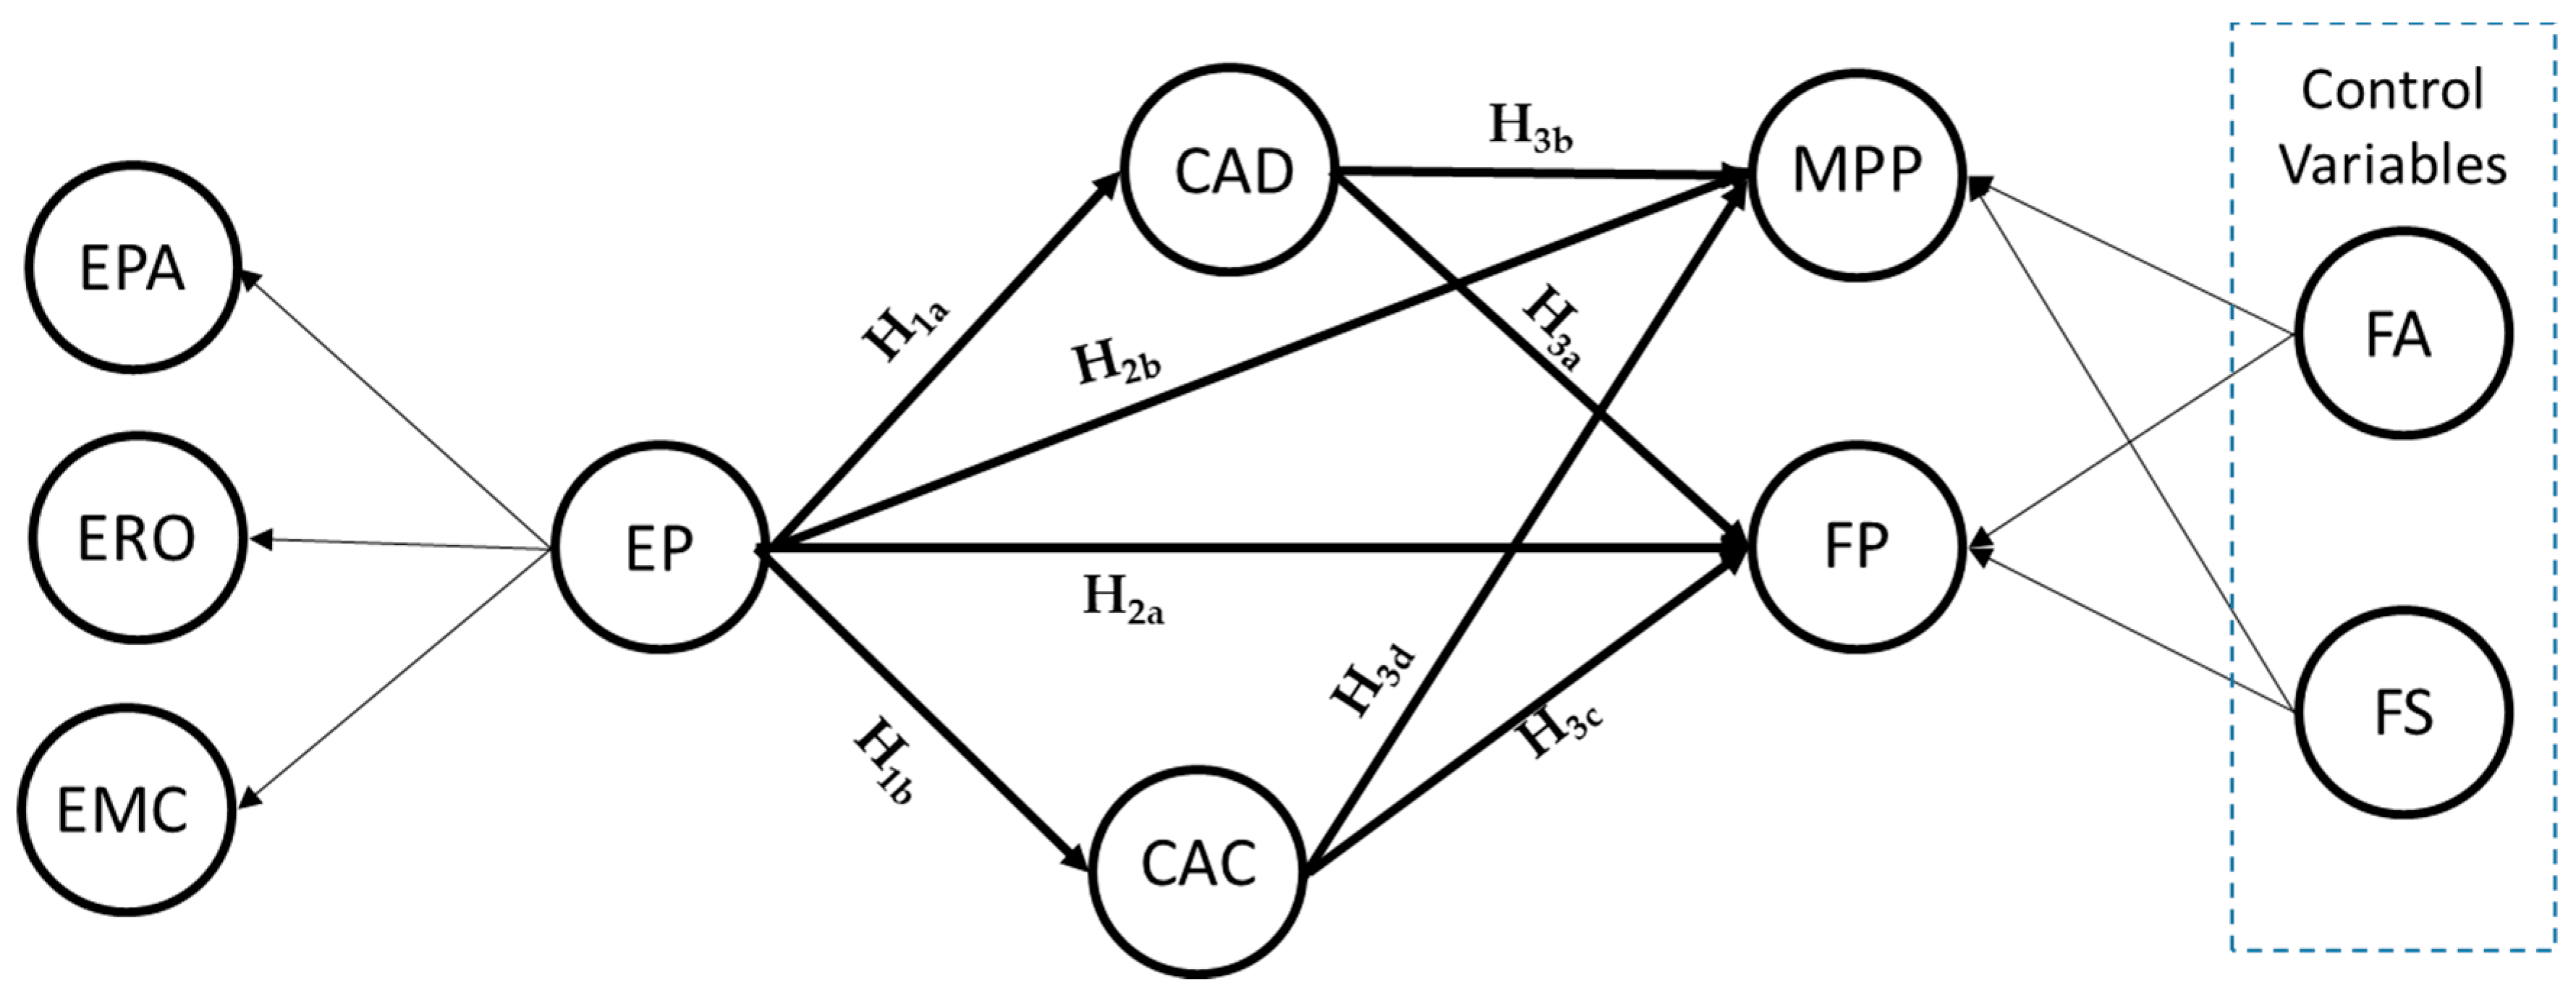
3.2.1. Environmental Proactivity

Following Barba-Sánchez and Atienza-Sahuquillo [69], we consider environmental proactivity (EP) to be a multidimensional construct [78], whereby three different dimensions can be identified in the sphere of wineries (see [69]):
  • Environmental planning and analysis (EPA): this dimension comprises five items which evaluate the integration level of environmental concerns in the winery’s strategic planning process.
  • Environmental responsibility and organization (ERO): this dimension comprises three items and reflects the importance placed by the winery on the environment and the communication of environmental values to its members.
  • Environmental management control (EMC): this dimension comprises four items relating to feature rules, standard operating procedures and result controls.

3.2.2. Competitive Advantage

As López-Gamero and Molina-Azorín [49] propose, we considered two groups of items to measure this variable:
  • Differentiation-based competitive advantages (CAD): This variable included four items taken from Banerjee et al. [27] and López-Gamero et al. [79]. More specifically, in our study, we use loyalty of existing customers, attracting new customers, product image, and corporate image.
  • Cost-based competitive advantages (CAC): In order to assess cost-based competitive advantages, we opted for a similar approach to the one adopted by Atienza-Sahuquillo and Barba-Sánchez [80] and Sen et al. [81] who use items relating to water, energy and raw material consumption.

3.2.3. Company Performance

As we have already mentioned, company performance was measured in our study by questioning the interviewed managers and using the information contained in the SABI database. We therefore have two ways of measuring company performance:
  • Financial performance (FP): Following López-Gamero et al. [79], Sen et al. [81] and Endrikat et al. [82], we employed return on asset (ROA), return on equity (ROE), and value-added to measure financial performance.
  • Manager’s Perception of Performance (MPP): A subjective measurement has been obtained by asking the winery managers to assess the effect that implemented environmental practices have had on four items in terms of an increase in turnover, exports, and long-term and short-term profits following the proposal by Sellers-Rubio [83] and Sambasivan et al. [45].

3.2.4. Control Variables

In this study, we have used two control variables which are generally accepted by environmental literature [45,79,81]: the size of the company and its age. The size of the company is measured on the basis of two items: number of employees and turnover; and was included to control the effect of scale economies on FP [2]. The age of the company is understood to be the total number of years that the winery has been operating and was included to control the effect of organizational rigidity on FP and MPP [84].

4. Results

This section details the results obtained for the proposed research model. Given that the structural equation models comprise two submodels [75,85], we shall first describe the results for the measurement model, which specifies the relationships between constructs and their indicators, before those relating to the structural model, which contains the relationships between constructs. This sequence will ensure that we have suitable indicators for the constructs before attempting to reach conclusions about the relationships included in the structural model [75].

4.1. Measurement Model

Following previous work [73,75,85], we assessed the measurement model in terms of individual item reliability, construct reliability, convergent validity, and discriminant validity. Firstly, in order to ensure individual item reliability, it was necessary to discard various items from the original model proposed due to their outer loadings being below the recommended cut-off value of 0.7 [75], although Hair et al. [73] indicate that items with loadings of between 0.4 and 0.7 could be preserved if they contributed to improving content validity. More specifically, we have excluded Item epa5 from the environmental planning and analysis construct, Item ero1 from the environmental responsibility and organization construct, Item cac2 from the cost-based competitive advantage construct, and Items mpp3 and mpp4 from the manager’s perception of performance construct (see Table A1). Secondly, we used Cronbach’s alpha and Dijkstra-Henseler’s rho coefficients and composite reliability (CR) to evaluate construct reliability. As Table 1 shows, all the constructs exceed the recommended cut-off value of 0.7 [73,86] for these three measurements. Thirdly, convergent validity was proved since the average variance extracted (AVE) for each construct was higher than 0.5 (see Table 1). Finally, Table 2 shows that all the first-order constructs attain discriminant validity following the Fornell–Larcker criterion [87].

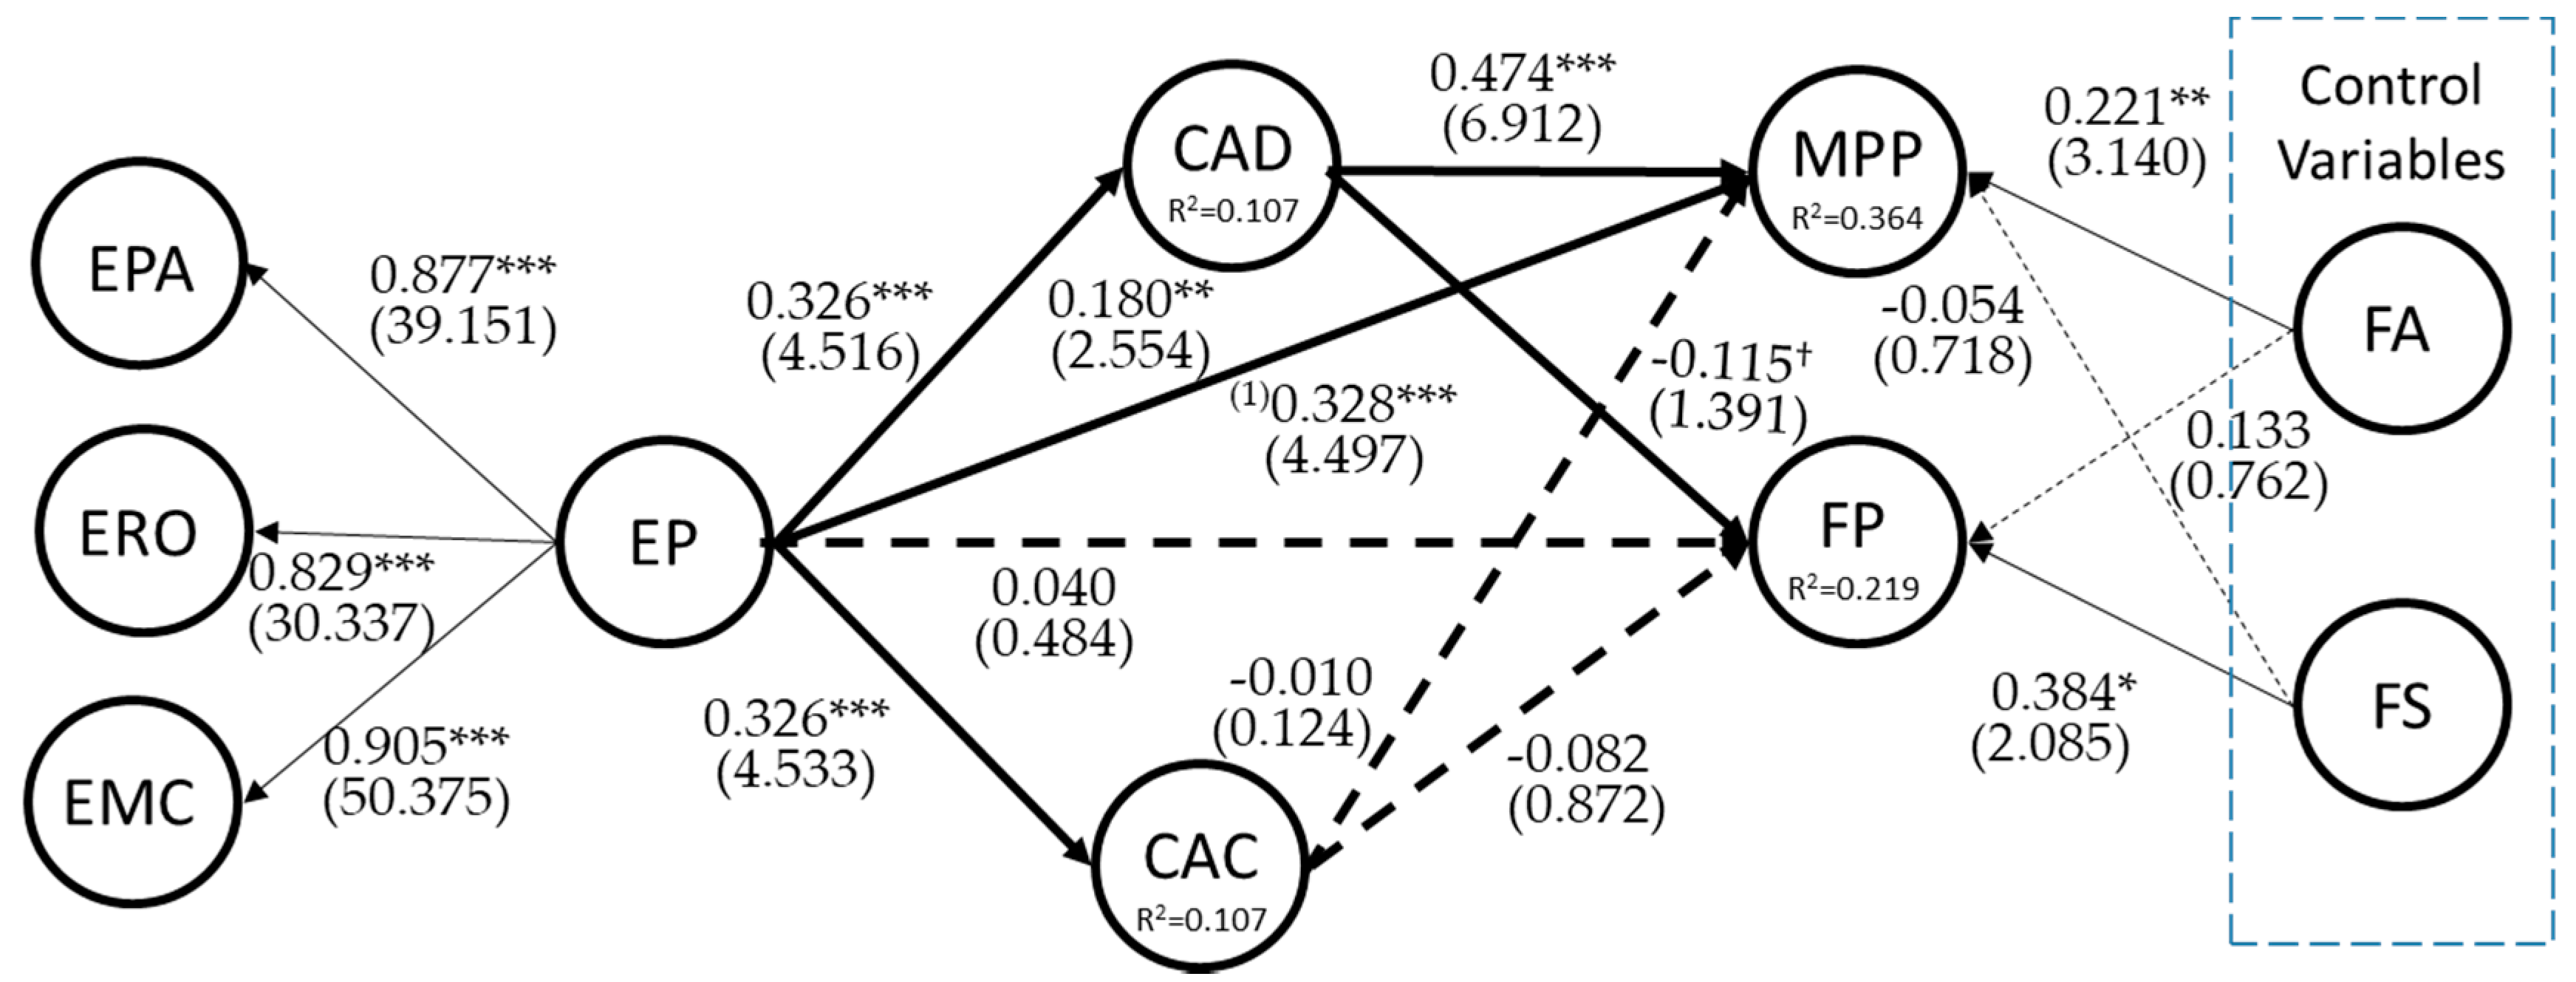
4.2. Structural Model

By using Bootstrapping (5000 resamples) to generate the t-statistics, we have been able to evaluate the significance level of the path coefficients and these are the direct effects of the relationships gathered in the proposed model (see Table 3). The data reveal that environmental proactivity generated competitive advantages both in terms of differentiation (H1a: β = 0.326; p < 0.001) and in costs (H1b: β = 0.326; p < 0.01) in addition to improving the manager’s perception of business performance (H2b: β = 0.180; p < 0.001). However, environmental proactivity does not significantly affect the firm’s financial performance, which is why H2a is not supported.
Regarding the impact of competitive advantages on business performance, this varies according to the type of competitive advantage (differentiation-based or cost-based) and to how these results are measured. For this reason, CAD significantly affects both the FP (H3a: β = −0.115; p < 0.1) and the MPP (H3b: β = 0.474; p < 0.001). However, the significance level is lower in the first case and the sign as well, positively affecting the MPP, while negatively affecting the FP. On the other hand, the impact of the CAC is negative and insignificant in both cases, and so H3c and H3d are not supported.
Additionally, the R2 and Q2 values were obtained to verify whether the model has predictive relevance. As Table 3 shows, all R2 values were greater than 0.10 and all Q2 values were also higher than 0 [88], which confirms that the structural model has satisfactory predictive relevance for every endogenous construct. From observing the individual contribution of each explanatory variable to the R2 of the construct (see Table 3), the results confirm the predictive relevance of the model, except in the case of the FP where the control variable FS contributes the highest percentage (16.51%).
We also evaluate the model with the standardized root mean square residual (SRMR), which represents the average of all standardized residuals and can be interpreted as the average discrepancy between the correlation matrices of the observed sample and the hypothesized model. Hu and Bentler [89] recommended a cutoff value close to 0.08 for SRMR, but various studies have shown the importance of sample size on the performance of fit indexes such as this [90,91]. Taasoobshirazi and Wang [91] indicate that the SRMR will be lower when there is a high number of parameters in the model and in models based on large sample sizes, and so a value lower than 0.1 would be acceptable [90]. Our research model achieves an SRMR of 0.096, which means an appropriate fit for small samples. However, Bentler [92] suggests supplementing the evaluation of the model’s adjustment. Goodness of Fit (GoF) was, therefore, calculated as an additional quality criterion. By using the terminology proposed by Wetzels et al. [93], the results reveal a GoF-medium adjustment for CAD (GoFCAD = 0.2569), CAC (GoFCAC = 0.2864) and for FP (GoFFP = 0.2569) with values higher than 0.25 and lower than 0.36, and a GoF-large adjustment for MPP (GoFMPP = 0.5399) with a value higher than 0.36. All in all, we can assert that the structural model presents an acceptable level of statistical fitness.
Following Nitzl et al. [77], we specify and contract the indirect effects to test our mediation hypothesis (H3). As Table 4 shows, the total effect of the EP on the MPP is much greater than the direct effect and it is also significant (β = 0.332; p < 0.001), which might, according to Sarstedt et al. [94], indicate the existence of a mediating effect of the competitive advantages on the relationship between both variables. In order to corroborate this mediation hypothesis, the total indirect effect must be significant and fulfill three requirements [73]: firstly, the direct effect between the EP and the MPP must be significant when the mediating variable is excluded from the model (β = 0.328; p < 0.001) (see Figure 2); secondly, the indirect effect via the mediating variable must be included in the model as in the case of CAD (β = 155; p < 0.001) and not like CAC (since β = −0.003 is not significant); and, thirdly, the size of the indirect effect on the total must exceed 20%. The size of the indirect effect is estimated using the variance accounted for (VAF) index, which in our case is 45.79%, and this indicates that almost half the total MPP effect is explained by the indirect effects of CAD. All things considered, a VAF that is higher than 20% and lower than 80% [73], together with the condition that both the direct and indirect effects are significant [77], suggest that CAD partially mediates in the relationship between the EP and the MPP. However, CAC does not mediate at all in this relationship.
Finally, in terms of the mediation of competitive advantages in the relationship between the EP and the FP, the total effect is lower than the direct effect (see Table 4) and so we can declare that no mediating effect occurs either via the CAD nor via the CAC [94]. Figure 2 summarizes the final estimated model.

5. Discussion

After analyzing the results, we can draw the following conclusions about the relationship between environmental proactivity and cost-based and differentiation-based competitive advantages, and also in relation to financial performance and the manager’s perception of performance.
Firstly, environmental proactivity leads to the creation of significant competitive advantages both in differentiation and cost leadership (Hypotheses 1a and 1b). Companies who pursue environmental practices in preparation for future legislation [95] and for the changes demanded by society in terms of improving their environmental results therefore manage to increase demand from environmentally-aware consumers [47] while also improving their reputation [48]. Secondly, this improvement in the environmental result offers green products, environmental technologies, and providing new market opportunities. At the same time, the efficiency associated with the improvement in environmental performance arising from environmental approaches enables a reduction in costs [50].
However, these relationships are not significant if the impact of environmental proactivity on financial performance is evaluated directly (Hypothesis 2a). In reality, a significant positive relationship was expected since it could be argued that any improvement in results could be due to the reduction in costs as a result of compliance with legislation, reducing or avoiding legal responsibilities and the amount of waste, while improving efficiency and productivity [11]. It could even arise from an increase in revenue as a result of marketing green products [96].
However, some barriers can avoid implementing proactive environmental practices, and, as a result, obtain an efficiency-based competitive advantage, which could be achieved without those obstacles [97]. In the same way, social environments are key to the success of commercialized products, regardless of their quality so that, if these are not accepted, the company cannot benefit from the potential differentiation of its products [98]. In this respect, the previous reasoning seems to be related to the result obtained in terms of Hypotheses 3a and 3c. In fact, it has been shown that environmental, differentiation-based competitive advantages significantly mediate the relationship between environmental proactivity and economic-financial performance, although negatively, and so it could be that consumers in the sector analyzed do not value green product differentiation.
Something similar happens with cost-based competitive advantages (while not significant) so that it is likely that the measures will manage to reduce the cost of the penalties and other problems, although without taking advantage of any competitive advantages that may be obtained [59].
Likewise, environmental proactivity has a positive and significant impact on the manager’s perception of performance as expected (Hypothesis 2b). The same occurs with Hypothesis 3b, relating to the capacity of differentiation-based competitive advantages to mediate the relationship between the manager’s perception of performance and environmental proactivity. However, the relationship is negative (but not significant) in the case of cost-based competitive advantages (Hypothesis 3d). There are several factors to explain this ranging, from the integration of environmental aspects in the company to how managers perceive the environmental question, and also training or organizational culture [99].
Finally, company size and age (control variables) are critical aspects for explaining business results. The significant effect of size on economic-financial performance has been widely discussed in literature [49,100,101]. However, in our case, there is no significant impact on the manager’s perception of performance. Blackburn et al. [101] conclude that, in companies with fewer than 250 workers, size dominates performance and is more important than other variables such as strategy or the owner’s business acumen. Other authors, such as López-Gamero and Molina-Azorín [49], relate size to a greater environmental proactivity due to the greater capacity that larger firms have for implementing environmental strategies or absorbing the risk resulting from the greater visibility of these firms.
The age of the firm, meanwhile, has a significant impact on the manager’s perception of performance, and this can provide proof of the impact of the company’s life cycle (and, therefore, the experience effect) on their ability to improve organizational performance as Blackburn et al. [101] have proposed. However, the fact that a firm’s age has no significant effect on business performance may suggest an impact much more in the long term. In this regard, improvements in the manager’s perception of performance may only be visible in future financial years, with a delayed effect on financial performance [102].

6. Conclusions

In this article, we have discussed the ability of environmental proactivity to create competitive advantages based on environmental management both in cost leadership and differentiation and to improve financial performance and even the manager’s perception of performance achieved. This study has focused on wineries, a sector where the environmental question has seldom been studied.
The starting point for the study was a population of 4598 wineries, which produced a final sample of 142 valid responses during the month of November 2015. Firstly, the results obtained were ambiguous in that environmental proactivity demonstrated a positive relationship with obtaining both cost-based and differentiation-based competitive advantages, respectively. This proactivity also demonstrated a positive effect on the manager’s perception of performance. However, environmental proactivity explains only 10.7% of the differentiation-based and cost-based competitive advantages (R2 = 0.107), that is a limitation of this study. We should recognize that we have used scales adapted from previous generic studies to measure competitive advantages. We therefore call for future studies that use more fine-grained scales of competitive advantages in wineries. Moreover, qualitative case studies would add valuable evidence to measuring this variable and representing potential avenues of research for the future. Secondly, obtaining differentiation-based competitive advantages has a positive impact on the manager’s perception of performance but a negative impact on performance itself. There was also no significant result of cost-based competitive advantages on financial performance nor on the perception of performance, nor the impact of environmental proactivity on financial performance.
Two groups of factors seem to be essential when it comes to explaining these unexpected results. The lack of interest shown by consumers in certain sectors in ‘green’ products and, consequently, in those advanced environmental actions to become ‘green’, said products might mean that, although a valuable level of differentiation has been achieved, this value is not perceived as such by the consumer who is unwilling to pay for it. According to the literature [103,104], it might be relevant to know how consumer involvement in production might affect the result. There has been relatively little study of this question in wineries to date and so future research should focus on this.
Some of our results appear to lead us to believe that certain barriers to environmental proactivity created in companies could become the origin of the difficulty faced by companies to improve their competitiveness by relying on the green question. A thorough analysis of these barriers and their effects is essential so that environmental improvement results in an improvement in the firm’s competitiveness. Future research will focus on this aspect.
Thirdly, the results seem to indicate the key role played by management for the firm’s success in increasing competitiveness as a result of implementing proactive environmental practices. Analyzing which of these factors are key to improving this relationship will be a major part of our future research.
This study only focuses on current financial performance. In addition to current financial performance, investigating the impact of environmental proactivity and competitive advantages on the company’s future financial performance (with a time difference of one or several years) may provide more insightful findings [102]. Future studies could consider the effect of this time gap in order to enrich and extend the work on environmental management in wineries.
From a methodological point of view, our analyses include just two control variables: firm size and firm age. Endrikat et al. [82] suggests using other control variables such as R&D intensity, advertising intensity, financial risk or capital intensity, due to the potential moderation effects arising from differences in the primary studies with regard to this control variables. Future research, using this control variables, should assess the influence of environmental proactivity on corporate performance.

Author Contributions

B.J. coordinated and designed the research and V.B.-S. analyzed the data. Both authors wrote and reviewed every section of the paper and contributed to every one.

Funding

This research was funded by Spanish Ministry of Economy and Competitiveness grant number ECO2015-68257-R. and University of Castilla-La Mancha grant number GI20174038.

Conflicts of Interest

The authors declare that they have no potential conflicts of interest regarding the research, authorship, and/or publication of this article.

Appendix A

Table A1. Variables related to different construct and their sources.
ConstructsRelated VariablesSources
Environmental Proactivity (EP):
Environmental Planning & Analysis (EPA)EPA1: This winery has a clearly-defined, formal, written environmental policy.
EPA2: Our strategic plan includes an extensive, detailed section outlining our environmental objectives.
EPA3: We constantly identify and evaluate new environmental aspects in terms of their impact.
EPA4: We provide our suppliers with a detailed, written list of environmental requirements.
EPA5: We have conducted a life-cycle analysis of the main products manufactured by this company 1.
[2,49,69,81]
[2,27,69]
[2,69]
[2,69]
[69,81]
Environmental Responsibility & Organization (ERO) ERO1: Everyone in the winery is responsible for environmental performance 1.
ERO2: Employee suggestions are an excellent source of ideas for improving the environmental result.
ERO3: Formal work teams are used to identify environmental problems and opportunities and to develop solutions.
[2,69]
[49,69]
[69,105]
Environmental Management Control (EMC) EMC1: The environmental impact of operations is formally reviewed at least once a year.
EMC2: Formal procedures exist to examine the environmental implications of new investments.
EMC3: An annual audit of waste reduction programs and their results is conducted in all production areas.
EMC4: An annual audit of the environmental risks of existing production processes is conducted in all production areas.
[2,69]
[69,106]
[2,69]
[69,105]
Differentiation-based Competitive Advantage (CAD)CAD1: Loyalty of existing customers
CAD2: Attracting new customers
CAD3: Product image
CAD4: Corporate image
[27,49]
[49]
[49]
[2,49,107]
Cost-based Competitive Advantage (CAC)CAC1: Water consumption
CAC2: Energy consumption 1
CAC3 Raw material consumption
[27,81,108]
[49,81]
[2,27,81]
Manager’s Perception of Performance (MPP)MPP1: Sales volume
MPP2: Volume of exports
MPP3: Long-term benefits 1
MPP4: Short-term benefits 1
[69,81]
[69]
[53,69]
[69]
Financial Performance (FP)FP1: Return on assets (ROA)
FP2: Return on equity (ROE)
FP3: Value-added
[2,82,109]
[43,81]
[82]
Firm’s Age (FA)FA1: Age of winery[69,71]
Firm’s Size (FS)FS1: Number of employees
FS2: Turnover
[2,49,82]
[2,81]
1 Items are deleted after reliability or validity analysis.

References

  1. Cramer, J. Environmental management: From ‘fit’ to ‘stretch’. Bus. Strategy Environ. 1998, 7, 162–172. [Google Scholar] [CrossRef]
  2. González-Benito, J.; González-Benito, O. Environmental proactivity and business performance: An empirical analysis. Omega 2005, 33, 1–15. [Google Scholar] [CrossRef]
  3. González-Benito, J.; González-Benito, O. A review of determinant factors of environmental proactivity. Bus. Strategy Environ. 2006, 15, 87–102. [Google Scholar] [CrossRef]
  4. Porter, M.E.; van der Linde, C. Toward a New Conception of the Environment-Competitiveness Relationship. J. Econ. Perspect. 1995, 9, 97–118. [Google Scholar] [CrossRef] [Green Version]
  5. Brockhoff, K.; Chakrabarti, A.K.; Kirchgeorg, M. Corporate Strategies in Environmental Management. Res. Technol. Manag. 1999, 42, 26–30. [Google Scholar] [CrossRef]
  6. Roy, D. Designing and marketing green products: The Hoover case. In Greener Marketing: A Global Perspective to Greener Marketing Practice; Charter, M., Polonsky, M.J., Eds.; Greenleaf Publishing: Sheffield, UK, 1999; pp. 126–142. [Google Scholar]
  7. Shrivastava, P. The Role of Corporations in Achieving Ecological Sustainability. Acad. Manag. Rev. 1995, 20, 936–960. [Google Scholar] [CrossRef]
  8. Stead, W.E.; Stead, J.G. Management for a Small Planet: Strategic Decision Making and the Environment; Sage: Thousand Oaks, CA, USA, 1996. [Google Scholar]
  9. Gage, J.S. A recipe for disruption. Manag. Rev. 2000, 89, 46. [Google Scholar]
  10. Thomassin, P.J.; Cloutier, L.M. Informational Requirements and the Regulatory Process of Agricultural Biotechnology. J. Econ. Issues 2001, 35, 323–333. [Google Scholar] [CrossRef]
  11. Hart, S.L. A Natural-Resource-Based View of the Firm. Acad. Manag. Rev. 1995, 20, 986–1014. [Google Scholar] [CrossRef]
  12. Hart, S.L.; Ahuja, G. Does it pay to be green? An empirical examination of the relationship between emission reduction and firm performance. Bus. Strategy Environ. 1996, 5, 30–37. [Google Scholar] [CrossRef]
  13. Christmann, P. Effects of “Best Practices” of Environmental Management on Cost Advantage: The Role of Complementary Assets. Acad. Manag. Rev. 2000, 43, 663–680. [Google Scholar]
  14. Knight, C. Pollution prevention, technology challenges and competitive advantage in the process industries. Total Qual. Environ. Manag. 1995, 5, 87–92. [Google Scholar] [CrossRef]
  15. Fiksel, J. Achieving eco-efficiency through design for environment. Total Qual. Environ. Manag. 1996, 5, 47–54. [Google Scholar] [CrossRef]
  16. Sharma, S.; Vredenburg, H. Proactive corporate environmental strategy and the development of competitively valuable organizational capabilities. Strateg. Manag. J. 1998, 19, 729–753. [Google Scholar] [CrossRef]
  17. Ellington, R.T.; Sharfman, M.; Meo, M. Dupont, conoco and the biodegradable grease project: Using innovation to turn chemical by-products into a new product. Corp. Environ. Strategy 2000, 7, 62–71. [Google Scholar] [CrossRef]
  18. Azzone, G.; Noci, G. Seeing ecology and “green” innovations as a source of change. J. Organ. Chang. Manag. 1998, 11, 94–111. [Google Scholar] [CrossRef]
  19. Brennan, L.; Gupta, S.M.; Taleb, K.N. Operations Planning Issues in an Assembly/Disassembly Environment. Int. J. Oper. Prod. Manag. 1994, 14, 57–67. [Google Scholar] [CrossRef] [Green Version]
  20. Porter, M.E.; van der Linde, C. Green and competitive: Ending the Stalemate. Harv. Bus. Rev. 1995, 73, 120–134. [Google Scholar]
  21. Angell, L.C.; Klassen, R.D. Integrating environmental issues into the mainstream: An agenda for research in operations management. J. Oper. Manag. 1999, 17, 575–598. [Google Scholar] [CrossRef]
  22. Curkovic, S.; Melnyk, S.A.; Handfield, R.B.; Calantone, R. Investigating the linkage between total quality management and environmentally responsible manufacturing. IEEE Trans. Eng. Manag. 2000, 47, 444–464. [Google Scholar] [CrossRef]
  23. Aggeri, F. Environmental policies and innovation: A knowledge-based perspective on cooperative approaches. Res. Policy 1999, 28, 699–717. [Google Scholar] [CrossRef]
  24. Checkland, P. Systems Thinking, Systems Practice; Wiley: Chicherter, UK, 1981. [Google Scholar]
  25. Vickers, G. Human Systems Are Different; Harper Row: London, UK, 1983. [Google Scholar]
  26. Corbett, C.J.; Van Wassenhove, L.N. The Green Fee: Internalizing and Operationalizing Environmental Issues. Calif. Manag. Rev. 1993, 36, 116–135. [Google Scholar] [CrossRef]
  27. Banerjee, S.B.; Iyer, E.S.; Kashyap, R.K. Corporate Environmentalism: Antecedents and Influence of Industry Type. J. Mark. 2003, 67, 106–122. [Google Scholar] [CrossRef]
  28. Nordhaus, W. Invention Growth and Welfare; MIT Press: Cambridge, UK, 1969. [Google Scholar]
  29. Stoneman, P. Patenting activity: A re-evaluation of the influence of demand pressures. J. Ind. Econ. 1979, 27, 385–401. [Google Scholar] [CrossRef]
  30. Scherer, F.M. Demand-pull and technological invention: Schmookler revisited. J. Ind. Econ. 1982, 30, 225–237. [Google Scholar] [CrossRef]
  31. Gort, M.; Wall, R.A. The Evolution of Technologies and Investment in Innovation. Econ. J. 1986, 96, 741–757. [Google Scholar] [CrossRef]
  32. Narasimhan, R.; Carter, J.R. Environmental Supply Chain Management; Center for Advanced Purchasing Study: Tempe, AZ, USA, 1998. [Google Scholar]
  33. Junquera, B.; Brío, J.A.D. The role of environmental activity integration into the R&D department to obtain competitive advantage. Int. J. Sustain. Dev. World Ecol. 2012, 19, 210–218. [Google Scholar]
  34. Rivera, J.; Delmas, M. Business and environmental protection. Human Ecol. Rev. 2004, 11, 230–234. [Google Scholar]
  35. Walley, N.; Whitehead, B. It’s not easy being green. Harv. Bus. Rev. 1994, 72, 46–52. [Google Scholar]
  36. Jermier, J.M.; Forbes, L.C.; Benn, S.; Orsato, R.J. The new corporate environmentalism and green politic. In Handbook of Organization Studies; Clegg, S.R., Hardy, C., Lawrence, T.B., Nord, W.R., Eds.; Sage Publications: London, UK, 2006; pp. 618–650. [Google Scholar]
  37. Aragón-Correa, J.A.; Sharma, S. A Contingent Resource-Based View of Proactive Corporate Environmental Strategy. Acad. Manag. Rev. 2003, 28, 71–88. [Google Scholar] [CrossRef]
  38. Russo, M.V.; Fouts, P.A. A Resource-Based Perspective On Corporate Environmental Performance and Profitability. Acad. Manag. J. 1997, 40, 534–559. [Google Scholar]
  39. Aragón-Correa, J.A. Strategic Proactivity and Firm Approach to the Natural Environment. Acad. Manag. J. 1998, 41, 556–567. [Google Scholar] [CrossRef]
  40. Buysse, K.; Verbeke, A. Proactive environmental strategies: A stakeholder management perspective. Strateg. Manag. J. 2003, 24, 453–470. [Google Scholar] [CrossRef]
  41. Jiang, R.J.; Bansal, P. Seeing the Need for ISO 14001. J. Manag. Stud. 2003, 40, 1047–1067. [Google Scholar] [CrossRef]
  42. Schylander, E.; Martinuzzi, A. ISO 14001—Experiences, effects and future challenges: A national study in Austria. Bus. Strategy Environ. 2007, 16, 133–147. [Google Scholar] [CrossRef]
  43. Toke, L.K.; Gupta, R.C.; Dandekar, M. An empirical study of green supply chain management in Indian perspective. Int. J. Appl. Sci. Eng. Res. 2012, 1, 372–383. [Google Scholar]
  44. Chiappetta Jabbour, C.J.; Lopes de Sousa Jabbour, A.B.; Govindan, K.; Alves Teixeira, A.; de Souza Freitas, W.R. Environmental management and operational performance in automotive companies in Brazil: The role of human resource management and lean manufacturing. J. Clean. Prod. 2012, 47. [Google Scholar] [CrossRef]
  45. Sambasivan, M.; Bah, S.M.; Jo-Ann, H. Making the case for operating “Green”: Impact of environmental proactivity on multiple performance outcomes of Malaysian firms. J. Clean. Prod. 2013, 42, 69–82. [Google Scholar] [CrossRef]
  46. Elkington, J. Towards the Sustainable Corporation: Win-Win-Win Business Strategies for Sustainable Development. Calif. Manag. Rev. 1994, 36, 90–100. [Google Scholar] [CrossRef]
  47. Galdeano-Gómez, E.; Céspedes-Lorente, J.; Martínez-Del-Río, J. Environmental performance and spillover effects on productivity: Evidence from horticultural firms. J. Environ. Manag. 2008, 88, 1552–1561. [Google Scholar] [CrossRef] [PubMed]
  48. Miles, M.P.; Covin, J.G. Environmental Marketing: A Source of Reputational, Competitive, and Financial Advantage. J. Bus. Ethics 2000, 23, 299–311. [Google Scholar] [CrossRef]
  49. López-Gamero, M.D.; Molina-Azorín, J.F. Environmental Management and Firm Competitiveness: The Joint Analysis of External and Internal Elements. Long Range Plan. 2016, 49, 746–763. [Google Scholar] [CrossRef]
  50. Ambec, S.; Lanoie, P. Does It Pay to Be Green? A Systematic Overview. Acad. Manag. Perspect. 2008, 22, 45–62. [Google Scholar]
  51. Dean, T.J.; Brown, R.L. Pollution Regulation as a Barrier to New Firm Entry: Initial Evidence and Implications for Future Research. Acad. Manag. J. 1995, 38, 288–303. [Google Scholar]
  52. Starik, M.; Marcus, A.A. Introduction to the Special Research Forum on the Management of Organizations in the Natural Environment: A Field Emerging from Multiple Paths, with Many Challenges Ahead. Acad. Manag. J. 2000, 43, 539–547. [Google Scholar]
  53. Bansal, P.; Roth, K. Why Companies Go Green: A Model of Ecological Responsiveness. Acad. Manag. J. 2000, 43, 717–736. [Google Scholar]
  54. Walker, K.; Wan, F. The Harm of Symbolic Actions and Green-Washing: Corporate Actions and Communications on Environmental Performance and Their Financial Implications. J. Bus. Ethics 2012, 109, 227–242. [Google Scholar] [CrossRef]
  55. Izagirre-Olaizola, J.; Fernández-Sainz, A.; Vicente-Molina, M.A. Antecedentes y barreras a la compra de productos ecológicos. Universia Bus. Rev. 2013, 38, 108–127. [Google Scholar]
  56. Barba-Sánchez, V.; García-Pérez, M.E.; Martínez-Belmonte, M. The wine consumers’ perception of good environmental practices: A study in gourmet shops. In E2KW 2013. Energy Environment Knowledge Week; UCLM: Toledo, Spain, 2013. [Google Scholar]
  57. Darnall, N.; Henriques, I.; Sadorsky, P. Adopting proactive environmental strategy: The influence of stakeholders and firm size. J. Manag. Stud. 2010, 47, 1072–1094. [Google Scholar] [CrossRef]
  58. Hill, J. Thinking about a more sustainable business—An Indicators approach. Corp. Environ. Strategy 2001, 8, 30–38. [Google Scholar] [CrossRef]
  59. Managi, S.; Opaluch, J.J.; Jin, D.; Grigalunas, T.A. Environmental Regulations and Technological Change in the Offshore Oil and Gas Industry. Land Econ. 2005, 81, 303–319. [Google Scholar] [CrossRef]
  60. Sanderlands, G. 3M find brass in muck. Manag. Decis. 1994, 32, 63–64. [Google Scholar]
  61. Newman, W.R.; Hanna, M.D. An empirical exploration of the relationship between manufacturing strategy and environmental management: Two complementary models. Int. J. Oper. Prod. Manag. 1996, 16, 69–87. [Google Scholar] [CrossRef]
  62. Walls, J.L.; Berrone, P.; Phan, P.H. Corporate governance and environmental performance: Is there really a link? Strateg. Manag. J. 2012, 33, 885–913. [Google Scholar] [CrossRef]
  63. Bansal, P. From Issues to Actions: The Importance of Individual Concerns and Organizational Values in Responding to Natural Environmental Issues. Organ. Sci. 2003, 14, 510–527. [Google Scholar] [CrossRef]
  64. Ramus, C.A. Organizational Support for Employees: Encouraging Creative Ideas for Environmental Sustainability. Calif. Manag. Rev. 2001, 43, 85–105. [Google Scholar] [CrossRef]
  65. Sharma, S. Managerial Interpretations and Organizational Context as Predictors of Corporate Choice of Environmental Strategy. Acad. Manag. J. 2000, 43, 681–697. [Google Scholar]
  66. Andersson, L.M.; Bateman, T.S. Individual Environmental Initiative: Championing Natural Environmental Issues in U.S. Business Organizations. Acad. Manag. J. 2000, 43, 548–570. [Google Scholar]
  67. Spanos, Y.E.; Lioukas, S. An examination into the causal logic of rent generation: Contrasting Porte’s competitive strategy framework and the resource-based perspective. Strateg. Manag. J. 2001, 22, 907–934. [Google Scholar] [CrossRef]
  68. Cámaras de Comercio. Camerdata. Available online: http://www.camerdata.es/index.php (accessed on 18 September 2015).
  69. Barba-Sánchez, V.; Atienza-Sahuquillo, C. Environmental Proactivity and Environmental and Economic Performance: Evidence from the Winery Sector. Sustainability 2016, 8, 1014. [Google Scholar] [CrossRef]
  70. Bureau Van Dijk. SABI Database (Sistema de Análisis de Balances Ibéricos). Available online: https://sabi.bvdinfo.com/version-201845/home.serv?product=SabiNeo (accessed on 25 September 2017).
  71. Feng, T.; Cai, D.; Wang, D.; Zhang, X. Environmental management systems and financial performance: The joint effect of switching cost and competitive intensity. J. Clean. Prod. 2016, 113, 781–791. [Google Scholar] [CrossRef]
  72. Perelló, S. Metodología de la Investigación Social; Dykinson: Madrid, Spain, 2011. [Google Scholar]
  73. Hair, J.F.; Hult, T.M.; Ringle, C.M.; Sarstedt, M.A. Primer on Partial Least Squares Structural Equation Modeling (PLS-SEM); Sage: Thousand-Oaks, CA, USA, 2014. [Google Scholar]
  74. Ringle, C.M.; Wende, S.; Becker, J.M. SmartPLS 3; SmartPLS GmvH: Boenningstedt, Germany, 2015. [Google Scholar]
  75. Roldán, J.L.; Sánchez-Franco, M.J. Variance-based structural equation modeling: Guidelines for using partial least squares in information systems research. In Research Methodologies, Innovations and Philosophies in Software Systems Engineering and Information Systems; Mora, M., Gelman, O., Steenkamp, A.L., Raisinghani, M., Eds.; IGI Global: Hershey, PA, USA, 2012; pp. 193–221. [Google Scholar]
  76. James, L.R.; Mulaik, S.A.; Brett, J.M. A tale of two methods. Organ. Res. Methods 2006, 9, 233–244. [Google Scholar] [CrossRef]
  77. Nitzl, C.; Roldán, J.L.; Cepeda-Carrión, G. Mediation analysis in partial least squares path modeling: Helping researchers discuss more sophisticated models. Ind. Manag. Data Syst. 2016, 116, 1849–1864. [Google Scholar] [CrossRef]
  78. Wright, R.T.; Campbell, D.E.; Thatcher, J.B.; Roberts, N. Operationalizing multidimensional constructus in structural equation modeling: Recommendations for IS research. Commun. Assoc. Inf. Syst. 2012, 30, 367–412. [Google Scholar]
  79. López-Gamero, M.D.; Molina-Azorín, J.F.; Claver-Cortés, E. The whole relationship between environmental variables and firm performance: Competitive advantage and firm resources as mediator variables. J. Environ. Manag. 2009, 90, 3110–3121. [Google Scholar] [CrossRef] [PubMed] [Green Version]
  80. Atienza-Sahuquillo, C.; Barba-Sánchez, V. Desing of a Measurement Model for Environmental Performance: Application to the Food Sector. Environ. Eng. Manag. J. 2014, 13, 1463–1472. [Google Scholar]
  81. Sen, P.; Roy, M.; Pal, P. Exploring role of environmental proactivity in financial performance of manufacturing enterprises: A structural modelling approach. J. Clean. Prod. 2015, 108, 583–594. [Google Scholar] [CrossRef]
  82. Endrikat, J.; Guenther, E.; Hoppe, H. Making sense of conflicting empirical findings: A meta-analytic review of the relationship between corporate environmental and financial performance. Eur. Manag. J. 2014, 32, 735–751. [Google Scholar] [CrossRef]
  83. Sellers-Rubio, R. Evaluating the economic performance of Spanish wineries. Int. J. Wine Bus. Res. 2010, 22, 73–84. [Google Scholar] [CrossRef]
  84. Coad, A.; Holm, J.R.; Krafft, J. Firm age and performance. J. Evolut. Econ. 2018, 28, 1–11. [Google Scholar] [CrossRef]
  85. Henseler, J. Bridging design and behavioral research with variance-based Structural Equation Modeling. J. Advert. 2017, 46, 178–192. [Google Scholar] [CrossRef]
  86. Dijkstra, T.; Henseler, J. Consistent and asymptotically normal PLS estimators for linear structural equations. Comput. Stat. Data Anal. 2015, 81, 10–23. [Google Scholar] [CrossRef]
  87. Fornell, C.; Larcker, D. Evaluating structural equation models with unobservable variables and measurement error. J. Mark. Res. 1981, 18, 39–50. [Google Scholar] [CrossRef]
  88. Muhammad, N.; Scrimgeour, F.; Reddy, K.; Abidin, S. The relationship between environmental performance and financial performance in periods of growth and contraction: Evidence from Australian publicly listed companies. J. Clean. Prod. 2015, 102, 324–332. [Google Scholar] [CrossRef]
  89. Hu, L.-T.; Bentler, P.M. Cutoff Criteria for Fit Indexes in Covariance Structure Analysis: Conventional Criteria versus New Alternatives. Struct. Equ. Model. Interdiscip. J. 1999, 6, 1–55. [Google Scholar] [CrossRef]
  90. Garson, G.D. Instrumental Variables and 2SLS Regression; Statistical Associates Publishing: Asheboro, NC, USA, 2018. [Google Scholar]
  91. Taasoobshizazi, G.; Wang, S. The performance of the SRMR, RMSEA, CFI, and TLI: An examination of sample size, path size, and degrees of freedom. J. Appl. Quant. Methods 2016, 11, 31–39. [Google Scholar]
  92. Bentler, P.M. On tests and indices for evaluating structural models. Personal. Individ. Differ. 2007, 42, 825–829. [Google Scholar] [CrossRef]
  93. Wetzels, M.; Odekerken-Schroder, G.; Oppen, C.V. Using PLS path modeling for assessing hierarchical construct models: Guidelines and empirical illustration. MIS Q. 2009, 33, 177–195. [Google Scholar] [CrossRef]
  94. Sarstedt, M.; Ringle, C.M.; Smith, D.; Reams, R.; Hair, J.F. Partial least squares structural equation modeling (PLS-SEM): A useful tool for family business researchers. J. Fam. Bus. Strategy 2014, 5, 105–115. [Google Scholar] [CrossRef]
  95. Junquera, B.; Brío, J.A.D. Preventive Command and Control Regulation: A Case Analysis. Sustainability 2016, 8, 99. [Google Scholar] [CrossRef]
  96. Miniero, G.; Codini, A.; Bonera, M.; Corvi, E.; Bertoli, G. Being green: From attitude to actual consumption. Int. J. Consum. Stud. 2014, 38, 521–528. [Google Scholar] [CrossRef]
  97. Murillo-Luna, J.L.; Garcés-Ayerbe, C.; Rivera-Torres, P. Barriers to the adoption of proactive environmental strategies. J. Clean. Prod. 2011, 19, 1417–1425. [Google Scholar] [CrossRef]
  98. Sudbury-Riley, L.; Hofmeister-Toth, A.; Kohlbacher, F. A cross-national study of the ecological worldview of senior consumers. Int. J. Consum. Stud. 2014, 38, 500–509. [Google Scholar] [CrossRef]
  99. Chen, Y.-S.; Chang, C.-H. Enhance environmental commitments and green intangible assets toward green competitive advantages: An analysis of structural equation modeling (SEM). Qual. Quant. 2013, 47, 529–543. [Google Scholar] [CrossRef]
  100. Surroca, J.; Tribó, J.A.; Waddock, S. Corporate Responsibility and Financial Performance: The role of intangible resources. Strateg. Manag. J. 2010, 31, 463–490. [Google Scholar] [CrossRef] [Green Version]
  101. Blackburn, R.A.; Hart, M.; Wainwright, T. Small business performance: Business, strategy and owner-manager characteristics. J. Small Bus. Enterp. Dev. 2013, 20, 8–27. [Google Scholar] [CrossRef]
  102. Song, H.; Zhao, C.; Zeng, J. Can environmental management improve financial performance: An empirical study of A-shares listed companies in China. J. Clean. Prod. 2017, 141, 1051–1056. [Google Scholar] [CrossRef]
  103. Junquera, B.; Brío, J.A.D.; Fernández, E. The client as co-manufacturer and environmental entrepreneur: A research agenda. Serv. Ind. J. 2008, 28, 1029–1040. [Google Scholar] [CrossRef]
  104. Junquera, B.; Brío, J.Á.D.; Fernández, E. Clients’ involvement in environmental issues and organizational performance in businesses: An empirical analysis. J. Clean. Prod. 2012, 37, 288–298. [Google Scholar] [CrossRef]
  105. Bernal-Conesa, J.A.; Nieto, C.N.; Briones-Peñalver, A.J. CSR Strategy in Technology Companies: Its Influence on Performance, Competitiveness and Sustainability. Corp. Soc. Responsib. Environ. Manag. 2017, 24, 96–107. [Google Scholar] [CrossRef]
  106. Pomarici, E.; Vecchio, R.; Mariani, A. Wineries’ Perception of Sustainability Costs and Benefits: An Exploratory Study in California. Sustainability 2015, 7, 16164–16174. [Google Scholar] [CrossRef] [Green Version]
  107. Woo, C.; Kim, M.G.; Chung, Y.; Rho, J.J. Suppliers’ communication capability and external green integration for green and finalcial performance in Korean construction industry. J. Clean. Prod. 2016, 112, 483–493. [Google Scholar] [CrossRef]
  108. Kim, M.; Woo, C.; Rho, J.; Chung, Y. Environmental Capabilities of Suppliers for Green Supply Chain Management in Construction Projects: A Case Study in Korea. Sustainability 2016, 8, 82. [Google Scholar] [CrossRef]
  109. Clarkson, P.M.; Overell, M.B.; Chapple, L. Environmental Reporting and its Relation to Corporate Environmental Performance. Abacus 2011, 47, 27–60. [Google Scholar] [CrossRef]
Figure 1. Research model and hypotheses. Note: The thick solid lines indicate the relationships established as hypotheses in the model; the thin solid lines indicate the relationship between the control variables and the firm’s performance, and the superordinate multidimensional construct of environmental proactivity. Variables = EPA: Environmental Planning & Analysis; ERO: Environmental Responsibility and Organization; EMC: Environmental Management Control; EP: Environmental Proactivity; CAD: Differentiation-based Competitive Advantage; CAC: Cost-based Competitive Advantage; FP: Financial Performance; MPP: Manager’s Perception of Performance; FA: Firm’s Age; FS: Firm’s Size.
Sustainability 10 02155 g001
Figure 2. Structural model results. Significant at p < 0.1; * p < 0.05; ** p < 0.01; *** p < 0.001 (based on t(4999), one-tailed test). (1) Value without the mediating variable.
Sustainability 10 02155 g002
Table 1. Measurement validation.
Construct 1Cronbach’s AlphaDijkstra–Henseler’s RhoComposite Reliability (CR)Average Variance Extracted (AVE)
Environmental planning and analysis (EPA)0.8740.8810.9140.726
Environmental responsibility and organization (ERO)0.7110.7380.8720.774
Environmental management control (EMC)0.8660.8680.9090.714
Environmental proactivity (EP) 20.9160.9210.9290.547
Differentiation-based competitive advantage (CAD)0.7990.8130.8660.617
Cost-based competitive advantage (CAC)0.7050.7660.8680.767
Manager’s perception of performance (MPP)0.7510.7510.8890.801
Financial performance (FP)0.7320.7630.7590.504
Firm Size (FS)0.7750.7800.8990.816
1 All constructs are reflective; 2 Superordinate multidimensional construct.
Table 2. Discriminant validity 1.
ConstructEPAEROEMCCADCACMPPFPFS aFA a
EPA0.852
ERO0.6210.880
EMC0.6510.6840.845
CAD0.2280.3130.3180.785
CAC0.2590.2470.3250.2940.876
MPP0.3260.3170.2610.5420.2030.895
FP0.159−0.0200.026−0.063−0.061−0.0050.710
FS a0.2630.1760.1660.1330.0800.1460.4300.903
FA a0.1330.0870.0190.0880.0830.2540.2890.4421.000
1 Diagonal elements (bold) are the square root of variance shared between the constructs and their measures (AVE). Off-diagonal elements are the correlations between constructs. For discriminant validity, diagonal elements should be larger than off-diagonal elements (Fornell–Lacker criterion). a Control variables.
Table 3. Effects on endogenous variables.
R2Q2Direct Effectt-Value 1Variance Explained
CAD0.1070.060
H1a: EP 0.326 ***4.51610.65%
CAC0.1070.068
H1b: EP 0.326 ***4.53310.66%
MPP0.3640.259
H2b: EP 0.180 **2.5546.10%
H3b: CAD 0.474 ***6.91225.69%
H3d: CAC −0.0100.872−0.20%
FA 0.221 **3.1405.61%
FS −0.0540.718−0.79%
FP0.2190.041
H2a: EP 0.0400.4840.28%
H3a: CAD −0.115 1.3910.72%
H3c: CAC −0.0820.8720.50%
FA 0.1330.7623.84%
FS 0.384 *2.08516.51%
1 5000 bootstrap samples. p < 0.1 * p < 0.05; ** p < 0.01; *** p < 0.001 (based on t(4999), one-tailed test).
Table 4. Summary of mediating effect tests.
HypothesisTotal Effect Coefficients (t-Value) 1Direct Effect Coefficients (t-Value) 1Indirect Effect
Point EstimateBootstrap 95% CI
H2a: EP → FP−0.025
(0.329)
0.040
(0.484)
−0.064 *[−0.130; −0.016]
H3a: via CAD −0.037[−0.094; −0.002]
H3c: via CAC −0.027[−0.084; 0.024]
H2b: EP → MPP0.332 ***
(4.595)
0.180 **
(2.554)
0.152 **[0.076; 0.238]
H3b: via CAD 0.155 ***[0.091; 0.231]
H3d: via CAC −0.003[−0.049; 0.039]
1 5000 bootstrap samples. * p < 0.05; ** p < 0.01; *** p < 0.001 (based on t(4999), one-tailed test).

