Article

Operation Optimization in a Smart Micro-Grid in the Presence of Distributed Generation and Demand Response

1
School of Economics and Management, North China Electric Power University, Changping District, Beijing 102206, China
2
State Grid Henan Economic Research Institute, Zhenzhou 450000, China
*
Author to whom correspondence should be addressed.
Sustainability 2018, 10(3), 847; https://doi.org/10.3390/su10030847
Submission received: 29 January 2018 / Revised: 10 March 2018 / Accepted: 10 March 2018 / Published: 16 March 2018
(This article belongs to the Special Issue Smart Power Grid for Sustainable Energy Transition)

Abstract

:
With the application of distributed generation and the development of smart grid technology, micro-grid, an economic and stable power grid, tends to play an important role in the demand side management. Because micro-grid technology and demand response have been widely applied, what Demand Response actions can realize the economic operation of micro-grid has become an important issue for utilities. In this proposed work, operation optimization modeling for micro-grid is done considering distributed generation, environmental factors and demand response. The main contribution of this model is to optimize the cost in the context of considering demand response and system operation. The presented optimization model can reduce the operation cost of micro-grid without bringing discomfort to the users, thus increasing the consumption of clean energy effectively. Then, to solve this operational optimization problem, genetic algorithm is used to implement objective function and DR scheduling strategy. In addition, to validate the proposed model, it is employed on a smart micro-grid from Tianjin. The obtained numerical results clearly indicate the impact of demand response on economic operation of micro-grid and development of distributed generation. Besides, a sensitivity analysis on the natural gas price is implemented according to the situation of China, and the result shows that the natural gas price has a great influence on the operation cost of the micro-grid and effect of demand response.

1. Introduction

With the energy crisis and environmental crisis becoming increasingly serious, distributed generation, as one of the main forms of renewable energy power generation, plays an important role in the development and construction of smart grid. At the same time, the problem of power system instability caused by the distributed power supply connected to the power grid on a large scale has begun to emerge gradually. To adapt to the large-scale utilization of distributed renewable energy generation, micro-grid technology is proposed to solve the contradiction between power system operation and distributed power generation [1]. The unique grid form of micro-grid can effectively solve the problem of distributed power access to the grid by combining different distributed power sources together [2], so it is of great significance to study the optimal energy management of micro-grid with distributed generation.
As discussed in References [3,4], micro-grid is an efficient supplement of bulk power grid and a significant component of intelligent power grid. It has broad application prospects in commercial region, urban region and remote region. Along with the accelerating R&D progress of the key demand side management technology, it is expected that micro-grid will enter the fast development phase. With the development of micro-grid core technology, smart micro-grid has become the focus of micro-grid research gradually. Smart grid is a new type of grid which integrates renewable energy power generation technology, energy management system (EMS) and transmission and distribution infrastructure. It not only improves the efficiency of clean energy utilization, but also strengthens the security and reliability of the power grid. In addition, it can also reduce the power consumption and the impact on the environment effectively [5,6,7].
With the development of smart micro-grid technology, the research on micro-grid is increasingly intensive. In the field of micro-grid research, many scholars have made research and achieved some achievements. These studies mainly include distributed generation, micro-grid energy management, micro-grid operation optimization, and so on. In the aspect of distributed generation and control technology, Morozumi et al. studied the problems of distributed generation, and used a micro-grid demonstration project as a micro-grid control experimental platform to study distributed generation control [8,9]. Gao et al. analyzed the active power dispatching mode of interconnected power grid adapted to large-scale wind power connection and put forward the solution of active power dispatching and control of interconnected power grid, which takes centralized control as the goal and hierarchical coordination control as the transition [10]. As discussed by Huang et al., the characteristics of high power charge and discharge and unlimited times of flywheel energy storage system can improve the resilience of micro-grid [11]. Li et al. applied smart micro-grid technology to island energy supply, and analyzed the characteristics of distributed generation, energy storage in the island smart micro-grid [12]. Pei et al. proposed a new scheme of micro-grid interconnection and interaction, which proved that the micro-grid groups can improve auxiliary services more effectively through the energy interconnection between micro-grid groups [13]. In the aspect of micro-grid energy management system, as discussed by Jimeno et al., the structure of micro-grid energy management, micro-grid energy management strategy and operation planning of smart grid based on PV are studied deeply [14,15,16]. Chinese researcher Wu et al. studied the control structure of micro-grid energy management system, and analyzed the basic model and algorithm of micro-grid energy management [17]. Chen et al. studied the optimal management of distributed generation output in micro-grid. The optimization problem was solved by improved genetic algorithm and multi-objective programming algorithm, and the research achievements can be used for economic benefit evaluation of micro-grid [18,19]. In the aspect of economic optimization operation of micro-grid, Niu et al. studied the problem of micro-grid economic optimization scheduling from two aspects, energy supply and load control, and a translatable load model and the economic optimal dispatch model of micro-grid based on dynamic programming have been constructed in the study [20]. Jiang et al. established a micro-grid economic optimization model considering equipment loss cost, operation and maintenance cost, fuel cost and environmental protection conversion cost, and adopted Non-inferior Sequencing Genetic Algorithm (NSGA-П) to obtain the optimization scheme under cost and multi-objective conditions [21]. Chen et al. analyzed the economy of Combined Heat and Power (CHP) system by an economic operation optimization model based on the opportunity constraint programming theory [22]. Wang et al. studied the economy of micro-grid from the aspects of cost and benefit, and established an economic model. The model takes the lowest operating cost as the objective function, and the constraint conditions contain the greenhouse gas and pollutant emissions [23].
In the above studies, demand response plays an important role in distributed generation, demand side management and micro-grid construction. Most of these studies established the micro-grid operation optimization model and studied the demand response strategy. In the electricity market, the primary incentive for consumers to enroll in demand response project is to obtain economic benefits and enjoy better electricity services. Clearly, to realize the economic operation of micro-grid without bringing discomfort to users becomes the key to the research of micro-grid and demand response.
To fill this gap, this paper presents a new optimization operation model for studying the economical operation and optimization strategy based on demand response mechanism. The optimization model presented plays an important role in the minimization problem of operating cost. Distinct from existing studies, the price-related aspect that is associated with demand response is especially considered in the process of mathematical modeling. In addition, we also analyze the sensitivity of the factors that affect the operation cost of micro-grid in the discussion and analysis of the results.
The result of the study is organized as follows: In Section 2, the characteristics of micro-grid and the operation optimization strategy are analyzed. In Section 3, the optimization model and constraints are explained in detail. In Section 4, the algorithm and implementation process are introduced. The simulation results to prove the effectiveness of the strategy and model are demonstrated in Section 5. In Section 6, the simulation results are discussed and analyzed. Finally, Section 7 reports the important conclusions drawn in this study.

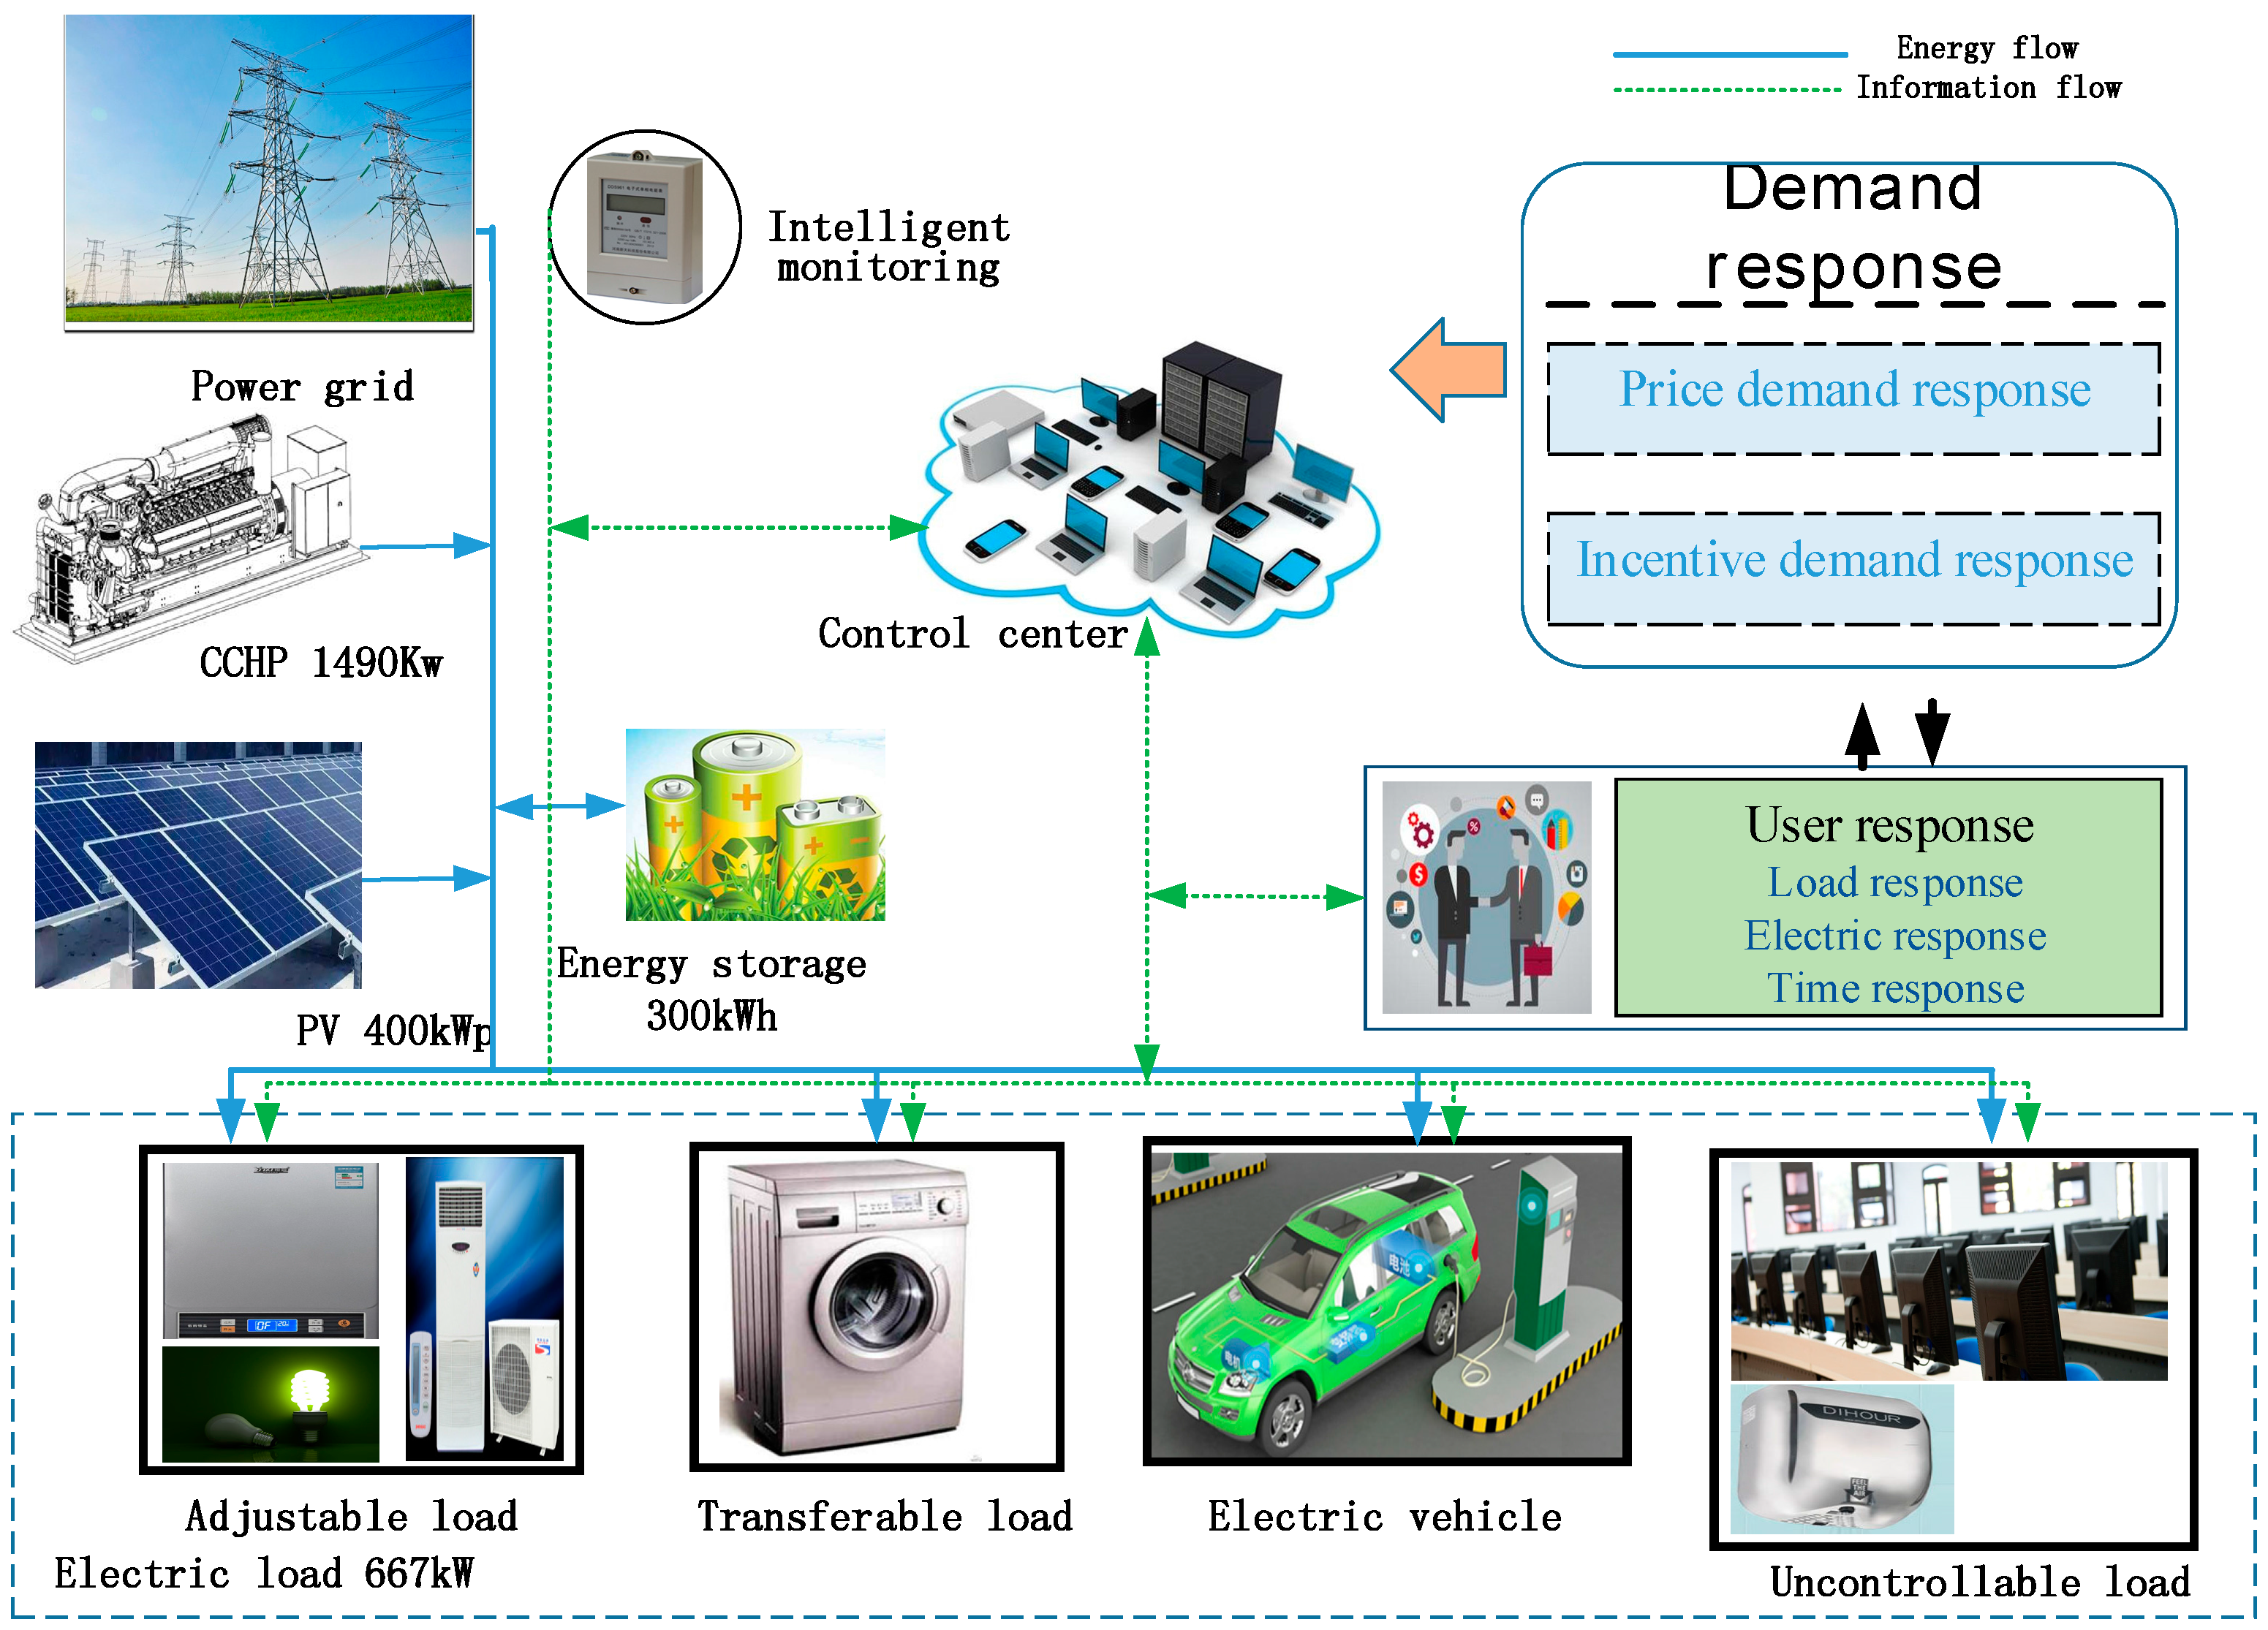
2. Demand Response and Micro-Grid

Much research and practice show demand response and participation of demand side resources in micro-grid operation can alleviate the contradiction between power supply and demand effectively, and improve system reliability [24,25]. Meanwhile, the application of demand response technology in micro-grid reduces the investment pressure of power grid, and improves the energy utilization efficiency [26].

2.1. Response Resources

The traditional demand side resource mainly refers to the load resource that can respond to the electricity price signal or the incentive mechanism [27]. However, micro-grid demand response resource not only include load resources, but also distributed resources and energy storage resources. Micro-grid distributed resources mainly include two categories: One is intermittent renewable energy power generation, such as wind power and photovoltaic, and the other one is controllable distributed resources generation, such as micro gas generating unit, diesel generating units, etc. Response load resources include three categories: interruptible load, adjustable load and shiftable load. The distributed energy storage unit is often used as the energy buffer in the micro-grid system to improve the stability and reliability of the power supply of the system [28]. A typical intelligent micro-grid structure is shown in Figure 1.

2.2.1. Photovoltaic Power Generation

Solar energy is an ideal renewable energy with wide distribution. Photovoltaic power generation is one of the main forms of solar energy utilization [29]. Photovoltaic power generation uses solar panels to convert solar energy into electrical energy; t moment solar panel output P P V ( t ) can be calculated from Equation (1) [30].
P P V ( t ) = P s t c I ( R b , k t , I 0 t ) I s t c [ 1 + α T ( T t T s t c ) ]
where P s t c is the rated output of the solar panel, kW; I s t c is the intensity of solar radiation, kW; I ( R b , k t , I 0 t ) is the total solar radiation after considering the solar radiation, sun index, photovoltaic tracking type and other factors; T is the degree of atmosphere; and α T is the power temperature coefficient.

2.2.2. CCHP System

Gas turbine is a device that converts thermal energy generated by combustion gas into mechanical energy. Gas turbine is mainly composed of air compressor, gas combustion chamber, turbine, control system and related auxiliary equipment. In general, many parameters of a gas turbine are fixed after the type and capacity are determined, so the heat and power supply of the gas turbine is also a certain value under the given input (fuel), that is, the rated thermoelectric ratio of the gas turbine CCHP system [31]:
η = Q h Q e
where η is the rated thermoelectric ratio of the system, and Q h , Q e are the heat and power production of gas turbine, respectively.
The power generation efficiency of the micro gas turbine is related to the output power, and the amount of natural gas consumed, and heat generated by the gas turbine is calculated as follows:
{ Q C C H P ( t ) = P e ( t ) ( 1 η e ( t ) η l ) η e ( t ) V M T = P e ( t ) Δ t η e ( t ) × L H V N G
where Q C C H P ( t ) is the exhaust residual heat of the gas turbine at time t, kW; P e ( t ) is the output of the gas turbine at time t, kW; η e ( t ) is the power generation efficiency of the gas turbine at time t; η l is the heat loss coefficient of the gas turbine; V MT is the natural gas consumption per unit time, Nm3/h; and L H V N G is the low calorific value of natural gas, kWh/m3.

2.2.3. Energy Storage System

There are three kinds of state of battery energy storage system, namely, discharge state, charging state and outage state, in which state of charge (SOC) is the only state variable. This paper studies the optimization problem of the micro-grid system, mainly considering the charging and discharging power and current power of the energy storage system.
The mathematical modeling of battery energy storage system is carried out by considering the battery SOC and charging and discharging power, the model is shown as follows [32]:
Charging process:
S O C ( t ) = ( 1 δ ) S O C ( t 1 ) + P c Δ t η c / E c
Discharge process:
S O C ( t ) = ( 1 δ ) S O C ( t 1 ) + P d Δ t / E c η d
where E c is the rated capacity of the battery, kWh; P c is the charging power of the battery, kW; P d is the discharging power of the battery, kW; S O C ( t ) is the remainder of the battery after the T period; S O C ( t 1 ) is the remaining amount of electricity of the battery after the T period; η c , η d  is the charge and discharge efficiency of the battery, respectively, percent; and δ is the battery’s own discharge rate, percent per hour.

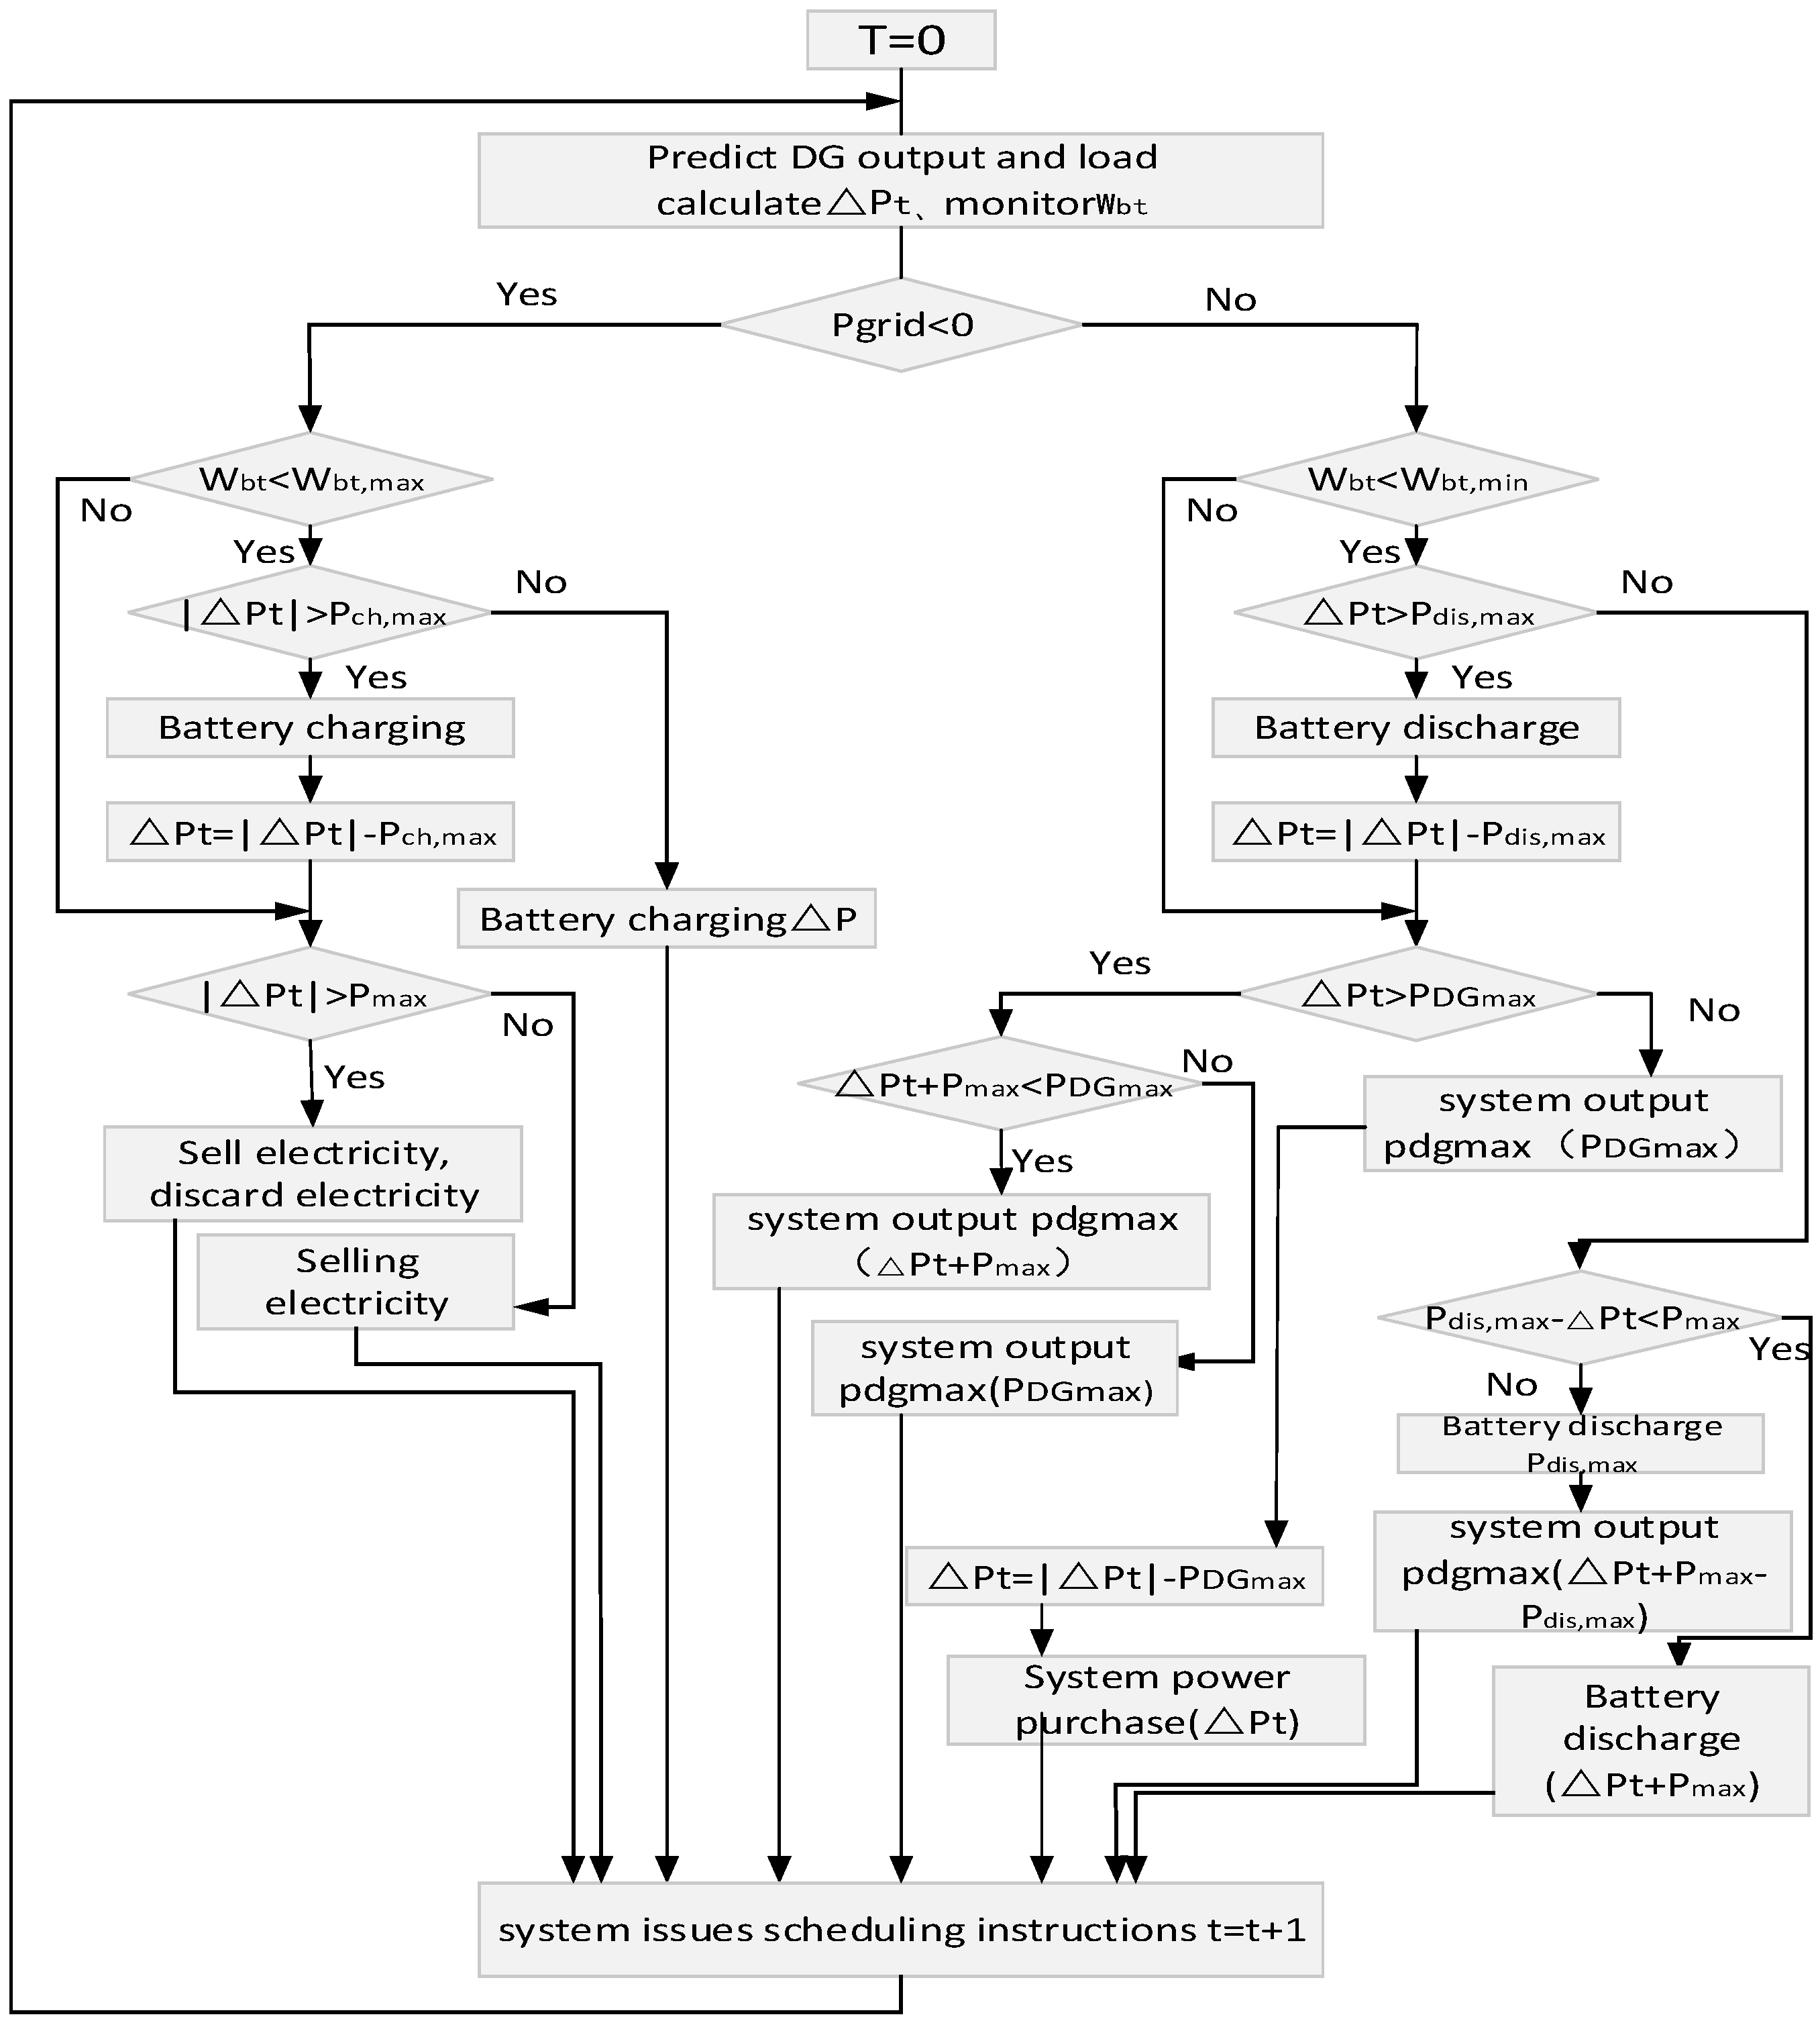
2.2. Operation Strategy

In this paper, the operation strategy of micro-grid is established by considering the demand response mechanism. In the operation strategy presented, the main objects involved in micro-grid scheduling include PV system, energy storage system and electric load. In this study, the demand response optimization scheduling period T is set to 5 min, and the operation optimization is primarily focused on 1440 min per day considering the system operates 1440 min per day. In the operation strategy presented, the power exchange between the micro-grid system and the power grid is the first consideration, and it is represented by P g r i d . According to the situation of P g r i d , the operation strategy is divided into two cases. Micro-grid demand response optimization system is shown in Figure 2 [30,33].
In Figure 2, T is the current scheduling time; Δ P t is the difference between the micro-grid load and the micro-grid output at the same moment; P m a x is the upper limit of the interactive power; P c h , m a x and P d i s , m a x are the current maximum allowed charging and discharging rate of the battery, respectively; W b t , m a x and W b t , m i n are the maximum and minimum allowed electric energy of the battery, respectively; and P D G , m a x is the sum of the current maximum output of each micro power.
If P g r i d > 0 , the total distributed and energy storage power cannot meet the total power demand of the system, and the system needs to purchase electricity from the power grid. At this time, the load state of the energy storage is considered firstly. If the energy storage cannot meet the load demand of the system, then distributed output is considered. Finally, the purchase quantity and the response price are determined, and the dispatching instruction will be sent to the system.
If P g r i d < 0 , the total power demand of the system is less than the distributed and energy storage power, the system will sell some electricity to the power grid. At this time, the load state and charging requirement of the energy storage are considered firstly. Then, the amount of electricity sold by the micro-grid will be determined and the system issues scheduling instructions.

3. Optimization Model

3.1. Objective Function

This section establishes an optimization model for the real-time output of each micro source of micro-grid in a building with CCHP and energy storage. In this study, the load of T period is predicted based on every T-1 period. As the gas turbine responds faster than the steam turbine, the T period is set to 5 min. That is, the output of each micro source for the next 5 min is adjusted during the T-1 period, and the user is prompted to participate in grid interaction under different electricity prices, so that the utilization rate of the distributed generation is improved by adjusting the load and the electric energy in response to the electricity price incentive signal on the premise of meeting user comfort requirements, as well as ensuring that the system can absorb as little electricity as possible from the power grid to reduce the operating cost of the system. This section takes the lowest operating cost as the objective function to optimize the time T output of each power generation unit. the objective function is as follows:
F = m i n C o p + C E = 0 T ( i = 1 n C i P i + P f u e l V 60 + C b a t , d e p + C B g r i d + j m ( δ E , j Q j + ζ j ) )
C B g r i d = { K b P g r i d , P g r i d > 0 K s P g r i d , P g r i d < 0
where F is the total cost of the system; C o p is the overall cost of building system, which mainly includes the cost of electric energy absorbed by the building system from the power grid and the operating cost of distributed generation and energy storage; C E is the environmental costs; T is a response period; C i is the operating costs of second distributed generation systems, Yuan/kW; P f u e l is gas price, Yuan/m3; V is the gas consumption per unit time, Nm3/h; P i is the output of distributed generation during the response period, kw; C b a t , d e p is the charge/discharge depreciation cost per unit time of energy storage, Yuan/kWh; δ E , j is the environmental value for the pollutant j, Yuan/ kg [34]; Q j is the pollutant discharge level, kg; ζ j is the penalties for the punishment of pollutants and the magnitude of the fines of the main polluted gases are detailed in References [35,36]; C B g r i d is the electricity cost of the micro-grid during the response period, Yuan/kWh; K b is the purchase price, changing with demand response price policy, Yuan/kWh; K s is the selling price of micro-grid in response time, determined by the local distributed generation grid electricity price, Yuan/kWh; and P g r i d is the tie-line switching power, kW. If P g r i d > 0, power is purchased from the grid; and, if P g r i d < 0, power is sent back to the grid.

3.2. Constraints

3.2.1. Load Resource Constraints

Multi-load resource constraints mainly consider the output constraints of distributed photovoltaic generation and the interruptible load, adjustable load and shiftable load constraints involved in demand response.
(1) Photovoltaic output constraint
To ensure the stability of the operation, the actual output power of distributed photovoltaic has strict upper and lower limits:
P p v m i n ( t ) < P p v ( t ) < P p v m a x ( t )
where P P V ( t ) is the actual photovoltaic output at time t(kW), and P p v m a x ( t ) and P p v m i n ( t ) are the maximum and minimum values of the output power of the solar battery group at time t, respectively (kW).
(2) Interruptible load constraint
The power demand of the interruptible load can be interrupted at any time. Interruptible loads have no constraints on the constant total power consumption during the study period.
P I L m i n ( t ) < P I L ( t ) < P I L m a x ( t )
where P I L ( t ) is the actual power of the interruptible load at time t (kW), and P I L min ( t ) and P I L max ( t ) are the minimization and maximum power of interruptible load, respectively (kW).
(3) Adjustable load upper and lower limit constraints
μ C U T ( t ) P C U T m i n ( t ) < P C U T ( t ) < μ C U T ( t ) P C U T m a x ( t )
where P C U T m a x ( t ) and P C U T m i n ( t ) are the upper and lower limits of the curtailable load reduction at time t (kw); μ C U T ( t ) is the state of the load at time t, where μ C U T ( t ) = 1 indicates load is cut, and μ C U T ( t ) = 0 indicates that the load is not cut; and P C U T ( t ) is the reduction of the curtailable load at time t (kW) [37].
(4) Transferable load constraint
For shiftable load constraints, the time window for load shift is mainly considered. The acceptable shift interval of shiftable load is [ T t r α T t r β ] .
T t r α T t r T t r β

3.2.2. Run Constraints

To improve the energy efficiency, the distributed generation in this study operates under the condition of grid connection, so the system power input must meet the load demand of micro-grid. The power balance of the system is as follows [38].
P l o s s + P c o r e + P l o a d = k = 1 N P k i ( t ) + P g i r d ( t ) + P s t o r a g e ( t )
P l o a d = i = 1 M P i ( t ) x i ( t )
where P i ( t ) is the active power of the load (kW), which mainly refers to the controllable load in the system; P c o r e is the core load power (kW); P l o a d is the controllable load power involved in demand response in the system (kW); P l o s s is the line loss during power transmission (kW); P g i r d ( t ) is the power absorbed by the system from the grid at time t (kW); and P s t o r a g e ( t ) is the storage battery charging and discharging power at time t (kW), where positive values indicate discharge, and negative values indicate charge.

3.2.3. Energy Storage Constraint

Storage battery constraint is to ensure its normal operation, make full use of the photovoltaic output, improve the service life of the battery, save maintenance costs, and meets the maximum charge and discharge power constraints, and state of charge constraints.
| P s t o r a g e ( t ) | { P d i s m a x P s t o r a g e ( t ) > 0 P c h m a x P s t o r a g e ( t ) < 0
S O C m i n < S O C ( t ) < S O C m a x
where P d i s m a x > 0 is the maximum discharge power; P c h m a x < 0 is the maximum charging power; and S O C m a x and S O C m i n are the upper and lower limits of the remaining capacity, respectively.

3.2.4. Customer Comfort Constraints

User comfort constraint is to ensure that the user’s normal work and life electricity demand, that is, meet the basic temperature requirements and equipment operating time constraints.
(1) Temperature constraint
T m i n ( t ) < T ( t ) < T m a x ( t )
where T m a x ( t ) and T m i n ( t ) are the upper and lower limits of user’s temperature demand for temperature control equipment, respectively (°C).
(2) Runtime constraints
The shiftable load runs continuously in a certain time, and the running time constraints are as follows.
x i ( t ) = { 1 t o n ( X i ) t t o n ( X i ) + Δ t ( X i ) 0 t < t o n ( X i ) o r t > t o n ( X i ) + Δ t ( X i )
where x i ( t ) is the operational state of the transferable load; t o n ( X i ) is the time the device starts running; and Δ t ( X i ) is the device scheduling period.

4. Solution Method

4.1. Algorithm Introduction

Genetic Algorithm (GA), a computational model that was first mentioned by Professor J. Holland of Michigan University in the United States in 1975, simulates the natural selection of Darwin’s theory of biological evolution and the evolutionary process of the genetic mechanism, and is a method of searching the optimal solution by simulating the natural evolution process. Genetic algorithm is widely applied in bioinformatics, phylogeny, computing science, engineering, economics, chemistry, manufacturing, mathematics, physics, drug measurement and other fields, [39]. The genetic algorithm also has the following characteristics:
(1)
The genetic algorithm starts the search from the string set of the problem solution, instead of starting from a single solution. This is a great difference between the genetic algorithm and the traditional optimization algorithm. The traditional optimization algorithm is to obtain the optimal solution from a single initial value iteration, and it is easy to get into the local optimal solution. The genetic algorithm is searched from the set of sets, and its coverage is large. These attributes are beneficial to the global optimization.
(2)
The algorithm itself is easy to parallelize. Genetic algorithm can simultaneously manage multiple individuals in a group. In this process, GA can evaluate multiple solutions in the search space to reduce the risk of falling into the local optimal solution.
(3)
Genetic algorithm performs individual evaluation by fitness function value. The whole process basically does not need other knowledge or auxiliary information of search space. The fitness function in the algorithm is not only restricted by continuous and differentiable, but also the domain of its definition can be set arbitrarily. This feature makes the application scope of genetic algorithm greatly expanded.
(4)
The genetic algorithm uses the rule of probability instead of deterministic rule in determining the direction of search.
(5)
When genetic algorithm organizes search by information obtained from evolutionary process, individuals with large fitness have higher survival probability and get more adapted genetic structure. It has self-organization, self-adaptive and self-learning habits.
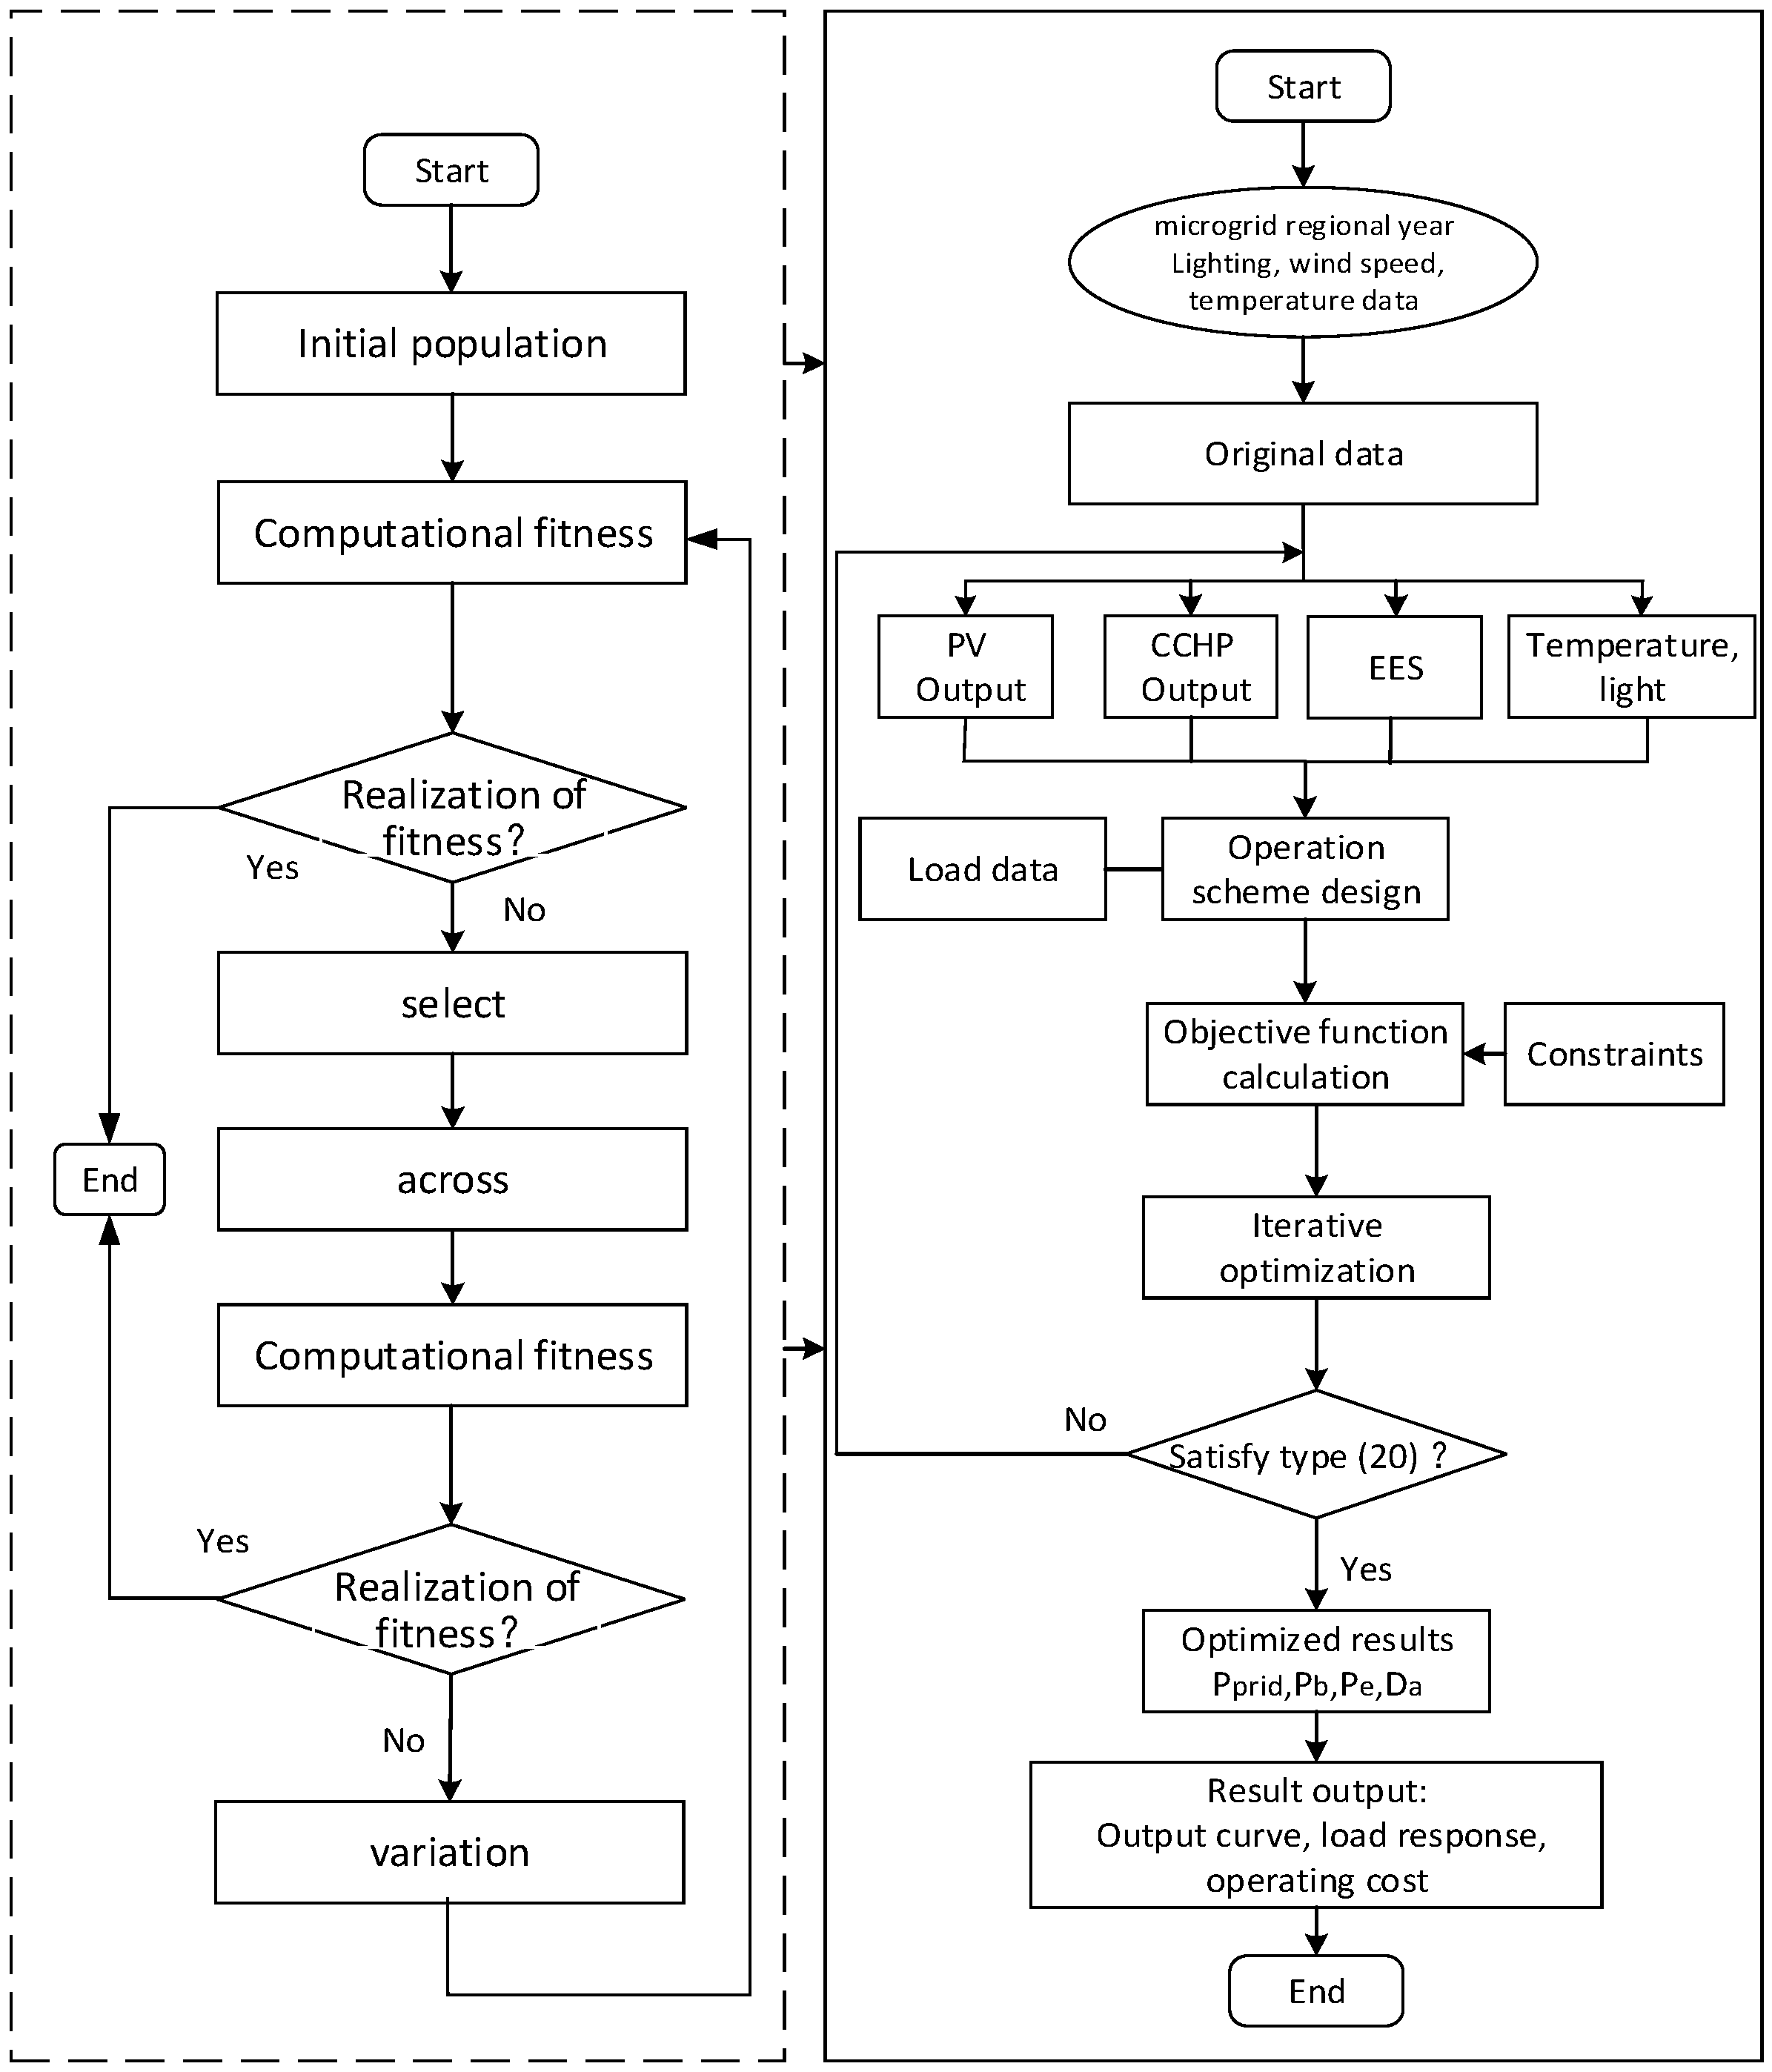
In this study, GA is used to transform the objective function, and, because of the randomness of GA, the searched Pareto non-dominated solution is randomly distributed around the optimization poin to realize the economic operation optimization of the objective interval. The conversion method of the objective function is as follows:
{ a F ( X ) b X S R
Q = ( F ( X ) a + b 2 ) 2
where X = ( X 1 X 2 X 3 × × × X m ) ; S is the decision space of X; a and b are the upper and lower limits of the objective function, respectively; and Q is the converted objective function.

4.2. Solution Flow

Considering the distributed output and load demand, the upper and lower limits of each decision variable are determined. According to the operation strategy of micro-grid, the proposed model is solved by GA. This section applies the algorithm to the micro-grid economic operation optimization based on the demand response side. The flow chart of the algorithm is shown in Figure 3.
The implementation steps of using genetic algorithm to solve the economic operation optimization problem of micro-grid system based on demand response are introduced as follows:
(1)
Determine the system optimization variables. System optimization variables include photovoltaic output P p v , the charging and discharging current of the storage battery P b , discharge depth D a , gas turbine output P e , tie-line power P g r i d and electricity price information.
(2)
Input the basic data of case analysis. Optimization objectives, system control strategies, optimization period T = 5 min, optimization time interval ϖ , DER unit in the micro-grid system, energy storage unit parameters, the initial optimization time t = 0 , etc.
(3)
According to the system operation scheme and annual load data in the previous section, the system operation simulation for 1440 min a day is completed, and the daily output of the photovoltaic, the gas turbine unit, the discharge depth of the storage battery, the charging and discharging current, and the tie-line power are obtained.
(4)
According to the obtained optimization results and the set constraints, the objective function is calculated and iterative optimization is carried out.
(5)
Output results: Output the optimal decision variable result (optimization curve and calculation result) and the optimal value of the problem to be optimized, and the algorithm ends.
Genetic algorithm is a continuous iterative process. Each iteration will update the individual extremum and group extremum, and the adaptability of the solution compared with the previous solution results. If the difference between the two solutions is less than or equal to the set minimum deviation value K or the number of iterations reached the set maximum number of iterations N max , i.e., Equation (20) is satisfied, the algorithm stops the iteration and outputs the optimization result [26].
{ H i H i 1 K N N m a x
where H i and H i 1 are the result of iteration i and i−1, respectively.

5. Simulation

5.1. Scenario Introduction

This paper selects a demonstration project of micro-grid in a demonstration park as an example analysis. The building micro-grid system mainly includes distributed generation, energy storage device, electric vehicle and various load resources. Among them, the system mainly contains 1.5 MW combined cooling, heating and power system (CCHP) unit, 400 kWp roof photovoltaic, 300 kWh battery energy storage, 667 kW central air conditioning, lighting equipment and other multiple electrical load resources. In addition, the micro-grid system is equipped with advanced automatic demand response system, so that the system can monitor the user’s power consumption in real time, upload data to the micro-grid control center, and obtain the latest electricity price information from the system, and promote users to participate in demand response.
The building micro-grid has infrastructure and electricity load requirements to participate in demand response, so users can participate in the demand response mechanism flexibly, and the current demand response mechanism is mainly based on the price mechanism. In this study, two price mechanisms can be executed in the building micro-grid currently: fixed price and DR prices. The fixed electricity price is 1.02 Yuan/kwh, DR prices contains real-time price (RTP) and time-of-use price (TOU). The time-of-use price is shown in Table 1, and the real-time price is shown in Figure 4.
TOU: Time-of-use price is an economic means to encourage consumers to change the mode of electricity consumption and avoid peak electricity consumption, which is good for cutting peaks and filling valleys, improving the load rate of the power system and running stably. In this study, TOU price is divided into three periods: on-peak hours (10:00–15:00) price = 0.90 (Yuan/kWh), mid-peak hours (6:00–10:00 and 15:00–18:00) price = 0.45 (Yuan/kWh), and off-peak hours (other hours) price = 0.451 (Yuan/kWh).
RTP: Forecasted RTP price is shown in Figure 4.
In this study, real-time prices change once an hour, and the factors of electricity price formulation mainly contain the current power load and the economy and safety of the power grid operation.

5.2. Basic Data

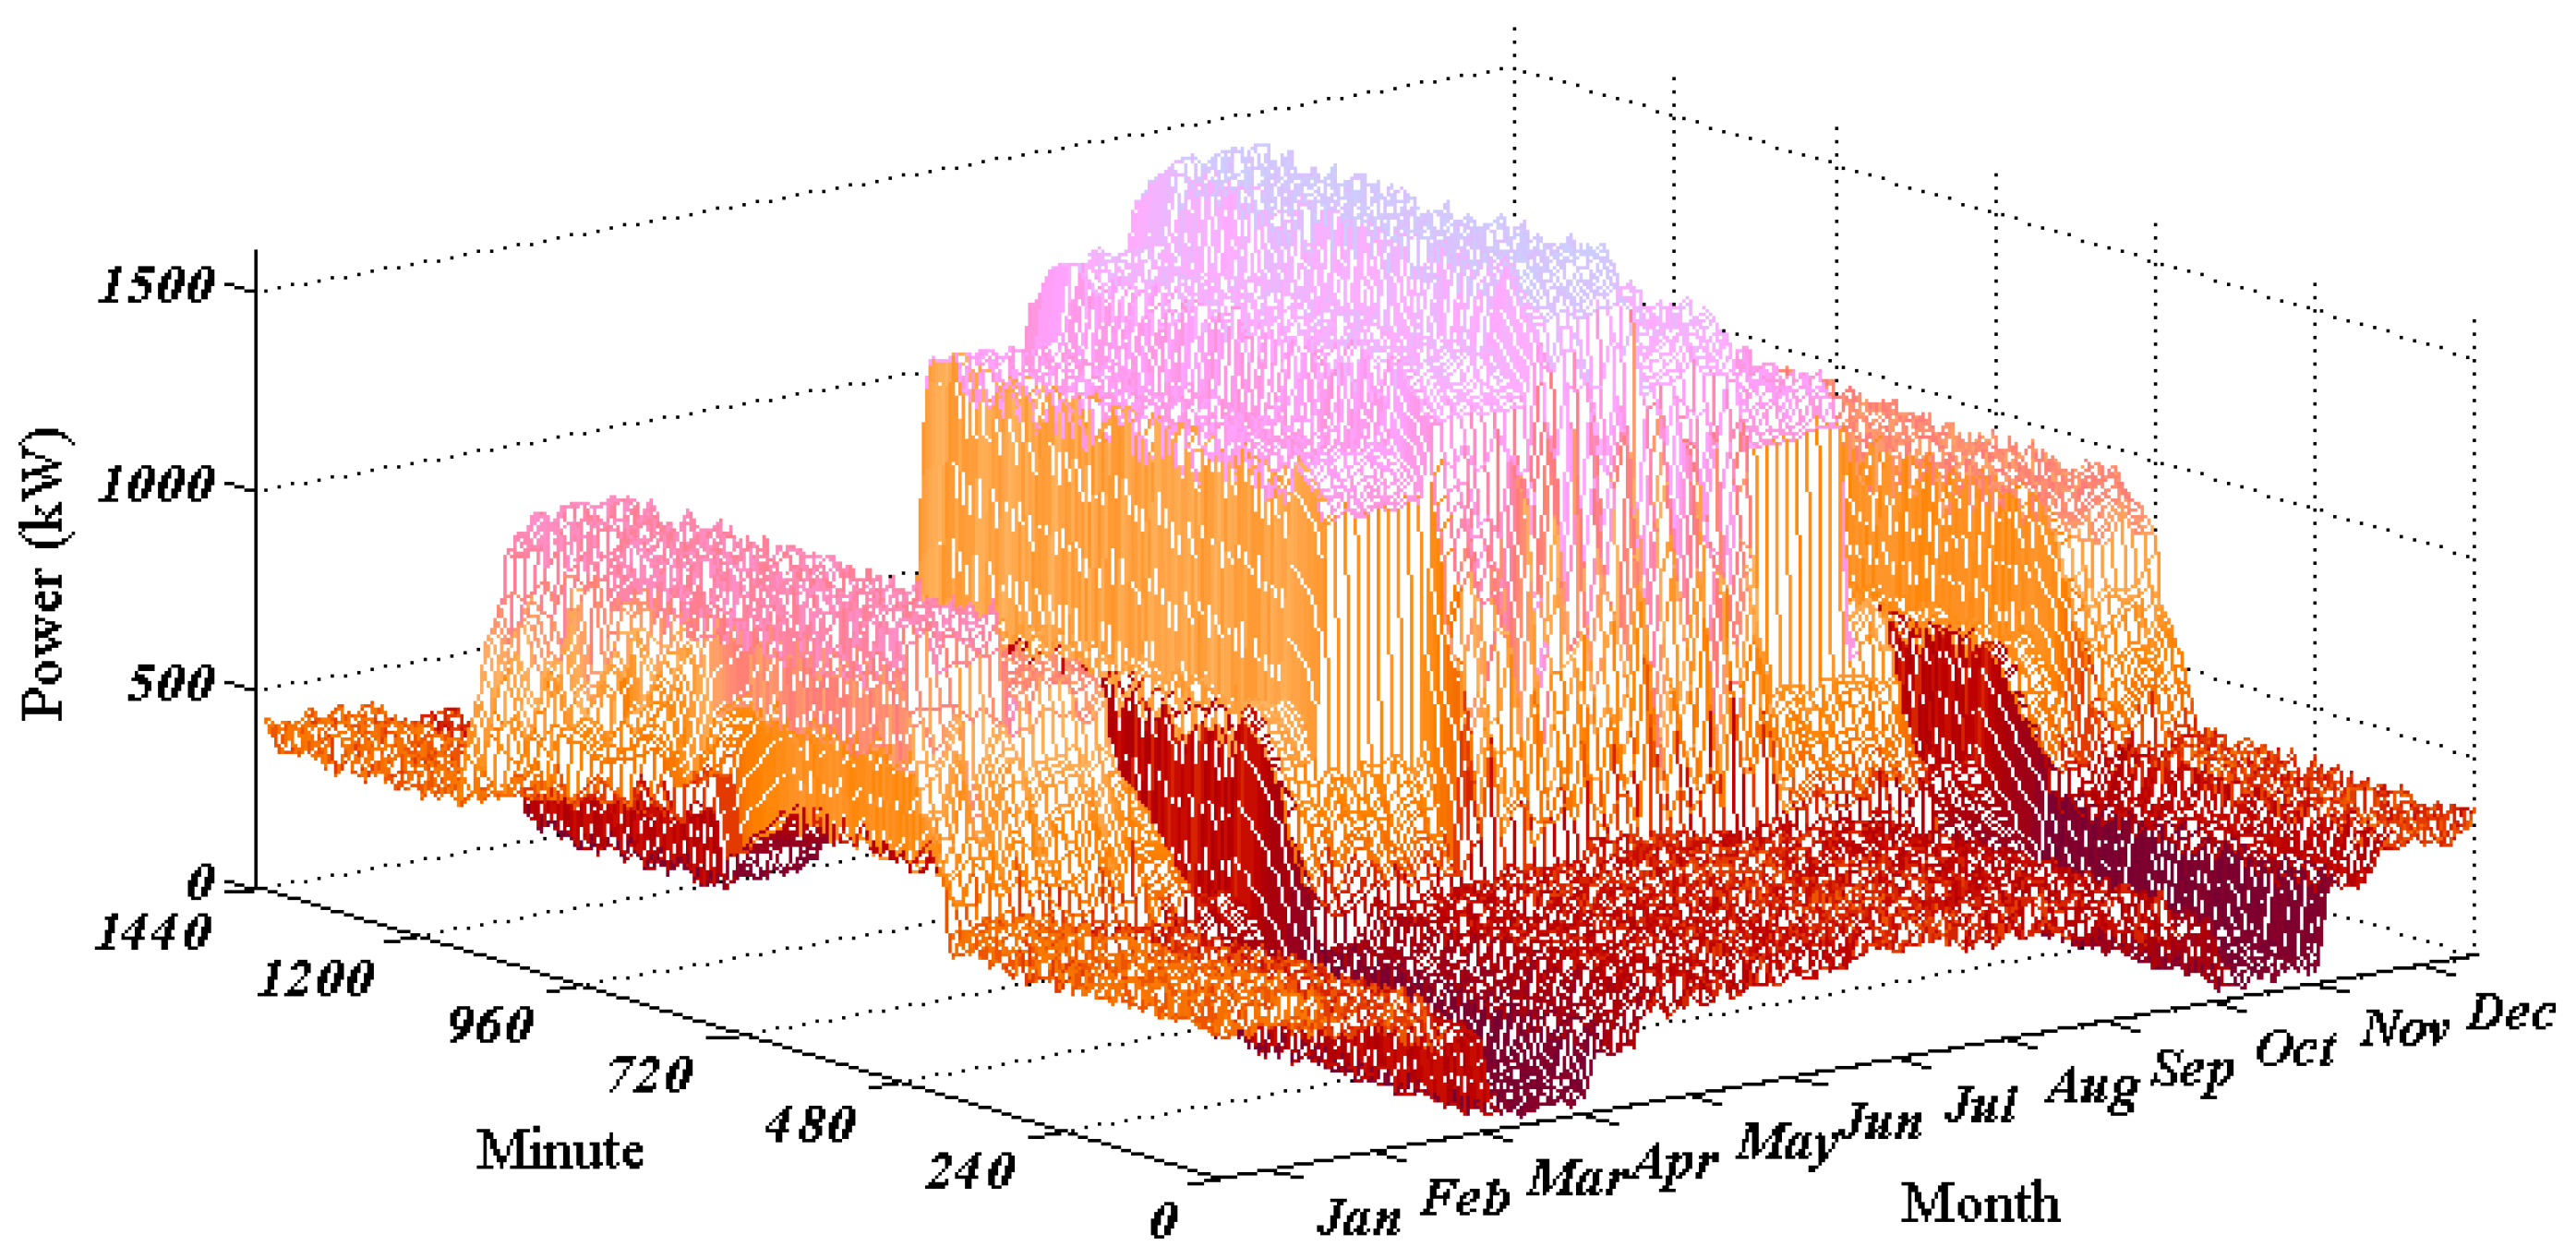
5.2.1. Electric Load

The design load installation power of the micro-grid is 667 kW. This paper selects 1440 min of historical operation data of the demonstration project in 2016, because it takes too long to optimize 525,600 points to run the year-round data, this paper randomly extracts 10 days of load data from 2016 monthly, as shown in Figure 5, and uses it as the original load data.
The micro-grid system mainly supplies power to buildings, and the electricity demand mainly comes from adjustable loads such as building lighting, air conditioning, shiftable loads such as washing machines, rice cookers, electric vehicles and monitoring and office equipment of buildings. Table 2 shows the parameters for several shiftable loads.

5.2.2. Energy Storage Parameter

The lithium battery monomer capacity is 180 Ah. The series-parallel structure of lithium battery is calculated according to the working range of the micro-grid step-down transformer and the energy storage demand capacity. Overall, 222 blocks in series can satisfy the voltage range of the transformer, and the number in parallel is 3. The actual cumulative throughput of the lithium battery is 1.99 ×10⁷ Ah. The parameters of the battery are shown in Table 3.
The discharge cut-off voltage of the lithium battery monomer is 2.5 V and the charge cut-off voltage is 3.6 V. The main factors affecting the service life of lithium battery are discharge depth, discharge rate and charge/discharge times. When the accumulative effective ampere hours of the lithium battery reach the total effective throughput, the battery is considered to be scrapped [40].

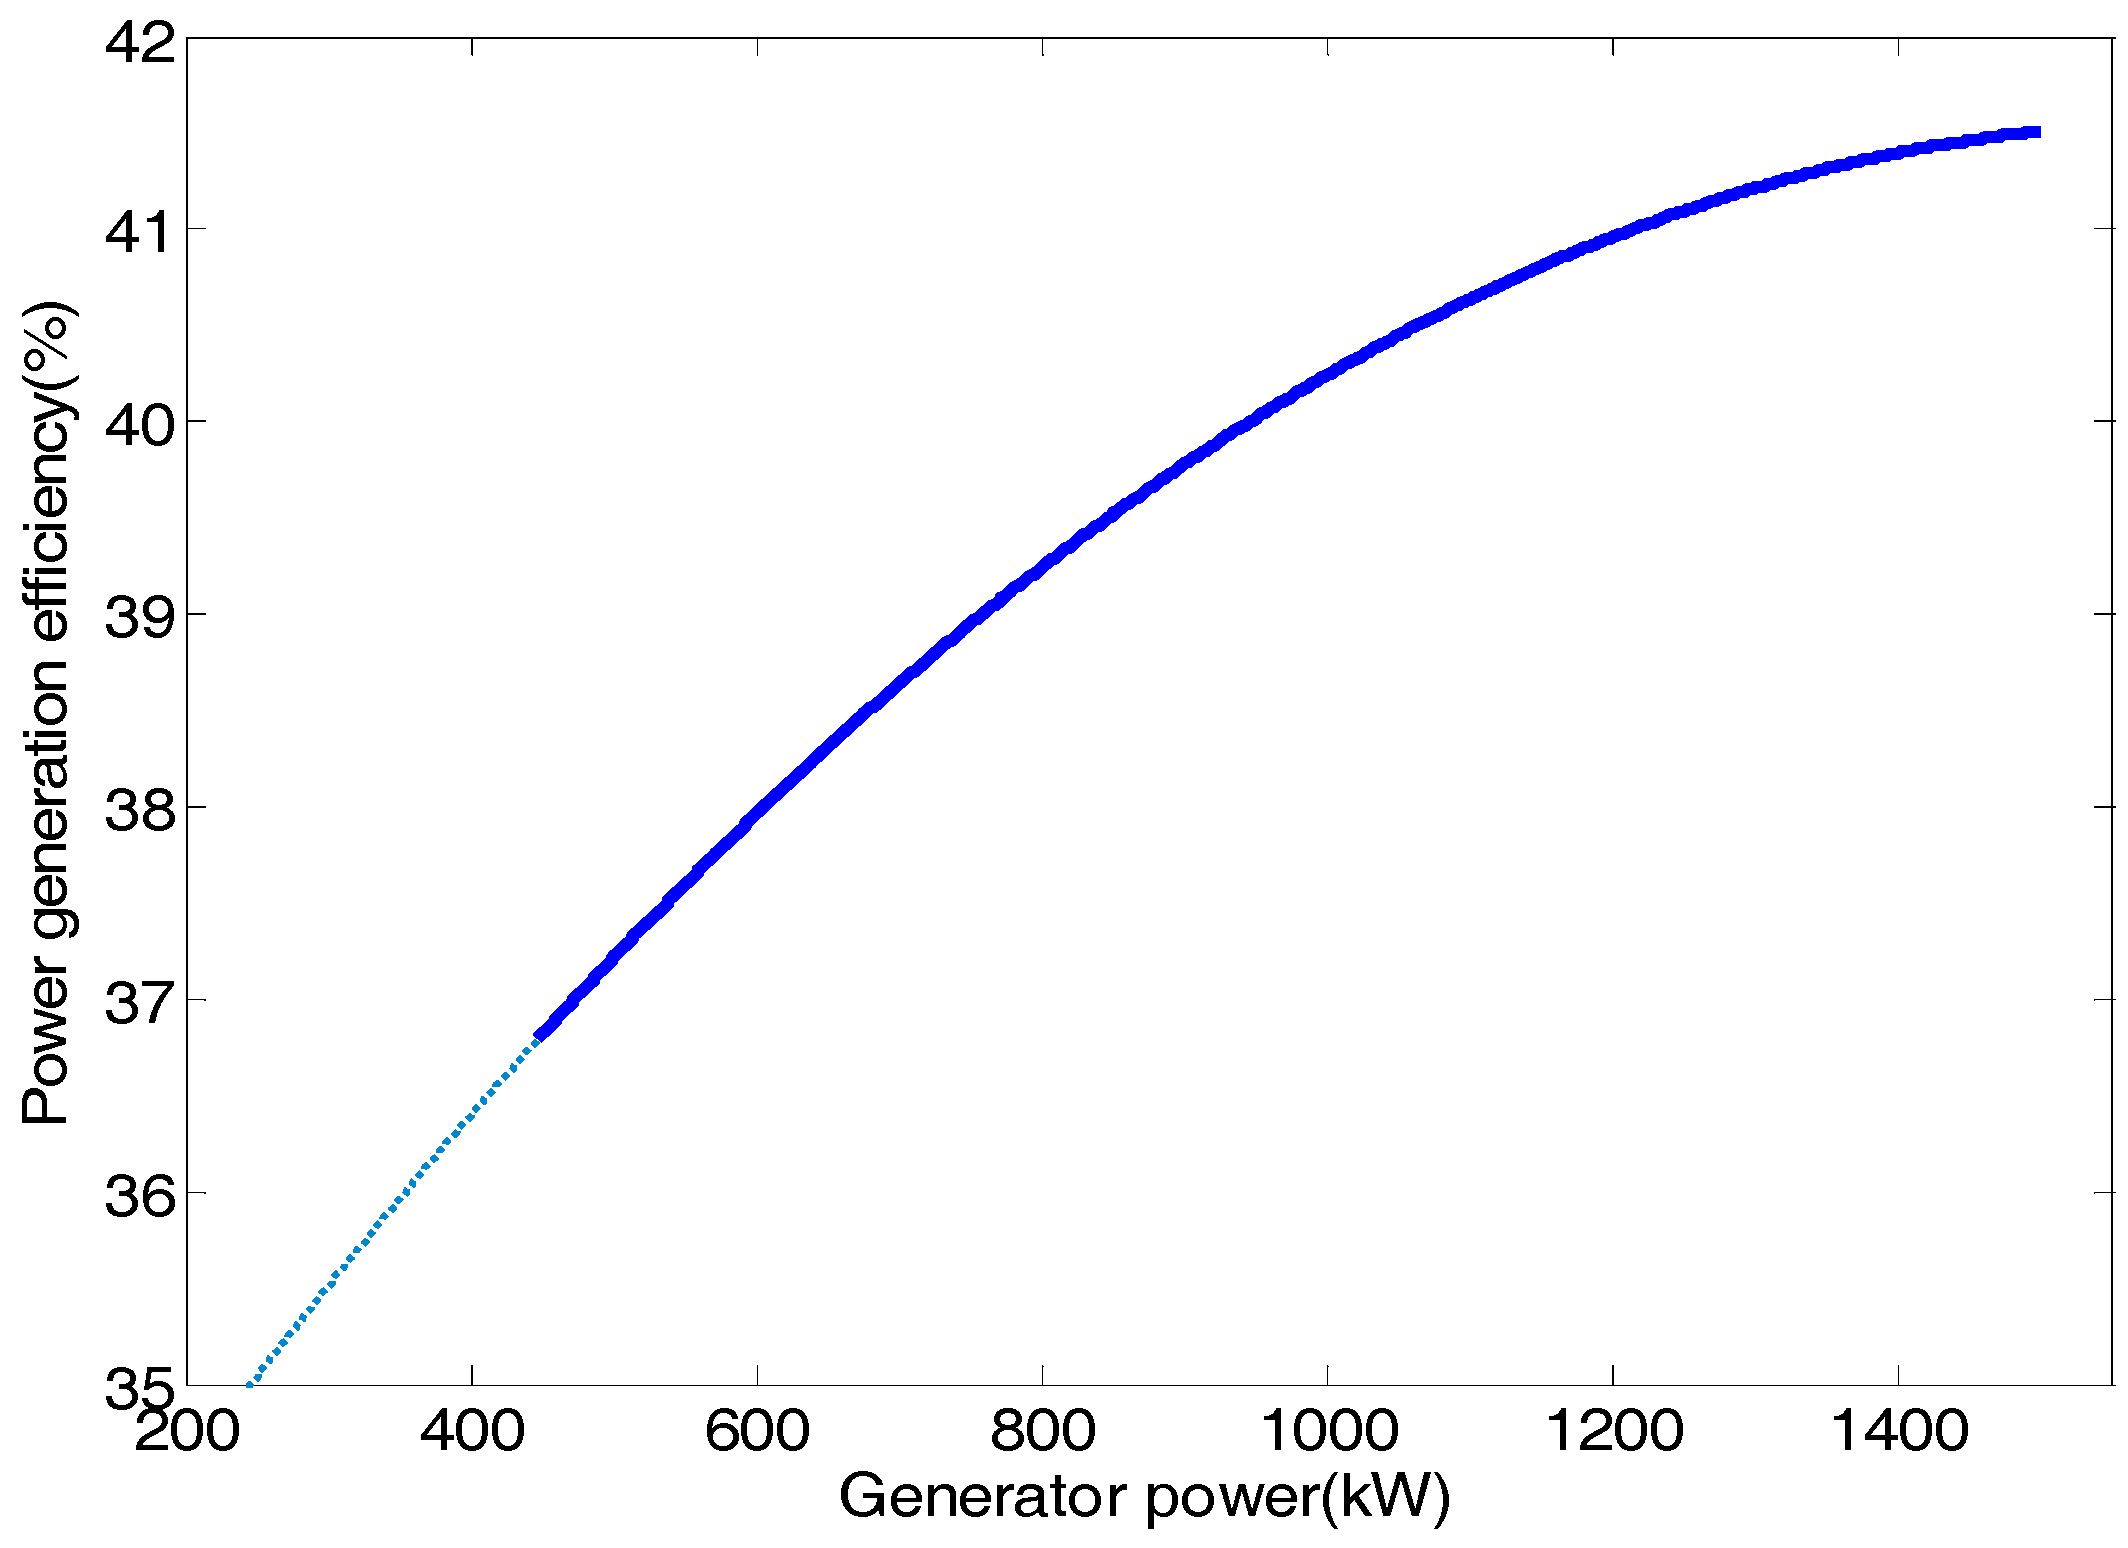
5.2.3. CCHP Parameter

Combined cooling and power (CCHP) is a small-scale, point-like distribution integrated energy supply that combines a power generation system and a heating and cooling system. In this study, CCHP provides power to the building micro-grid system, and the cost of CCHP is mainly the fuel cost (natural gas). In this study, the natural gas price is 3.14 Yuan/m3. Some parameters of CCHP in different operating conditions are shown in Table 4.
The absolute electrical efficiency of the gas turbine generator:
η e = 3600 P e Q 0
The heat consumption of the gas turbine without the heat loss of the pipeline:
Q 0 Q c p = V q 1
Q c p is the total heat consumption. q 1 is the low calorific value of natural gas, 39,000 kJ/Nm3. After fitting, the relationship between generator power and absolute electric efficiency is shown in Equation (19) and Figure 6.
η e = 3.5 × 1 0 8 P e 2 + 1.1 × 1 0 4 P e + 0.3242
The gas consumption under variable operating conditions is:
V = P e 3 . 79 × 1 0 7 P e 2 + 0 . 00119 P e + 3 . 512
As can be seen in Figure 6, the absolute electric efficiency of the gas turbine increases with the increase of the power, and the smaller the power emitted is, the faster the absolute electric efficiency of the gas turbine decreases, so it is necessary to make the gas turbine operate in the design working condition as far as possible to ensure the minimum cost [41].

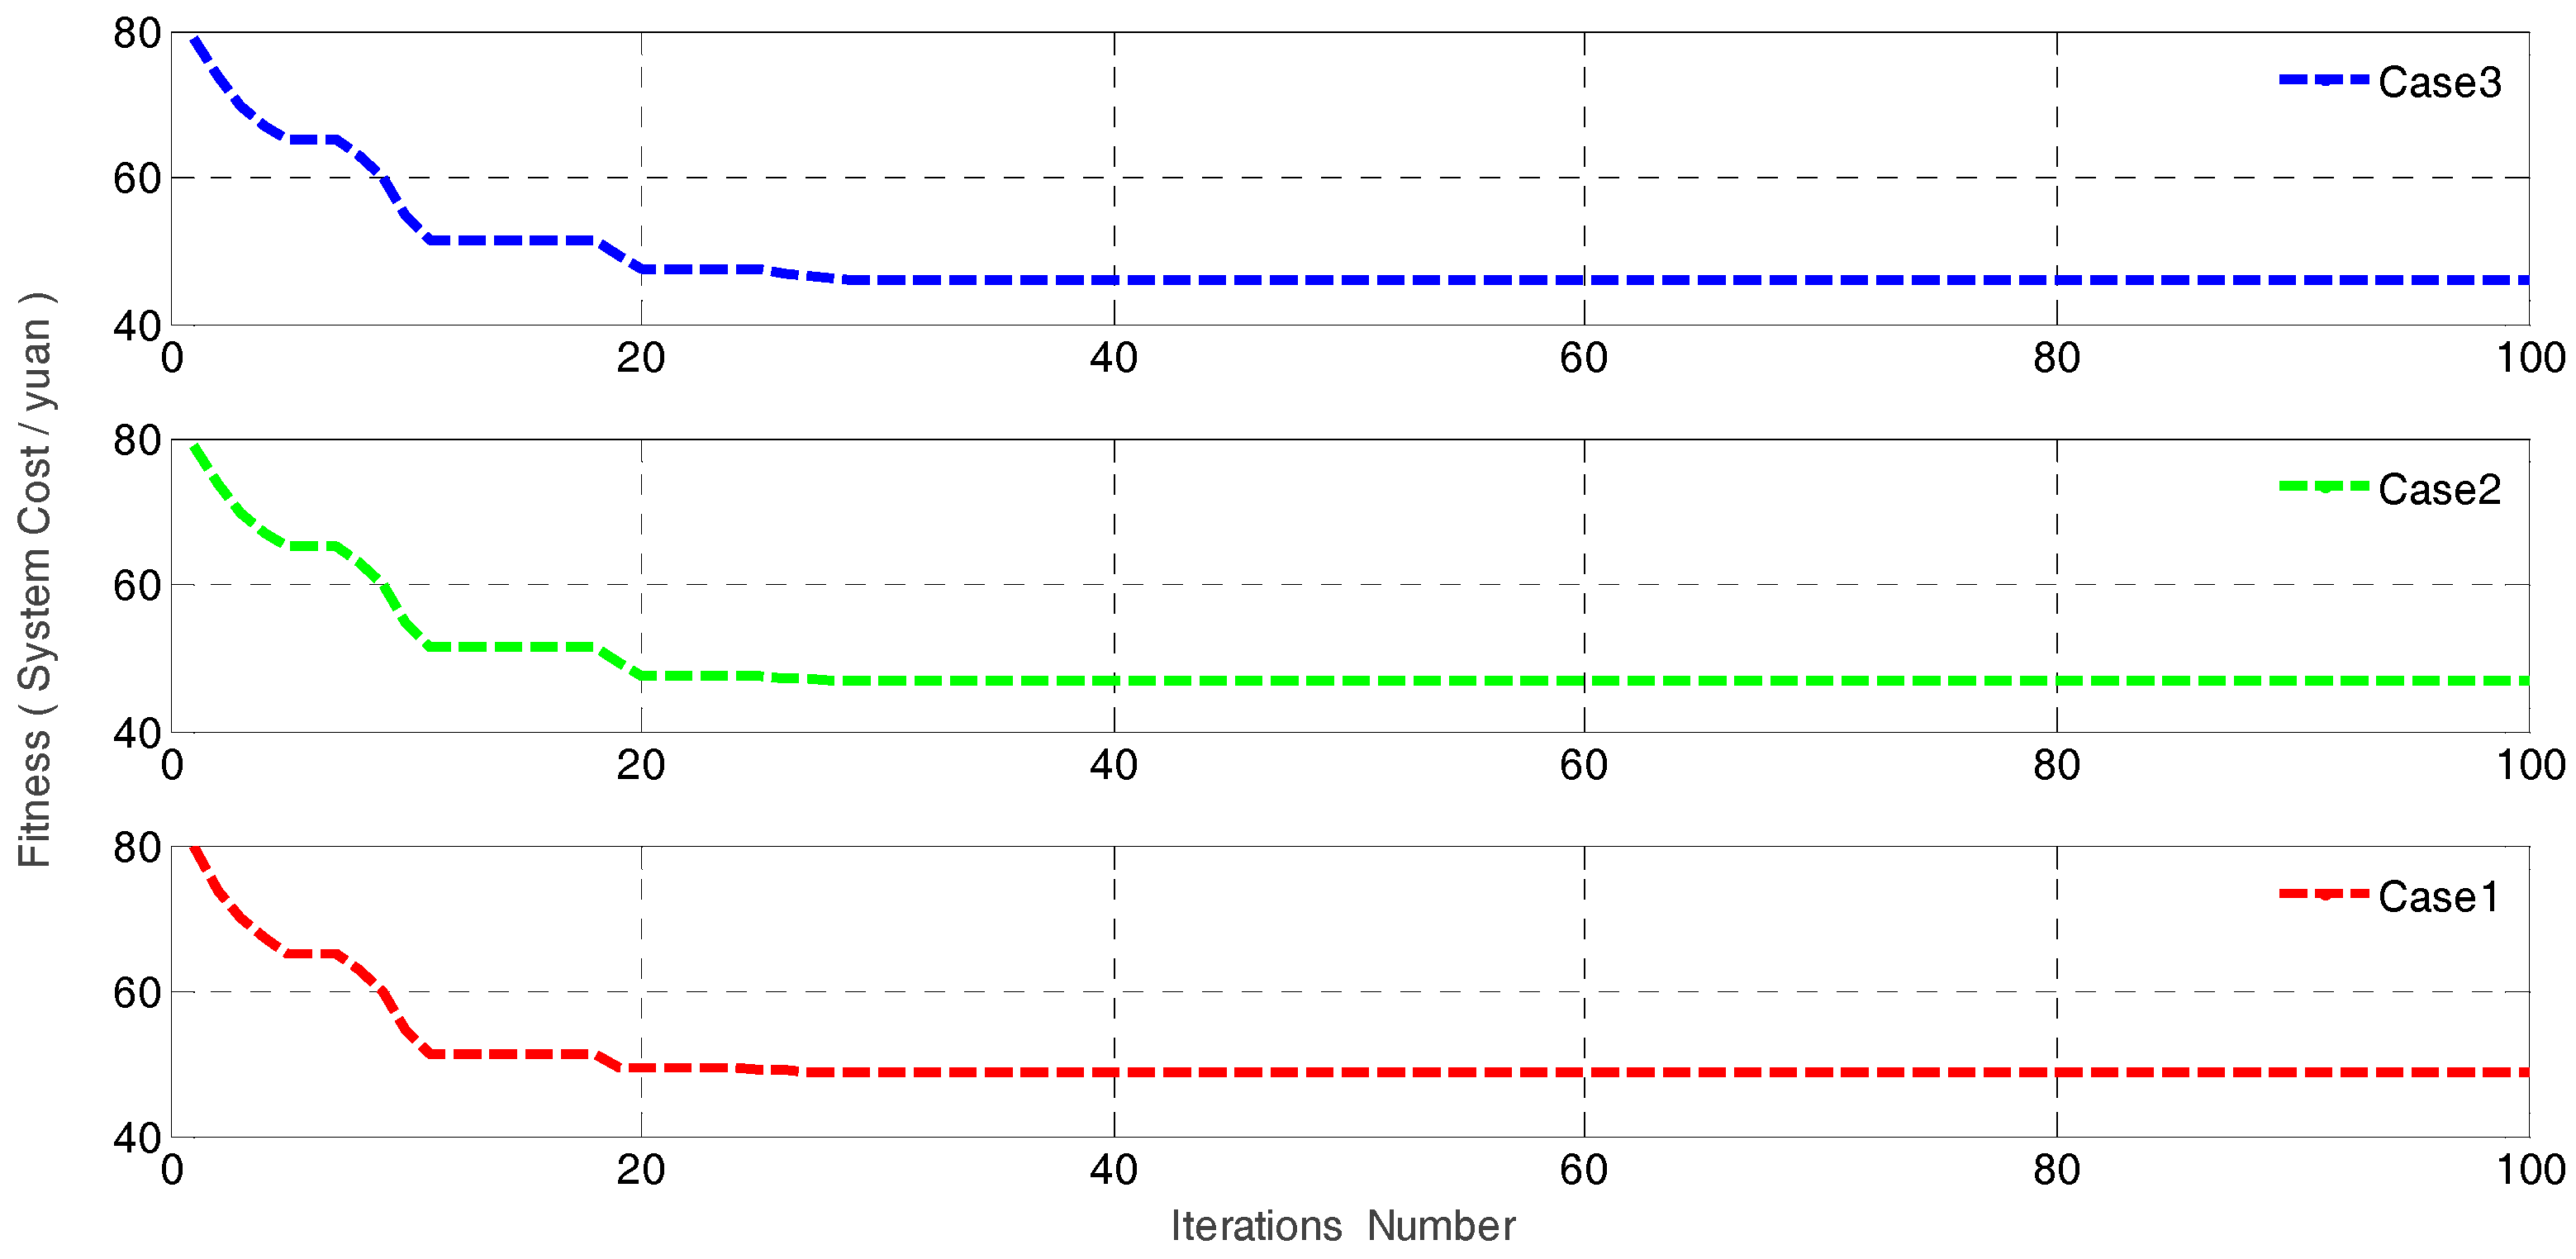
5.3. Operational Optimization
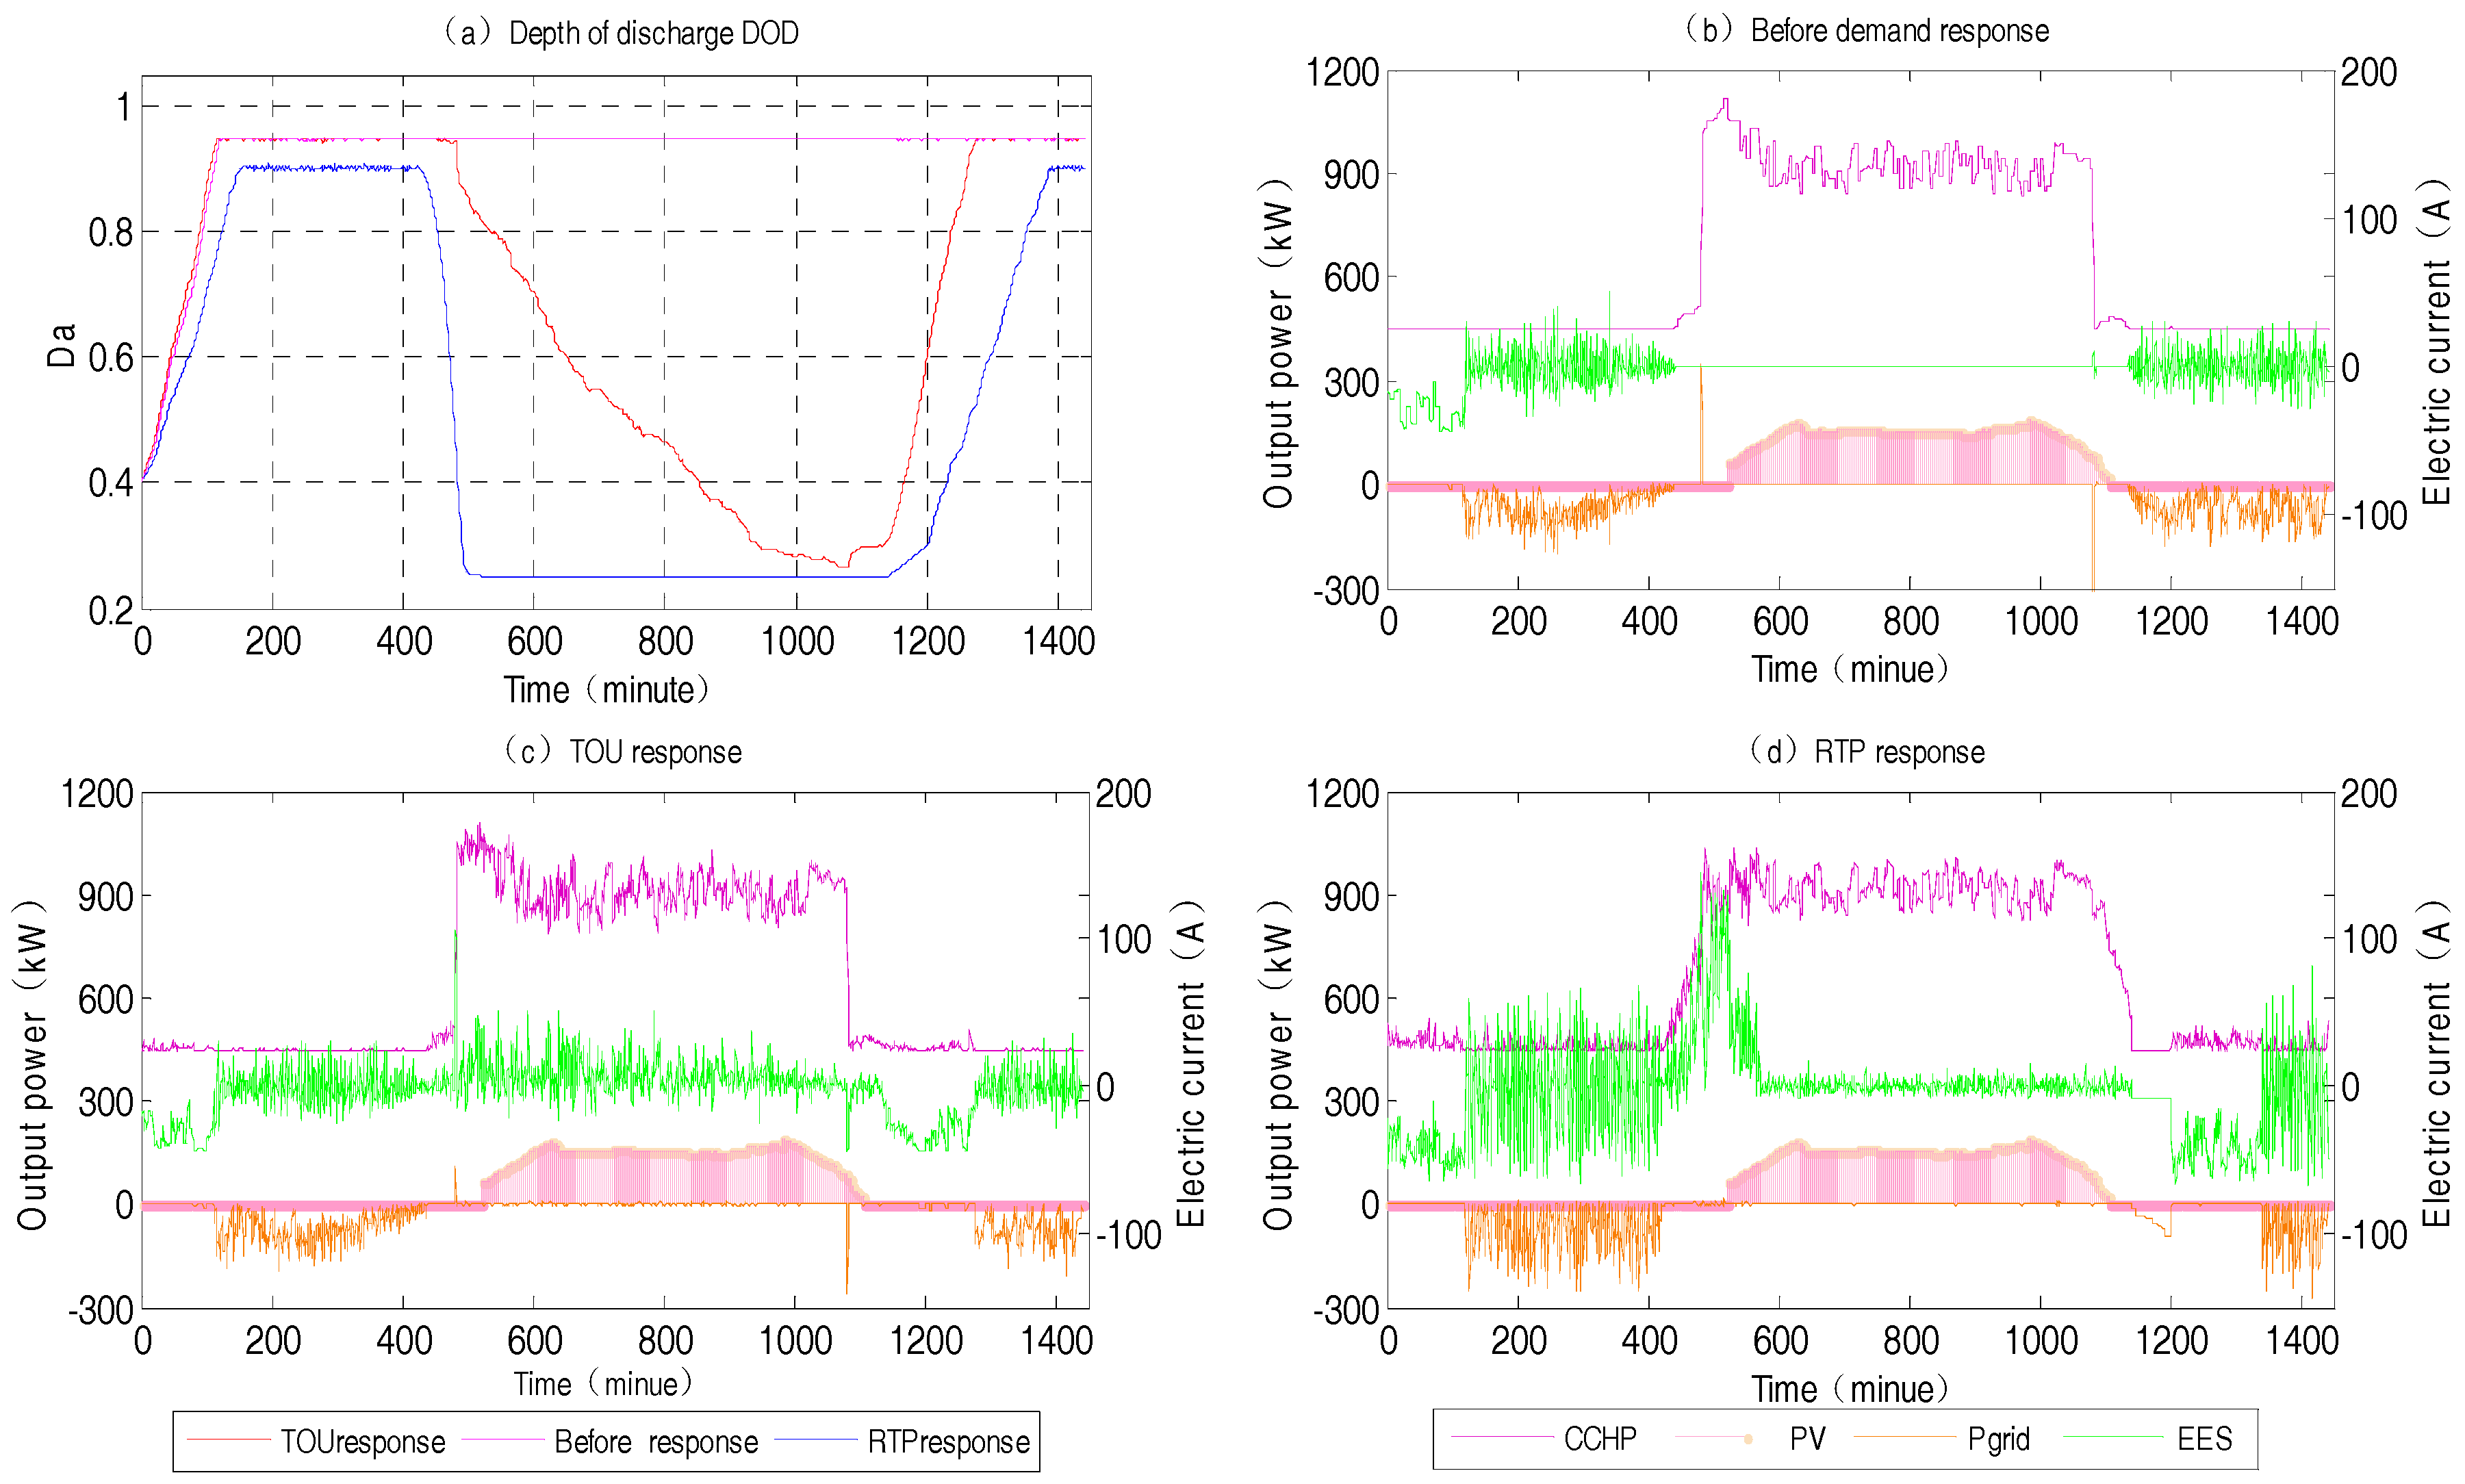
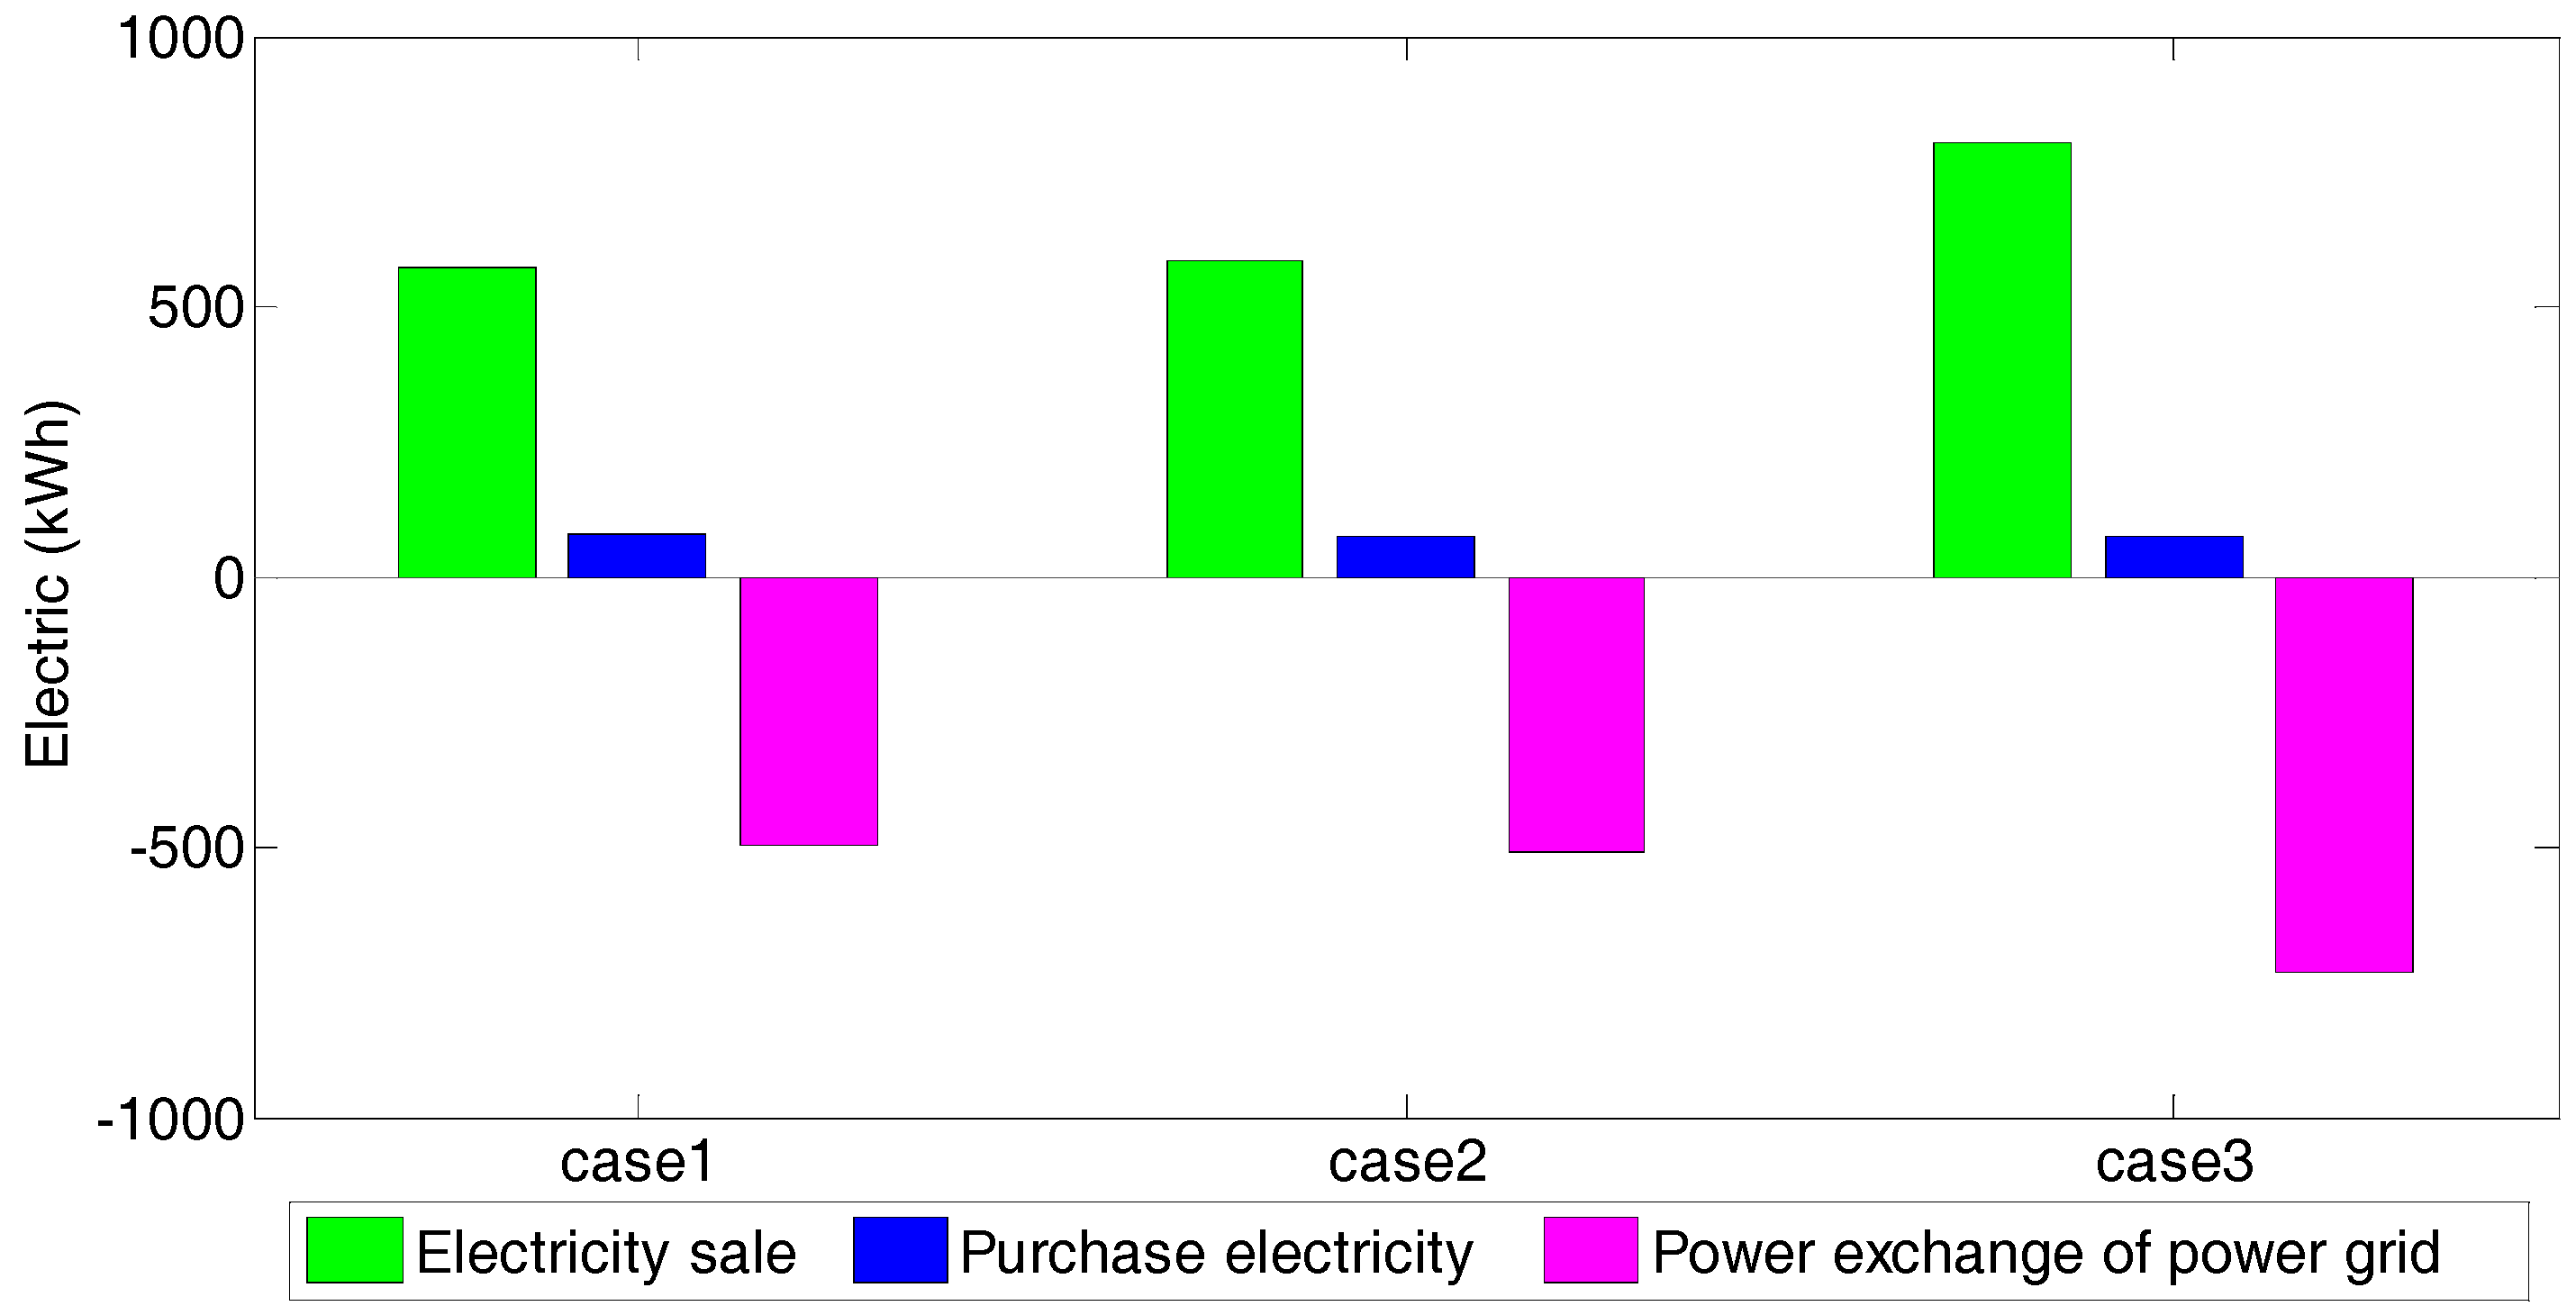
This section, based on the established micro-grid economic operation optimization model and demonstration project data, set up three scenarios for simulation, and study the impact of demand response machine on micro-grid economic operation.
Case 1: Basic situation. This scenario does not introduce demand response, and the main power sources of the system are its own gas generation units, distributed generation and grid purchase. The electricity price is fixed, and users give priority to the distributed generation.
Case 2: Response scenario. In this scenario, demand response based on price mechanism is introduced, and the main power sources of the system are gas generation units, distributed generation and grid purchase. The electricity price is demand response time-of-use price (TOU), and the user gives priority to the distributed generation.
Case 3: Response scenario. In this scenario, demand response based on price mechanism is introduced, and the main power sources of the system are gas generation units, distributed generation and grid purchase. The electricity price is demand response real-time price (RTP), and the user gives priority to the distributed generation.
In our considered smart grid system, we set an optimization period as 1440 min and the length of each time interval T is 5 min. The population size NP = 500, and maximum variation generations G = 100. The minimum value of each population variation generation is recorded, and the fitness curve in different situation is generated iteratively, as shown in Figure 7.
We observe that, when the algorithm is run in scenario 1, the energy cost decreases until the algorithm converges after about 29 iterations, and the total running time of the program is about 15.60341 s within the interval T. Similar trends can be revealed in the other two scenarios.

5.3.1. Power Output

This section randomly selects a day’s load conditions, and the micro-grid system operates and optimizes under the above three conditions. The operation results are shown in Figure 8.
In the three cases, the difference of energy storage optimization results can be reflected most by the discharge depth of energy storage (Figure 8a). In Case 1, the discharge cost of the battery in the actual situation is very low, discharging to the SOC protection threshold when the load increases sharply, and then stabilizing there. In Case 2, the discharge costs increase, so slowly to the lowest point and no longer continue to discharge. In Case 3, the battery is close to the upper limit of the rated cycle times, so the discharge cost is very high, and the state after charging is basically kept unchanged during the day.
In three cases, the output optimization of each micro source and the contact power with the distribution network are mainly reflected in Figure 8b–d. Figure 8b is the original operating state of the system, in which the user does not participate in the demand response. Users give priority to the use of distributed generation and energy storage discharge, and the surplus electric energy is transported to the power grid. When the electricity power is insufficient, electric energy can be purchased from the grid. The electricity price is the regional fixed price.
Figure 8c shows the operation status of the TOU system. In this case, due to the distribution of electricity price, the daily electricity price is higher. To save the electricity purchase cost, the output of the gas turbine and the degree of the daily energy storage discharge are improved compared with Figure 8b. Figure 8d shows the RTP system. In this case, the output of each part of the system is more sensitive to the change of electricity price due to the higher electricity price and the rising state, and the change of the output of each micro source and the connect line power with the distribution network is more obvious than Figure 8b,c.
Through the above analysis, we can find that, after the demand response, the change of CCHP output, charge–discharge depth and current of energy storage is more obvious. For the energy storage system, the role of energy storage in the system is mainly to charge in the low power demand at night, and discharge in the high power price stage during the day to supply the micro-grid electricity. Before the demand response, the energy storage system is called in real time mainly according to the power demand and micro power output of the system. Its basic rule is charging at night and discharging during the day, but the electricity price has not been considered. After the demand response, on the premise of satisfying its own electricity demand, the system tries to sell more electricity to the grid considering the economy of operation. Meanwhile, the frequency of energy storage is increasing, and it leads to increasing the degree of fluctuation of energy storage current.
CCHP and photovoltaic, as important power supplies in the system, must meet the system’s own electricity demand and cold and hot demand. Then, the excess power is delivered to the grid to achieve economic benefits. Before the demand response, the main factor affecting the output of CCHP is the system electric thermal demand. Power is supplied to the micro-grid and excess electricity is sold to the grid on the premise of satisfying thermal load requirements. After the demand response, considering the economic operation of the system, CCHP increases output and increases the power supply to the grid, as shown in Figure 7. In addition, it should be noted that all PV power generation in the system is utilized, and the output of the PV is not optimized.

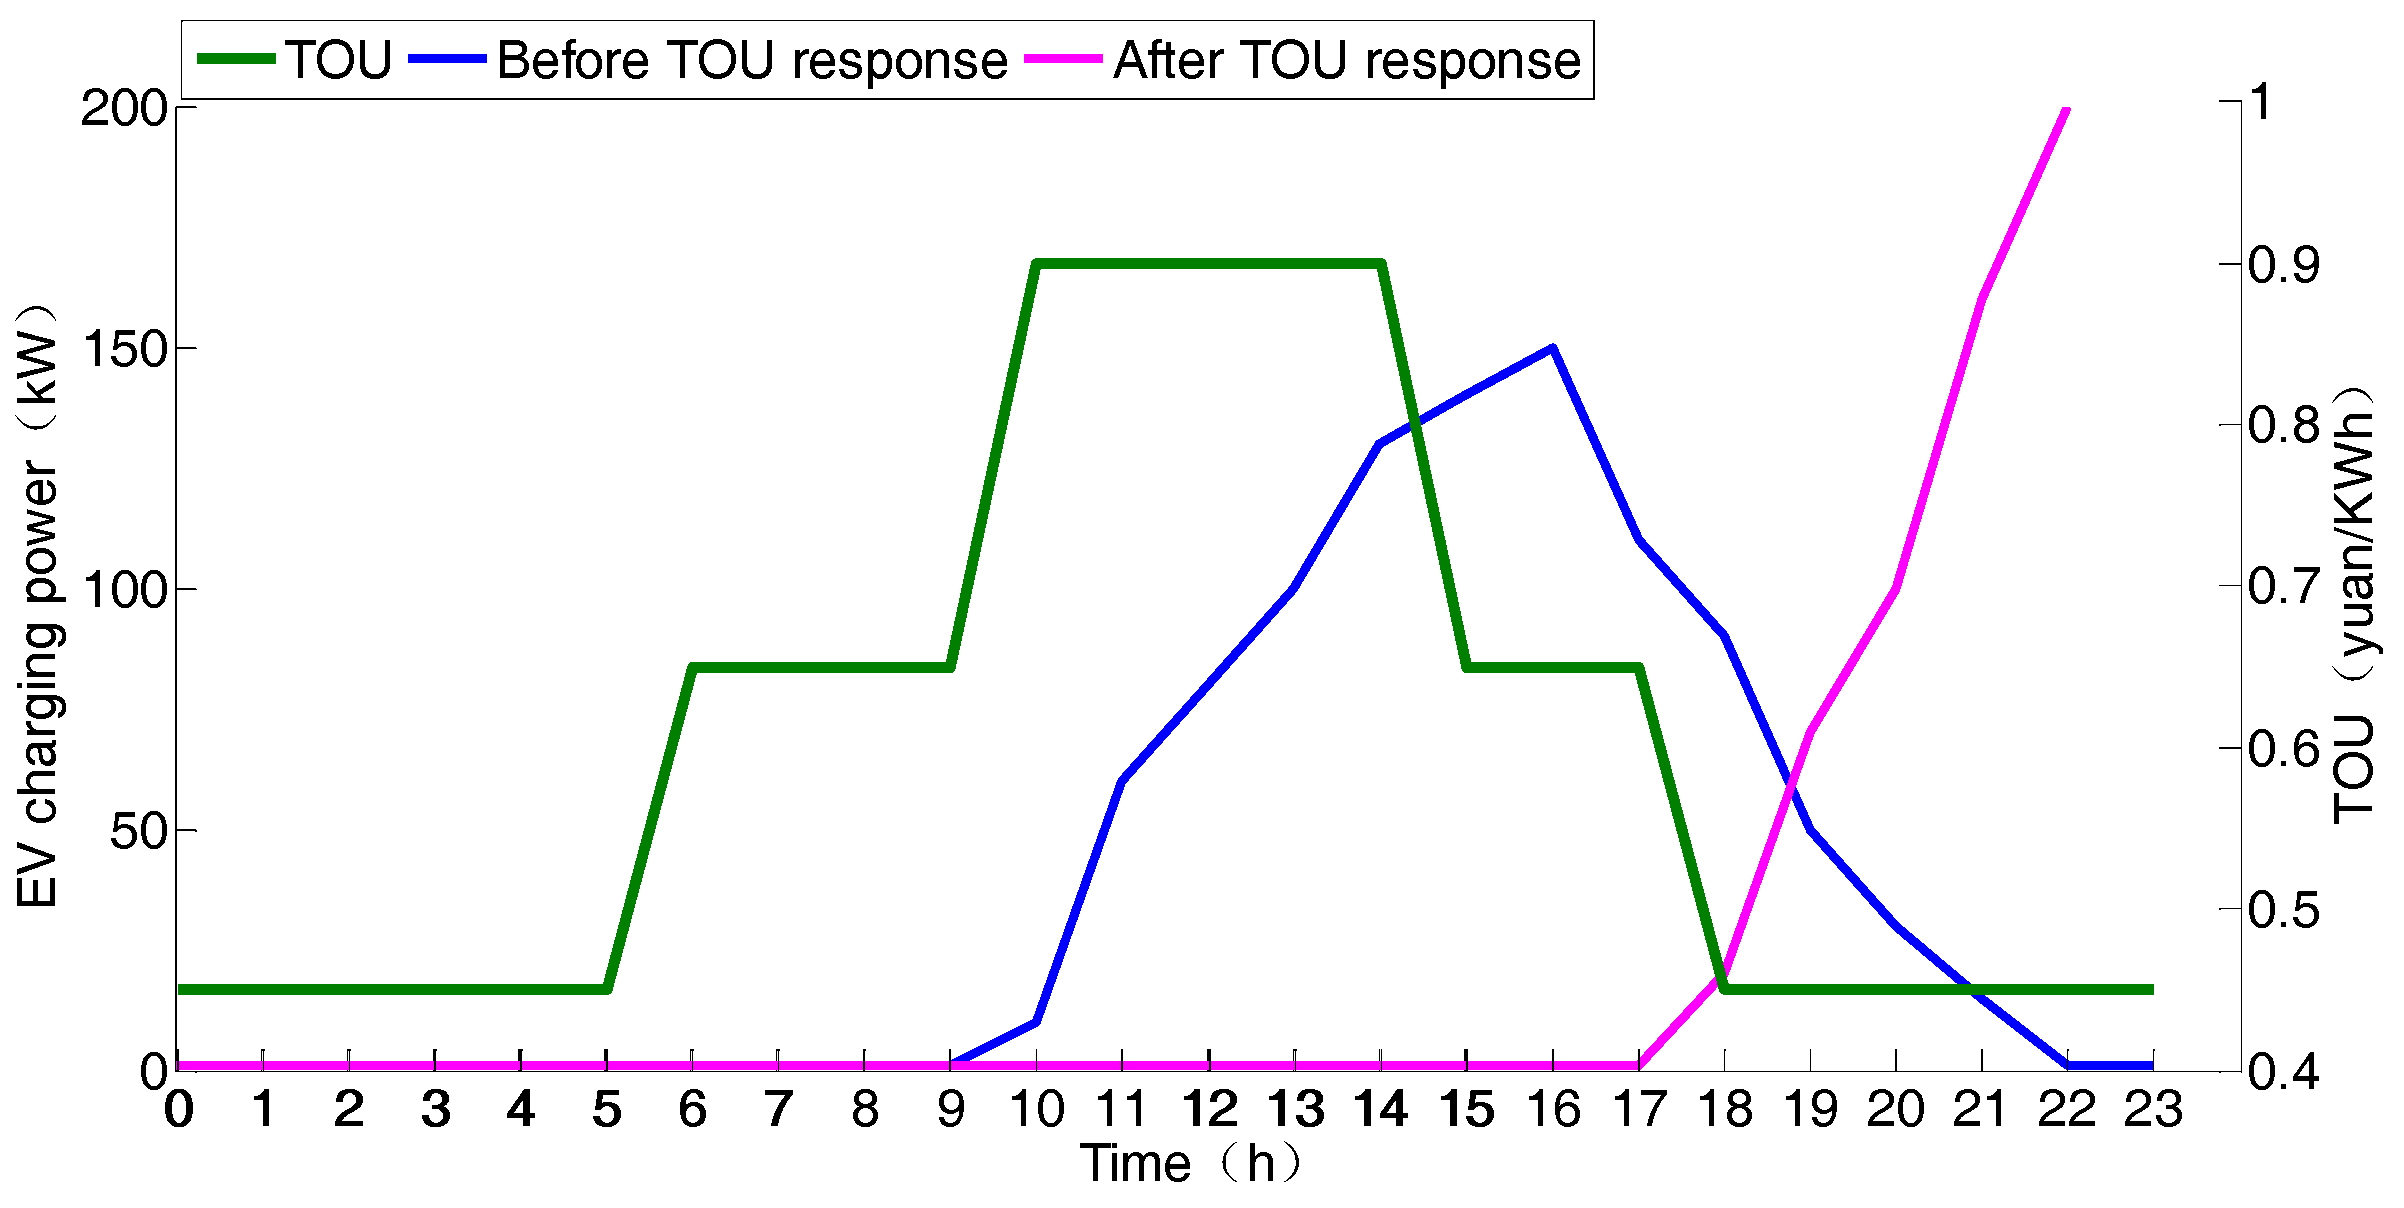
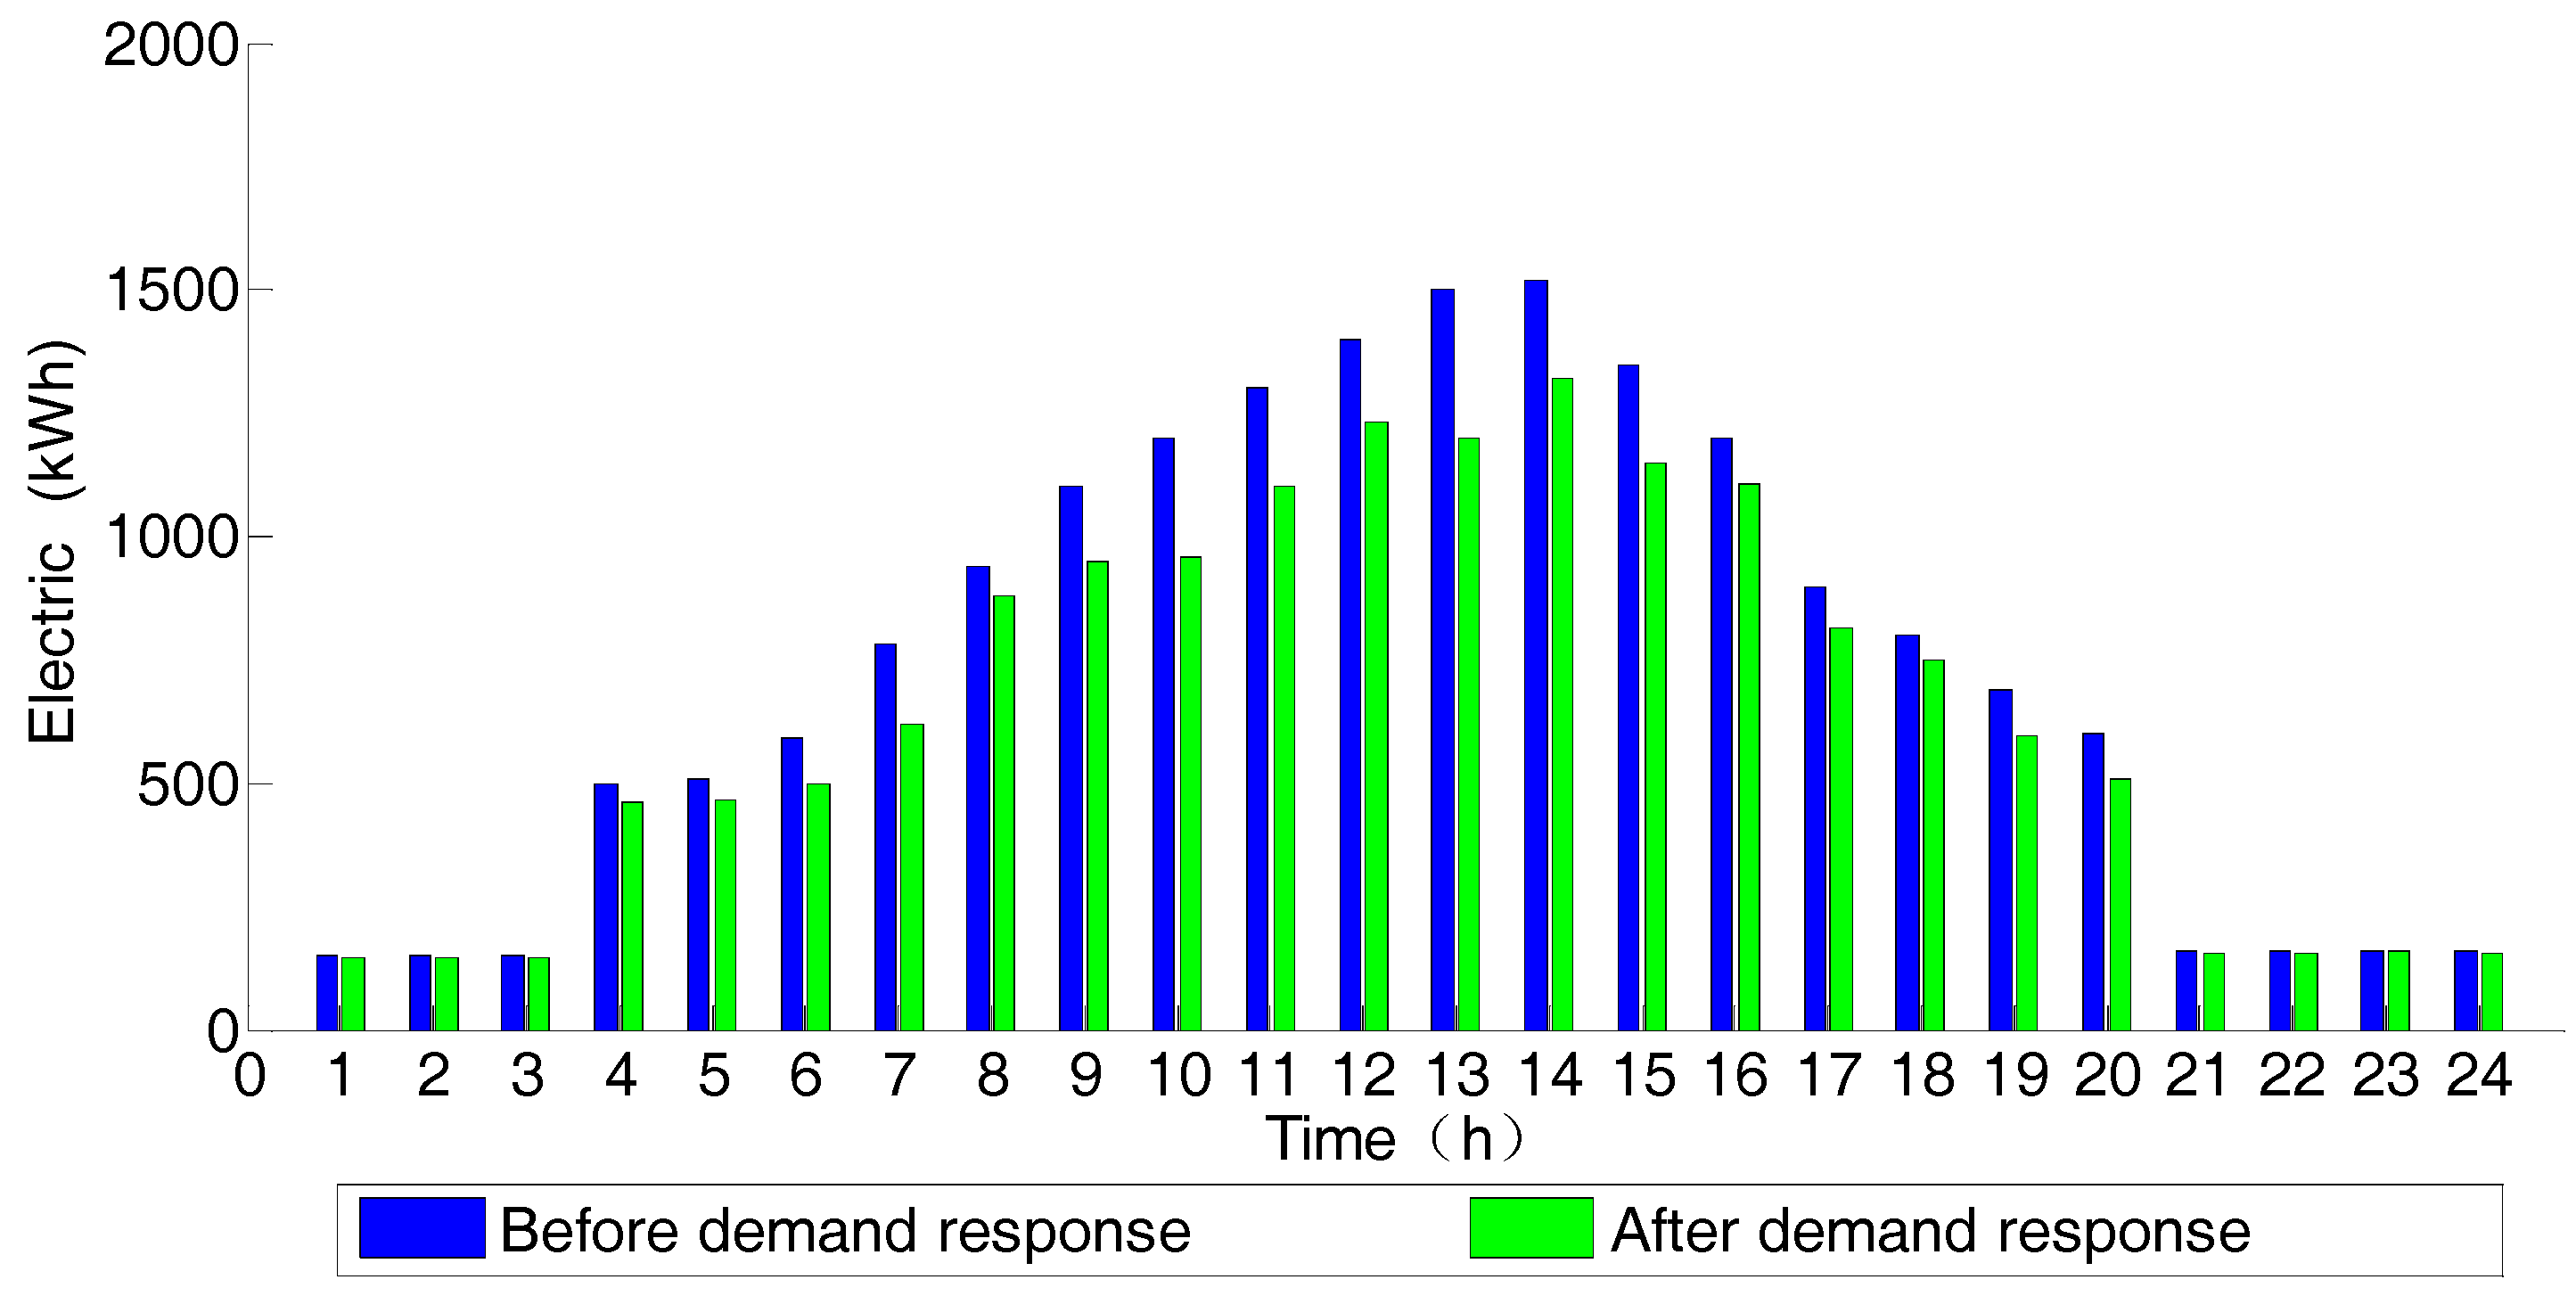
5.3.2. Load Response

Under the demand response mechanism, users can respond to the market electricity price according to their own electricity demand and electricity habits, and adjust the electricity consumption mode and load demand. In the study of load response, the time constraint of load transfer and the constraint of load reduction are considered. For the electric vehicle load, it can be adjusted according to Model (11), which meet the user’s comfort and ensure the lowest cost. For air conditioning load and lighting load, their response performance is mainly based on Model (10). Specifically, when the electricity price changes, users will adjust their electricity consumption according to the change of electricity price. According to the consumer behavior theory, the model of response behavior can be established under TOU price [37]:
E T O U = E 0 + [ E 0 , f 0 0 0 E 0 , p 0 0 0 E 0 , g ] × I × [ Δ k f / k 0 Δ k p / k 0 Δ k g / k 0 ]
where E 0 is the amount of pow before the demand response; E T O U is the amount of power after the demand response; k f , k p , k g , k 0 are peak section, flat section, valley section of the demand response price and fixed price respectively, E T O U = [ E f E p E g ] T and E 0 = [ E 0 , f E 0 , p E 0 , g ] T .
Figure 9 shows the response state of TOU price of the electric vehicle users under the constraints of the shiftable load operation time in Section 2.2.
According to the development of China’s electric vehicle market, electric vehicle charging time is about 5–8 h per cycle, and if the vehicle adopts rapid charging technology, it can be charged within 2 h, and the maximum mileage can reach 300 km [42]. As can be seen in Figure 8, the travel time of drivers is mainly during 6:00–10:00 and 18:00–20:00, and the charging time is mainly during 10:00–18:00 and 20:00–24:00.
In addition, before the demand response, the changing trend of TOU and the charging mode of electric vehicle to be analyzed, we can find that the charging period of users is just the period of high electricity price, so drivers pay more for electric cars. After the demand response, the users change the charging behavior to respond to the change of TOU. As can be seen in Figure 9, the users change the charging period of the vehicle, and the time window is mainly concentrated at night, 18:00–24:00, during which most users do not use electric cars, and the vehicles keep a static charging state. The charging period after the demand response is just the low electricity price period of TOU, so the user charging cost is lower. Through the above analysis, we can draw a conclusion that both the need of users and the minimum cost objectives are met after the implementation of the demand response.
For commercial buildings, the electricity consumption is mainly for lighting and air conditioning in the building. According to the characteristics of commercial activities of commercial buildings, building business hours are generally 6:00–21:00, and during this period buildings consume more electricity. In other words, it is clear that the load cannot be adjusted before 6:00 and after 21:00. Durinh 6:00–21:00, lighting load and air conditioning load can be adjusted according to RTP. Figure 10 and Figure 11 show the reduction of air-conditioning load and lighting load in response to RTP under the user comfort constraints.
In smart grid, since buildings contributed 40% of global power consumption, a growing number of intelligent buildings have been built to meet the increased energy requirements in an efficient way. Furthermore, as the major electricity load, air conditioning and lighting are more closely related to the stable operation of power grid and user comfort. Air conditioning load is an excellent demand response resource: reasonable regulation of air conditioning can alleviate the imbalance between supply and demand effectively, and improve the comprehensive operation efficiency of power system.
Comparing the operation status before and after the demand response, this study draws the conclusion that the power consumption of air conditioning system is reduced by about 16%. Compared with the case of not participating in the demand response, the peak load of air conditioning is reduced, the power consumption is relatively stable, and the fluctuation is weakened. During 10:00–16:00, lighting system load optimization reached more than 30% indoor illumination value fluctuations in a small range. Through the above analysis, we can draw the conclusion that, if temperature and lighting are satisfied, an appropriate demand response strategy for intelligent buildings can save the cost of building electricity and reduce the peak load level effectively.

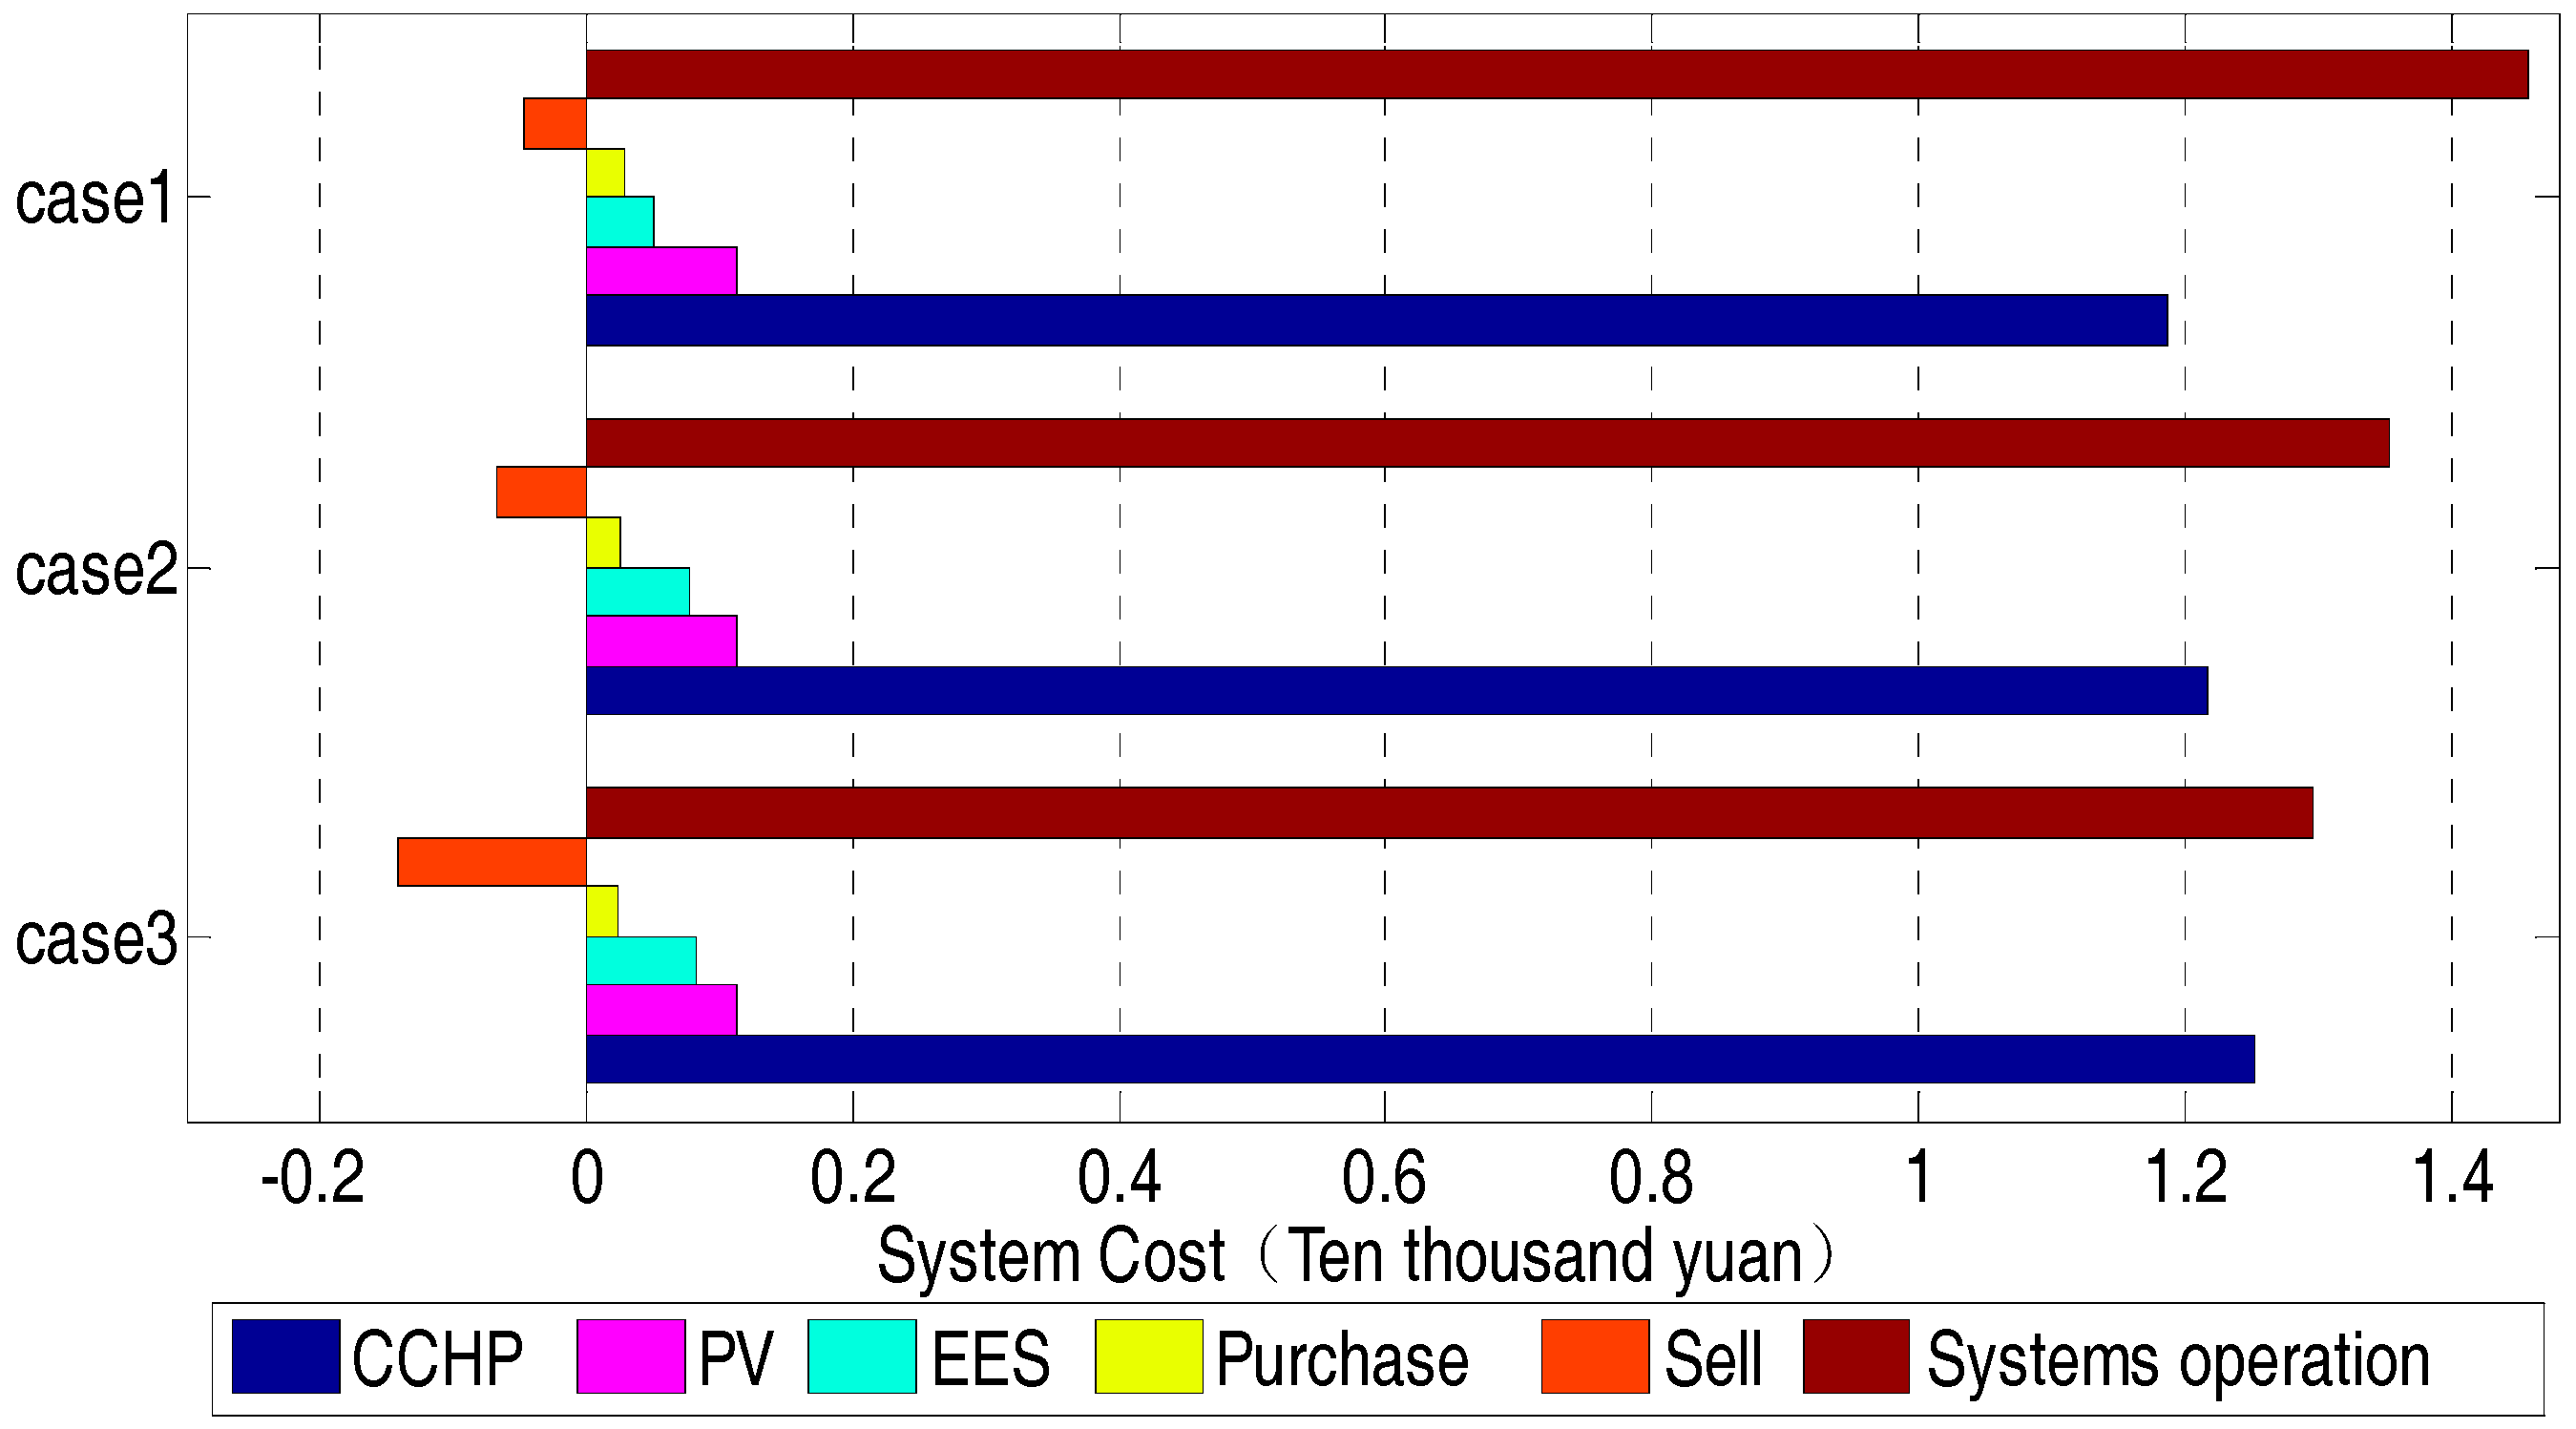
6. Result and Discussion

According to the three scenarios set in this study and the example analysis, this section mainly analyzes the system operation results and the realization of the objective function under different scenarios, including the operation cost of the key units of the system, the purchase and sale cost for electricity and the total operation cost of the system. Table 5 presents the system operation results statistics under different scenarios.
In Table 5, the interaction between the system and the power grid has changed greatly under different operating conditions. After the implementation of the demand response mechanism, the electricity power purchased by the system from the grid has not changed much and remains at a low level, while the electricity power transported from the system to the grid has increased more, especially in response to the price of electricity: the daily electricity interaction can reach 583.051–803.302 kWh. The electricity interaction is shown in Figure 12.
The effects of demand response are reflected in the situation when the price rises or the reliability of the system is threatened: power users change their inherent habits of power mode to respond to the signal from power supply company, which is one of the solutions to demand side management (DSM). In this study, the effects of demand response include not only the reduction in electricity purchase, but also the increase in electricity sales. Before the demand response, the consumer’s response to the electricity price is basically slow, and consumers buy and sell electricity according to their own electricity demand. However, after the demand response electricity price mechanism is introduced, in addition to the demand for electricity, the economy of electricity consume is also one of the important factors for consumers to consider. After the demand response, consumers can reduce the amount of electricity that they want to buy in the peak period of electricity price, give priority to the use of distributed generation, and sell excess power to the power grid to get economic benefits. Therefore, compared to the state before the demand response, the amount of electricity sold by the micro-grid to the grid is increased significantly after the demand response. As shown in Figure 11, before the demand response, the micro-grid sells 574.2 kWh electricity to the grid. However, after the demand response, the power supply to the grid is increased by 8.851 and 220.251 kwh, respectively, under TOU and RTP.
For micro-grid system, environmental benefit is also a problem that must be considered in operation optimization. In this study, the internal power generation of micro-grid is mainly CCHP and PV, among which PV is clean and renewable energy without environmental pollution. CCHP uses natural gas to generate electricity, which will produce SO2, CO2, NOx and other pollutants. The electricity purchased by micro-grid from power grid comes mainly from thermal power plant, which uses coal to generate electricity and produces a large amount of pollutants. Table 6 is the emission characteristics of electric generating technologies [34,35]. Table 7 is the penalty for pollutant emission in china [34].
It can be seen in Table 5, Table 6 and Table 7 that, after the demand response, the environmental cost of the CCHP system increases as the CCHP output increases. However, due to the small amount of electricity purchased from the grid, the environmental cost of purchasing electricity is reduced. Overall, in Case 3, CCHP power generation in the micro-grid increases due to RTP prices, in which the environmental cost is greater than in other cases.
The above analysis shows that the interaction between the system and the power grid shows an increasing trend and the system electricity sale profit is obvious after demand response. The specific daily cost–benefit is shown in Figure 13.
As shown in Figure 13, in Case 2 and Case 3, according to the daily output of each unit of the system in Figure 7, to match the price change, gas turbine power and energy storage charge/discharge degree increases. As a result, the cost of gas turbine power generation and energy storage charging/discharging increase. The increase of gas consumption of gas turbine increases the cost by 90 Yuan and 340 Yuan, respectively. The increase of storage increases charge/discharge frequency increases the cost by 170 Yuan and 220 Yuan, respectively. In addition, because the photovoltaic is always in a steady state, the cost of the photovoltaic system remains unchanged, and because the distributed generation of the system can basically meet the power demand, the power purchase cost changes little and remains at a low level. According to the optimization model function, the total operating costs of the three scenarios are 13,747.74 Yuan, 13,557.77 Yuan and 13,526.62 Yuan, respectively, which shows a decreasing trend. Therefore, it is estimated that the monthly system operating cost saving rate is between 1.38% and 1.61% after the implementation of the demand response.
In addition, according to the actual operation of micro-grid system and the statistical results of system operation cost in Table 5, the operation cost of CCHP accounts for over 90% of the total cost of the micro-grid, and the fuel price of CCHP system (NG) has great influence on the total cost of the system. As far as China’s actual situation is concerned, the instability and volatility of natural gas price is one of the most important factors that affect the economic operation of CCHP system. On the one hand, the ratio of natural gas to the standard coal is too high, which makes the proportion of coal energy supply increasing and the proportion of natural gas energy supply is always less [43,44,45], On the other hand, the classification of natural gas prices is not appropriate. In contrast, the price of electricity in the US and Germany is only 1/5–1/3 for civilian use, while Japan is 1/9. However, the price of natural gas generated by China is 1/2–2/3 for civilian use. Therefore, based on this price, the change trend of total system cost before and after demand response was studied under different gas price adjustment ratios through increasing the price by 5% or 10% and decreasing the price by 5% or 10%. The cost curve is shown in Figure 14.
According to Figure 14, when the natural gas price increases, the system cost increases greatly. When the natural gas price increases by 10% from 3.14 Yuan/m3 to 3.454 Yuan/m3, the total system cost increases by 9.02–9.20% before and after the demand response. In addition, according to the cost curve in the figure, when the natural gas prices continue to rise, the difference between the total cost of the system before and after the demand response gradually decreases. Therefore, it can be concluded that the effect of demand response is greatly affected by the change of natural gas price.
From the above study, we can see that, after the demand response, the total daily operating costs of the system are decreasing, which shows that the implementation of demand response can reduce the operating costs of micro-grid and improve the economic efficiency of system operation effectively. The total operating costs of micro-grid are composed of operating costs and electricity sales revenue. As can be seen in Table 5, the system operating costs are increased after the demand response, in which both the fuel costs of CCHP and the operating costs of the energy storage system are increasing. The reason for their increase is that the output of CCHP and the frequency of charge and discharge of energy storage batteries are both increased under the stimulus of demand response and electricity sales revenue. However, electricity sales revenue is also increasing, which is mainly due to the large increase in electricity sales to the grid in response to high electricity prices at peak segments. In addition, the increase in profits is much greater than the operating costs, which leads to a decrease in the total daily operating costs of the system ultimately.

7. Conclusions

Smart grid is a new form of intelligent power system for a variety of energy generation equipment and terminal user equipment. It includes information and communication technology, system control technology, power transformation technology, etc. Demand response technology can realize the optimization of power management and improvement of power system interaction in the new smart grid environment. The micro-grid with distributed generation can be connected with external power grid and also has the ability to operate in off-grid independently. With the development of smart grid technology, demand response technology is widely used in micro-grid, which can improve the utilization level of renewable energy, and it greatly helps perfect the operation state of the power, that is economy, stability and safety.
In this study, the energy system of building micro-grid is optimized, and the micro-grid system optimization model based on demand response is established according to the operation time and energy consumption characteristics of power electric load, and the feasibility of commercial building users participating in the demand response is demonstrated through an example analysis. On the one hand, this paper presents a DR scheduling model for smart residential community based on the demand response strategy and distributed generation. The objective of the model is to minimize the operation cost. It optimally schedules the entire micro-grid DR resources under different DR prices without having a negative impact on customers comfort, which reduces the user’s cost of electricity, and decreases the peak load and energy consumption simultaneously. On the other hand, this paper conducts a more reasonable adjustment to the operation plan of power system of building micro-grid, and optimizes the distribution of power equipment load. In addition, the study also analyzes the sensitivity of the larger factors that affect the optimization results. The results show that the fluctuation of natural gas price has a great influence on the demand response effect. The final optimization results can significantly reduce the power consumption of the micro-grid. Therefore, the model has certain practicability.

Acknowledgments

This paper is supported in part by the Fundamental Research Funds for National Natural Science Foundation Project “Research on the management theory of power line icing disaster forecast in regional power grid” (71471059).

Author Contributions

The paper was a collaborative effort among all authors. Yujing Huang performed the simulation, analyzed the data, and wrote the paper. Yongli Wang provided critical comments. Yudong Wang, Fang Li, Yuanyuan Zhang and Chunzheng Tian supervised the related research work.

Conflicts of Interest

The authors declare no conflict of interest.

Nomenclature

The description of the parameters used in all formulas.
P s t c the rated output of the solar panel, kW
I s t c intensity of solar radiation, W/m3
α T power temperature coefficient
η the rated thermoelectric ratio of CCHP system
Q h , Q e the heat and power production of gas turbine
Q C C H P ( t ) the exhaust residual heat of the gas turbine at time t, kW
P e ( t ) the output of the gas turbine at time t, kW
η e ( t ) the power generation efficiency of the gas turbine
η l the heat loss coefficient of the gas turbine
V M T the natural gas consumption per unit time, Nm3/h
L H V N G the low calorific value of natural gas, kWh/m3
E c the rated capacity of the battery, kWh
P c the charging power of the battery, kW
P d the discharging power of the battery, kW
S O C ( t ) the remainder of the battery after the T period
S O C ( t 1 ) the remaining amount of electricity of the battery after the T period
η c , η d the charge and discharge efficiency of the battery
δ the battery’s own discharge rate, percent per hour
Δ P t the difference between the micro-grid load and the micro-grid output
P max upper limit of the interactive power
P c h , m a x the current maximum allowed charging rates of the battery
P d i s , m a x the current maximum allowed discharging rates of the battery
W b t , m a x the maximum allowed electric energy of the battery
W b t , m i n the minimum allowed electric energy of the battery
Q the converted objective function
Q c p the total heat consumption
C E environmental costs
Q j the pollutant discharge level
P D G , m a x the sum of the current maximum output of each micro power
C o p the overall cost of building system
C i the operating costs, Yuan/kW
P f u e l gas price, Yuan/m3
P i the output of distributed generation during the response period, kw
C b a t , d e p the charge/discharge depreciation cost per unit time of energy storage, Yuan/kWh
C B g r i d the electricity cost of the micro-grid during the response period, Yuan/kWh
K b the purchase price, Yuan/kWh
K s the selling price, Yuan/kWh
P g r i d the tie-line switching power, kW
P P V ( t ) the actual photovoltaic output/kW
P I L ( t ) the actual power of the interruptible load/kW
P C U T m a x ( t ) the upper limits of the curtailable load reduction/kw
μ C U T ( t ) the state of the load at time
P C U T ( t ) the reduction of the curtailable load/kW
P i ( t ) the active power of the load/kW
P core the core load power/kW
P l o a d the controllable load power/kW
P l o s s the line loss during power transmission/kW
P s t o r a g e ( t ) the storage battery charging and discharging power/kW
S O C m a x the upper limits of the remaining capacity/kW
x i ( t ) the operational state of the transferable load
t o n ( X i ) the time the device starts running
Δ t ( X i ) the device scheduling period
H i the result of iteration i
q 1 the low calorific value of natural gas
δ E , j environmental value for the pollutant j
ζ j penalties for the punishment of pollutants

References

  1. Lasseter, R.; Akhil, A.; Marnay, C.; Stephens, J.; Dagle, J.; Guttromson, R.; Meliopoulous, A.S.; Yinger, R.; Eto, J. Integration of Distributed Energy Resources. The CERTS Micro-Grid Concept. 2002. Available online: https://cloudfront.escholarship.org/dist/prd/content/qt9w88z7z1/qt9w88z7z1.pdf (accessed on 20 December 2017).
  2. Zhu, W.; Xu, W.; Zhou, Z. Development status of micro-grid and its prospect in China. Electr. Age 2012, 10, 42–4346. [Google Scholar]
  3. Karthikeyan, R.; Parvathy, A.K. Peak Load reduction in micro Smart Grid using Non-Intrusive Load monitoring and Hierarchical Load scheduling. In Proceedings of the IEEE International Conference on Smart Sensors and Systems, Bangalore, India, 21–23 December 2015; pp. 1–6. [Google Scholar]
  4. Fabrizio, E.; Branciforti, V.; Costantino, A.; Filippi, M.; Barbero, S.; Tecco, G.; Mollo, P.; Molino, A. Monitoring and managing of a micro-smart grid for renewable sources exploitation in an agro-industrial site. Sustain. Cities Soc. 2017, 28, 88–100. [Google Scholar] [CrossRef]
  5. Nasraoui, K.; Lakhoua, N.; Amraoui, L.E. Study and analysis of micro smart grid using the modeling language SysML. In Proceedings of the IEEE International Conference on Green Energy Conversion Systems, Hammamet, Tunisia, 23–25 March 2017; pp. 1–8. [Google Scholar]
  6. Kumar, M.; Srivastava, S.C.; Singh, S.N. Control Strategies of a DC micro-grid for Grid Connected and Islanded Operations. IEEE Trans. Smart Grid 2017, 6, 1588–1601. [Google Scholar] [CrossRef]
  7. Guo, Y.; Xiong, J.; Xu, S.; Su, W. Two-Stage Economic Operation of micro-grid-Like Electric Vehicle Parking Deck. IEEE Trans. Smart Grid 2017, 7, 1703–1712. [Google Scholar] [CrossRef]
  8. Morozumi, S. Micro-grid Demonstration Projects in Japan. In Proceedings of the IEEE, Power Conversion Conference—Nagoya, Nagoya, Japan, 2–5 April 2007; pp. 635–642. [Google Scholar]
  9. Morozumi, S.; Kikuchi, S.; Chiba, Y.; Kishida, J.; Uesaka, S.; Arashiro, Y. Distribution technology development and demonstration projects in Japan. In Proceedings of the IEEE Power and Energy Society General Meeting-Conversion and Delivery of Electrical Energy in the 21st Century, Pittsburgh, PA, USA, 20–24 July 2008; pp. 1–7. [Google Scholar]
  10. Gao, Z.; Teng, X.; Zhang, X. Solution of active power dispatch and control scheme for inter-connected power grids with large-scale wind power integration. Autom. Electr. Power Syst. 2010, 34, 37–41. (In Chinese) [Google Scholar]
  11. Huang, Y.; Fang, B.; Sun, J. Simulation research on the micro-grid with flywheel energy storage system. Power Syst. Prot. Control 2011, 39, 83–87. (In Chinese) [Google Scholar]
  12. Li, O.; Ge, X. Intellgent Micro-Grid Technology for Island. Electr. Energy Manag. Technol. 2014, 10, 56–66. (In Chinese) [Google Scholar]
  13. Pei, W.; Du, Y.; Li, H.; Yang, Y.; Deng, W.; Qi, Z. Novel Solution and Key Technology of Interconnection and Interaction for Large Scale micro-grid Cluster Integration. High Volt. Eng. 2015, 41, 3193–3203. (In Chinese) [Google Scholar]
  14. Jimeno, J.; Anduaga, J.; Oyarzabal, J.; de Muro, A.G. Architecture of a micro-grid energy management system. Int. Trans. Electr. Energy Syst. 2011, 21, 1142–1158. [Google Scholar]
  15. Palma-Behnke, R.; Benavides, C.; Lanas, F.; Severino, B.; Reyes, L.; Llanos, J.; Sáez, D. A micro-grid Energy Management System Based on the Rolling Horizon Strategy. IEEE Trans. Smart Grid 2013, 4, 996–1006. [Google Scholar] [CrossRef]
  16. Kanchev, H.; Lu, D.; Colas, F.; Lazarov, V.; Francois, B. Energy Management and Operational Planning of a micro-grid With a PV-Based Active Generator for Smart Grid Applications. IEEE Trans. Ind. Electron. 2011, 58, 4583–4592. [Google Scholar] [CrossRef] [Green Version]
  17. Wu, X.; Wang, X.; Liu, S. Summary of research on micro-grid energy management system. Electr. Power Autom. Equip. 2014, 34, 7–14. (In Chinese) [Google Scholar]
  18. Chen, C.; Duan, S.; Cai, T.; Liu, B. Micro-grid energy management model based on improved genetic arithmetic. Trans. China Electrotech. Soc. 2013, 28, 196–201. (In Chinese) [Google Scholar]
  19. Wang, X.; Ai, Q.; Xu, W.; Peng, H. Multi-objective optimal energy management of micro-grid with distributed generation. Power Syst. Prot. Control 2009, 37, 79–83. (In Chinese) [Google Scholar]
  20. Niu, H.; Huang, X.; Yang, R.; Tang, Y.; Feng, X.; Yang, M. Research and design of functional architecture system in micro-grid energy management system. Renew. Energy Resour. 2013, 31, 47–51. (In Chinese) [Google Scholar]
  21. Fu, Y.; Jiang, Y.; Li, Z.; Wei, C. Optimal economic dispatch for micro-grid considering shiftable loads. Proc. CSEE 2014, 34, 2612–2620. (In Chinese) [Google Scholar]
  22. Chen, J.; Wang, C.; Zhao, B.; Zhang, X. Economic operation optimization of a stand-alone micro-grid system considering characteristics of energy storage system. Autom. Electr. Power Syst. 2012, 36, 25–31. (In Chinese) [Google Scholar]
  23. Wang, R.; Gu, W.; Wu, Z. Economic and optimal operation of a combined heat and power micro-grid with renewable energy resources. Autom. Electr. Power Syst. 2011, 35, 22–27. (In Chinese) [Google Scholar]
  24. Yang, P.; Ai, X.; Cui, M.; Lei, Z. Particle Swarm Optimization Based Economic Operation Analysis of micro-grid Containing Multi Energy Supply System. Power Syst. Technol. 2009, 20, 38–42. (In Chinese) [Google Scholar]
  25. Javaid, N.; Javaid, S.; Abdul, W.; Ahmed, I.; Almogren, A.; Alamri, A.; Niaz, I.A. A Hybrid Genetic Wind Driven Heuristic Optimization Algorithm for Demand Side Management in Smart Grid. Energies 2017, 10, 319. [Google Scholar] [CrossRef]
  26. Bharathi, C.; Rekha, D.; Vijayakumar, V. Genetic Algorithm Based Demand Side Management for Smart Grid. Wirel. Pers. Commun. 2017, 93, 481–502. [Google Scholar] [CrossRef]
  27. Gao, C.; Li, Q.; Li, H.; Zhai, H.; Zhang, L. Integration method and operation mechanism of demand response resources based on load aggregator business. Autom. Electr. Power Syst. 2013, 37, 78–86. [Google Scholar] [CrossRef]
  28. Lu, X.; Sun, K.; Huang, L.; Xiao, X. Improved droop control method in distributed energy storage systems for autonomous operation of AC micro-grid. Autom. Electr. Power Syst. 2013, 37, 180–185. (In Chinese) [Google Scholar]
  29. Elbaset, A.A.; Hassan, M.S.; Ali, H. Performance analysis of grid-connected PV system. In Proceedings of the IEEE, Power Systems Conference, Cairo, Egypt, 27–29 December 2016. [Google Scholar]
  30. Thirugnanam, K.; Kerk, S.K.; Yuen, C.; Liu, N.; Zhang, M. Energy Management for Renewable Micro-Grid in Reducing Diesel Generators Usage with Multiple Types of Battery. IEEE Trans. Ind. Electron. 2018. [Google Scholar] [CrossRef]
  31. Yousefi, H.; Ghodusinejad, M.H.; Kasaeian, A. Multi-objective Optimal Component Sizing of a Hybrid ICE+PV/T Driven CCHP micro-grid. Appl. Heat Eng. 2017, 122, 126–138. [Google Scholar] [CrossRef]
  32. Lee, S.J.; Kim, J.H.; Kim, C.H.; Kim, S.K.; Kim, E.S.; Kim, D.U.; Mehmood, K.K.; Khan, S.U. Coordinated Control Algorithm for Distributed Battery Energy Storage Systems for Mitigating Voltage and Frequency Deviations. IEEE Trans. Smart Grid 2017, 7, 1713–1722. [Google Scholar] [CrossRef]
  33. Mao, X.; Chen, S.; Wu, J. Optimal dispatch of implicit battery microgrid under tou price mechanism. Power Grid Technol. 2015, 39, 1192–1197. [Google Scholar]
  34. Qian, K.; Zhou, C.; Yuan, Y.; Shi, X.; Allan, M. Analysis of environmental benefits of distributed generation. J. Electr. Eng. China 2008, 28, 11–15. [Google Scholar]
  35. Wei, X.; Zhou, H. Assessment of environmental value standards for pollutant emission reduction in China’s thermal power generation industry. Environ. Sci. Res. 2003, 16, 53–56. [Google Scholar]
  36. Zhang, N.; Cai, R. SO2, NOx and CO2 exhaust fines should be of the order of magnitude. Chin. J. Electr. Eng. 1997, 4, 286–288. [Google Scholar]
  37. Liu, Y.; Yuen, C.; Huang, S.; Hassan, N.U.; Wang, X.; Xie, S. Peak-to-Average Ratio Constrained Demand-Side Management With Consumer’s Preference in Residential Smart Grid. IEEE J. Sel. Top. Signal Process. 2014, 8, 1084–1097. [Google Scholar] [CrossRef]
  38. Li, W.T.; Yuen, C.; Hassan, N.U.; Tushar, W.; Wen, C.K.; Wood, K.L.; Hu, K.; Liu, X. Demand Response Management for Residential Smart Grid: From Theory to Practice. IEEE Access 2015, 3, 2431–2440. [Google Scholar] [CrossRef]
  39. Madraswala, H.S.; Deshpande, A.S. Genetic algorithm solution to unit commitment problem. In Proceedings of the IEEE International Conference on Nascent Technologies in Engineering, Delhi, India, 4–6 July 2016; pp. 1–6. [Google Scholar]
  40. Jenkins, D.P.; Fletcher, J.; Kane, D. Lifetime prediction and sizing of lead-acid batteries for microgeneration storage applications. Renew. Power Gener. IET 2008, 2, 191–200. [Google Scholar] [CrossRef]
  41. He, B.; Yang, Y.; Duan, L. A study of the off-design performance of a micro gas turbine-based combined cooling, heating and power (CCHP) cogenration system. J. Eng. Heat Energy Power. 2008, 6, 615–619, 689–690. (In Chinese) [Google Scholar]
  42. Lopes, J.A.P.; Soares, F.J.; Almeida, P.M.R. Integration of Electric Vehicles in the Electric Power System. Proc. IEEE 2010, 99, 168–183. [Google Scholar] [CrossRef]
  43. Zeng, B. Forecasting the relation of supply and demand of natural gas in China during 2015-2020 using a novel grey model. J. Intell. Fuzzy Syst. 2017, 32, 141–155. [Google Scholar] [CrossRef]
  44. Liu, C.; Lin, B. Evaluating Design of Increasing Block Tariffs for Residential Natural Gas in China: A Case Study of Henan Province. Comput. Econom. 2017, 1, 1–17. [Google Scholar] [CrossRef]
  45. Li, R.; Li, P. Economical Optimal Operation of CCHP Micro-grid System Based on Improved Artificial Fish Swarm Algorithm. In Proceedings of the 2014 China Electrical Equipment Innovation and Development Forum, Beijing, China, 21 June 2014. [Google Scholar]
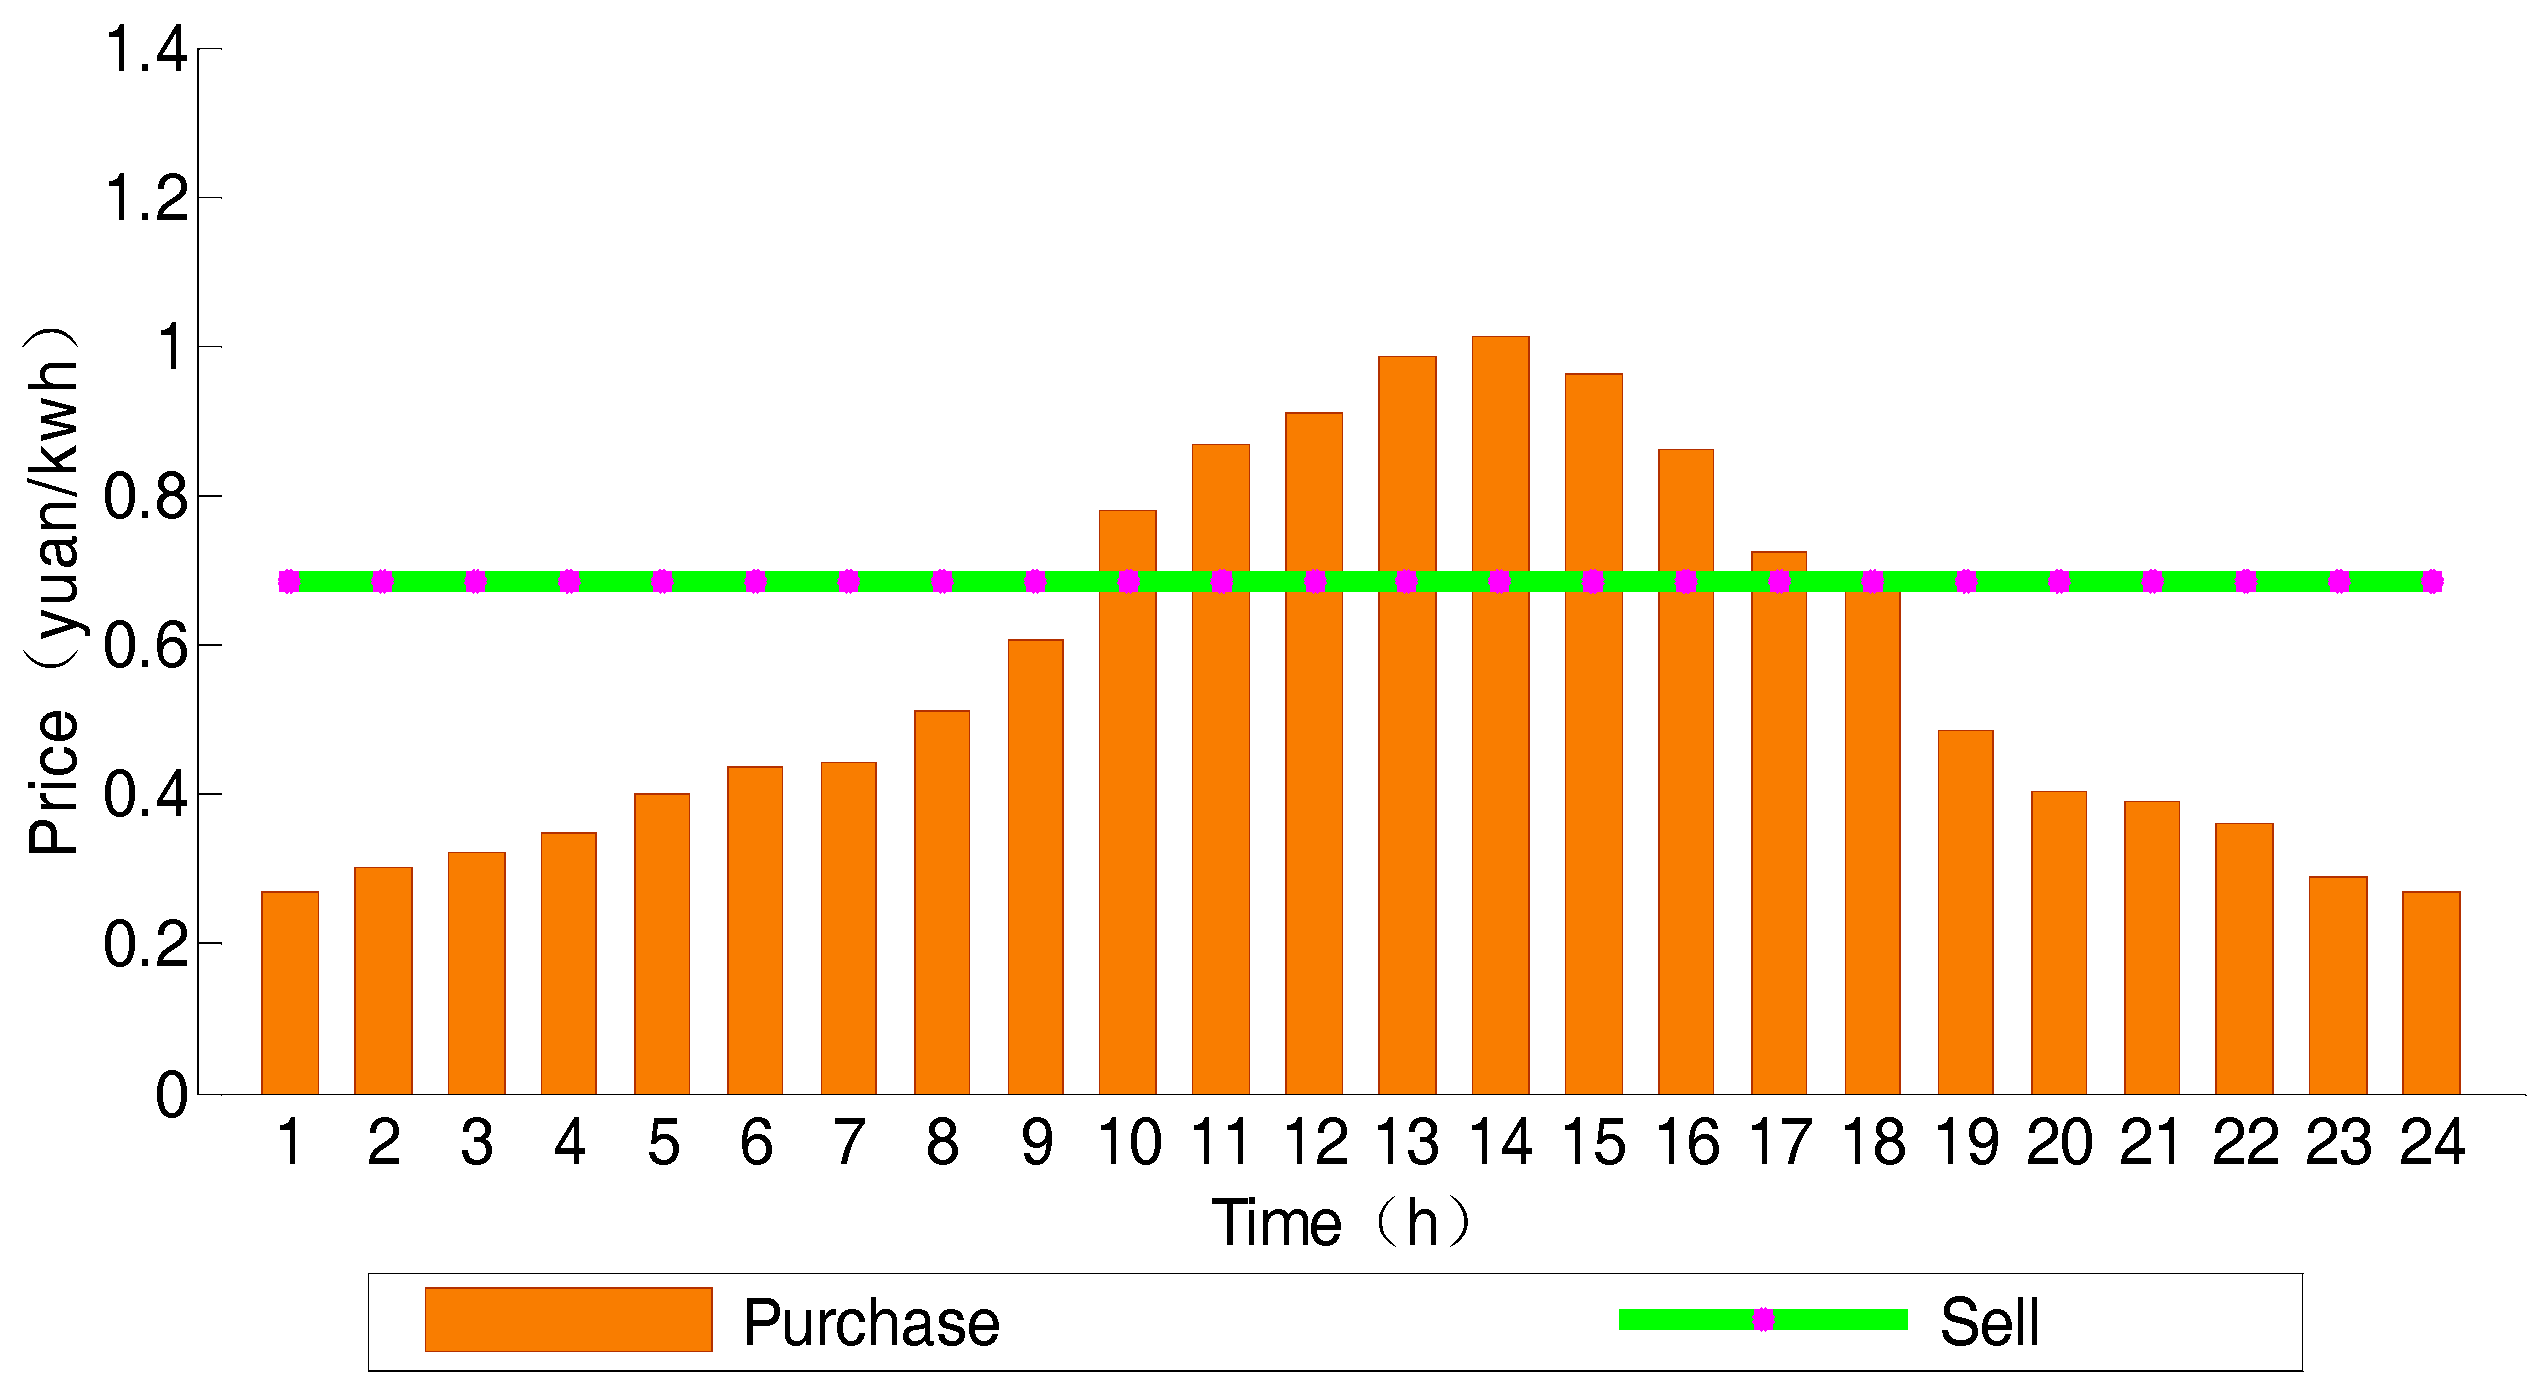
Figure 1. Structure diagram of intelligent micro-grid system.
Sustainability 10 00847 g001
Figure 2. Micro-grid demand response optimization system.
Sustainability 10 00847 g002
Figure 3. Implementation process of genetic algorithm based on demand response strategy.
Sustainability 10 00847 g003
Figure 4. Real Time Price.
Sustainability 10 00847 g004
Figure 5. Electric Load Curve.
Sustainability 10 00847 g005
Figure 6. Relation curve between generator power and absolute electric efficiency.
Sustainability 10 00847 g006
Figure 7. Adaptive curve of genetic algorithm in different situations.
Sustainability 10 00847 g007
Figure 8. Daily output diagram in three scenarios.
Sustainability 10 00847 g008
Figure 9. Electric Vehicles Load response with TOU.
Sustainability 10 00847 g009
Figure 10. Lighting Load response with RTP.
Sustainability 10 00847 g010
Figure 11. Load response of Air conditioner under RTP.
Sustainability 10 00847 g011
Figure 12. Electricity interaction between micro-grid and grid under the different situations.
Sustainability 10 00847 g012
Figure 13. Daily operation cost comparison under different scenarios.
Sustainability 10 00847 g013
Figure 14. System cost under different natural gas price change ratio.
Sustainability 10 00847 g014
Table 1. Time of use price (TOU).
Time(h)Electricity Price (Yuan/kWh)
0:00–6:000.45
6:00–10:000.65
10:00–15:000.90
15:00–18:000.65
18:00–24:000.45
Table 2. Operating parameters of shiftable load.
Transferable LoadRated Power (kW)Run Time (h)Time Window
Start Time (h)Stop Time (h)
Washing machine0.81917
Rice cooker1.521620
EV10051024
Table 3. Main parameter of lithium battery.
ParameterValue
Maximum charge and discharge power/kW65
Rated capacity/(kW·h)300
SOC operating range0.25–0.95
SOC overcharge protection threshold0.9
SOC overdischarge protection threshold0.3
Charge–discharge conversion efficiency/percent90%
Self-discharge rate/(%·s−1)0
longevity5–15
Cycle times2000 (90% DOD)
Table 4. Operating parameters of gas turbine in different operating conditions.
ParameterValue
Load rate (%)1007550
electric power (kW)14901118742
output power (kW)15281146765
power factor111
Voltage (V)400399403
Electric current (A)214616131064
Frequency (HZ)505050
Table 5. System operation results in different scenarios.
SceneCase 1Case 2Case 3
CCHPDaily gas consumption/m33645.8123773.1543849.980
Daily operation cost/Yuan12,17012,26012,510
PVDaily operation cost/Yuan112011201120
EESDaily operation cost/Yuan600770820
Grid interactionPurchaseDaily Electricity/kWh78.62775.34474.179
Daily operation cost/Yuan290250240
SellDaily Electricity/kWh574.20583.051803.302
Daily profit/Yuan4608711200
Economics operationoperation cost/Yuan13,72013,53013,490
Environmentalenvironmental cost/Yuan27.7427.7736.62
FDaily cost/Yuan13,747.7413,557.7713,526.62
Table 6. The emission characteristics of electric generating technologies (g/kWh).
NOXCO2SO2
CCHP4.7954170.16070.0232
Thermal power plant0.1547–3.093886.47250.1083–3.9446
Table 7. The penalty for pollutant emission in china.
NOXCO2SO2
Price (Yuan/kg)210.01
Calculation results/YuanCase 14.96902.7959103731.7823951220.390732044
Case 24.97412.7987999821.784237250.391135871
Case 36.55763.6897834442.3522399270.515651947

