1. Introduction
Since adopting reform and opening up in 1978, China’s urban areas have rapidly developed, which play an important role in promoting economic growth, adjusting the industrial structure and stabilizing the employment level [
1]. Much non-urban land has been converted into urban land as the regional economy and society have developed [
2,
3,
4], and this trend has continued nationwide throughout China. However, high-speed urban development is basically an extension of external expansion, which leads to a series of problems including threatened food and ecological security (such as farmland erosion and forest degradation), reclamation of river land, and low efficiency of land use and urban sprawl [
5,
6,
7]. In this case, we have to change the pattern of urban development, control the urban scale and then guide rational urban development, because curbing excess urban sprawl and working toward sustainable planning strategies are urgent needs [
8,
9,
10].
Urban growth boundary was first proposed in the United States and has been widely used there as an urban planning tool as a kind of technical measure and space-management policy to solve the problem of extensive urban expansion [
11,
12,
13]. In addition, urban growth boundary has been regarded as a regulatory measure for directing smart urban development [
14]. In China, under the background of the new normal, more attention has been paid to a concept similar to urban growth boundary. Based on foreign urban growth boundary, urban development boundary has been defined as a new spatial policy to restrict disorderly Chinese urban development [
15,
16], but it is not entirely the same as urban growth boundary. In recent years, delimiting urban development boundary has inspired great attention from government and researchers, which also has a strong urgency.
As an effective tool of space-management policy, urban growth boundary has been used for more than thirty years in foreign countries. The method of urban growth boundary can be either qualitative or quantitative, the latter of which is relatively mature. However, the study of urban development boundary in China has come later, and its normative analysis has rarely been seen in the related literature [
17]. At present, two main methods exist for delineating urban development boundaries in China. One is “positive” thinking (scale forecast, set index, spatial layout, delimit boundary), and the model and method used in studies are cellular automata (CA) or its improved model [
18,
19,
20]. The second is “reverse” thinking (subtract basic farmland, ecological security land, ..., delimit boundary), and the models and methods used in studies include Green Infrastructure Assessment, the urban ecological corridor, ecological sensitivity evaluation and pattern analysis of landscape ecological security [
21,
22,
23]. Because urban development has repeatedly broken through the construction land boundary, the first method has been powerless [
24,
25]. Moreover, because its main consideration is construction land expansion, the first method easily results in the occupation of basic farmland and ecological security land as part of the urban development process [
22]. At the same time, the urban development boundary determined by the second method is the ultimate space, which is too big to limit urban sprawl [
26]. So a single boundary might not have practical guiding significance. As mentioned above, existing urban development boundaries rarely meet the practical needs of urban space management. In other words, they are unable to provide scientific decision-making and support for urban development.
China is the most populous country in the word. In recent years, as the economy and society have continued to develop, problems of food security and ecological environment pollution are becoming increasingly serious [
15]. Under the new requirements of ecological civilization construction in China, protection of basic farmland and rivers is very important for regional development in accordance with the actual situation of the study area. In addition, scientific guidance in urban development is critical for an urban are to be developed sustainably. Urban development boundary is a type of spatial management policy; it is also an effective measure for realizing these objectives. In this paper, the urban development boundary is neither an independent nor a single boundary; instead, it contains both a rigid and an elastic urban development boundary and is an organic combination of different functional boundaries. The urban development rigid boundary is the foundation for the whole urban development boundary, which is both a macroscopic control and a microscopic restriction on the urban development elastic boundary. In addition, the urban development rigid and elastic boundaries do not exist in isolation but are interlinked with and influence each other.
Therefore, this study primarily focuses on the concept of delineation and on the integrated application of technical methods, and urban development boundary has been delineated rationally. Broadly, using a multifactor comprehensive evaluation model, we delineated the urban development rigid boundary. On this basis, we subsequently delineated the urban development elastic boundary using the logistic-CA model. Then, we discuss the compactness of the urban development elastic boundary. A south coastal area of Central Urban Area of Doumen in Zhuhai has been selected as the case study area for delineating the urban development boundary.
The structure of this paper is organized as follows. The first part (this section) is an introduction that presents the relevant research on urban development boundary and elaborates on the significance of this study. The second part introduces the data and methods in detail, which is one of the key parts of this paper. As the core part of this paper, the third part is the results and analysis in which we delineate the urban development boundary and discuss the compactness of the elastic boundary. The fourth part is a discussion comprised of the theoretical rationality, the practical application, and the shortages and prospects, which are also the focus of this paper. The last part (the fifth part) is the conclusion, and it summarizes the statements and analysis of the full text.
2. Data and Methods
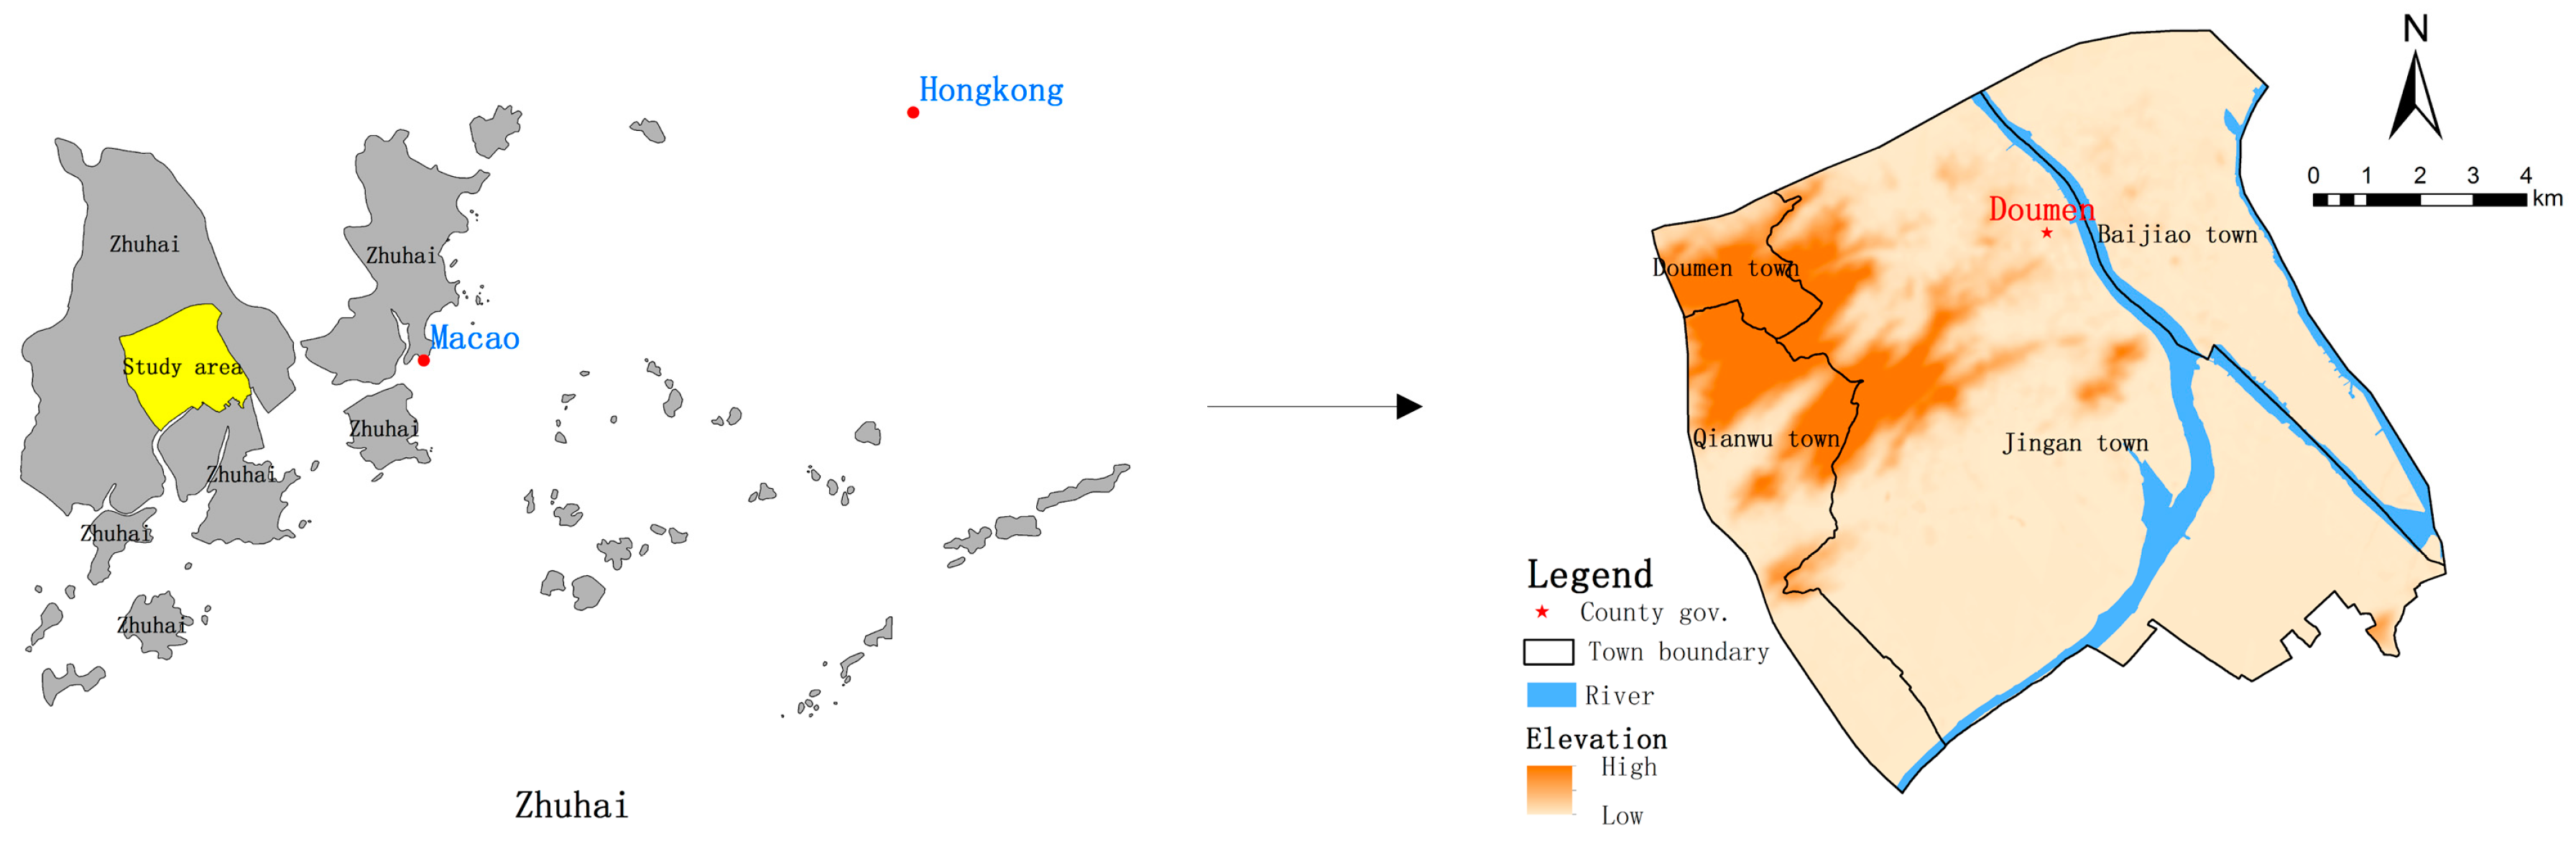
The Central Urban Area of Doumen in Zhuhai is one of China’s special economic zones implementing the first open-door policy. Regarded as a riverside city, it is in the west of Zhuhai (
Figure 1). This region is another economic growth pole in Zhuhai with a total area of 130.03 km², a total population of approximately 270,000, and a total Gross Industrial Output Value (GIOV) of over 57 billion Yuan RMB in 2015(due to lack of access to the accurate GDP data). As an advanced economic region, it has undergone rapid urbanization since 1978. As of 2015, the urbanization rate exceeded 54%. Urban sprawl, farmland occupation and eco-environmental deterioration have occurred in this area. In current urban planning for the area, the government is implementing an important strategy for building up a new ecological city. To achieve that strategy, the urban development boundary must be delineated to balance urban development and environmental protection. So the region is selected as our study area and is both typical and representative. In this study, the software programs used for data processing are ArcGIS10.0, Environment for Visualizing Images (ENVI) 5.1 and Geographic Simulation & Optimization System (GeoSOS) 1.2.1, the map projection is the UTM_Zone_49N projection coordinate system, and the resolution of all data (cell size) is 30 (m) × 30 (m).
2.1. Delineating Factors
2.1.1. Topographic Factors
Topographic factors, including mainly the Digital Elevation Model (DEM) and slope, are the most basic elements influencing an urban development boundary. When the DEM is higher, the chance of urban development and construction is lower and vice versa. Slope has the same effect as DEM. In other words, high values of DEM and slope inhibit urban development (in the role of restraint); whereas low values of DEM and slope are beneficial for urban development (in the role of driving force). Therefore, DEM and slope are considered when delineating urban development boundaries.
2.1.2. Restraining Factors
When delimiting an urban development boundary, a researcher must consider that not all land resources are suitable for urban land and that some land resources cannot be developed because of physical attributes and ecological conservation. To realize sustainable development of a regional economy and society smoothly, restraining factors should be considered carefully. From the perspective of urban space ecological security, we consider the negative influence of restraining factors from two aspects: severe and general restricted variables. Therefore, two severe restricted variables and five general restricted variables were selected in this study. In term of severe restricted variables, basic farmland conservation area is a special protection area whose goal is to strictly protect basic farmland against being occupied, one of most significant basic national policies in China. Basic farmland plays an important role in food security, and has a great role in maintaining ecological security in an urban space. The study area has many rivers. Therefore, the river is a typical feature. Not only is the river an important limiting factor for urban development, but it is also an important element in maintaining ecological security in the urban space.
2.1.3. Driving Factors
To a certain extent, driving factors can promote urban development and construction. Regions closer to driving factors have a greater chance of being developed, and these regions contribute to urban land. According to research data and the region’s actual situation, we consider positive influence of driving factors from three aspects: distance from location center, distance from highway traffic and distance from urban road. Specifically, indicators of driving factors include distances from District/county administrative center, town administrative center, expressway, first-grade highway, secondary roads, third-grade highway, urban arterial road and urban secondary road. These indicators are widely used in related studies of urban development.
2.1.4. Auxiliary Factors
In recent years, remote sensing (RS) has been widely applied in various fields around the world. Spatial distribution characteristics of urban boundaries and their development trends can be found by applying RS. Urban boundaries have been successfully extracted using Landsat images (Hu et al., 2015). In our study, Landsat images (122–45) collected in 2008 Thematic Mapper(TM) and 2014 Operational Land Imager (OLI) are used to extract urban lands whose boundaries are called urban development boundaries [
27,
28].
Other auxiliary data are also indispensable to ensure the reasonableness of delineated boundaries. These data mainly include high spatial—resolution images, central urban—administrative boundaries, central urban—planning areas and statistics of the Zhuhai built-up area, all of which are used to assist in delineating urban development boundaries.
2.2. Data Preparation and Processing
2.2.1. Topographic Data
DEM data are from the Geospatial Data Cloud (GDC) (
http://www.gscloud.cn/), which effectively reflects altitude conditions at a spatial resolution of 30 m. In general, the DEM in the Central Urban Area of Doumen is high in the northwest and low elsewhere. The highest and lowest values are 431 m and −2 m, respectively. The slope is extracted from the DEM, which directly reflects the terrain condition of the geographical unit in area. Similar to the DEM, the slope value is high in the northwest (as steep terrain) and low elsewhere (as flat terrain). The relative difference between maximum and minimum slope values reaches 40.15 degrees.
For delineating the urban development rigid boundary (regulatory boundary), DEM spatial data were reclassified into four different appropriate scores, and the slope spatial data were the same as the DEM. When delineating the urban development elastic boundary (guiding boundary), the DEM and slope spatial data were normalized, generating normalized spatial data whose grid values range from 0 to 1. Then, we used a conversion tool to shape the ASCLL format file (Txt) of the normalized data.
2.2.2. Restricting Development Data
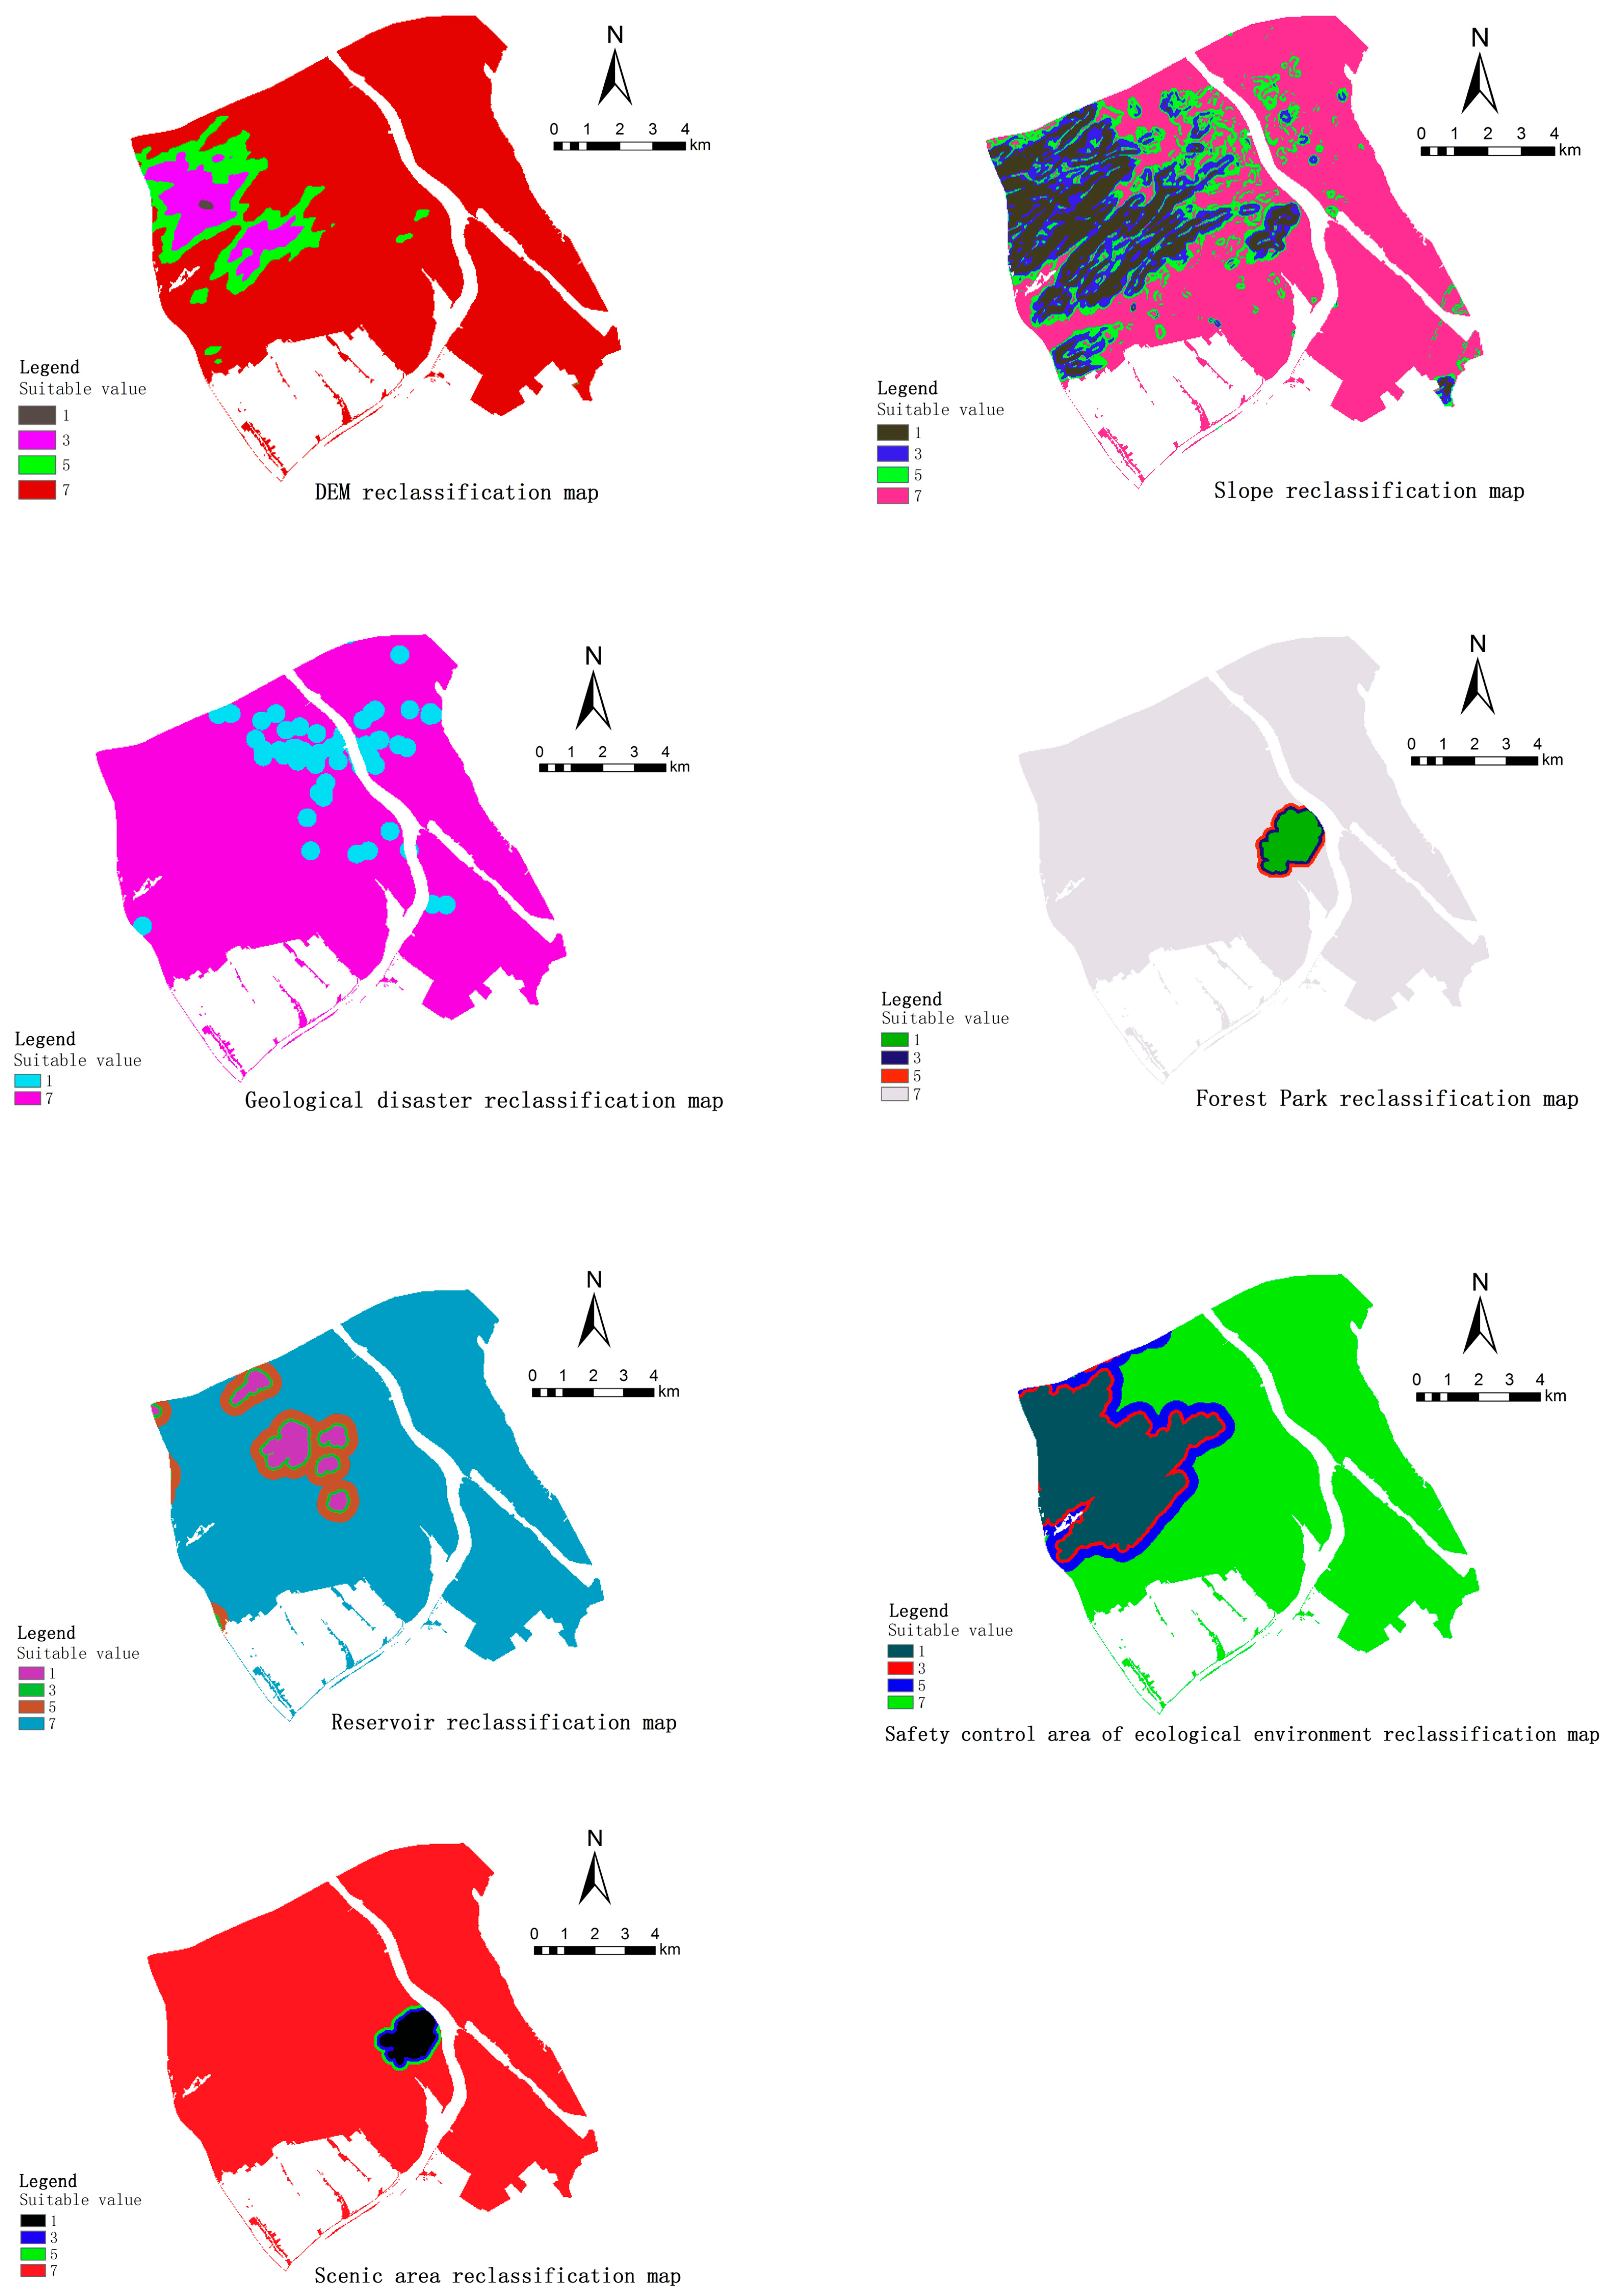
With respect to the severe restricted variables, the basic farmland conservation area spatial data came from Doumen’s land-planning database and were extracted from the land-use partition layer. Owing to the land-use policies of basic farmland conservation in China, the basic farmland conservation area must be used as a constrained boundary through GIS spatial analysis, serving as the basis for the urban development rigid boundary. The river spatial data are from Doumen’s national geographic survey database and were extracted from the water layer. Because the river itself is neither suitable for urban land nor able to be developed, the river is also directly considered as a constrained boundary. The role of the river’s constrained boundary is analogous to that of the basic farmland conservation area. On the basis of extracting and determining these constrained boundaries, a suitable evaluation base layer can be acquired, which is subsequently applied in the multifactor comprehensive evaluation model.
With respect to the general restricted variables, geological disaster area spatial data are from Doumen’s national geographic survey database, and the geological disaster data types consist of landslides, land subsidence, unstable slope, rock fall and hidden trouble areas. The forest park spatial data are from Doumen’s national geographic survey database, which contains a provincial forest park in Guangdong. The reservoir spatial data are also from Doumen’s national geographic survey database and are extracted from the land coverage area layer. The safety control area of ecological environment spatial data are from Doumen’s land-planning database and are drawn from the land-use partition layer. The proportion of the safety control area in the ecological environment is larger and is located in the northwest. The scenic area spatial data also come from Doumen’s land-planning database and are located in Jianfengshan village.
The five general restricted variables were used for buffer analysis. The geological disaster prone area usually occurs in the area that at a certain distance from a range of the geological disaster points, and other areas are less affected by geological disasters. At the same time, we also refer to other related literature and monographs concerning this subject. In the multifactor comprehensive evaluation model, when the appropriate score is higher, the land resource is more suitable for development.
2.2.3. Driving Development Data
Regarding location center, spatial data exist for both the county administrative center and the town administrative center. The county administrative center spatial data is from vectorization, including the administrative center of the Central Urban Area of Doumen (the administrative center of Doumen District). Also from vectorization are the town administrative center spatial data, consisting of the location of the Jingan Town people’s government, the location of the Baiteng Subdistrict office and the location of the Doumen District bus passenger terminal representing the Baijiao town center.
Regarding highway traffic, the corresponding spatial data come from Doumen’s national geographic survey database. The highway is divided into six grades: concrete expressway, first-grade highway, secondary roads, third-grade highway, fourth-grade highway and off-grade highway. The expressway, first-grade highway, secondary roads and third-grade highway were selected by considering the influencing degree of different highway grades on urban development. Because these four grades of highways have a significant impact on urban development, other grade roads of the fourth-grade highway and the off-grade highway have little influence on urban development.
Regarding urban roads, the urban road spatial data are from Doumen’s national geographic survey database. Urban roads include six types: urban expressway, urban arterial road, urban secondary road, city branch, metro and ground orbit. Based on the different degrees of relativity between urban roads and urban development as well as the actual situation of the study area, urban arterial and urban secondary roads were initially selected. In other words, urban arterial and urban secondary roads have a greater impact on urban development.
All driving spatial data were done using european distance analysis. Then, distance layer data can be obtained. To eliminate the dimensional effect of various spatial data, distance layers have been normalized to make the grid value of the raster data between 0 and 1 [
29].
2.2.4. Auxiliary Data
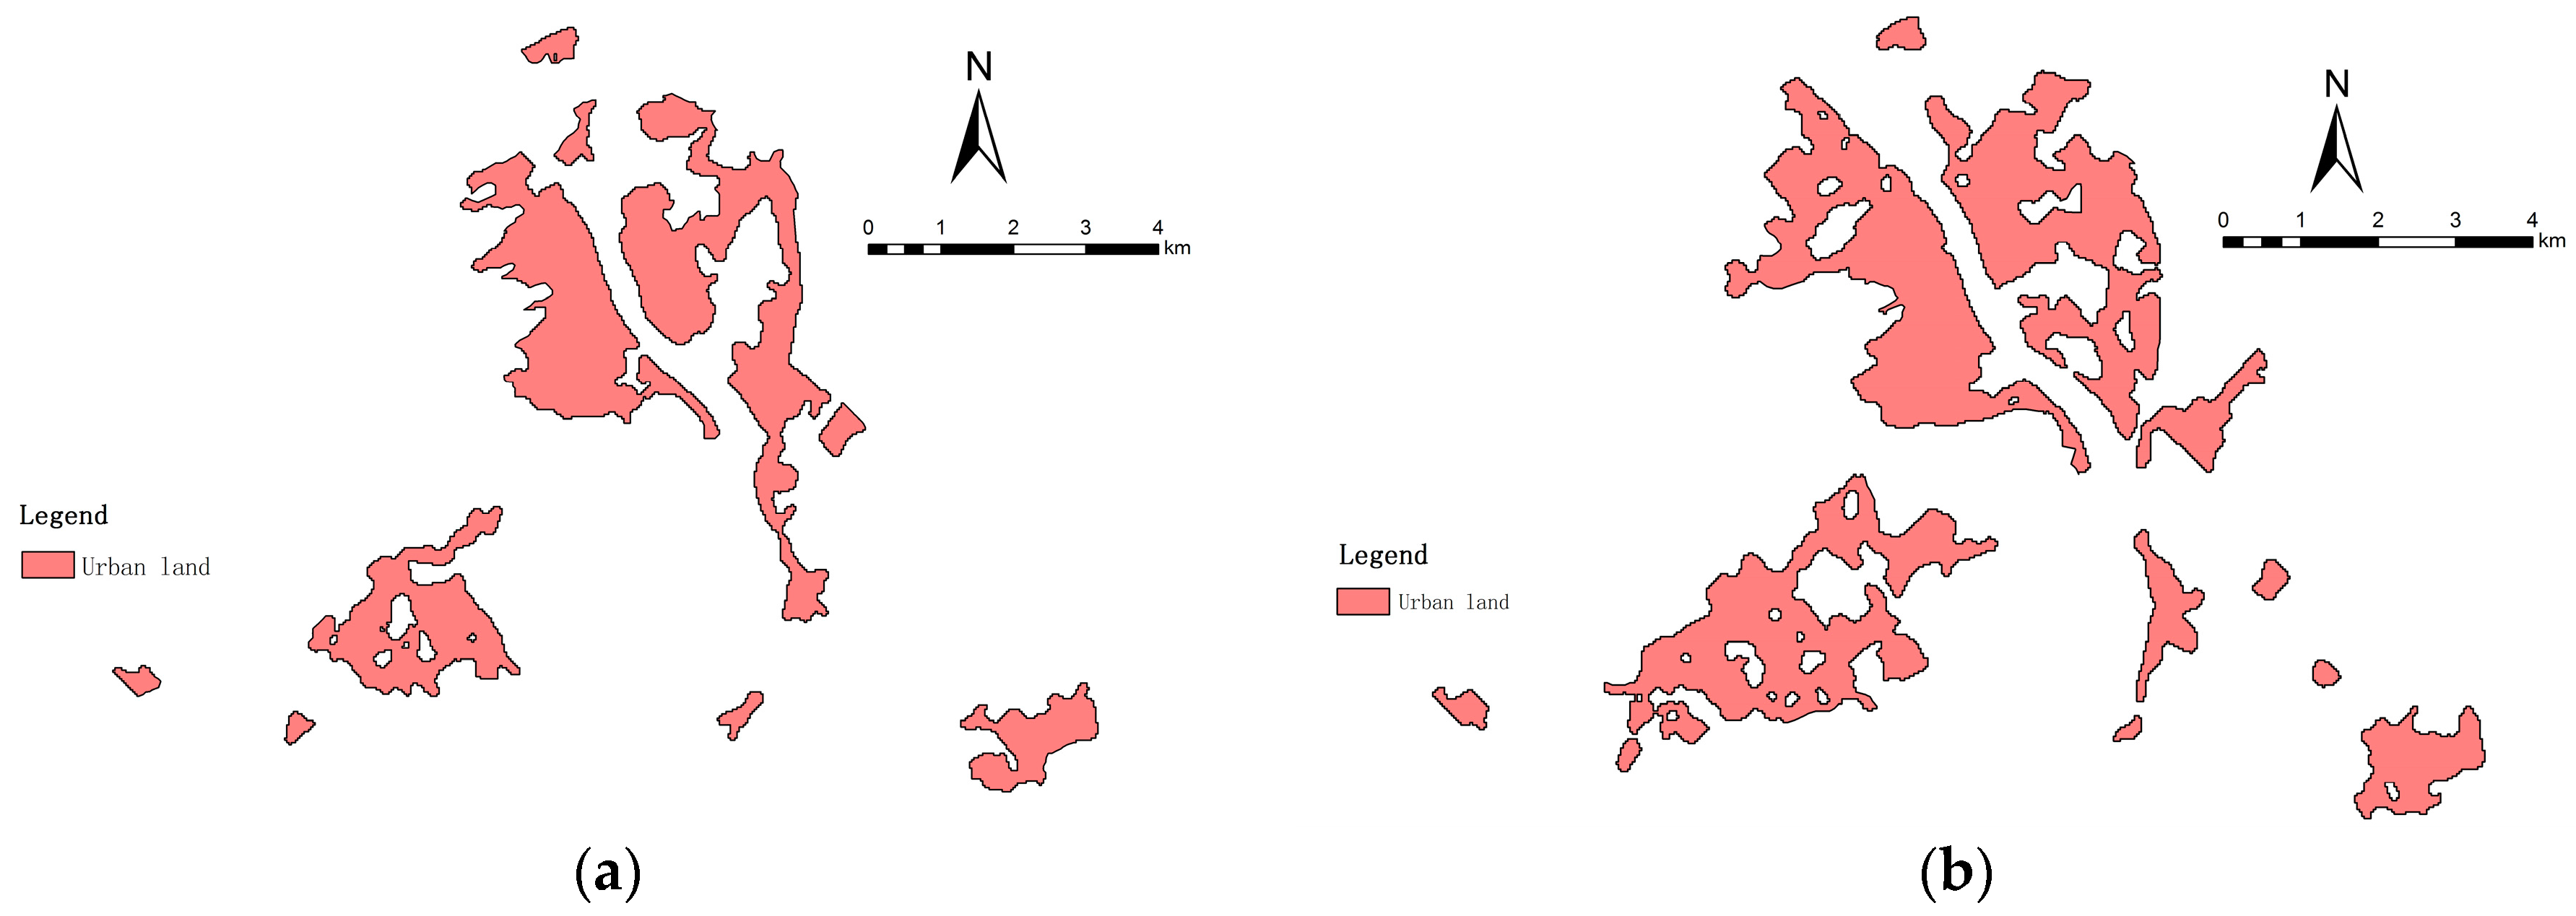
Two Landsat satellite images were used to determine urban development boundaries (extent of urban land) in 2008 and 2014 and were downloaded from the Geospatial Data Cloud (GDC) (
http://www.gscloud.cn/). Image data pretreatment included multi-band layer stacking, selecting the best band combination, cutting out, image enhancement, etc. using the image processing software ENVI5.1 [
30]. Then, according to the remote-sensing image feature of urban land, we used the example-based feature extraction workflow tool, which is an object-oriented information extraction method. Moreover, the extraction results were corrected by visual interpretation, and finally urban land was completely extracted. According to the accuracy assessment, urban land extraction accuracy is approximately 89.1% with validation from high spatial resolution images. Finally, the urban development boundary in 2008 and 2014 can be acquired (
Figure 2).
High spatial-resolution images come from Doumen’s national geographic survey database and are used to verify the accuracy of urban land extraction. The central urban administrative boundary is from Doumen’s land-planning database, which can clip Landsat satellite images in pretreatment. Central urban planning area spatial data come from Doumen’s land-planning database, adjusting suitability evaluation results when delineating urban development rigid boundary. The statistics of Zhuhai built-up area are from the statistical yearbook of China urban construction and are used to predict the urban scale of the urban development elastic boundary.
2.3. Delineating Urban Development Boundary
The state of urban development results from the interaction between social factor, economic factor and natural environment, to which urban development boundary is closely related. The role of urban development boundary in China is not only to curb spread of urban sprawl (urban development rigid boundary) but also to guide development of urban space to the appropriate region (urban development elastic boundary) [
15]. Urban development boundary cannot only comprise a continuous closed curve but can also consist of multiple continuous closed curves. In this paper, the detailed procedures for delineating an urban development boundary are as follows:
The first step is to delineate the urban development rigid boundary. Based on the perspective of ecological security, we adopt anti-planning theory and bottom-line thinking. The two factors nature and ecology were selected and using the multifactor comprehensive evaluation model, the urban development rigid boundary was delineated as associated with the central urban planning area to adjust the evaluation results suitably. In general, urban development rigid boundary is an inviolable bulwark of a region’s urban development and the ecological bottom line for urban development [
28].
The second and final step is to delineate the urban development elastic boundary. First, urban land in 2008 and 2014 was extracted from two Landsat satellite images. Second, to obtain land-type data from Doumen’s central urban area in 2008 and 2014, or the logistic-CA model base layer, we analyzed the GIS spatial overlay of the urban development rigid boundary layer and the urban land layer. Moreover, using statistical data from the Zhuhai built-up area, we predicted the approximate size of the urban development elastic boundary in 2020 and 2026. Finally, taking both the six selected spatial variables as the input spatial parameters for the simulation model and the land-type data of Doumen’s central urban area in 2014 as the model’s starting layer, the urban development elastic boundary was delineated. Therefore, the urban development elastic boundary is the growth space for urban development in the future according to social development situations, and it is a scene boundary to guide rational growth for the regional urban space for some time.
2.4. Multifactor Comprehensive Evaluation Model
We can calculate the suitability of construction land through the multifactor comprehensive evaluation model. The model can also be used to evaluate the suitability of construction land space on the basis of ecological security. The equation for calculating the appropriate value of construction land space is as follows [
31]:
In Formula (1), S is the comprehensive appropriate value of the evaluation unit, Bi is the appropriate score of i evaluation index, Wi is the relative weight of i evaluation factor, and n is the number of evaluation indices. According to the comprehensive appropriate value, when S is higher, the land resource is more suitable for urban development.
Specifically, the constrained boundaries of the basic farmland conservation and the river are first determined and removed, after which the evaluation base layer can be acquired as the evaluation unit of the multifactor comprehensive evaluation model. We have selected seven evaluation indices: DEM, slope, geological disaster area, forest park, the reservoir, the safety control area of the ecological environment, and the scenic area (
Figure 3). Moreover, different evaluation indices have been divided into different appropriate value grades. Here, we use Analytic Hierarchy Process(AHP) to determine the weight of all evaluation indices; the AHP method is more objective and easier to operate than the general expert scoring method [
25]. Finally, evaluation indices and corresponding weights are shown in
Table 1.
2.5. Logistic-CA Model
We used the logistic-CA model in GeoSOS1.2.1. The model has been widely used in different research fields, and the simulated result agrees well with the actual result [
32,
33]. The logistic-CA model consists of four parts: global probability (
Plogistic), neighborhood function (
), random item (
R) and constraint condition (
Pcontrol). Among them, the constraint condition refers to the restricted development attributes of some land units. In other words, some land-use types have a higher probability of theoretically being converted to urban land, in reality, they cannot; these land-use types include rivers, mountains and prohibited development zones in main functional areas (e.g., Jianfengshan forest park of national level). In our study, land-use data types comprised urban land, park and green space, forbidden development zone and development zone, whose corresponding constraints are established in
Table 2.
In the model, the transition function of the state change of central cell at
t + 1 moment is as follows:
where
is the probability that the central cell can be transformed into urban land at
t + 1 moment [
33].
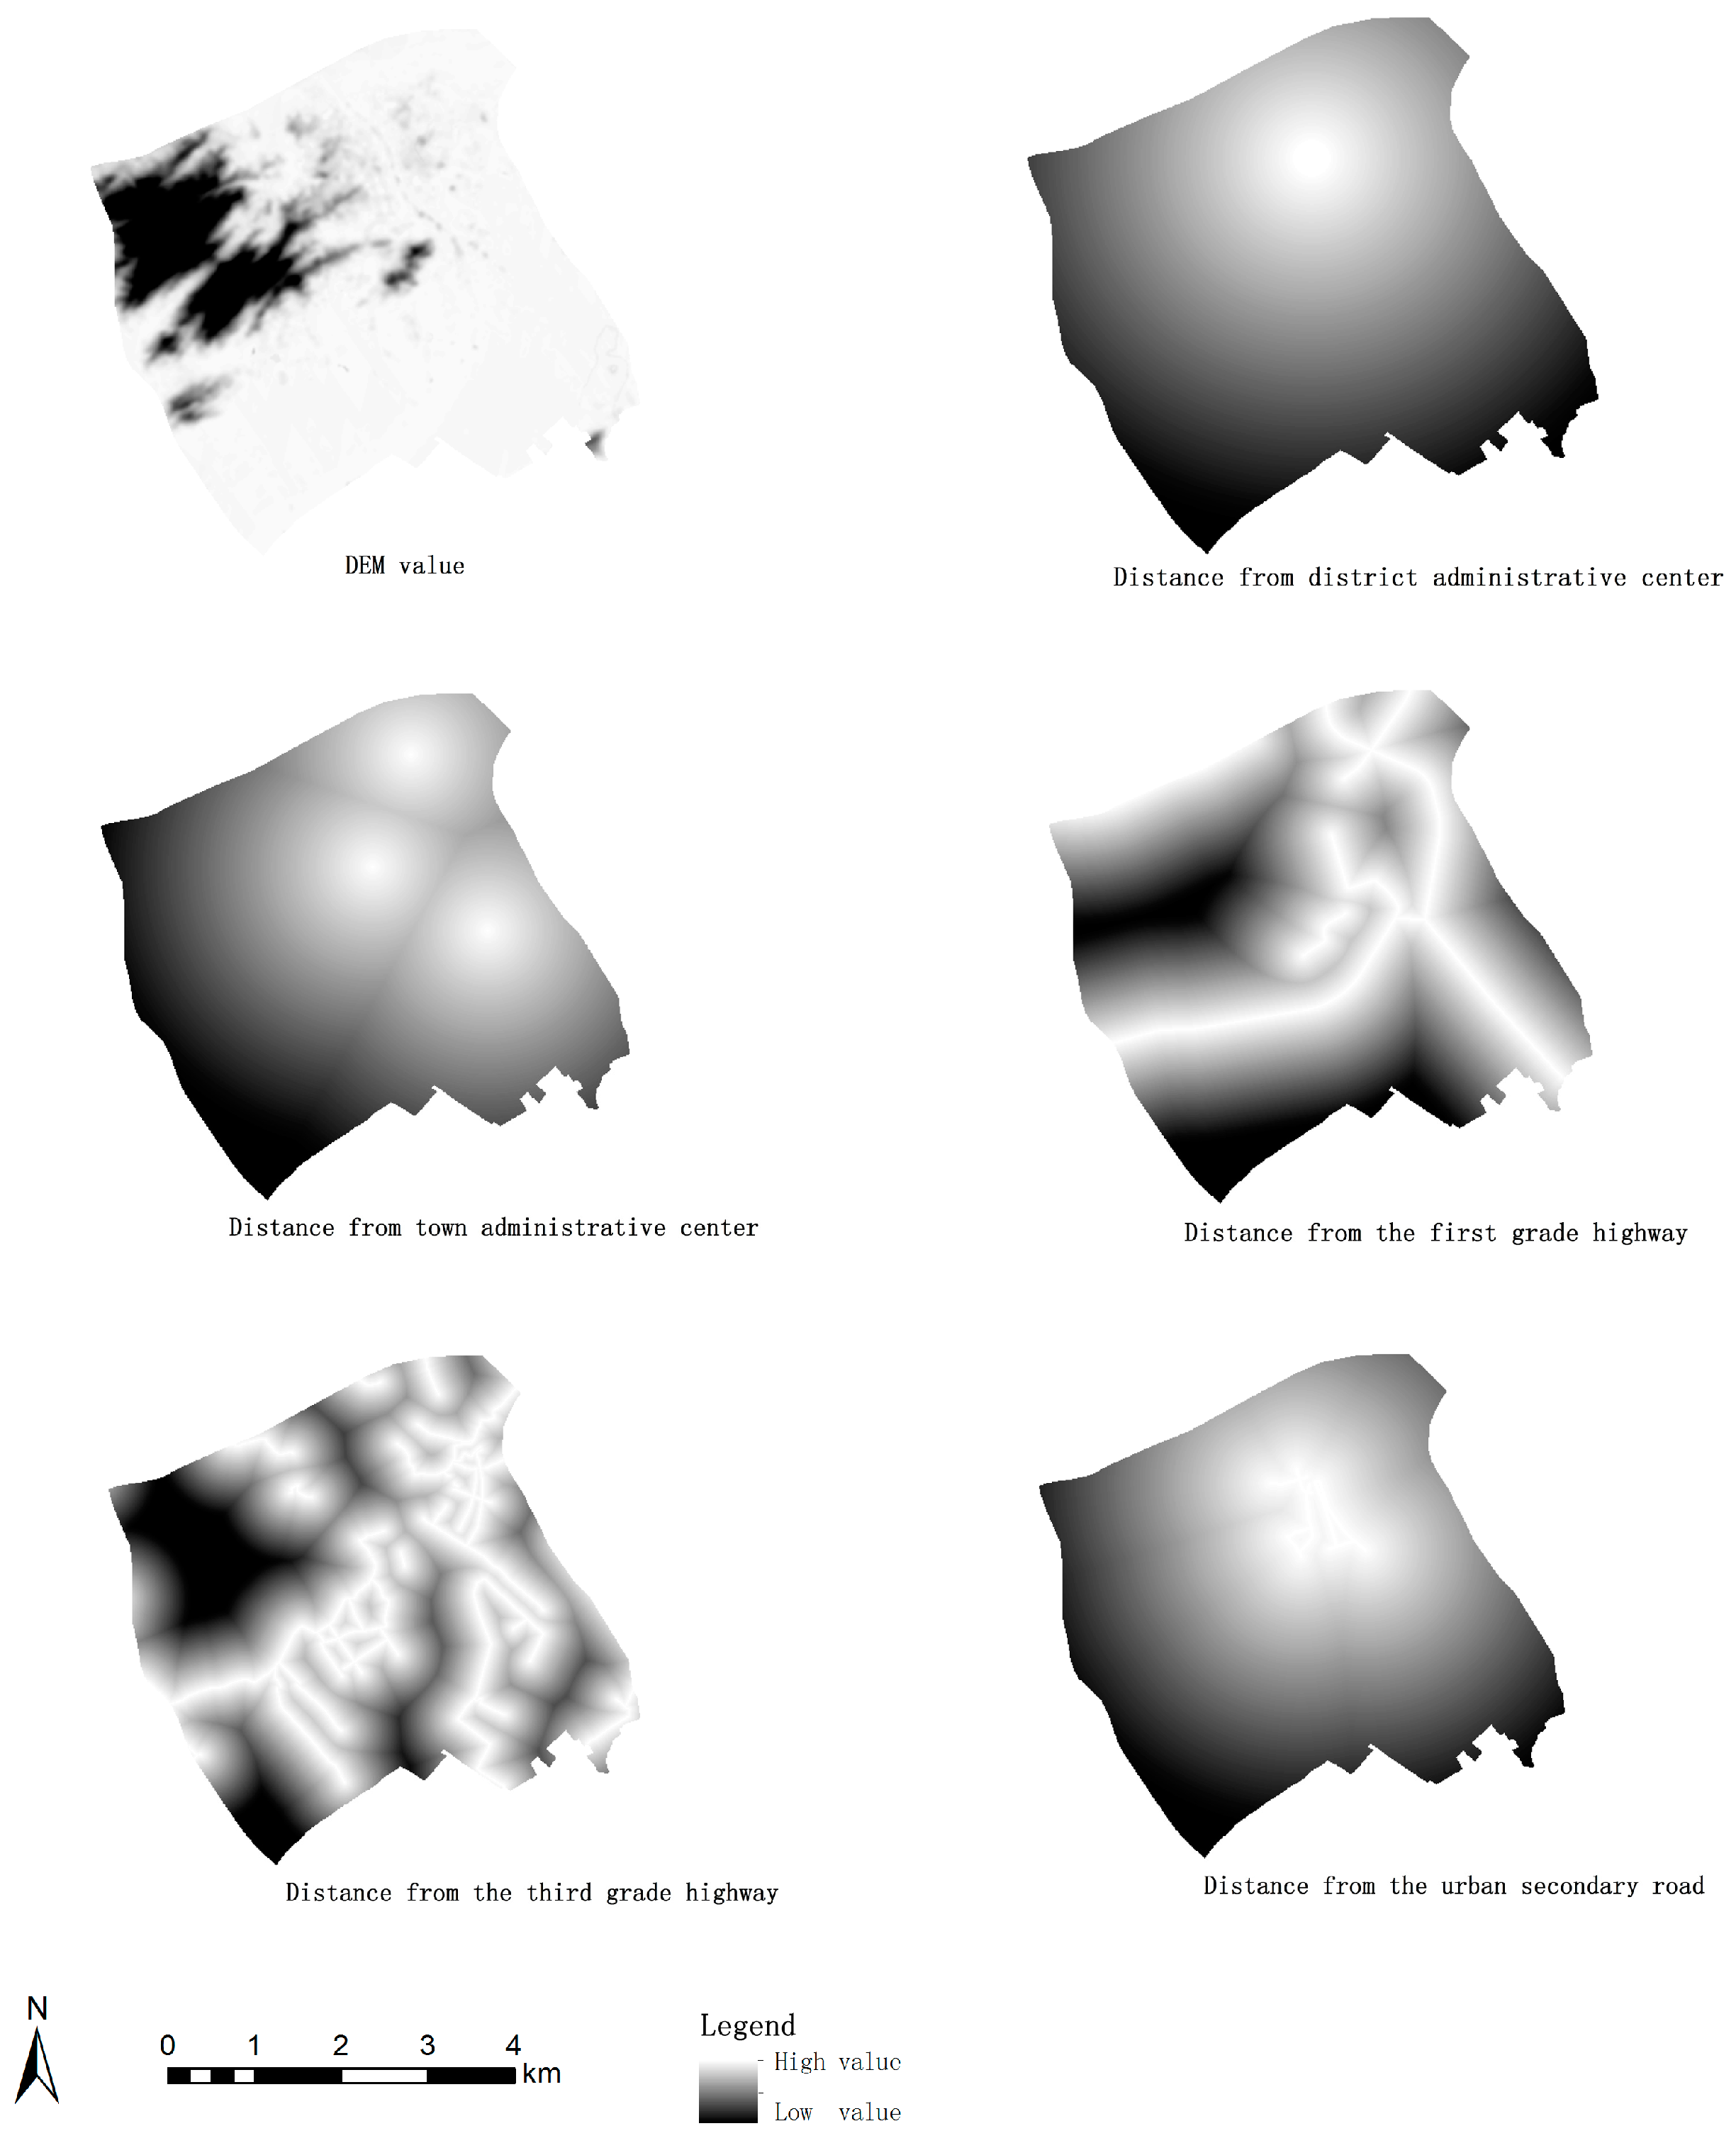
When the logistic-CA model is used to simulate the urban development elastic boundary (dependent variable), the factor regression coefficient of each factor (explanatory variables) reflects its contribution to the model’s simulation result. Specifically, when the absolute value of the factor regression coefficient is greater, the contribution rate of the model factor is higher. On the basis of this principle, the final factors have been reasonably selected considering both the completeness and the representativeness of the simulation factors. Thus, and finally the logistic-CA model with higher precision has been established. In terms of factor selection, according to the availability of data, the characteristics of study area and related research, four kinds of factors—such as natural environment, location center, road traffic and urban road—were selected tentatively: DEM, slope, distance from county administrative center, distance from town administrative center, distance from expressway, distance from first-grade highway, distance from secondary roads, distance from third-grade highway, distance from urban arterial road and distance from urban secondary road. Among them, distance from the expressway is a positive influence factor, and the other nine spatial variables are negative influence factors. In addition, the factor basic farmland conservation area was considered when delineating the urban development rigid boundary. Therefore, the basic farmland conservation area was not considered as an independent spatial variable here. After that, taking the abovementioned spatial variables as influencing factors, we conducted multiple logistic-CA simulations and obtained the contribution rate of all spatial variables in descending order. Furthermore, according to the completeness and the representativeness of factor selection, six spatial variables of four types were finally selected (
Table 3). In other words, the six spatial variables are the final input spatial factors of the logistic-CA simulation model (
Figure 4).
2.6. Compactness Model
Urban spatial form results from the continuous expansion of urban areas, whose change can affect many aspects of society and the economy from planning to construction [
34]. The compactness of urban development boundary has been an important concept that directly reflects urban spatial form and has been widely used in related urban studies. The specific compactness model is defined as [
35]:
In Formula (3), CI is compactness of urban development boundary, Si is the area of polygon i in boundary, Pi is the perimeter of polygon i in boundary, and n is the number of polygons of boundary. In general, when the value of CI is higher, the urban space is more compact, and urban land use becomes more intensive. Here, we used the compactness model to analyze the compactness of the urban development elastic boundary.
3. Results and Analysis
3.1. Delineating Urban Development Rigid Boundary
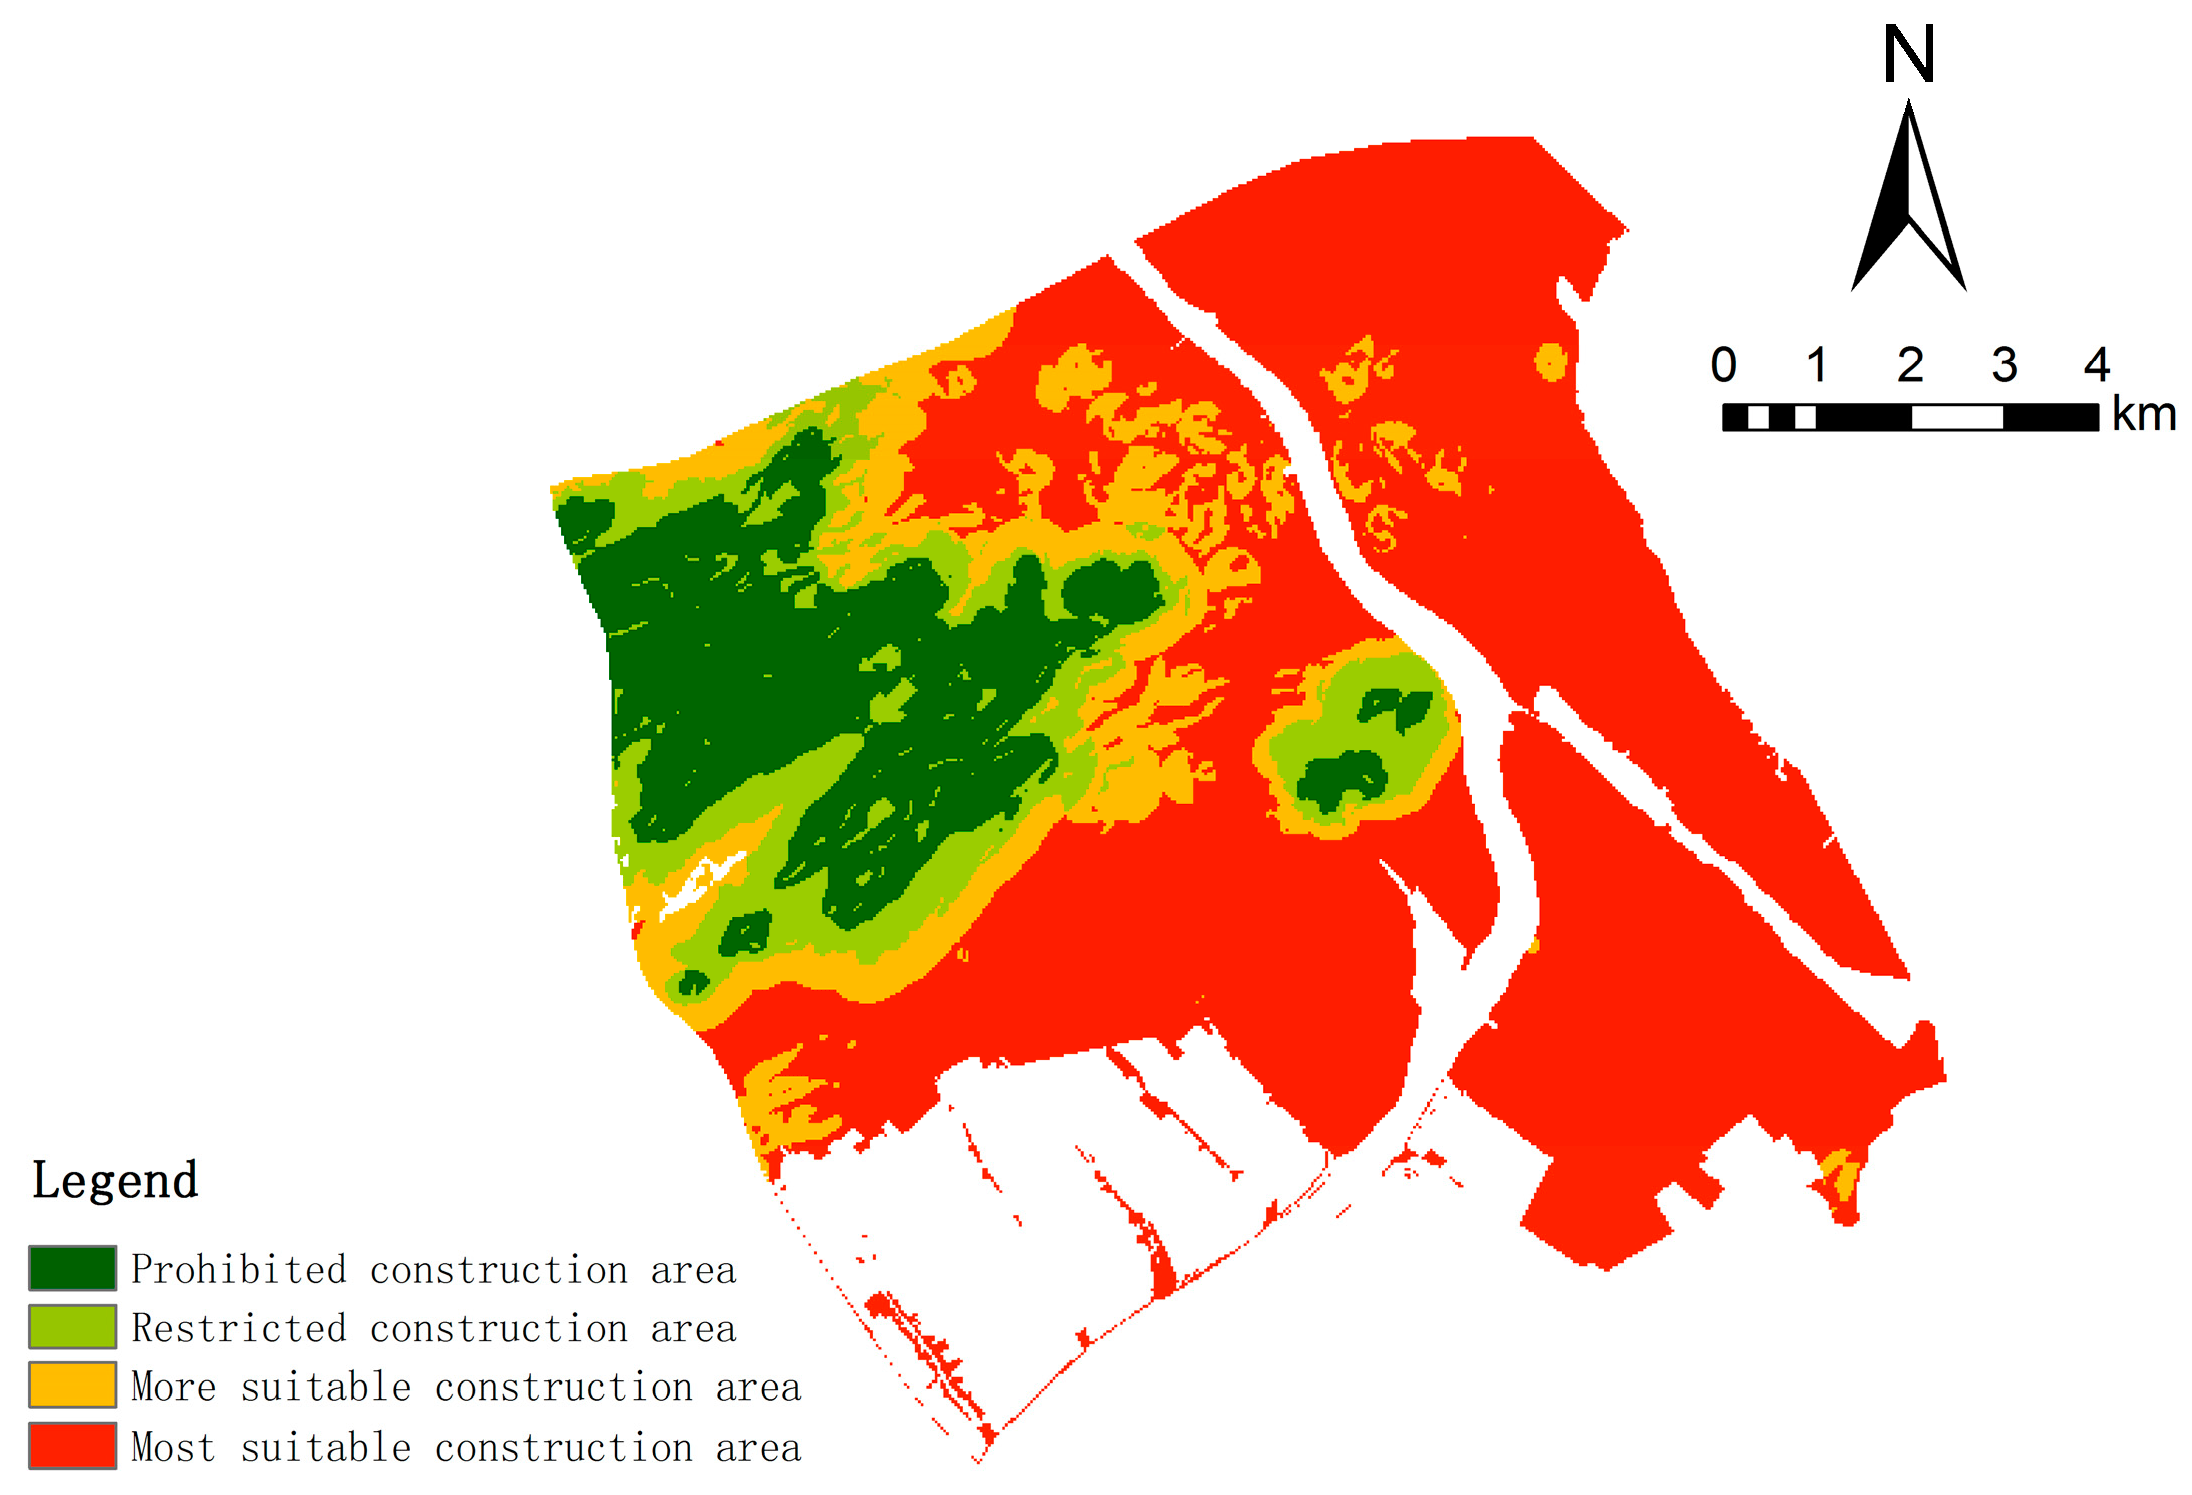
Based on the above selected evaluation factors, we calculated a comprehensive score for each evaluation unit and obtained a suitability evaluation map. Then, the spatial suitability degree map of construction land was formed using the method of Natural Breaks. The spatial suitability degree map contains four grades: most suitable construction area, more suitable construction area, restricted construction area and prohibited construction area.
Figure 5 shows spatial distribution patterns for four different construction areas. Because the constrained boundaries of basic farmland conservation and the river were extracted, the white spaces in the map are non-evaluation units with no value in the comprehensive score. According to the results of the suitability evaluation, the most and the more suitable construction areas were considered as preliminary spatial ranges for the urban development rigid boundary.
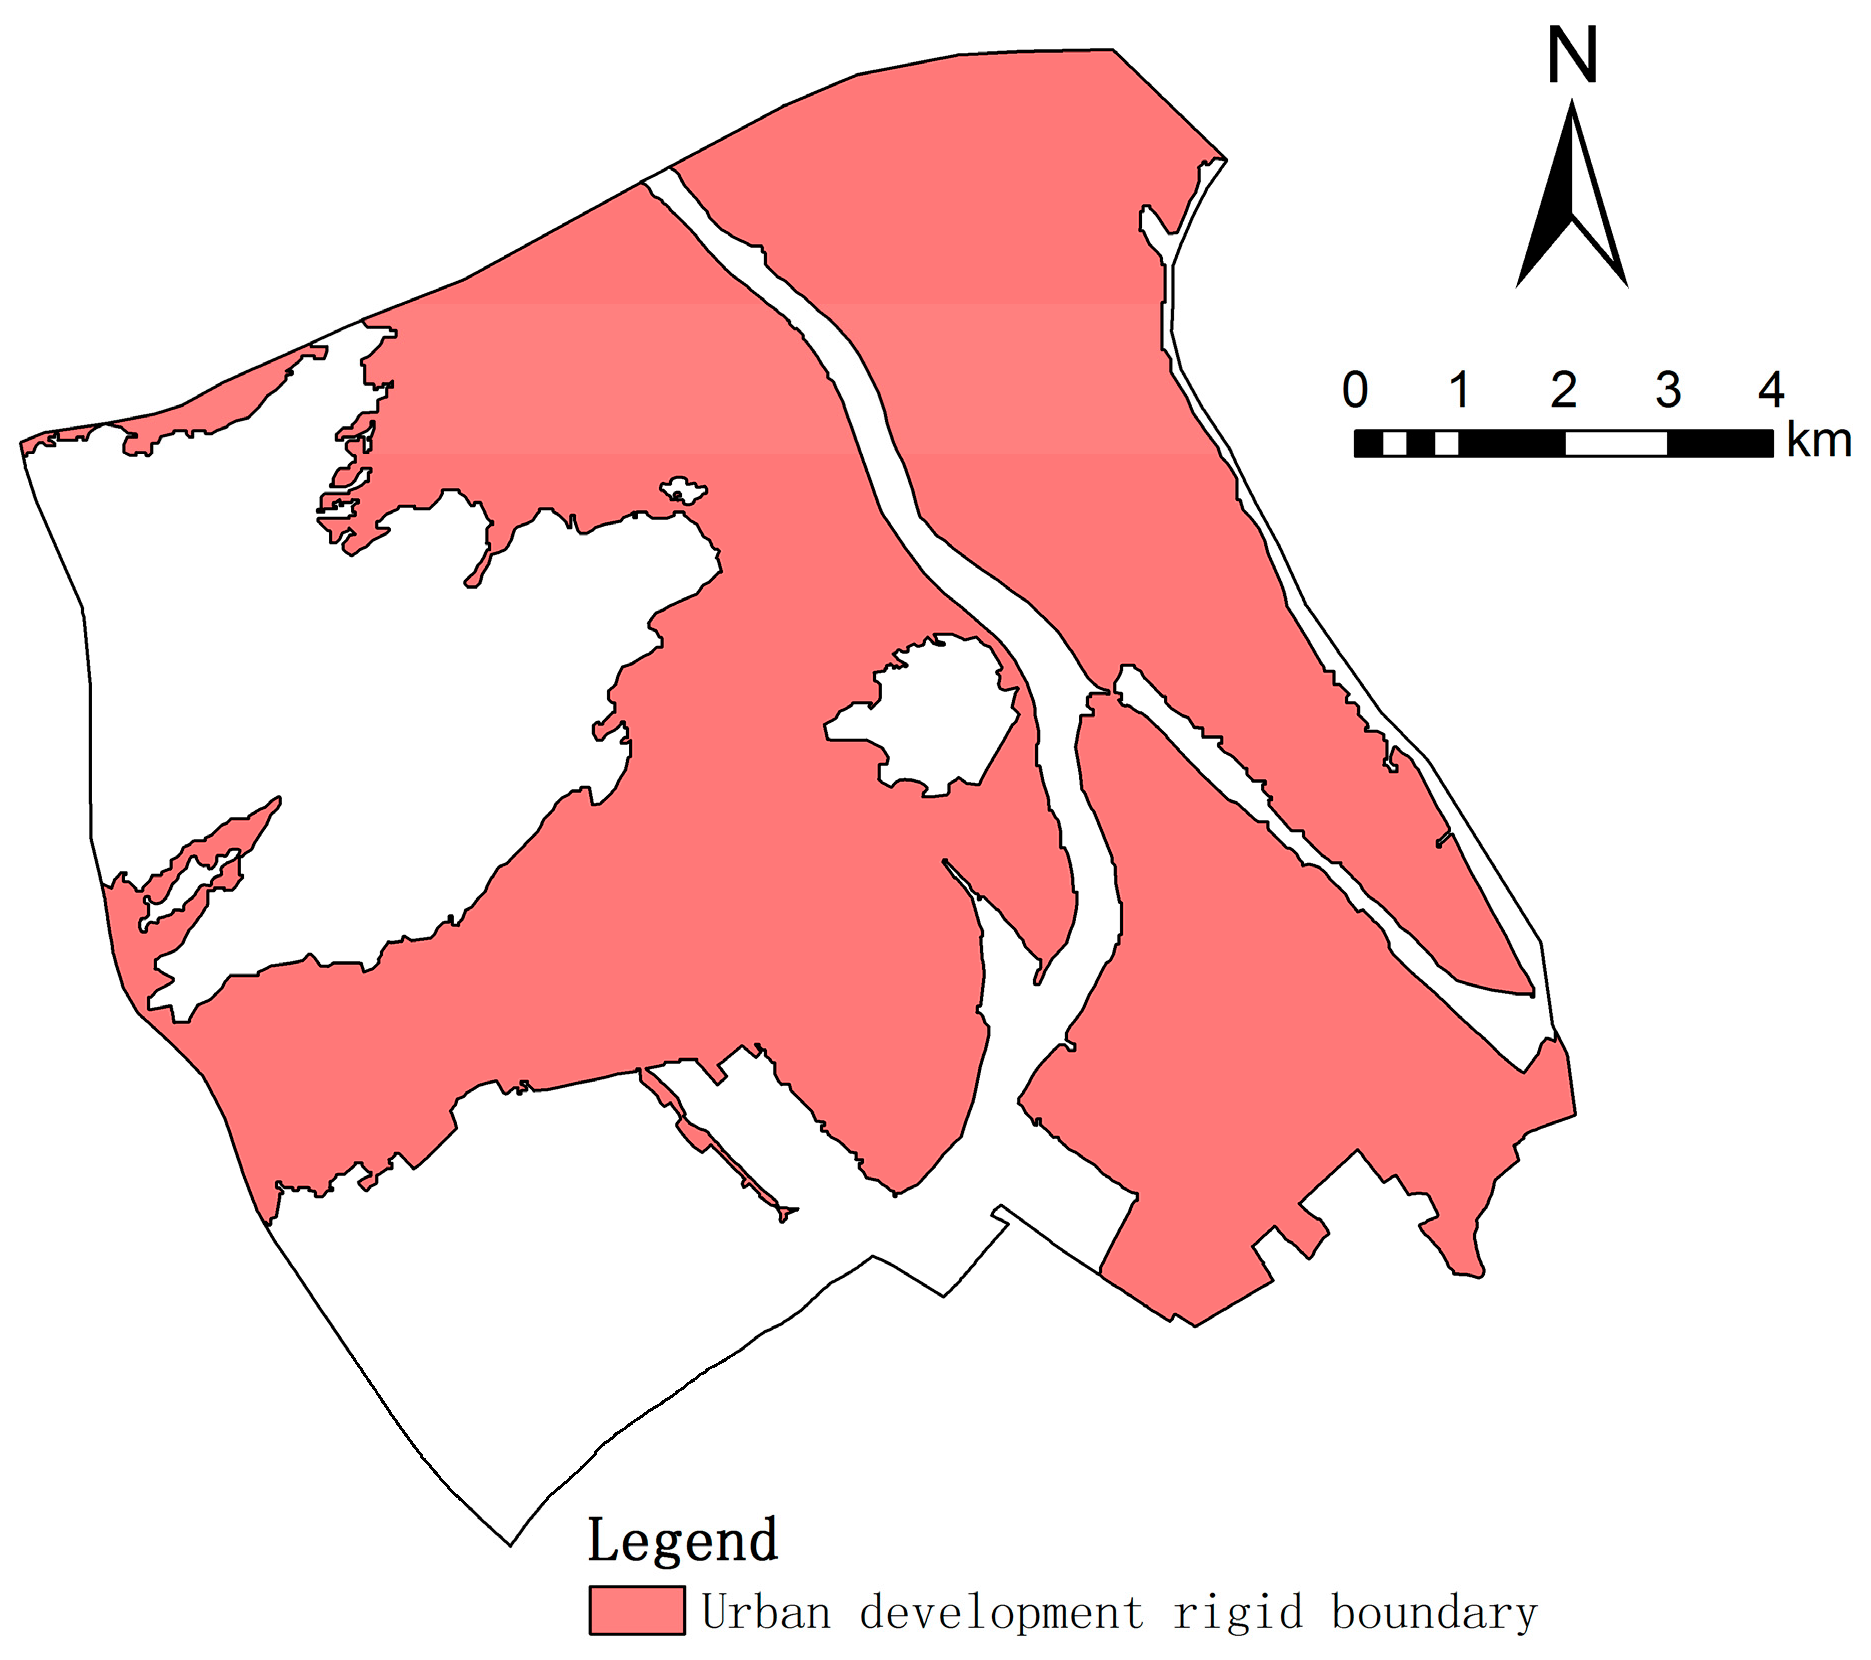
Based on the preliminary spatial range, following the delimitation principle of continuity and adjacency in space, finally we obtained the urban development rigid boundary, while also considering the central urban planning area adjustment factor. We can do urban development and construction within the rigid boundary that has the largest land capacity for urban development; urban development behavior is not allowed outside the rigid boundary. In principle, urban development for the Central Urban Area of Doumen cannot exceed or break the rigid boundary in the future. In addition, the urban development rigid boundary is shown in
Figure 6. From its spatial layout, on the whole, the urban development rigid boundary is centrally distributed in the northeast, southeast and central section, with only a small amount occurring in the northwest because of its high terrain. A few other places also occur. Regarding town distribution, the study area consists of Jingan town, Baijiao town, Doumen town and Qianwu town, and on the one hand the rigid boundary is distributed in these four towns. On the other hand, the boundary is mostly located in Jingan town and Baijiao town with just a bit occurring in the west in Doumen town and Qianwu town. Because of the numerous rivers—mainly including the Huangyang river, the Friendship river (near the Pear River Estuary) and the Crockcrow river—the rigid boundary space layout was constrained and guided to a certain extent, resulting in directing the rigid boundary along the river. Moreover, the rigid boundary effectively avoided the basic farmland conservation area of the Central Urban Area of Doumen. Meanwhile, the rigid boundary does not include the Jianfengshan forest park located probably in the center position, a national prohibited zone according to the division of main functional areas in China. In this way, the urban development rigid boundary is of great significance for maintaining ecological security.
Table 4 shows the specific statistical results of the urban development rigid boundary. Overall, the total area of the urban development rigid boundary is 79.60 km², which accounts for 61.21% of the study area. Concretely, the rigid boundary area of Jingan town territory is 51.26 km², and the proportions of the total area of the rigid boundary and the study area are 64.40% and 39.42%, respectively; the rigid boundary area of Baijiao town territory is 24.00 km², and the proportions of the total area of the rigid boundary and the study area are 30.15% and 18.46%, respectively; the rigid boundary area of Qianwu town territory is 3.77 km², and the proportions of the total area of the rigid boundary and the study area are 4.73% and 2.90%, respectively; and the rigid boundary area of Doumen town territory is 0.57 km², and the proportions of the total area of the rigid boundary and the study area are 0.72% and 0.44%, respectively. Therefore, Jingan town and Baijiao town will be the main area of urban development(sprawl) in the future.
For this reason, two main aspects are involved: nature and social economy. First, in this study area, topographic factors (DEM and slope) largely represent natural causes. From the above result of the urban development rigid boundary, a majority of the rigid boundary (boundaries) is located in the flat area, which has a low DEM and a gentle slope simultaneously. Only a small part of the rigid boundary is located in an area with a slightly higher DEM and slope, mainly in the west of the study area. In general, urban development construction in flat areas can reduce some unnecessary costs and effectively cut down its cost. Conversely, at high DEM and in steep terrains, costs increase and many insurmountable technical difficulties result. Therefore, a trend exists in urban development toward low DEM and gentle slope. This result also aligns with the actual situation of urban development. Second, the road traffic is important factor for social and economic reasons, as well as for the most important reason—highway traffic and urban roads. Based on the spatial analysis of the rigid boundary and the road traffic layers, we have found that the rigid boundary is primarily located in the area with road traffic lines, and very little of the rigid boundary is located in the northwest because the road traffic lines are short. Compared to an area without a road traffic network, an area with road traffic is more likely to be developed in the process of urban development. When an area is closer to a road, it is developed and constructed earlier. Furthermore, when traced to its root, road traffic can improve its spatial location conditions and the accessibility of urban space. Thus, road traffic not only has a strong attraction for an area’s urban development; it also has the basic framework of an urban development rigid boundary.
3.2. Delineating Urban Development Elastic Boundary
3.2.1. Model Verification
To predict the urban development elastic boundary well using the logistic-CA model, we need to verify the simulant accuracy of the model before predicting the urban development elastic boundaries of the Central Urban Area of Doumen in 2020 and 2026. The accuracy test is an important step in cellular automata model research and a key step in the simulation and prediction of the logistic-CA model [
28,
33]. In this study, the time of the logistic-CA model accuracy test is from 2008 to 2014. In the model accuracy test process, we took the six selected spatial variables as model input factors to simulate land-type data of the central urban area of Doumen in 2014 (end year layer), the land-type data in 2008 as the base layer (start year layer), and real land-type data in 2014 as the contrast layer of the logistic-CA model. Finally, the simulation accuracy of the best logistic-CA model is shown in
Table 5. From this table, it can be seen that overall in this paper the logistic-CA model simulation is better. The total simulation accuracy of the model is 90.40%, and the simulation accuracy of the actual urban land is 70.30%. These results mean that the model can simulate the future urban development elastic boundary in 2020 and 2026.
3.2.2. Urban Scales Prediction
The urban development elastic boundary is a kind of guiding boundary basing on social and economic development scenarios. Urban scale-controlling is an important feature of the elastic boundary. Generally, there are different urban scales in different stages of social and economic development in the study area. The urban scale is a direct reflection of land demand in urban development. In other words, different urban scales mean different demands for land. Furthermore, urban scale is the area of land used for urban development to adapt to social and economic development needs. Therefore, urban scale prediction is crucial for delineating the urban development elastic boundary of the Central Urban Area of Doumen.
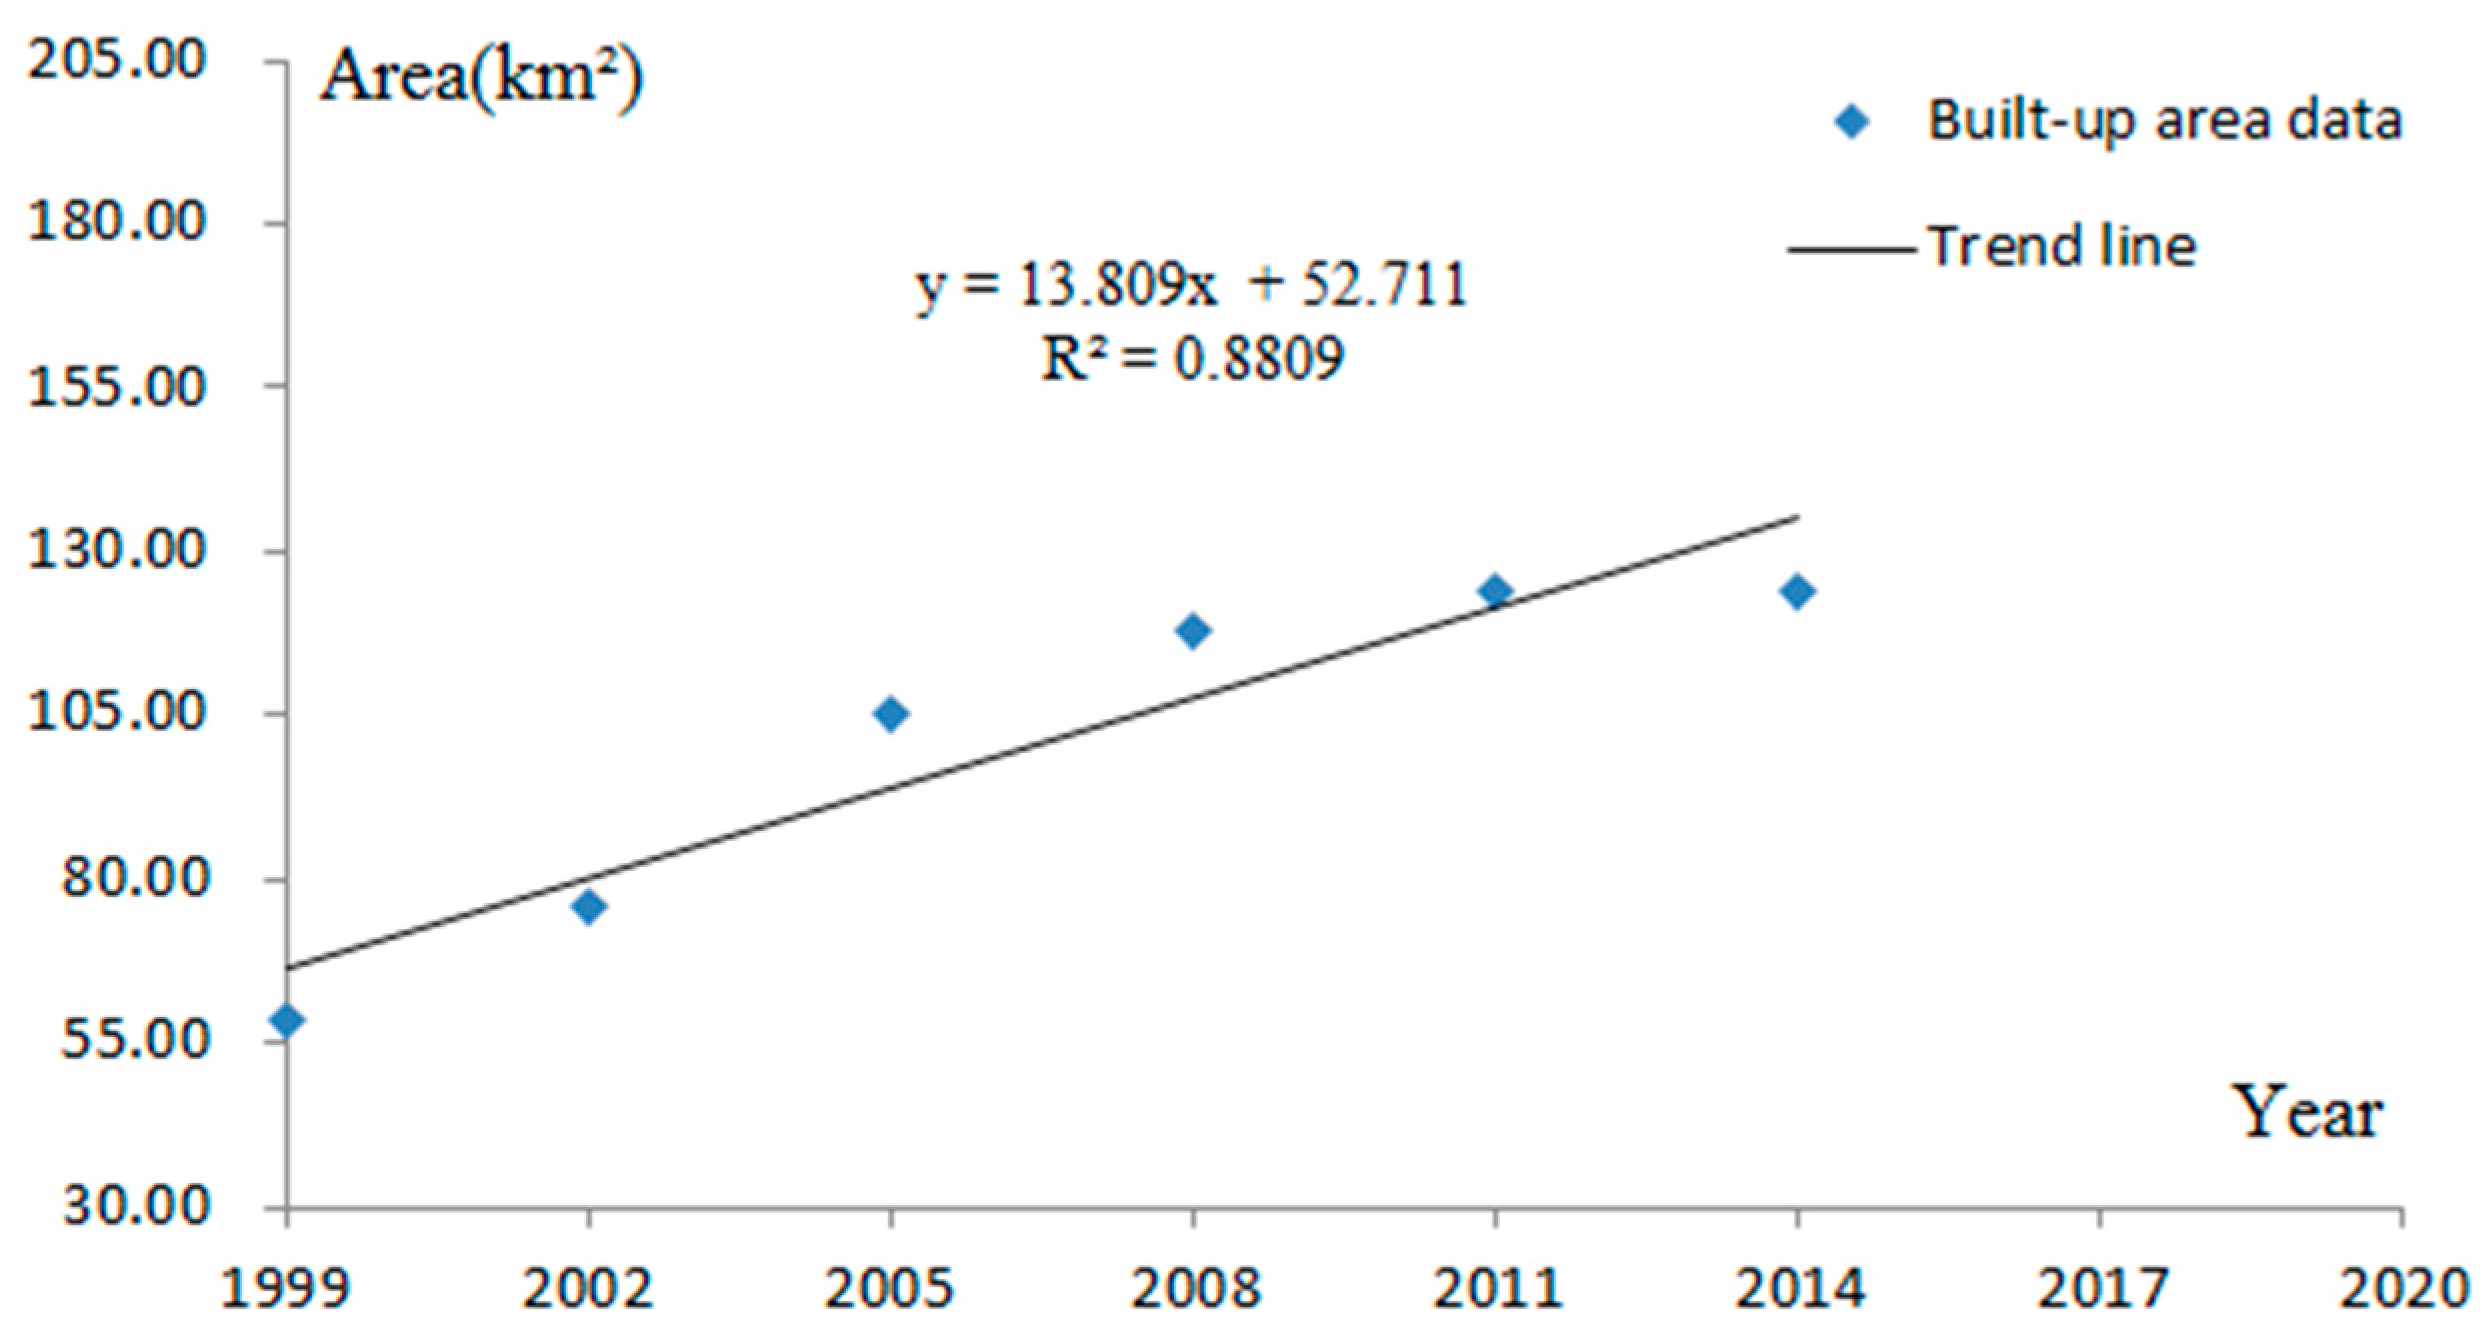
Here, we used data of the Zhuhai built-up area from 1999 to 2014 from the statistical yearbook of China urban construction, to predict the urban scale of the elastic boundary of the Central Urban Area of Doumen in 2020 and 2026. First, based on the characteristics of the data of Zhuhai built-up area, we selected the Zhuhai built-up area for 1999, 2002, 2005, 2008, 2011 and 2014 to predict the Zhuhai built-up area in 2020 and 2026. Next, the trend line of the Zhuhai built-up area in the period from 1999 to 2014 can be obtained using Excel software (
Figure 7). As a whole, the Zhuhai built-up area shows an upward trend from 1999–2014. The Zhuhai built-up area increases significantly from 1999–2005, then shows slow growth from 2005–2014, Therefore, the year 2005 is an important temporal node for the Zhuhai built-up area trend development. The expression of the trend line is. When the value of R² is larger, the predicted Zhuhai built-up area is more exact, and correlation coefficient (R² = 0.8809) of the trend line indicates that the predicted value of the Zhuhai built-up area is reliable. Then, we conclude that the Zhuhai built-up area in 2020 and 2026 is 163.18 km² and 190.80 km², respectively. Finally, according to the administrative relationship between the study area and Zhuhai, we conclude that the urban scale of the study area in 2020 and 2026 is approximately 24.51 km² and 28.53 km², respectively.
3.2.3. Elastic Boundary Simulation
Based on the above, we used the logistic-CA model to simulate the urban development elastic boundary in 2020 and 2026. Then, its spatial layout was obtained, which is the embodiment of the aforementioned predicted urban scale. In the specific simulation process, land-type data of Doumen’s central urban area in 2014 was the base layer for the logistic-CA model simulation. In addition, we obtained the urban development elastic boundary, using the logistic-CA model that was verified. The urban development elastic boundary is the urban development space that depends on social and economic development scenarios, whose goal is to realize dynamic development and growth of overall benefits of the study area. It can also guide the rational growth of the urban space. We can do urban development and construction within the elastic boundary in future time. The urban development elastic boundary is shown in
Figure 8.
From their spatial layouts, on the basis of the current situation in 2014, as a whole, urban development presents a multicenter expansion pattern from 2014 to 2026 with different degrees of expansion along each direction from multiple centers. The newly increased urban areas are mainly distributed in the northeast, southeast and center of the Central Urban Area of Doumen, because the urban areas in 2014 are mainly distributed in these places; moreover, few newly increased urban areas occur in the west, far from main city in 2014. A majority of the newly increased urban areas are located on both sides of the river. From the perspective of town distribution, the newly increased urban areas are located in Jingan town, Baijiao town and Qianwu town, but no newly increased urban area is found in Doumen town. Moreover, most of the newly increased urban areas are located in Jingan town and Baijiao town, and very few of them are located in Qianwu town. The reason for this distribution is that Jingan town and Baijiao town were already main urban areas in 2014 and thus strongly attractive for urban development. Qianwu town remains far from the main urban area in a remote area, so it has a weak attraction for urban development.
From its statistical data,
Table 6 shows the specific results. On the whole, the urban scale of the elastic boundary in 2026 is larger than in 2020. The newly increased urban area in 2026 is more than in 2020 within the same time period (six years). In other words, the average rate of urban development from 2020 to 2026 will be faster than it was from 2014 to 2020. Specifically, the urban scale of the elastic boundary in 2020 is 24.51 km², and urban scales in Jingan town, Baijiao town and Qianwu town are 16.18 km², 8.10 km² and 0.23 km², respectively. Furthermore, the total newly increased urban area of the elastic boundary is 2.92 km² from 2014 to 2020. Among them, the newly increased urban area in Jingan town is 1.56 km², and the proportion of the total newly increased urban area is 53.54%; the newly increased urban area in Baijiao town is 1.33 km², and the proportion of the total newly increased urban area is 45.48%; and the newly increased urban area in Qianwu town is 0.03 km², and the proportion of the total newly increased urban area is 0.97%. In addition, the urban scale of the elastic boundary in 2026 is 28.53 km², and the urban scales in Jingan town, Baijiao town and Qianwu town are 18.51 km², 9.75 km² and 0.27 km², respectively. Moreover, the total newly increased urban area of the elastic boundary from 2020 to 2026 is 4.02 km². Among them, the newly increased urban area in Jingan town is 2.33 km², and the proportion of the total newly increased urban area is 57.99%; the newly increased urban area in Baijiao town is 1.64 km², and the proportion of the total newly increased urban area is 40.93%; and the newly increased urban area in Qianwu town is 0.04 km², and the proportion of the total newly increased urban area is 1.08%. Therefore, by contrast, Jingan town will be the main area of urban development(sprawl) from 2014 to 2026.
Judging from the results of the delineated urban development elastic boundary, two main conclusions can be reached. Firstly, compared with the average rate of urban development from 2008 to 2014 (0.94 km² per annum), the average rate of urban development has decreased from 2014 to 2026 (0.58 km² per annum). According to the actual development situation of China, we will pay more attention to development quality in the future development process. Thus, urban development in the study area will also have more attention paid to urban development quality. This focus will lead to a reduction in the urban growth scale during the same time period; in other words, the average rate of urban development will decrease. Hence, this conclusion conforms to the urban future development. Second, Jingan town is the main area of urban development from 2014 to 2026. The proportion of the total newly increased urban area in Jingan town is more than 53% in the two stages of development (from 2014 to 2020 and from 2020 to 2026), and Jingan town is an important growth pole for urban development. Regarding the actual situation, Jingan town is the political, economic and cultural center of the Central Urban Area of Doumen. Under the background of the new normal in China, Jingan town has a strong economic growth momentum and therefore a strong demand for urban development. Thus, the conclusion that Jingan town is the main area of urban development in the future is reasonable.
3.3. Compactness Analysis of the Urban Development Elastic Boundary
By delineating the urban development elastic boundary, we analyzed the compactness of the future elastic boundary.
Table 7 shows the compactness results of the urban development boundary in 2014, 2020 and 2026. From the table it can be seen that, on the one hand, compared with the situation in 2014, the compactness increased significantly in both in 2020 or in 2026, and its compactness in 2020 and 2026 increased by 0.008 and 0.015, respectively. Therefore, the compactness in 2020 and 2026 is better than in 2014. On the other hand, from 2020 to 2026, its compactness in 2026 is higher than in 2020, and the compactness in 2026 increased by 0.007, implying that the elastic boundary in 2026 is more compact than in 2020. The table also illustrates that urban development will become more compact.
A compact urban form has some advantages in terms of optimizing urban development. First, a compact urban form can improve land-use efficiency and reduce waste of urban land resources in the process of regional urban development. Then, it can help to achieve the intensive use of urban land. Second, a compact urban form can effectively avoid confusion in urban land layout. It can also optimize urban land space and curb the disorderly sprawl of urban development, which would be conducive to the occupation of basic farmland. Finally, a compact urban form can ensure the sustainability of urban development. Sustainable urban development is not only required by China’s national conditions but also by the times of urban development.
4. Discussion
4.1. Theoretical Rationality
First, constrained boundaries have been extracted. Taking natural and ecological factors as evaluation factors, the urban development rigid boundary has been delineated. Second, based on the urban development rigid boundary, we have screened the final space variables for the logistic-CA model. Meanwhile, we have verified the model’s validity, and the urban scale of the urban development elastic boundary has been predicted. Third, under these conditions, we have simulated the urban development elastic boundary. In addition, based on the compactness of the urban development boundary in 2014, we have analyzed the compactness of the urban development elastic boundary from 2020 to 2026. In view of the above, we have taken into account the natural, economic and social conditions of the Central Urban Area of Doumen; and quantitative models were the main research methods used in this study.
Compared with previous studies on urban development boundary, the most important highlight of this paper is that the dual considerations of controlling scale and guiding development were applied. Specifically, on the one hand, from the perspective of ecological security, the upper limit of urban development can be obtained through multifactor comprehensive evaluation model. Furthermore, urban development activities are strictly limited to a clear geographical space, and urban sprawl issues can be resolved subsequently. This process will effectively control scale of urban development. On the other hand, to meet land urban development demands in the near future (2014–2026), science-led boundaries of urban development were delimited within the ultimate space range of urban development using the logistic-CA model. The scale and direction of urban development have been clarified based on land parcels. Moreover, all urban development activities are allowed within science-led boundaries, and urban development at a certain stage of social and economic development scenarios can be carried out in an orderly manner. In this way we can guide urban development.
As stated previously, the delineated results of the urban development boundary are reasonable in theory. The delineation idea of the urban development boundary will provide some ideas and references for related practical work in other similar regions.
4.2. Reference for Practical Application
4.2.1. Compared with Main Functional Zoning
According to the main functional zoning of the Central Urban Area of Doumen, done at the national level, the study area includes an optimal development zone and a prohibited development zone. Moreover, most of the study area is within the optimal development zone, and only some if it is within the prohibited development zone. Therefore, on the whole, the study area is suitable for urban development.
The delineated elastic boundaries in 2020 and 2026 were compared with main functional zoning to obtain a comparative analysis (
Figure 9). Overall, they are highly consistent. Specifically, the delineated urban development elastic boundaries are basically distributed in the optimal development zone; they present cluster states at the same time. A few of the delineated urban development elastic boundaries within Jingan town are in the prohibited development zone, appearing in the Jianfengshan forest park. This result is because the main functional zoning was completed in 2008 and formally published in 2011; therefore, it may have some time limitations. In addition, the area around Jianfengshan forest park itself has excellent urban development conditions. Therefore, the simulation results of the elastic boundary align with times and social needs, and they are reasonable. Moreover, the delineated elastic boundaries are basically consistent with the main functional zoning, and they are conducive to the scale use and intensive use of urban land. Urban development in the future will be able to further avoid the prohibited development zone. However, we still need to strengthen the protection for the Jianfengshan forest park. Therefore, the results of delineated urban development elastic boundary can provide some feasible references for decisions and suggestions regarding urban development.
4.2.2. Compared with Current Urban Planning (2020)
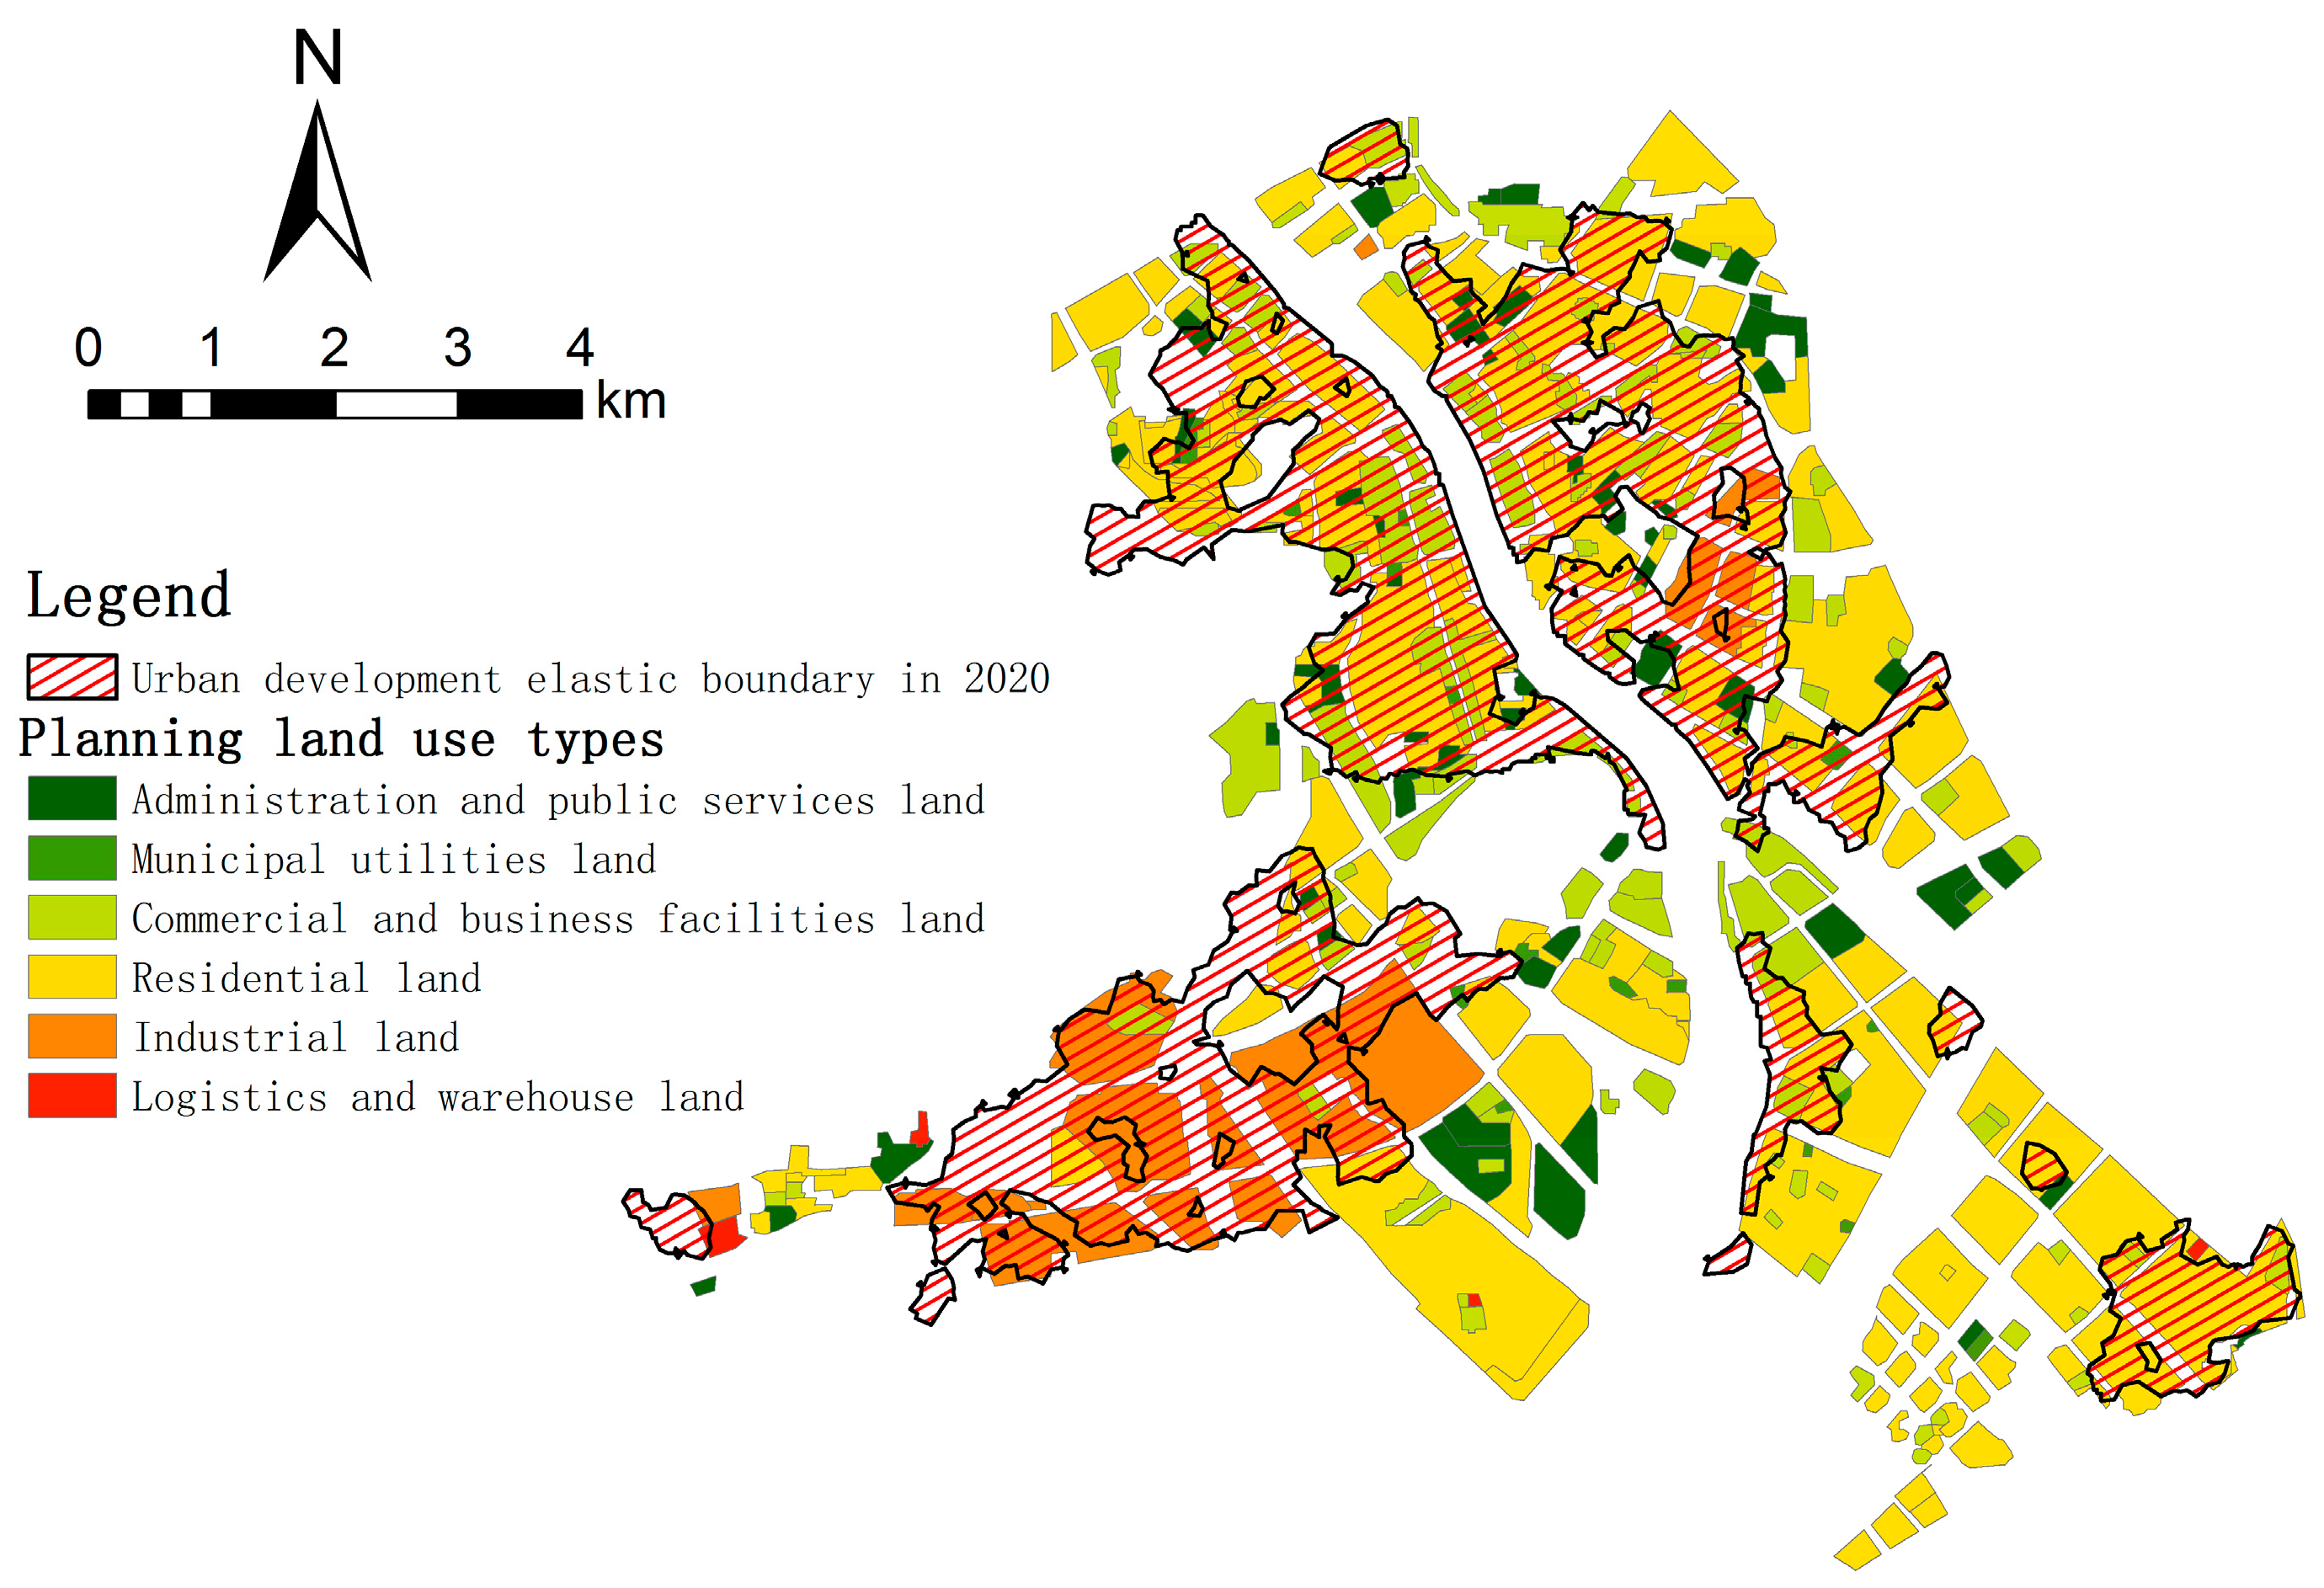
In China, urban planning is the overall, comprehensive and strategic planning of urban development and construction and it plays an important role in guiding urban development. Urban planning is the basis of urban construction and planning management. Making land-use decisions regarding the function of each parcel of land is the primary task of urban planners. Generally, urban development land in the process of regional development should be in the planning space. In this paper, the current urban planning map is derived from vectorization using GIS. The map contains the main land-use types of urban built-up areas, which can be categorized into six types: residential, administration and public services, commercial and business facilities, industrial, logistics and warehouse, and municipal utilities.
Through comparison, the results show that the delineated urban development elastic boundary is basically distributed in the planning space of the current urban planning (
Figure 10), meaning that simulation results of the logistic-CA model are good. A great spatial conformity of urban development land was found between the elastic boundary and the urban planning scenario. Enough lands are reserved in the key development regions (e.g., Jingan town and Baijiao town) to meet the objective needs of urban development. Moreover, the elastic boundary has effectively avoided the basic farmland conservation area; in other words, basic farmland will not be occupied. This result has a great role in ensuring food security, because the current grain self-sufficiency of China is far below the demand. Furthermore, we also find that the built-up scale of urban planning may be somewhat larger than actual urban development in 2020. In other words, urban planning may overestimate the future speed of urban development in the study area. From the previous results and analysis (the third part of this paper), we know that the speed of urban development will decrease in the future. Thus, the front and back are consistent. Different social and economic development stages should adapt to new situations and backgrounds.
4.3. Shortages and Prospects
On the one hand, for the delineation of urban development boundary, the study has still some shortcomings and can be improved in future research. First, when we use the logistic-CA model for simulation because research data are limited (data accessibility), socioeconomic variables were not considered as influence variables in the simulation model. However, the study fully considers the influences of location and road traffic on urban development boundary. In the future, some socioeconomic variables can be introduced as influence variables, which would make the influence variables of the model more comprehensive. Second, when the scale of urban development elastic boundary is predicted, we indirectly predicted the urban scale of the study area using data from the Zhuhai built-up area, and the predicted values may contain some errors. If the data can be obtained, urban scale of the elastic boundary can be directly predicted through its own built-up area data in future studies. Third, this study focused on the limit and driving mechanism of urban development boundary, without considering its internal mechanism (e.g., urban self-organization), which needs to be studied further. Finally, Landsat satellite images are a kind of remote-sensing data with medium spatial resolution, and the accuracy of the urban development boundary of 2008 and 2014 is affected because of this limited spatial resolution. Remote-sensing data with higher spatial resolution (e.g., QuickBird, SPOT-5, etc.) are needed for further study. On the other hand, for the application of urban development boundary, it has unique function on urban development. Urban development rigid boundary has the largest land capacity for urban development, which can control urban growth in general. In addition, various legislative works should be strengthened. Urban development elastic boundary is the urban development space depending on social and economic development scenarios, which effectively guide (drive) urban growth. The corresponding dynamic adjustment mechanism of it should be set up through planning.


