Article

Assessment of Land Cover Change and Its Impact on Changes in Soil Erosion Risk in Nepal

International Centre for Integrated Mountain Development, Kathmandu 44703, Nepal
*
Author to whom correspondence should be addressed.
Sustainability 2018, 10(12), 4715; https://doi.org/10.3390/su10124715
Submission received: 26 October 2018 / Revised: 26 November 2018 / Accepted: 29 November 2018 / Published: 11 December 2018
(This article belongs to the Special Issue Soil Erosion and the Sustainable Management of the Landscape)

Abstract

:
Land cover change is a critical driver for enhancing the soil erosion risk in Nepal. Loss of the topsoil has a direct and indirect effect on human life and livelihoods. The present study provides an assessment of the decadal land use and land cover (LULC) change and consequent changes in the distribution of soil erosion risk for the years, 1990, 2000, and 2010, for the entire country of Nepal. The study attempted to understand how different land cover types change over the three decades and how it has changed the distribution of soil erosion risks in Nepal that would help in the development of soil conservation priority. The land cover maps were produced using geographic object-based image analysis (GEOBIA) using Landsat images. Soil erosion patterns were assessed using the revised universal soil loss equation (RUSLE) with the land cover as the input. The study shows that the forest cover is the most dominant land cover in Nepal that comprises about 6,200,000 ha forest cover. The estimated annual erosion was 129.30 million tons in 1990 and 110.53 million tons in 2010. The assessment of soil erosion dynamics was presented at the national, provincial, and district level. District wise analysis revealed that Gulmi, Parbat, Syangja, and the Tanahu district require priority for soil conservation.

Graphical Abstract

1. Introduction

Land degradation is identified as one of the major environmental challenges that affects all landforms of the fragile Earth’s skin. Soil erosion is one of the key drivers of land degradation in mountain regions due to the loss of topsoil, thereby reducing soil fertility and consequently decreasing agricultural productivity and influencing habitat destruction [1,2]. Soil erosion causes an alteration in the water retention property of soil. Eroded soils are carried by the flow of water and deposited in the river channel that intercepts the water flow [3,4,5]. The debris flows due to erosion from upper land deposited in the river that reduces the carrying capacity, causing siltation in the irrigation canals, and damage to water control structures and turbines [6]. Erosion has been accelerating due to land use and land cover change and unsustainable management practices of land use and land cover change [2,7]. Countries, like Nepal, which have complex and diverse topography and improper land use management practices and has water-induced soil erosion, which is eventually transported to the Ganges delta, a downstream river basin forming islands in the Bay of Bengal [8]. Different case studies have revealed that land use land and land cover changes (LULCC) influence soil erosion at various spatiotemporal scales [2,7,9]. The area with high erodible soil is also prone to a higher risk of landslides [10,11]. Therefore, it is crucial to understand LULCC and the potential impacts it has on soil erosion dynamics [12]. Recognizing the trend and distribution of LULCC and soil erosion risk would be useful for better management of land cover and land use and reduce the risk of disaster from landslides.
Several models have been developed to assess soil erosion driven by water and associated sediment yield, which are categorized into empirical, regression, and conceptual models. Empirical or regression models include the universal soil loss equation (USLE) [13], and the revised universal soil loss equation (RUSLE) [14]. Among the various models, the RUSLE model is widely used to evaluate and identify the soil erosion due to its modest data requirement and simple, comprehensible model structure. The model is widely used for countries, where a lack of sufficient input data limits the implementation of complex models [15]. The model is useful to identify the spatial distribution of soil loss for a larger region [3] as it can estimate erosion risk on a regular grid [16]. Assessing soil erosion through the integration of soil erosion models, field data, and data obtained from remote sensing platforms using geographic information systems (GIS) methods has shown satisfactory results [3,7,17]. The integration has made the assessment and prediction easier and more efficient to address the issue of soil erosion [9].
Few studies on the estimation of soil erosion at a small scale have been conducted for different parts of Nepal. Optical images of high and medium resolutions with the GIS technique were used to examine soil erosion-prone areas in the Mustang watershed [18]. The RUSLE model in GIS platform has been used to study soil erosion in the Trijuga watershed [19], the entire Koshi river basin [17], and the Karnali river basin [20] of Nepal. Another model, such as the Morgan, Morgan, and Finney model [21], in a GIS environment, has been applied to assess the Likhu Khola valley [22]. Both these models were used to map soil erosion in the Kalchi Khola watershed of Nepal [23]. However, the assessment of soil erosion risk and distribution at the national scale is still lacking [24,25,26,27]. The overall purpose of this study was to identify the spatial patterns and temporal trend of soil erosion in Nepal and to determine how changes in land cover types affect the distribution of soil erosion risks. We have used land cover maps of 1990, 2000, and 2010 to estimate soil erosion risk represented by soil erodibilty for those years to understand how different land cover types affects the rate of soil erosion, and developed an erosion risk map for Nepal that would be useful for soil conservation prioritisation.

2. Materials and Methods
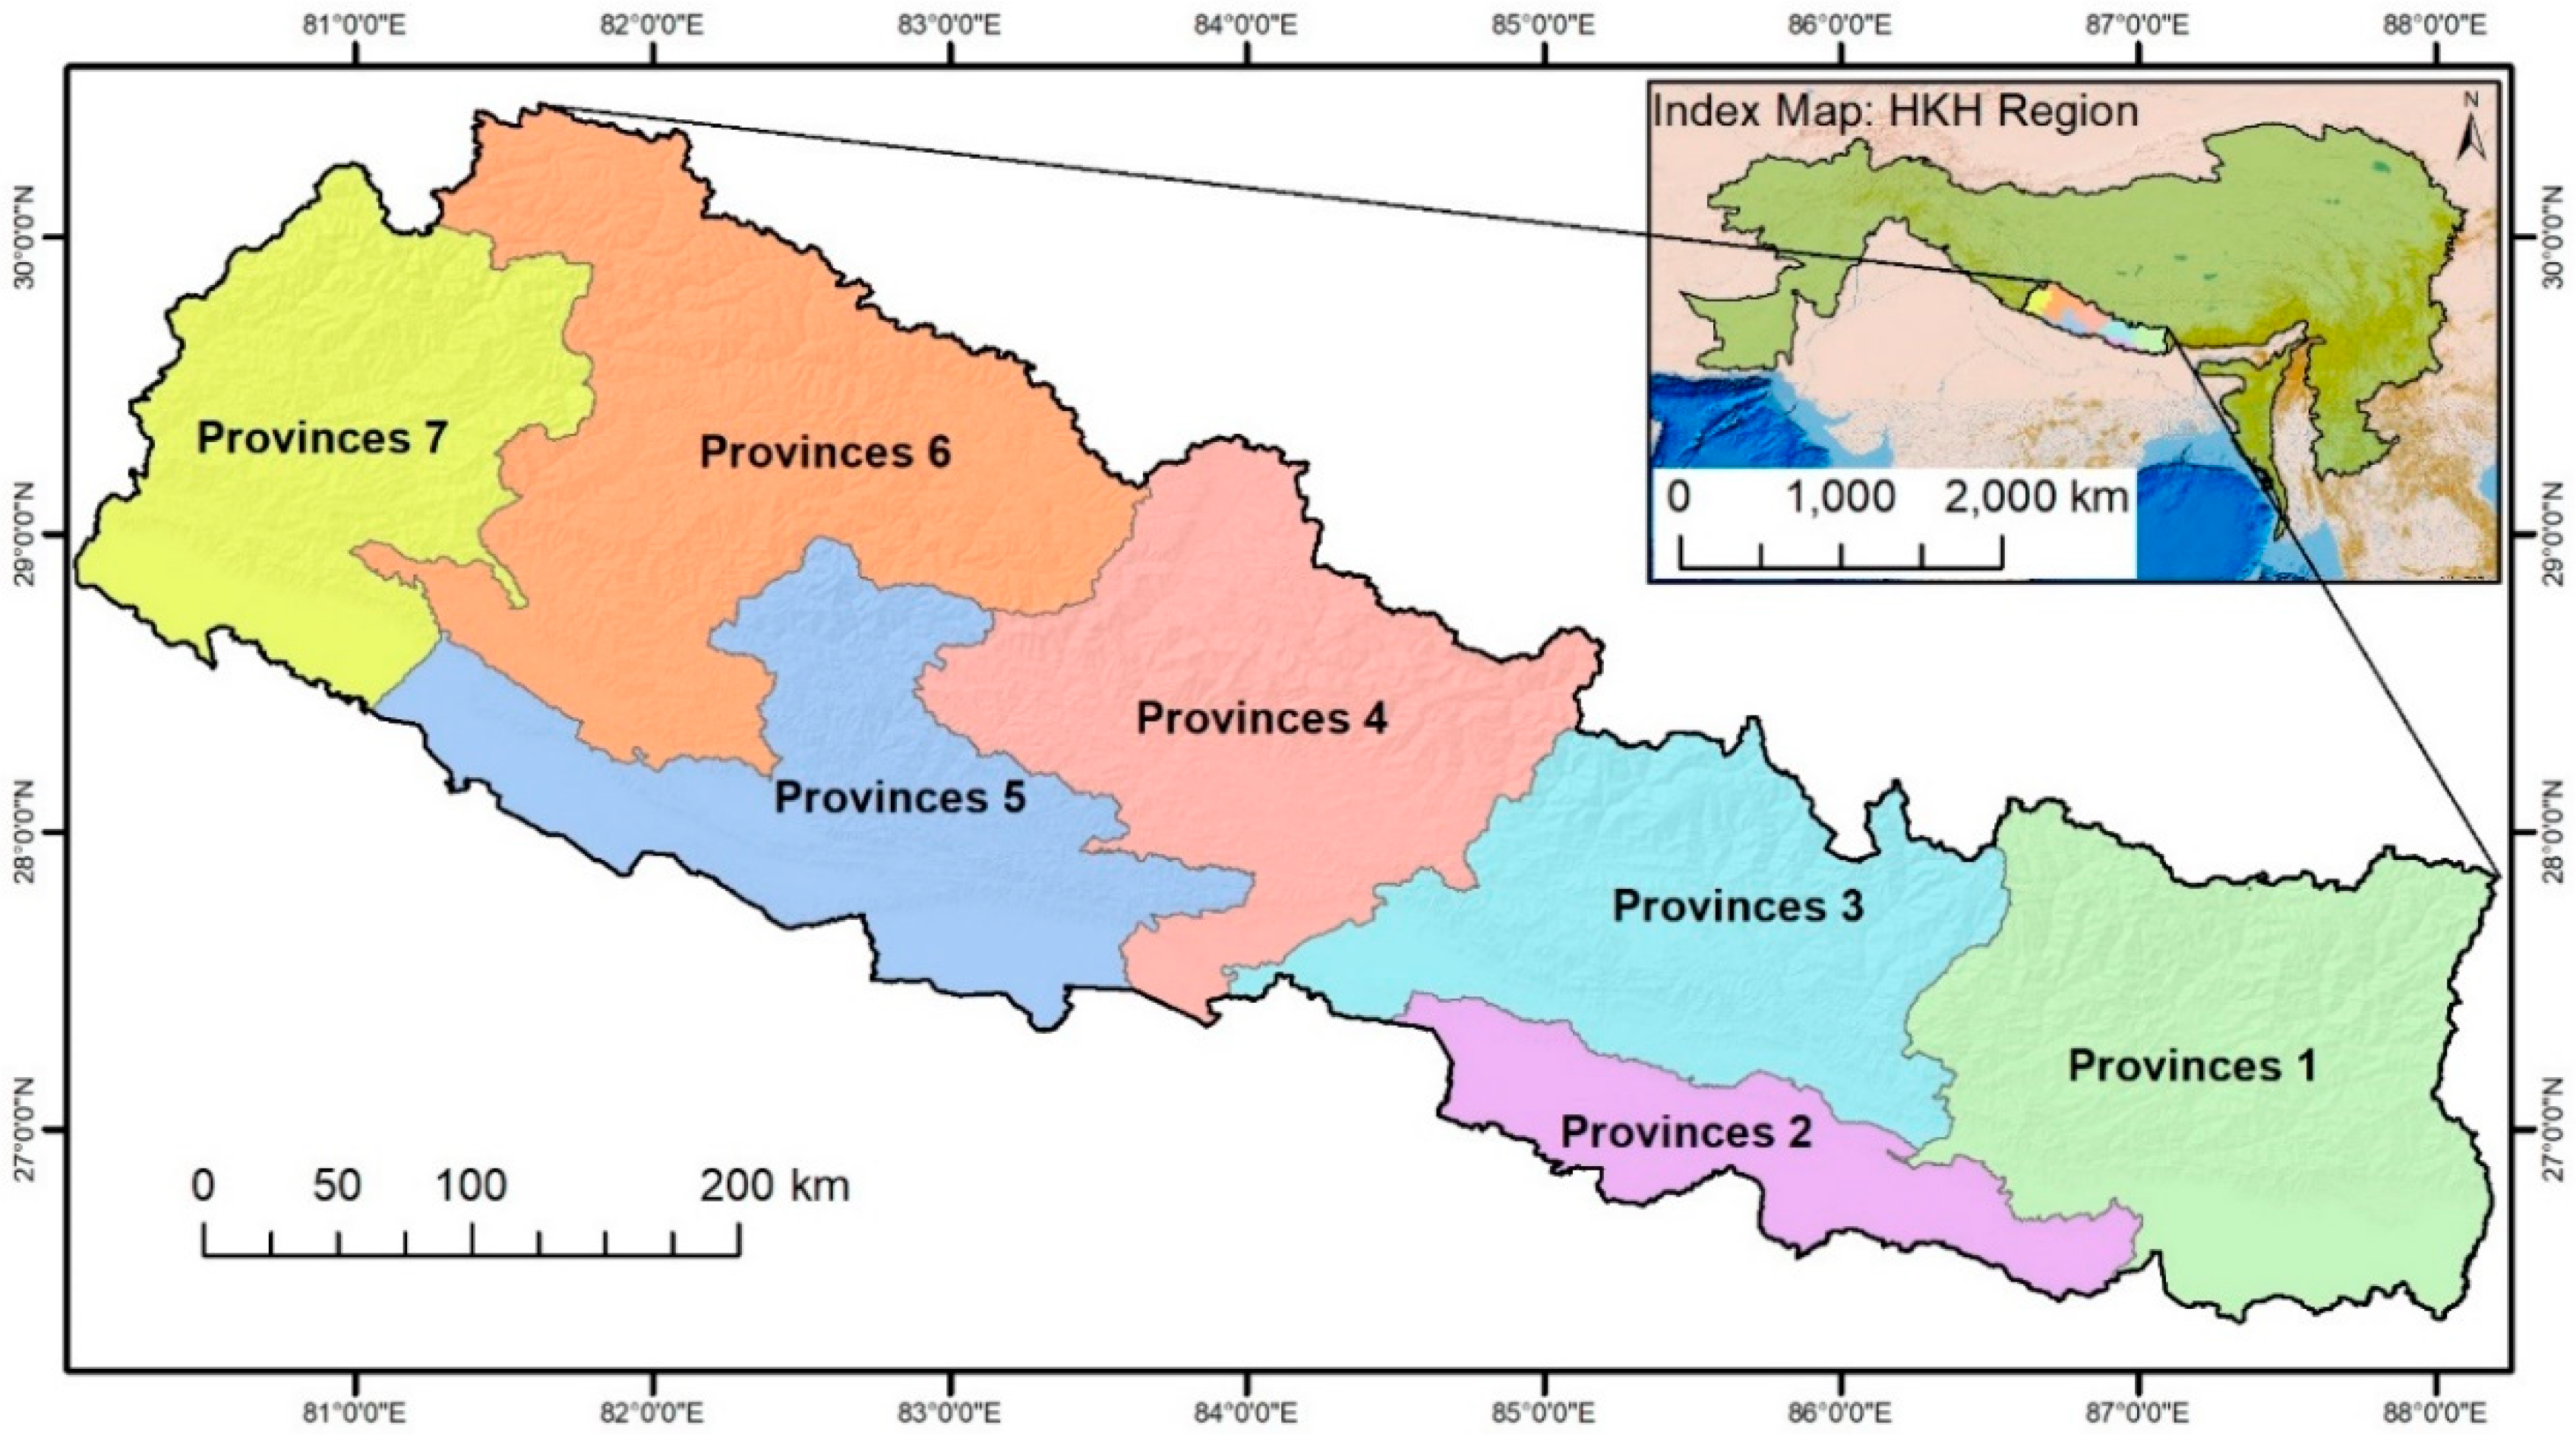
2.1. Study Area

The study area covers all of Nepal (Figure 1), which falls between latitudes, 26°22′ N to 30°27′ N, and longitudes, 80°04′ E to 88°12′ E, sharing borders with China to the north and India to the west, south, and east, with a total land area of 147,181 km2. It is divided into five physiographic regions: High Mountain (34,475 km2), Mountain (28,895 km2), Hill (43,503 km2), Siwalik (18,886 km2) and Terai (21,422 km2). Administratively, Nepal has seven provinces and 77 districts. Elevations range from 60 m from the southern plains to 8848 m at Mt Everest in the north, which is the highest point on the Earth [28]. Nepal encounters subtropical to alpine climates due to the variation of topography and geographical location. Lowest precipitation occurs (160 mm) in the north-western region and highest precipitation (5500 mm) in the central region of Nepal. More than 80% of the of annual precipitation occurs from June to September [29]. According to the Nepal national population and housing census of 2011 (NPHC 2011), the population of Nepal is 26,494,504 people with a 1.35% annual population growth rate [30]. In Nepal, around 66% of the population is directly engaged in small-scale agriculture farming, which provides about 33% of the gross domestic product. Maintenance of soil resources, particularly soil erosion, is critical due to the agriculture practice of grazing on rangeland beyond the carrying capacity and topography [24].

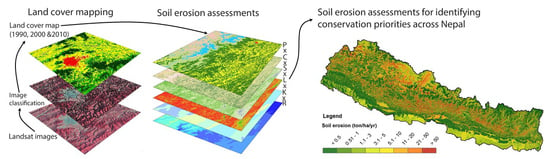
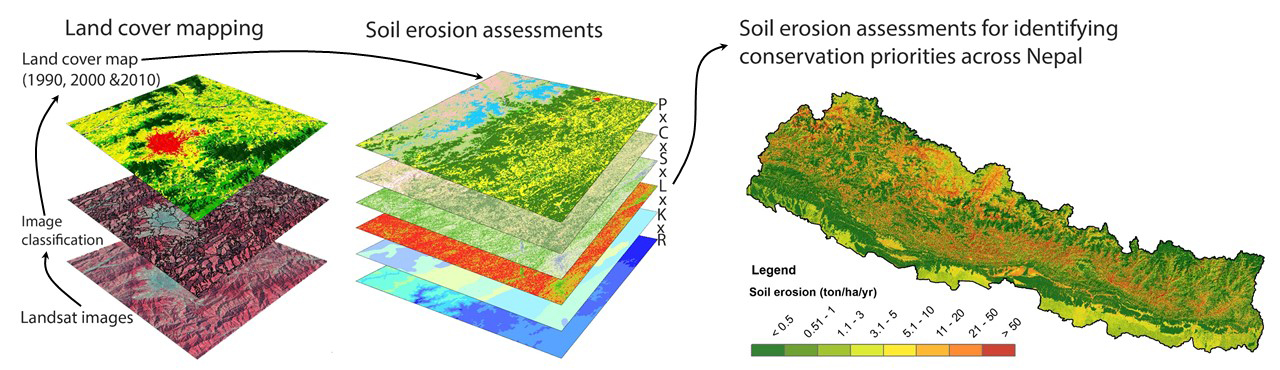
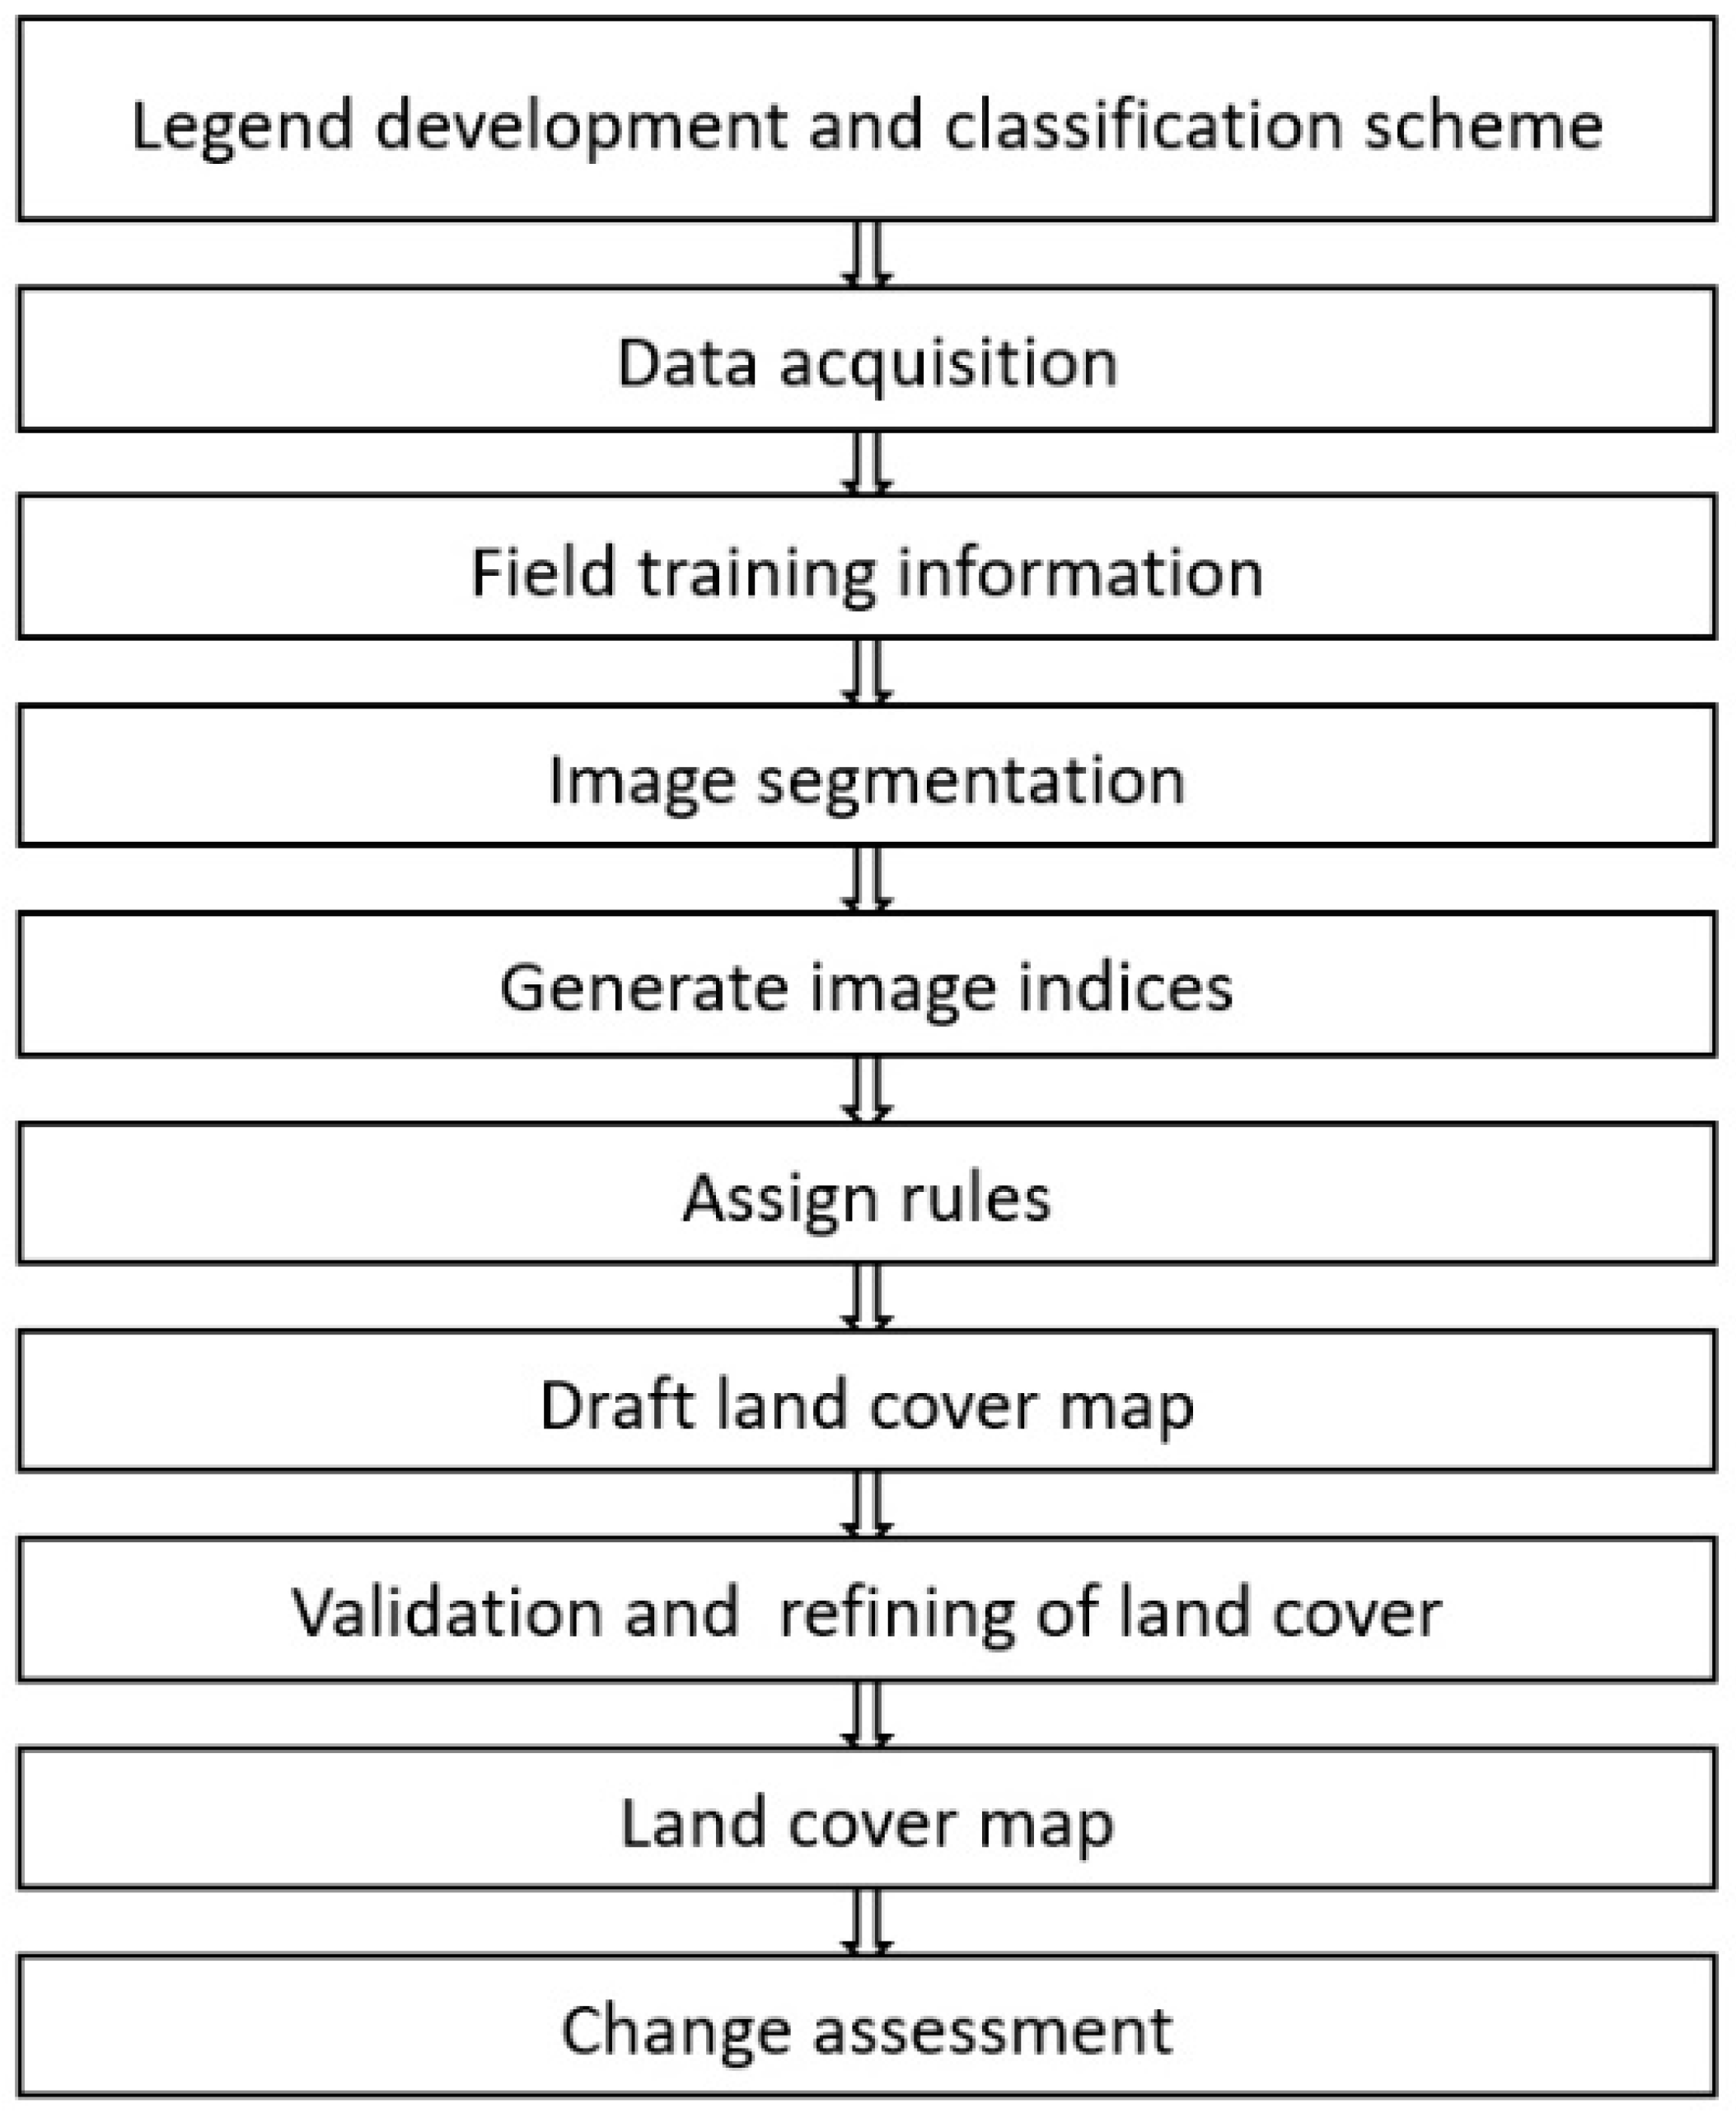
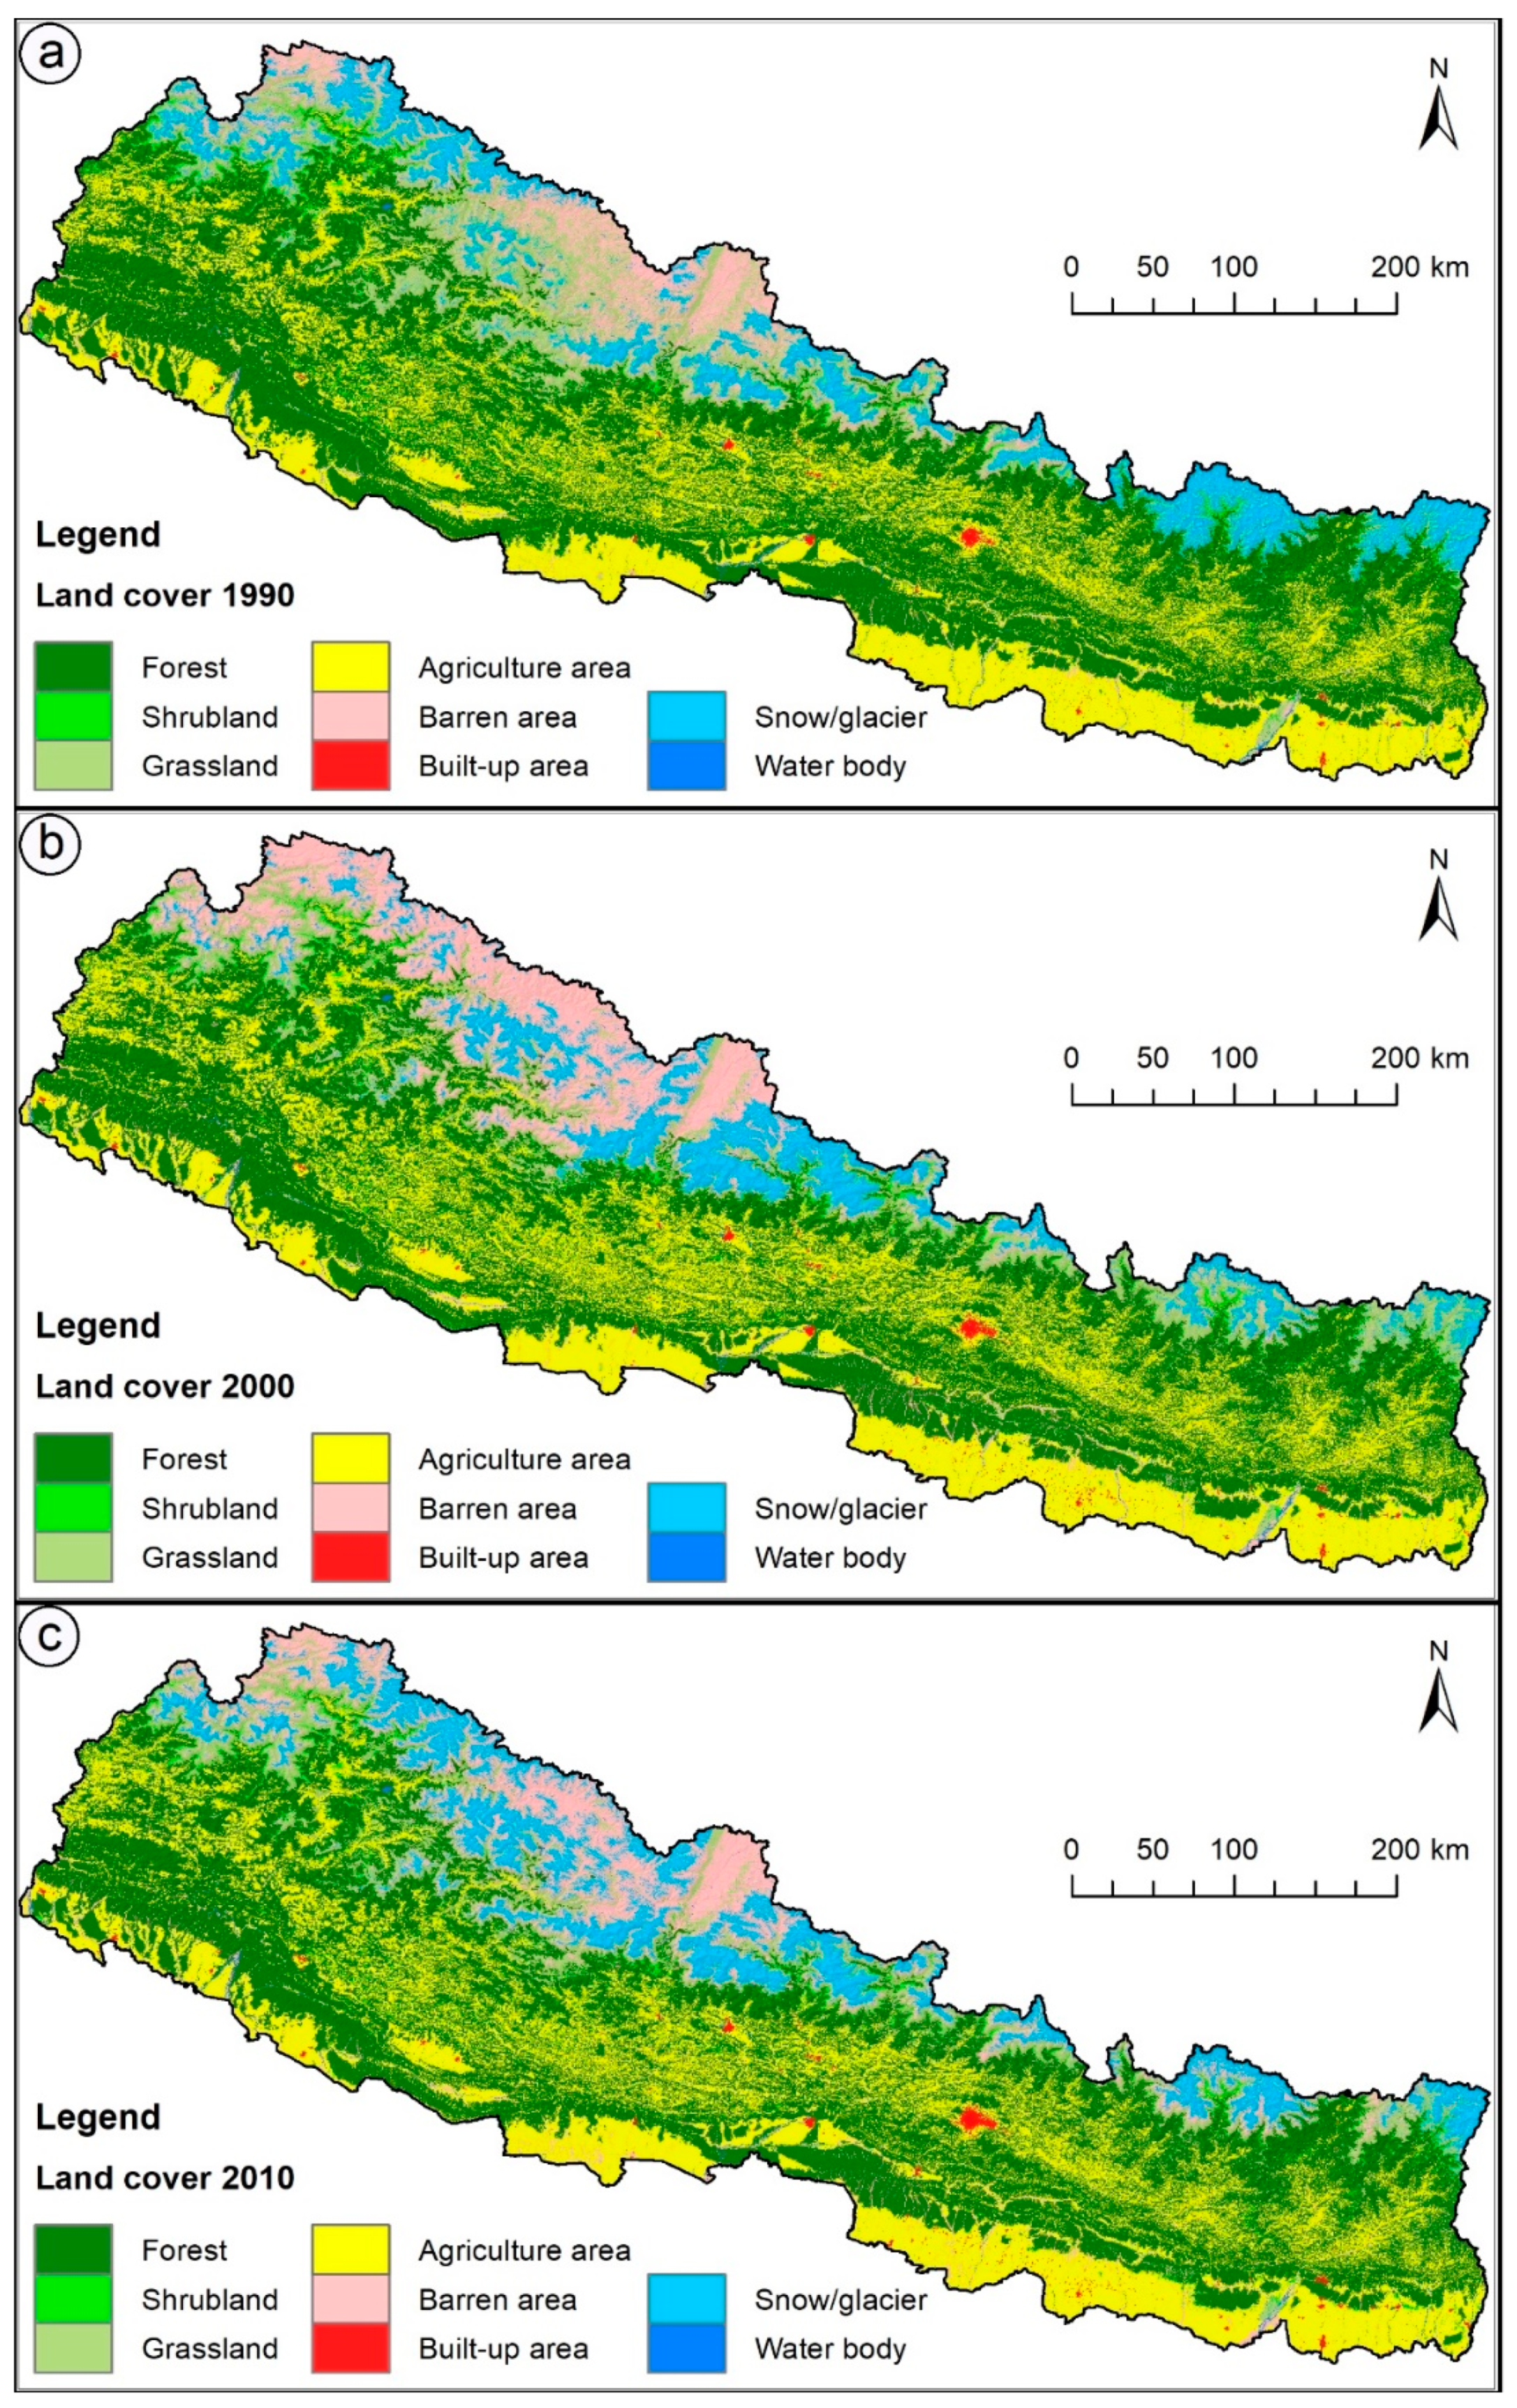
2.2. Assessment of Land Cover

Assessment of Nepal land cover of 1990, 2000, and 2010 was done using the Landsat Surface Reflectance Level-2 data (Figure S1). Thirteen Landsat images covered the whole study area (each scene approximately 185 × 185 km). All Landsat data were downloaded via United States Geological Survey (USGS) data archived portal (https://earthexplorer.usgs.gov). For the estimation of land cover, we adopted an object-based image analysis (OBIA) method, which is widely known as a geographic object-based image analysis (GEOBIA). In recent years, the GEOBIA approach has showed potential to efficiently classify land cover information with a higher accuracy [31,32]. During the image analysis, the non-overlapping image segmentation technique was used to produce meaningful image objects based on the input satellite image information as well as other thematic layers. In the region, GEOBIA was used for the national land cover change assessment of Bhutan [33]. In the case of Nepal, the method was applied for the 2010 land cover study [28]. The same GEOBIA method was later applied to generate land cover for 1990 and 2000. All the land cover data produced through these studies were made available to the public through the International Centre for Integrated Mountain Development (ICIMOD) (http://rds.icimod.org).
The downloaded Landsat images were uploaded in the eCognition Developer 8.1 software for classification (Figure 2). For the segmentation of images, the “multiresolution segmentation” algorithm was used, which consecutively clusters pixels into image objects based on their neighbours, and relative homogeneity criteria [34,35]. During the multiresolution image segmentation in the eCognition developer, image layer weights were used as 1 for the TM and ETM+ band; only for band 6, the weight was used as 0, scale parameter used as 16, Shape as 0.1, the composition of homogeneity creation shape used as 0.1, and compactness used as 0.5. Multiresolution segmentations of image objects assumed that similar features would have a similar kind of spectral responses and that the spectral response of an element would be unique concerning all other aspects of interest. In the multiresolution segmentation process, the homogeneous areas used to combine into larger image objects and the heterogeneous regions into the smaller object or segment [36].
During the classification, information of image layers’ spectral values generated image indices, like the normalized difference snow index (NDSI), normalized difference vegetation index (NDVI), normalized difference water index (NDWI), land water mask (LWM), and bare soil index (BSI), which were created through band ratioing. Image indices were critical to the object based image classification. Image ratioing is a “synthetic image layer” created from the existing bands of a multispectral image [37,38]. The next step is to set rules for these image objects according to their attributes, such as the NDSI, NDVI, NDWI, LWM, and BSI layer value. In this process, the image objects that represent patterns are determined with the help of ground truth information and comparison with high resolution images from Google Earth. Rule sets were developed to generate a land cover map, exploring image band and indices’ mean value by 2d features plot in the ground truth segment. After computing the class separation using the segmentation approach, classification was performed to obtain a land cover map for each scene. Due to the data analysis performance and satellite image resolution, the prepared land use and land cover map and its change might differ significantly from the ground reality. To ensure the confidence and reliability, statistically robust and transparent approaches are critical to ensuring the integrity of land change information [39,40]. After the preparation of land cover maps, the results were validated using available field data and Google Earth images of 2000 and 2010 over randomly selected points. Once the image classification for each scene was finalized, all the scenes were mosaicked to obtain the land cover map of Nepal. After compiling a land cover map for the entire country, the land cover changes were assessed and the individual land cover maps were used for deriving the support practice factors for the erosion risk estimation.

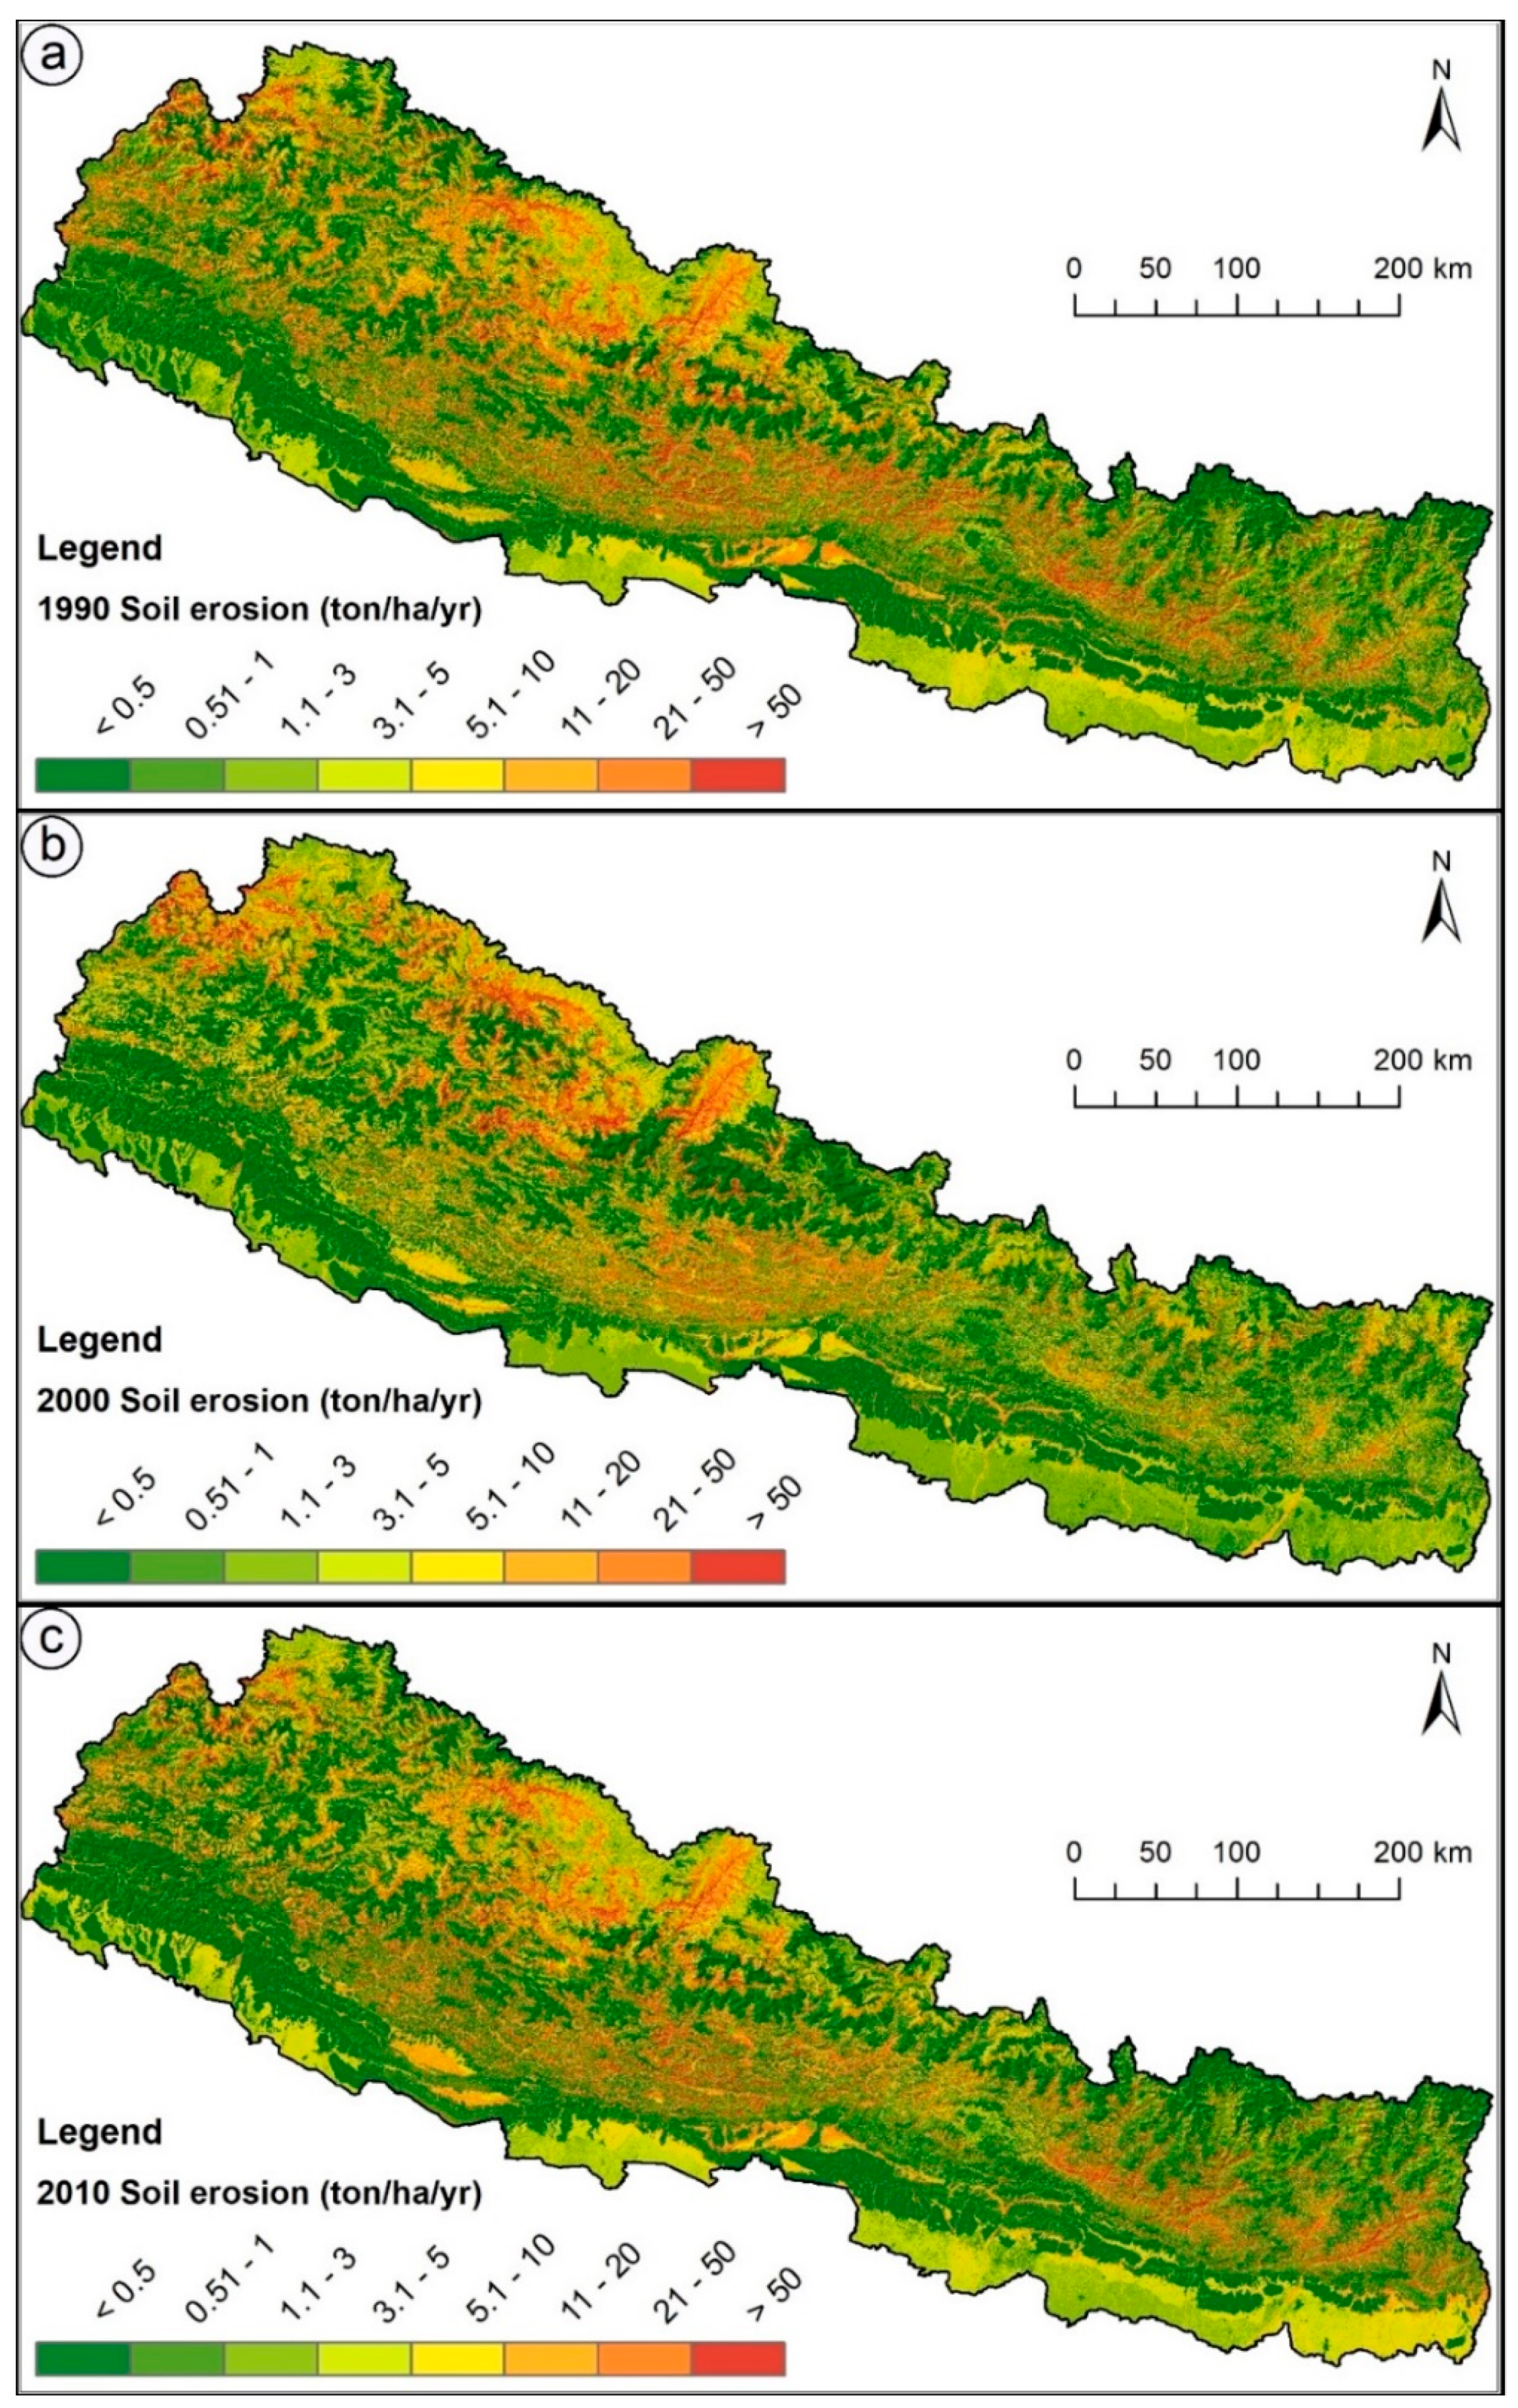
2.3. Estimation of Soil Erosion Areas

The models applied to estimate the soil erosion driven by water and associated sediment yield are categorized into empirical, regression, or and conceptual models. RUSLE is useful to identify the spatial distribution of soil loss for a larger region [3]. Assessing soil erosion through the integration of soil erosion models, field data, and data obtained from remote sensing platforms using geographic information systems (GIS) methods have shown satisfactory results [3,7,17]. The well-known RUSLE equation is presented as [13]:
A = R × K × L × S × C × P
where, A is the soil loss in tons per hectare, R is the rainfall-erosivity index, K represents the soil erodibility index, L represents the slope length, S is the slope steepness factor, C represents the land cover management factor, and P represents the supporting practices factor. The description of input data, data preprocessing, and calculation of each factor are discussed in greater detail below. These factors (RKLSCP) were combined using the RUSLE framework in the ArcGIS model builder environment for the estimation of average soil loss. The overall processing flow is shown in Figure 3.

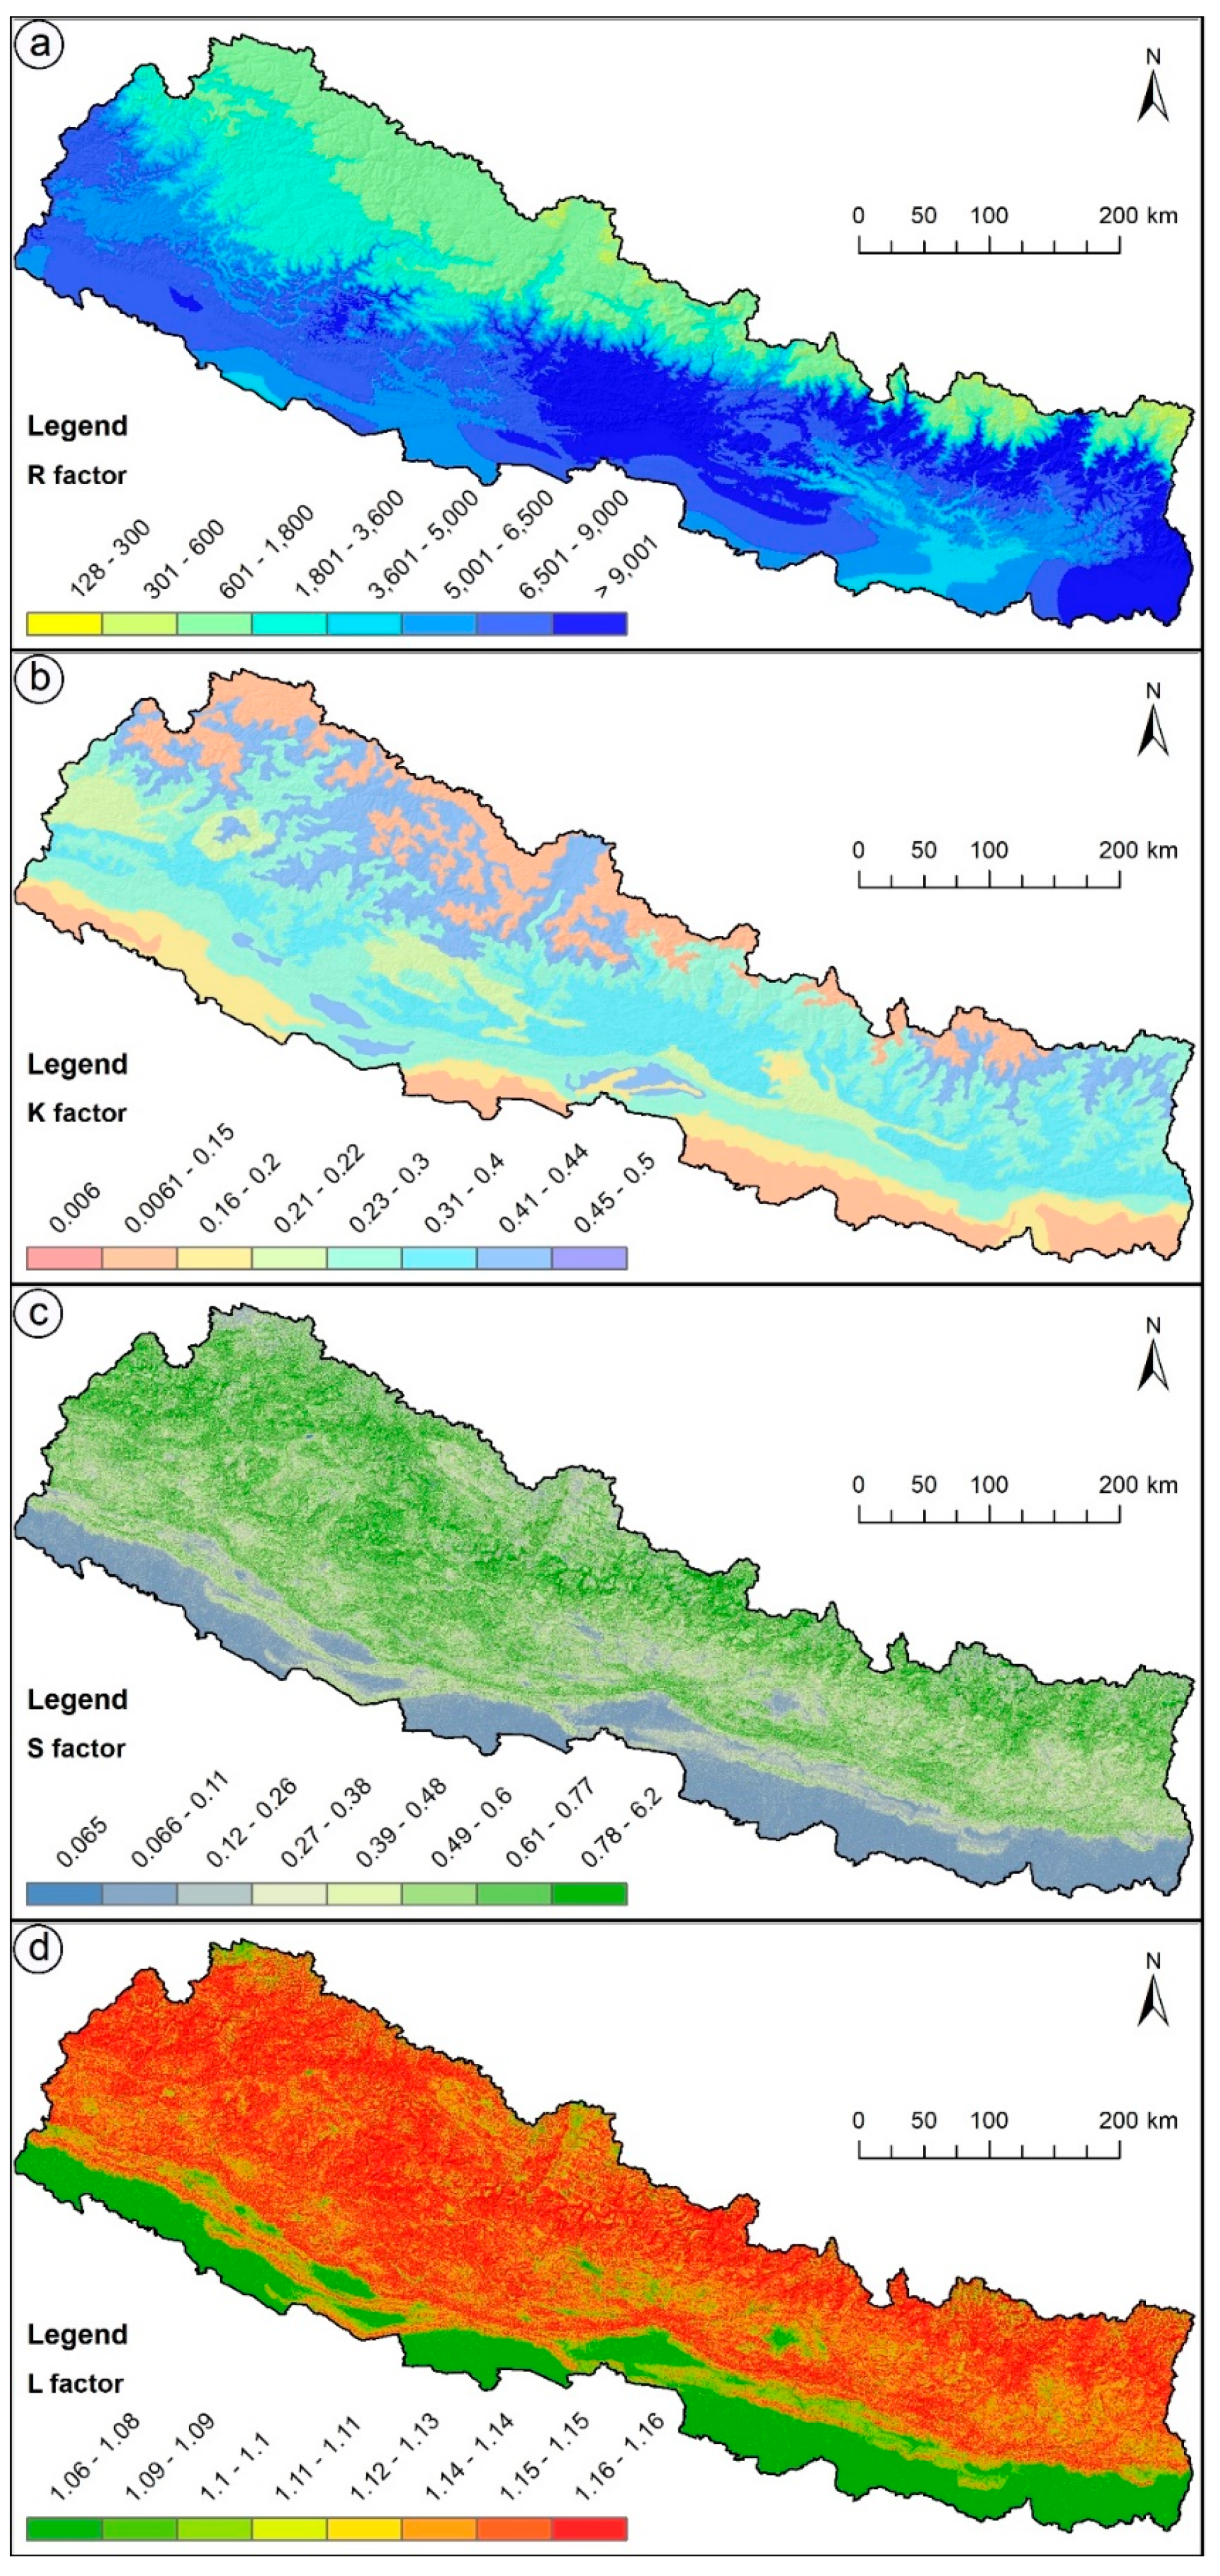
Development of Specific RUSLE Data Layers

The equations used for the calculation of individual factors are given in Table 1. The rainfall erosibity factor, slope length factors, and soil erodibility were estimated using several site-specific equations.

Rainfall Erosivity Factor (R)

The rainfall erosivity factor (R) used to be an important layer for soil loss assessment under future land use and climate change [17,46]. The rainfall erosivity factor shows the ability of rainfall to cause erosion on the earth. Normally, raindrops with higher intensity control the released amount of soil and runoff as sediment. There were not enough records of rainfall intensity in Nepal, and the records of monthly rainfall data were used for the determination of the R-factor using the average annual value. The R-factor was evaluated from world climate precipitation data [47] using the following equation [48]:
R = 0.0483 × P 1.610
where, P = annual precipitation (mm).

Soil Erodibility Factor (K)

One of the mandatory layers for soil erosion study is the soil erodibility factor (K), which is associated with soil types that provide information on the ability of soil release or soil loss in different environmental situations, topographies, and geographic locations. The K factor also measures the susceptibility of a soil surface to erosion due to precipitation and runoff. The K factor is related to crucial soil factors, such as the soil texture, structure, organic matter, and permeability triggered soil loss [49]. The soil erodibility factor (K) is a lumped parameter and quantitative description that represents an integrated annual value of a particular soil. For a particular soil association, the soil erodibility factor is the rate of erosion per unit of the erosion index from a standard plot. In this study, K values are obtained from the published work conducted in and around of Nepal [50,51,52,53,54]. If there was two different researchers who had produced two different K values for the same soil type, we used the mean value of the two values (Figure 4).

Slope-Length Factor (L)

The slope-length factor (L) is defined as the distance from the point of origin of overland flow to another point on the site erosion potential. The slope-length factor is the ratio of field soil loss to the corresponding soil loss of 22.13 m slope length and is estimated as
L = ( λ / 22.13 ) m
where λ is the slope length, and m assumes the value of 0.2 to 0.5. [13] have identified varying values of exponent, m, for different slopes and these are as follows [43,53]. For this purpose, the m map was created, using the slope map as the input (Table 2).
The L value was estimated by using the field slope length calculated from SRTM DEM [42] and is given as follows:
L = [ 90 / 22.13 ] m

Slope-Steepness Factor (S)

Steep slopes and undulating topography provides a critical platform to springing precipitation water into a lower place. The slope-steepness factor (S) represents how fast water can flow on a particular surface interacting with the angle of the ground and affecting the magnitude of soil erosion. The slope factors differ according to the shape and size of the ground; at the same time, soil loss increases more with slope steepness than it does with slope length. It is the ratio of soil loss from the field gradient to that from a 9% slope under otherwise identical conditions. The relation of soil loss to the gradient is influenced by the health and density of vegetative cover and soil particle size. For estimating the S factor [13], the following equation was used:
S = ( 0.43 + 0.30   s + 0.043   s 2 ) / 6.613
where s is the slope in percentage.

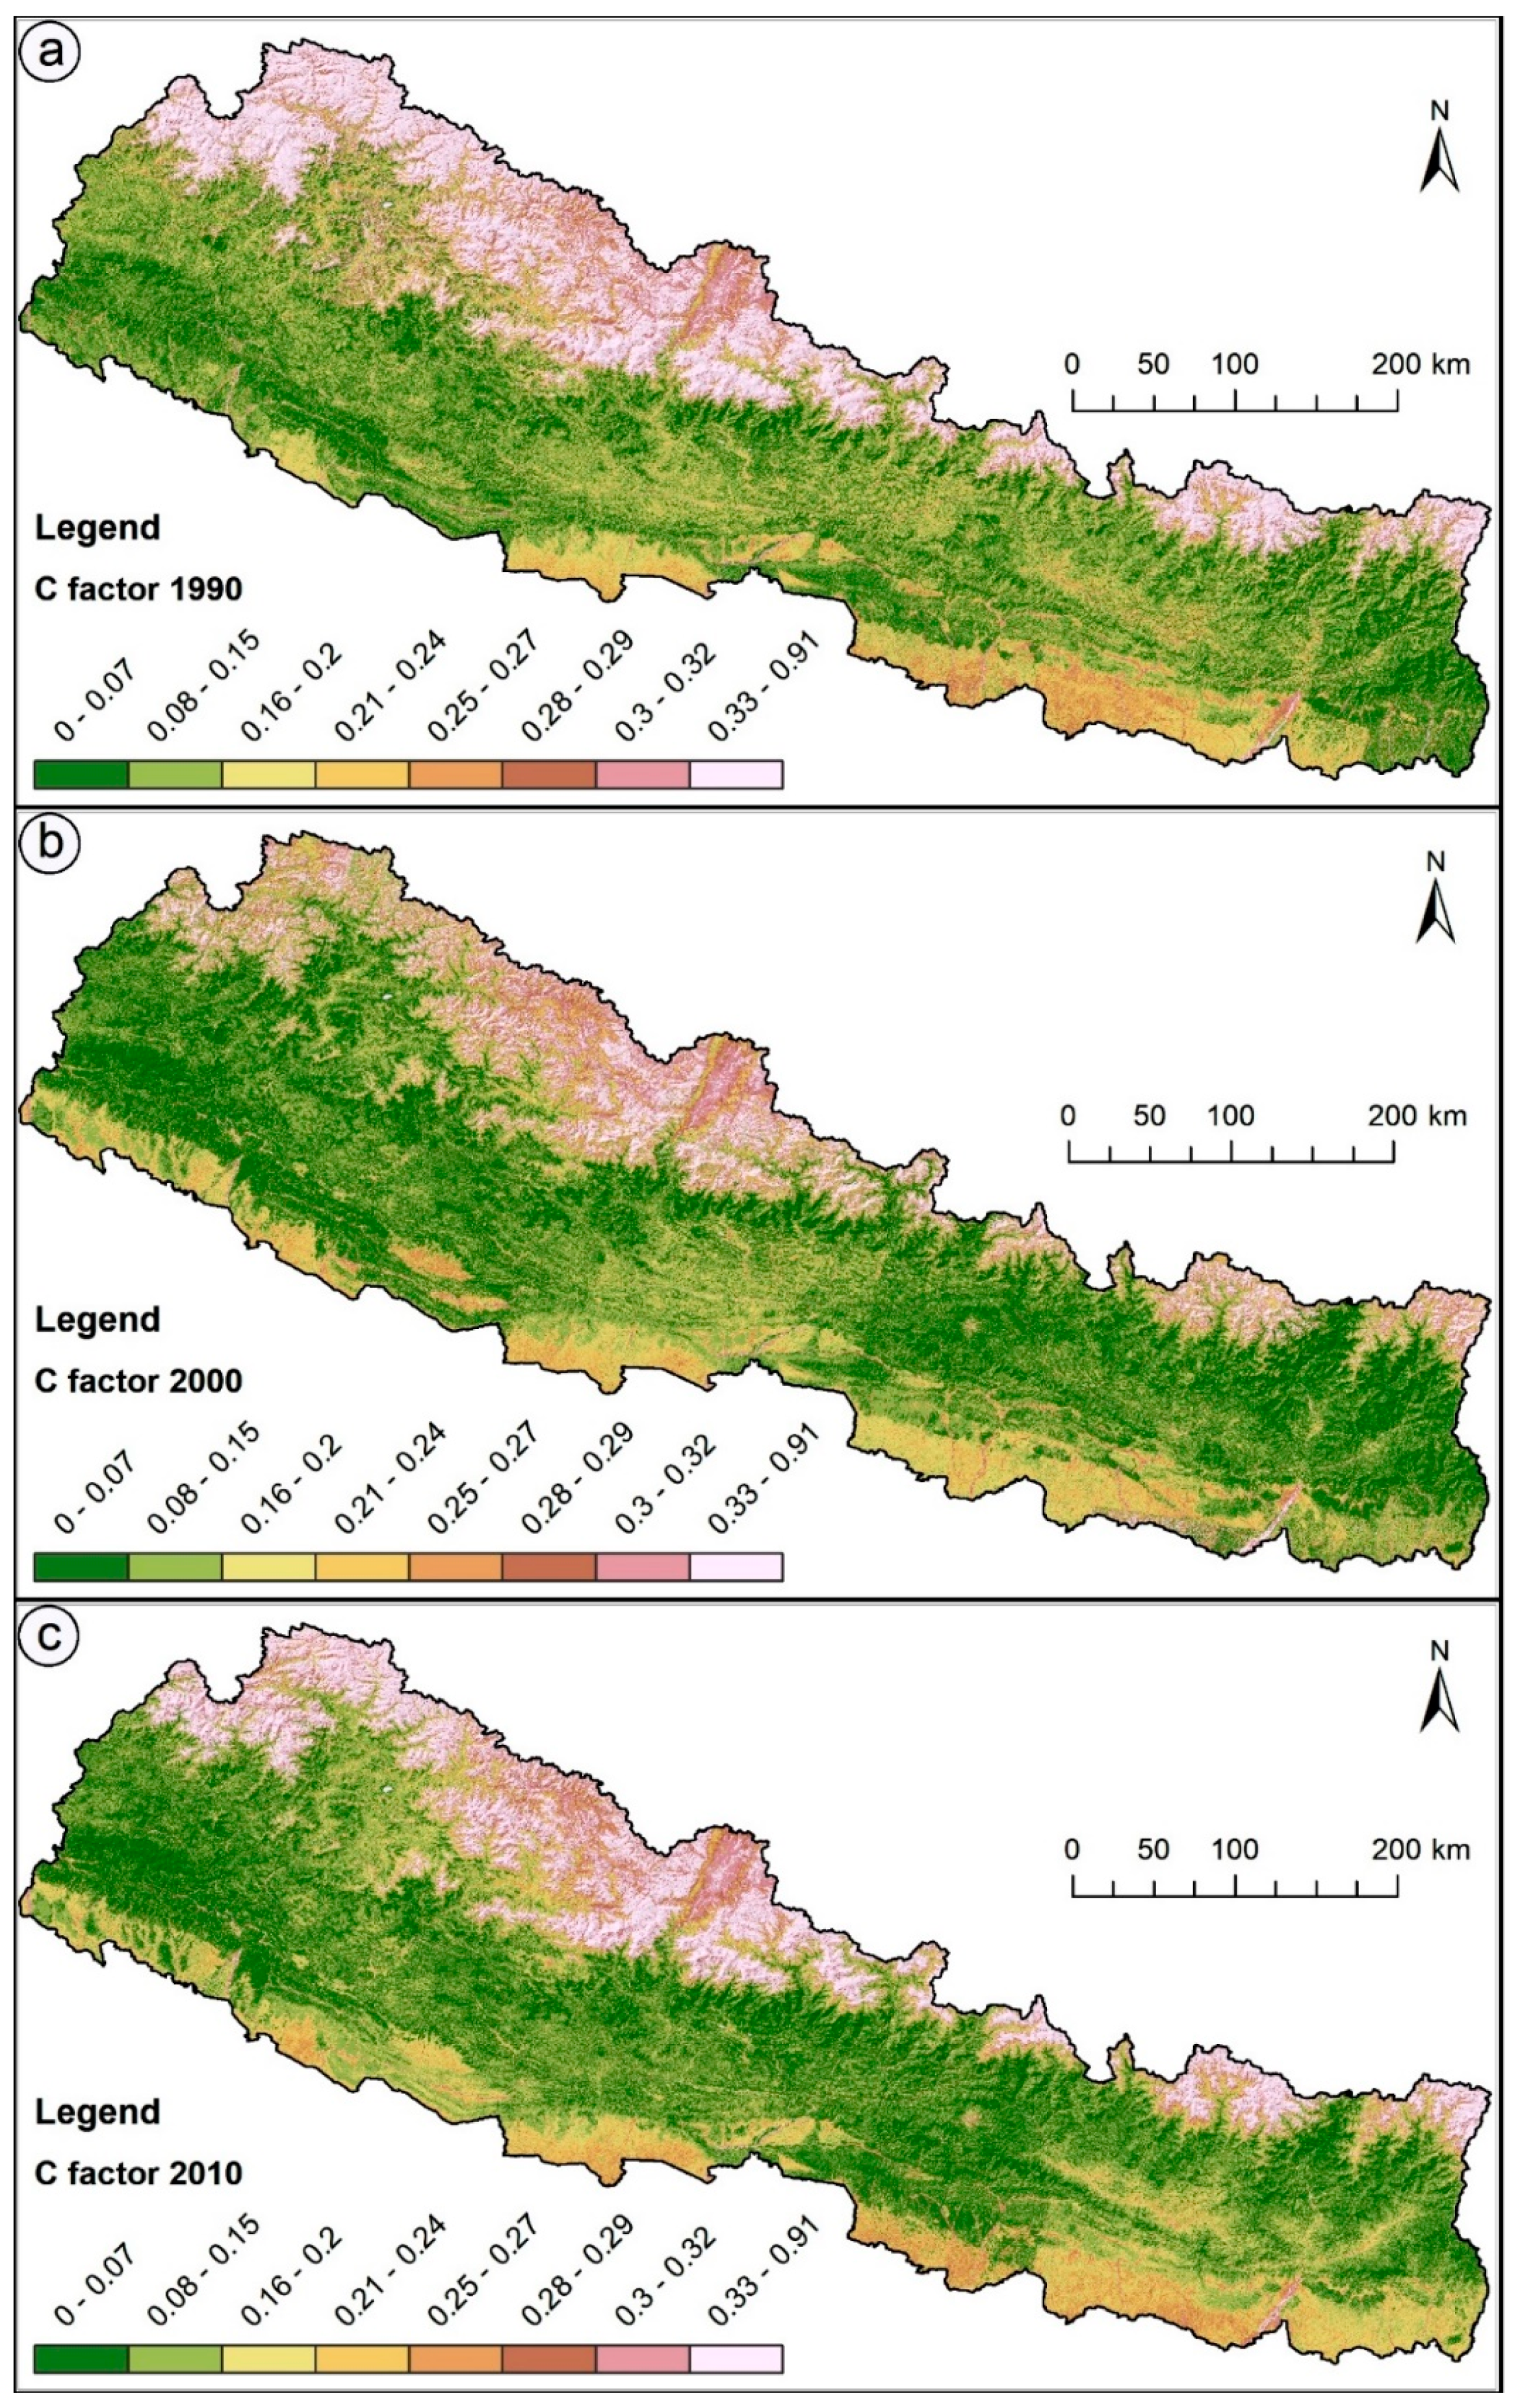
Cover Management Factor (C)

The vegetation cover is the second most crucial factor, and is close to topography that controls soil erosion risk and impacts on erosion [55]. When rainfall drops on the vegetated areas, the vegetation canopy intercepts the rainfall, increases the infiltration, and reduces the rainfall energy. The C factor is usually assigned based on the type and density of vegetation cover. Such an approach results in transforming land cover into discrete weighted data.
Alternatively, De Jong [56] developed the following relationship between field calibrated C factor values with a Landsat satellite-based normalized difference vegetation index (NDVI) to produce a continuous C factor surface:
C = 0.431 0.805 × NDVI
where NDVI = NIR Red NIR + Red .
Annual composite NDVI of 1990, 2000, and 2010 were created from Landsat data in a Google Earth Engine (GEE) environment. Spatial distribution of the cover management factor for 1990, 2000, and 2010 can be seen from Figure 5.

Support Practice Factor (P)

The erosion control practice factor (P) reflects the impact of support practices on the average annual erosion rate, and it also describes the ratio between soil losses on a particular field where the erosion control practice is determined. It is measured as the ratio of soil erosion with a specific support practice to the corresponding loss with ploughing up and the downslope [45,57]. Briefly, the P factor map was prepared utilizing the 1990, 2000, and 2010 land cover map of Nepal (Figure 6), where the erodibility factor for the support practice was assigned based on the mean value of secondary published data for a particular land cover class in the region [48,50,58,59,60]. Within the study area, support practice factor values were between 0.003 and 0.906.

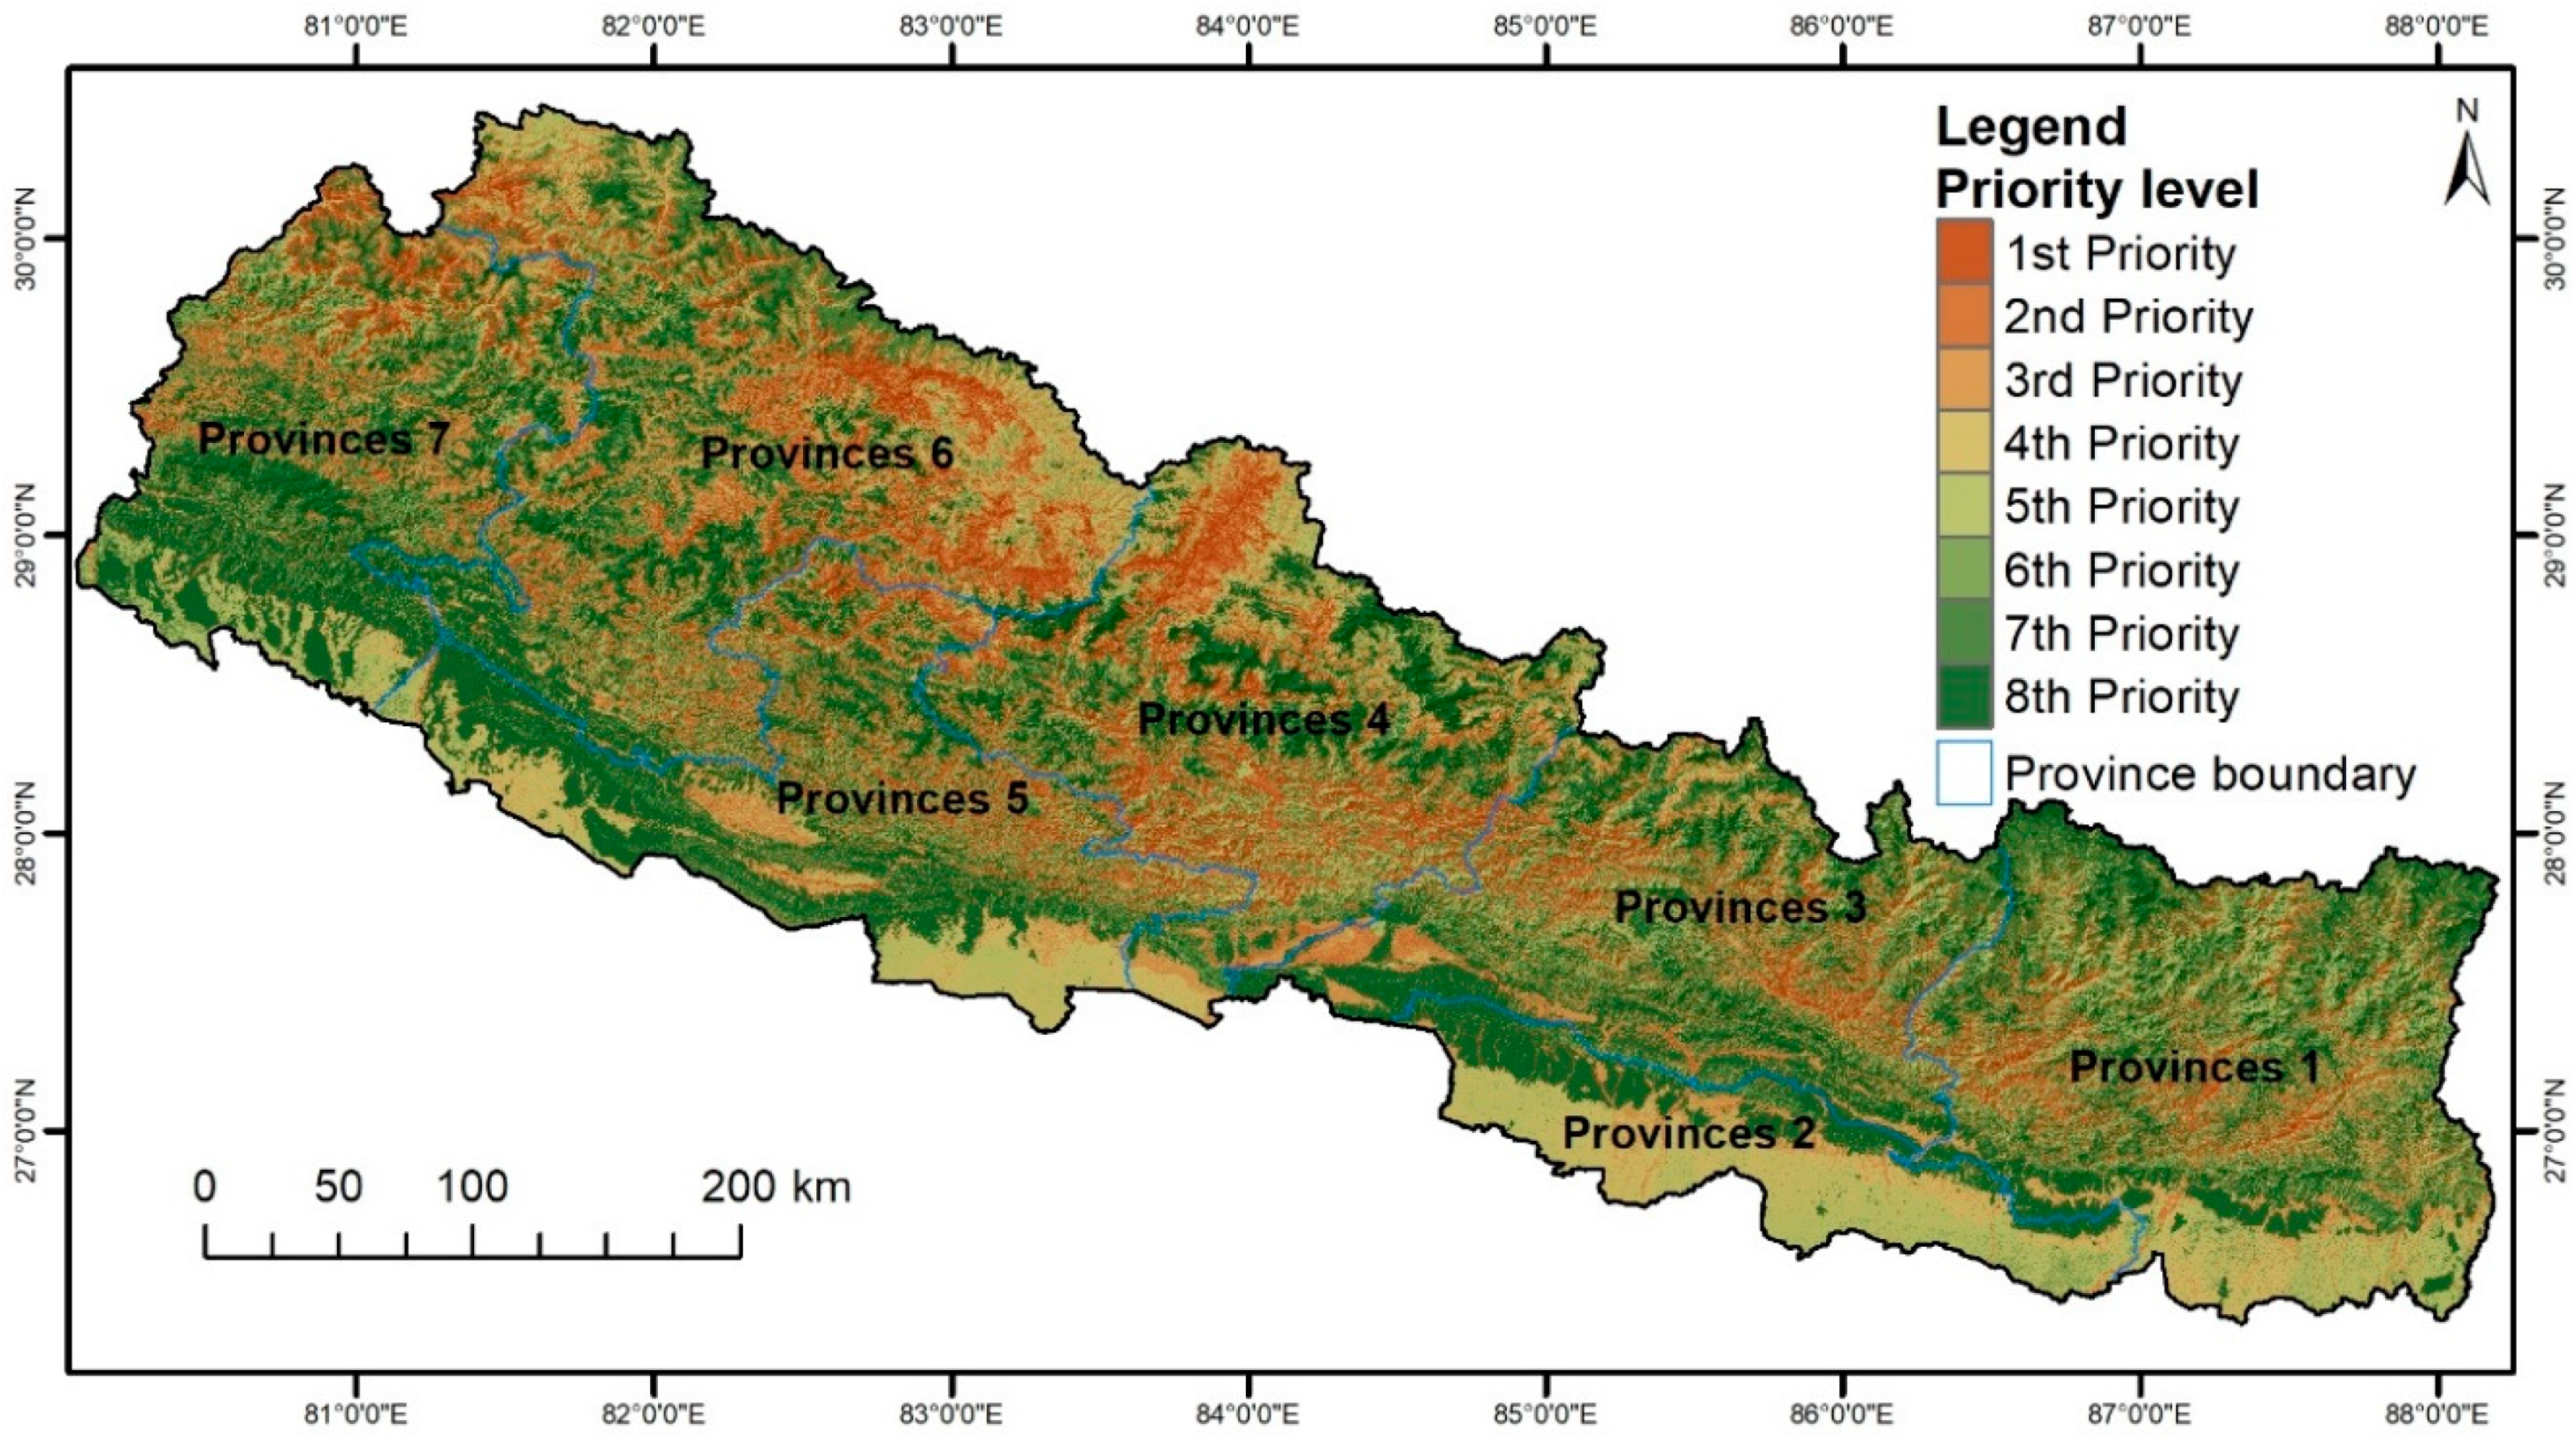
2.4. Determination of Soil Priority Areas

Soil erosion maps for 1990, 2000, and 2010 and trends in the soil erosion maps were generated to support the determination of soil erosion priority areas. During this analysis, we combined and calculated the cross-tabulated soil erosion rate between 1990 to 2000 and 2000 to 2010. The estimated soil erosion rate, and changes in the soil erosion rate were calculated to identify the priority areas for soil erosion management. For the identification of priority areas for controlling erosion, the map of the estimated erosion was divided into eight erosion classes: very low, low, low to medium, medium, medium to high, high, very high, and extremely high erosion severity.

3. Results

Classification results of the preprocessed Landsat images for 1990, 2000, and 2010 are presented in Figure 6 and the statistics for the three different years of land cover with estimated soil erosion rates are shown in Table 3. The results show that forest was the most significant land cover in 1990 with 6,668,336 ha, 6,148,401 ha in 2000, and, in 2010, 6,202,809 ha of the total area of Nepal, followed by agriculture area in 1990 with 3,753,933 ha, 4,096,968 ha in 2000, and 4,039,820 ha 2010. Estimated shrubland cover in 1990 was about 328,142 ha, about 346,930 ha in 2000, and about 342,986 ha in 2010. The results show that there are variations in aspect and slope controlling the vegetation growth in the mountain zone of Nepal [37]. However, altitude and its influence on climatic conditions have much influence in the land cover distribution. Forest cover is mostly distributed in the Terai, Siwalik, and Mahabharata mountain ranges. Agriculture area is primarily distributed in the Terai area, and in and around the Kathmandu Valley, Pokhara Valley, Gandaki River Basin, Koshi River Basin, and Carl River Basin. Shrubland and grassland are mainly found in the high Himalayan region.
From Table 3, it can be concluded that land cover change was more noticeable between 1990 and 2010. The study shows that between 1990 and 2000, forest area declined, but between 2000 and 2010, forest area increased. Considering the total area of Nepal, annual net forest loss was 0.035% between 1990 and 2000, whereas between 2000 and 2010, annual net forest gain was 0.037% (Tables S4–S6). Built-up area has less significant land cover, but steadily increased with 32,916 ha in 1990, 47,499 ha in 2000, and 54,462 ha in 2010. Between 1990 and 2000, the built-up area increased to 14,583 ha and between 2000 and 2010 it increased by 6963 ha.
The analysis by Nepal physiographic regions revealed that forest area dominates in the Hill region, followed by the Middle Mountain region (Tables S4–S6). Out of the total forested area of Nepal, in 1990, the Hill, Middle Mountain, Siwalik, Tarai, and High Mountain physiographic regions contained 38.57%, 30.08%, 21.71%, 6.75%, and 2.89% of the forest area, respectively. Whereas, in 2010, the Hill, Middle Mountain, Siwalik, Tarai, and High Mountain physiographic regions contained 37.88%, 30.43%, 22.21%, 6.65%, and 2.83% of the forest area, respectively. Similarly, out of the total agriculture area, the Hill physiographic region covered the highest proportion (40.79% in 1990 and 42.35% in 2010), whereas the Eastern High Mountain region covers the lowest (0.11% in 1990 and 0.07% in 2010). Physiographic region-wise analysis (Figure S2) showed that the forest area had decreased in the High Mountain region by about 0.10% between 1990 and 2000. On the otherhand, between 2000 and 2010, the forest area increased by about 0.04%. Similarly, in the Hill region, the agriculture area decreased by about 2.72% of the total forest area between 1990 and 2000.
The overall accuracy of the 2000 land cover map, assessed using the 450 reference points, was 86.67%, with a kappa value of 0.82, standard error kappa of 0.0211, 95% confidence interval of 0.78–0.86, and a 0.93 maximum possible un-weighted kappa, given the observed marginal frequencies (Table S1). Similarly, the overall accuracy of the 2010 land cover map, assessed using the 750 reference points, was 85.87%, with a kappa value of 0.80, standard error kappa of 0.018, 95% confidence interval of 0.77–0.84, and a 0.92 maximum possible un-weighted kappa, given the observed marginal frequencies (Table S2).
The years of 1990, 2000, and 2010’s soil erosion risk maps of Nepal were used to identify priority areas for soil erosion control and can be seen in Figure 7. The mean annual soil erosion for Nepal was estimated at 8.76, 6.55, and 7.49 ton/ha/yr accordingly for the year of 1990, 2000, and 2010, respectively. The identified annual erosion was 129.32 million tons in 1990, and 96.68 million tons in 2000 and 110.55 tons in 2010 million tons. The southern and northern parts of Nepal were found to be less soil erodible areas, while the middle part of the study area was found to be highly erodible. The annual soil erosion risk map of Nepal shows the spatial pattern between the different elevation zones.
The very low erosion class was found mainly in the Terai area of Nepal due to the relatively flat terrain. The differences in erosion levels in the middle elevations and the northern and southern parts of the study area are due to the topography. The maximum per hectare average soil loss was estimated in the 4000 m to 5000 m elevation zone, and the minimum was estimated below the 100 m elevation zone. Table S3 shows soil loss according to elevation zones. Table 3 presents the distribution of erosion according to land cover and land use, revealing that agriculture contributes around 50% of the total erosion, followed by barren areas with 20% of the study area. In 1990 and 2010, agriculture land contributed 69,054,803 and 60,071,672 tons to soil loss, respectively.
The erosion class under high to medium, high, very high, and extremely high represent erosion levels of 5–50 ton/ha/yr. Table 4 and Table 5 show the erosion change matrix between 1990, 2000, and 2010. To control erosion in these high, very high, and extremely high erosion zones, high priority is required to be given to soil erosion conservation. Identified priority areas of Nepal for soil erosion control can be found in Figure 8. Based on the risk, the highest priority districts for soil conversation are identified as Gulmi, Parbat, Syangja, and Tanahu and the second highest priority districts are identified as Nuwakot and Ramechhap. The third highest priority districts are Dolpa and Mustang (Table S7). Conservation measures, such as creating plant communities that are environmentally favourable, bioengineering during construction of infrastructure, cultivation on steep slopes, and controlling overgrazing, could help to decrease the erosion severity in this zone.

4. Discussion

Considering land cover as a critical factor for the environmental and erosion study of Nepal, the present study provides findings and its analysis of land cover changes from 1990 to 2000 to 2010 using Landsat images of a 30m spatial resolution with a consistent methodology and standardized legend. The main worth of Nepal land cover change lies in its ability to provide complete, coherent, and harmonized national land cover maps. Land cover maps serve as a resource for regional to national scale applications. Although, national level land cover assessments were done during 1963 and 1988 as part of a forest resources’ survey using aerial photography and land resource mapping project using satellite data [61,62,63]. In the past, most of the study has engaged in the manual digitization process. There are various merits and demerits for thematic maps’ preparation using digitization. Most of the cases of manual digitization introduce error into the database, and the amount of error is often left unmeasured [64,65]. In this study, we applied state-of-the-art image segmentation, an emerging paradigm of land cover mapping, using object-based image analysis to produce high-quality land cover data for Nepal [66,67]. Recently, Uddin, Shrestha, Murthy, Bajracharya, Shrestha, Gilani, Pradhan, and Dangol [28] have developed the 2010 national land cover database with 12 land cover classes for Nepal using Landsat images. Similar year land cover maps for 2010/11 were prepared using RapidEye satellite images for forest resources’ assessment [63,68]. Since then, there have been no national-level decadal land cover change assessments carried out for Nepal. Although national land cover data is very much essential for the national reporting to the United Nations Framework Convention on Climate Change (UNFCCC) for forest reference level (FRL), assessing forest carbon fluxes as per the good practice guidelines of IPCC, developing national biodiversity conservation strategies, and evolving national level REDD mechanisms and sustainable land management [28,69] is also important.
With the limitation of the availability of field-based measurements, we have attempted to adopt the RUSLE model to bring out national level erosion estimates of Nepal [70]. The estimated erosion rate for different land cover classes was evaluated with published field based erosion measurements and model-based results mostly in the mid and high hills of Nepal (Tables S8–S10). Due to deep shadows of high mountain ranges, land use dynamics, and a high degree of spatial variability of rainfall, a lot of earlier studies focused significantly on erosion assessment concerning the middle mountains of Nepal’s Himalayas [50,51,53]. Studies addressing national level erosion assessment and understanding its spatial trend and its relation to land use practices and rainfall regimes are lacking. Also, there is no consistent protocol-based field measurements that exist over the country to provide an understanding of the erosion levels and associated factors. It can be found that the estimates were within the ranges of the published studies [23,71,72]. However, it should be mentioned here that there is heterogeneity in rainfall, topography, soil and cultural practices, causing the high range of variation in erosion levels in the assessment at different sites. Therefore, one to one comparison of estimates over a set of sites is essential. However, it was not possible make a comparison over a set of sites to bring out error and bias of the estimates as very few studies were reported in Nepal. Given this, it could be mentioned that the estimates are semi-quantitative and reliable on relative terms. These spatial estimates would be useful to assess the spatial variability of erosion and prioritizing areas of conservation.
Land cover is the physical materials of the earth surface, which anchors all life on Earth. Many studies have revealed that the soil erosion rate is triggered by change in land-use and land cover [7,73]. Deforestation in natural forested areas, which anchor the soil with their roots, is a direct cause of erosion. Increased demand for agriculture commodities generates incentives to convert forests and grasslands to cropland. The transition to farmland from healthy natural vegetation often reduce the holding capacity of the soil. In our analysis, the mean soil erosion rate was decreased from 8.76 t/ha/yr in 1990 to 7.49 t/ha/yr in 2010. The main reason for the changes in soil erosion between the land cover types is due to the changes in the land cover, which were reflected in the greenness of NDVI, and changing the C factor values, which affected the soil erosion strongly. The results could be interpreted as a change in land use practice due to the internal migration [74,75]. The main reason for this decline is the progressive decrease of the agricultural areas; a large percent of the cultivated area changed to uncultivated areas in the study area as well as the community forestry [76,77].
The rainfall and slope length factor (LS) and soil were the major drivers of erosion in the RUSLE equation. The rainfall erosion potential is mainly controlled through the product of total storm energy and maximum 30-min storm intensity. In the absence of detailed rainfall data at the sub-hourly interval and also the lack of Nepal specific equations on the rainfall erosion factor, we adopted available annual rainfall based equations that are suitable for hilly areas. Concerning quantification of the slope length factor, there are several equations to estimate the slope length factor in the GIS domain using the digital elevation model. Most of these equations in our study found a yielding overestimation of erosion and the best among them, which provides estimates in tune with the published literature, was chosen. Hence, the LS factor is the most important variable, which requires calibration over the study area to address reliable quantitative estimates.
The soil erodibility factor was weighted at the soil order level using published literature [3,17,22,23]. In the case of the availability of soil texture and organic carbon information, the erodability factor can be better estimated. The crop management factor and support practice factors are found to be more site specific and broadly match with the generic properties of the sites. Any improvements to be made on weightage to be given for these parameters require intensive local specific ground observations. RMF and MF models are said to yield better estimates over hilly terrains. These models require extensive ground driven data and calibration. Therefore, a holistic discussion on the level of accuracy requirements of erosion levels should be made to plan for appropriate model and ground measurements.
The study disclosed different estimations of land cover and erosion statistics. In the quest for producing better quality land cover and soil erosion data sets, it is essential that the study focused on putting feet’s utilization of the modern image analysis technique with a sufficient training sample and comparing this with high-resolution Google earth images. In the mountain area, the yawning shadow is a challenge to extracting land cover information, although several tools are available for shadow removal. For a national land cover reporting time, country boundaries, and its projection, raster and vector file overlapping issues might produce little different figures.

5. Conclusions

This study provided baseline information as well as information about the changes in land cover over the past two decades (1990, 2000, and 2010). Some applications and analyses can be executed on these three land cover layers for environmental management in Nepal. The land cover map might support specific national and international reporting, such as greenhouse gas inventories and environmental-economic accounting. In addition, an easily adaptable RUSLE based method was developed for assessing erosion risk in Nepal. Indeed, a qualitative assessment method is the best alternative to field-based, time consuming soil erosion assessments. Assessed spatial erosion zones comprise the necessary information for the planning of successful and sustainable management practices. The analyzed land cover and soil loss dynamics may support decision-makers and planners to take relevant forest and soil conservation priority steps and thereby reduce the soil loss and land degradation issue of Nepal.

Supplementary Materials

The following are available online at https://www.mdpi.com/2071-1050/10/12/4715/s1.

Author Contributions

K.U. and M.A.M. conceptualized overall research design; K.U. and S.M. performed image analysis and prepared the land cover maps and performed their accuracy assessment and change assessment; K.U. conducted soil erosion study with the technical support of M.A.M.; K.U. drafted the first version of manuscript; all the authors read, edited, critiqued the manuscript and approved the final version.

Acknowledgments

We would like to express our sincere gratitude to David Molden and Eklabya Sharma from ICIMOD for their overall guidance. This land cover and soil erosion study was partially supported by core funds of ICIMOD contributed by the governments of Afghanistan, Australia, Austria, Bangladesh, Bhutan, China, India, Myanmar, Nepal, Norway, Pakistan, Switzerland, and the United Kingdom. This paper has been prepared under SERVIR-Himalaya initiative funded by the NASA and USAID. Thanks are due to SERVIR team members at the Coordination Office for their pleasant cooperation. Our special gratitude goes to Birendra Bajracharya of ICIMOD for his continuous encouragement and support for bringing out this work. We also thank the Geospatial Solutions (GS) Theme professional for their assistance during the land cover mapping. Finally, we would like to thank who reviewed articles comprehensibly and provided valuable suggestions to improve the manuscript.

Conflicts of Interest

The authors declare no conflict of interest. The views and interpretations in this publication are those of the authors. They are not necessarily attributable to ICIMOD and do not imply the expression of any opinion by ICIMOD concerning the legal status of any country, territory, city or area of its authority, or concerning the delimitation of its frontiers or boundaries, or the endorsement of any product.

References

  1. Kidane, D.; Alemu, B. The effect of upstream land use practices on soil erosion and sedimentation in the Upper Blue Nile Basin, Ethiopia. Res. J. Agric. Environ. Manag. 2015, 4, 55–68. [Google Scholar]
  2. Sharma, A.; Tiwari, K.N.; Bhadoria, P. Effect of land use land cover change on soil erosion potential in an agricultural watershed. Environ. Monit. Assess. 2011, 173, 789–801. [Google Scholar] [CrossRef] [PubMed]
  3. Ganasri, B.; Ramesh, H. Assessment of soil erosion by RUSLE model using remote sensing and GIS-A case study of Nethravathi Basin. Geosci. Front. 2016, 7, 953–961. [Google Scholar] [CrossRef]
  4. Bahadur, K.K. Mapping soil erosion susceptibility using remote sensing and GIS: A case of the Upper Nam Wa Watershed, Nan Province, Thailand. Environ. Geol. 2009, 57, 695–705. [Google Scholar] [CrossRef]
  5. Rawat, K.S.; Mishra, A.K.; Bhattacharyya, R. Soil erosion risk assessment and spatial mapping using LANDSAT-7 ETM+, RUSLE, and GIS—A case study. Arab. J. Geosci. 2016, 9, 288. [Google Scholar] [CrossRef]
  6. DSCWM. Land Degradation Problems. Available online: http://www.dscwm.gov.np/index.php/land-degradation-problems (accessed on 5 January 2017).
  7. Alkharabsheh, M.M.; Alexandridis, T.; Bilas, G.; Misopolinos, N.; Silleos, N. Impact of land cover change on soil erosion hazard in northern Jordan using remote sensing and GIS. Procedia Environ. Sci. 2013, 19, 912–921. [Google Scholar] [CrossRef]
  8. Ives, J.D.; Messerli, B. The Himalayan Dilemma: Reconciling Development and Conservation; Routledge: Abingdon, UK, 1989. [Google Scholar]
  9. Tadesse, L.; Suryabhagavan, K.; Sridhar, G.; Legesse, G. Land use and land cover changes and Soil erosion in Yezat Watershed, North Western Ethiopia. Int. Soil Water Conserv. Res. 2017, 5, 85–94. [Google Scholar] [CrossRef]
  10. Abidin, R.Z.; Hassan, Z.A. ‘ROM’ Scale for Forecasting Erosion Induced Landslide Risk on Hilly Terrain. In Landslides; Springer: Berlin, Germany, 2005; pp. 197–202. [Google Scholar]
  11. Khosrokhani, M.; Pradhan, B. Spatio-temporal assessment of soil erosion at Kuala Lumpur metropolitan city using remote sensing data and GIS. Geomat. Nat. Hazards Risk 2014, 5, 252–270. [Google Scholar] [CrossRef]
  12. IPCC. Climate change 2007: The physical science basis. Agenda 2007, 6, 333. [Google Scholar]
  13. Wischmeier, W.H.; Smith, D.D. Predicting Rainfall Erosion Losses: A Guide to Conservation Planning; Science and Education Administration: Washington, DC, USA, 1978; p. 58. [Google Scholar]
  14. Renard, K.G.; Foster, G.R.; Weesies, G.A.; Porter, J.P. RUSLE: Revised universal soil loss equation. J. Soil Water Conserv. 1991, 46, 30–33. [Google Scholar]
  15. Perovic, V.; Zivotic, L.; Kadovic, R.; Dordevic, A.; Jaramaz, D.; Mrvic, V.; Todorovic, M. Spatial modelling of soil erosion potential in a mountainous watershed of South-Eastern Serbia. Environ. Earth Sci. 2013, 68, 115–128. [Google Scholar] [CrossRef]
  16. Shinde, V.; Tiwari, K.; Singh, M. Prioritization of micro watersheds on the basis of soil erosion hazard using remote sensing and geographic information system. Int. J. Water Resour. Environ. Eng. 2010, 5, 130–136. [Google Scholar]
  17. Uddin, K.; Murthy, M.; Wahid, S.M.; Matin, M.A. Estimation of soil erosion dynamics in the Koshi basin using GIS and remote sensing to assess priority areas for conservation. PLoS ONE 2016, 11, e0150494. [Google Scholar] [CrossRef]
  18. Uddin, K.; Dhakal, M.; Joshi, G. An Optical High and Medium Spatial Resolution Approach for Erosion-Prone Areas Assessment in Mustang, Nepal. Int. J. Geosci. 2014, 2014, 383–393. [Google Scholar] [CrossRef]
  19. Sah, B. Watershed Degradation and Its Socio-Economic Impacts Using RS and GIS: A Case Study of Trijuga Watershed, Nepal; NR 96–20. Master’s Thesis, Asian Institute of Technology, Bangkok, Thailand, 1996. [Google Scholar]
  20. Pandey, A.; Mishra, S.; Gautam, A.K.; Kumar, D. Soil erosion assessment of a Himalayan river basin using TRMM data. Proc. Int. Assoc. Hydrol. Sci. 2015, 366, 200. [Google Scholar] [CrossRef]
  21. Morgan, R.; Morgan, D.; Finney, H. A predictive model for the assessment of soil erosion risk. J. Agric. Eng. Res. 1984, 30, 245–253. [Google Scholar] [CrossRef]
  22. Shrestha, D.P. Assessment of soil erosion in the Nepalese Himalaya: A case study in Likhu Khola Valley, Middle Mountain Region. Land Husb. 1997, 2, 59–80. [Google Scholar]
  23. Jha, M.K.; Paudel, R.C. Erosion Predictions by Empirical Models in a mountainous Watershed in Nepal. J. Spat. Hydrol. (JOSH) 2010, 10, 89–102. [Google Scholar]
  24. Acharya, A.K.; Kafle, N. Land degradation issues in Nepal and its management through agroforestry. J. Agric. Environ. 2009, 10, 133–143. [Google Scholar] [CrossRef]
  25. Rijal, S. Soil fertility decline in Nepal: Problem and strategy. Nepal J. Sci. Technol. 2001, 3, 41–46. [Google Scholar]
  26. Bajracharya, R.M.; Sherchan, D.P. Fertility status and dynamics of soils in the Nepal Himalaya: A review and analysis. Soil Fertil. 2009, 111–135. [Google Scholar]
  27. Acharya, K.P.; Poudel, B.S.; Dangi, R.B. State of Land Degradation and Rehabilitation Efforts in Nepal. Keep Asia Green 2008, 163–202. [Google Scholar]
  28. Uddin, K.; Shrestha, H.L.; Murthy, M.; Bajracharya, B.; Shrestha, B.; Gilani, H.; Pradhan, S.; Dangol, B. Development of 2010 national land cover database for the Nepal. J. Environ. Manag. 2015, 148, 82–90. [Google Scholar] [CrossRef] [PubMed]
  29. Dahal, R.K.; Hasegawa, S. Representative rainfall thresholds for landslides in the Nepal Himalaya. Geomorphology 2008, 100, 429–443. [Google Scholar] [CrossRef]
  30. National Population and Housing Census. National Population and Housing Census 2011 (Village Development Commiee/Municipality); Statistics, C.B.O., Ed.; Government of Nepal, National Planning Commission Secretariat: Kathmandu, Nepal, 2012.
  31. Radoux, J.; Bogaert, P.; Fasbender, D.; Defourny, P. Thematic accuracy assessment of geographic object-based image classification. Int. J. Geogr. Inf. Sci. 2011, 25, 895–911. [Google Scholar] [CrossRef]
  32. Blaschke, T. Object based image analysis for remote sensing. ISPRS J. Photogramm. Remote. Sens. 2010, 65, 2–16. [Google Scholar] [CrossRef]
  33. Gilani, H.; Shrestha, H.L.; Murthy, M.; Phuntso, P.; Pradhan, S.; Bajracharya, B.; Shrestha, B. Decadal land cover change dynamics in Bhutan. J. Environ. Manag. 2015, 148, 91–100. [Google Scholar] [CrossRef] [PubMed]
  34. Hay, G.J.; Castilla, G. Geographic object-based image analysis (GEOBIA): A new name for a new discipline. In Object-Based Image Analysis; Blaschke, T., Lang, S., Hay, G., Eds.; Springer: New York, NY, USA, 2008; pp. 75–90. [Google Scholar]
  35. Hay, G.J.; Blaschke, T.; Marceau, D.J.; Bouchard, A. A comparison of three image-object methods for the multiscale analysis of landscape structure. ISPRS J. Photogramm. Remote Sens. 2003, 57, 327–345. [Google Scholar] [CrossRef]
  36. Baatz, M.; Fau, A.N.; Fau, S.A.; Fau, B.G.; Bettina, L. Object-oriented image analysis for high content screening: Detailed quantification of cells and sub cellular structures with the Cellenger software. Cytom. Part A 2006, 69, 652–658. [Google Scholar] [CrossRef] [Green Version]
  37. Bajracharya, B.; Uddin, K.; Chettri, N.; Shrestha, B.; Siddiqui, S.A. Understanding Land Cover Change Using a Harmonized Classification System in the Himalaya. Mt. Res. Dev. 2010, 30, 143–156. [Google Scholar] [CrossRef]
  38. Chettri, N.; Uddin, K.; Chaudhary, S.; Sharma, E. Linking Spatio-Temporal Land Cover Change to Biodiversity Conservation in the Koshi Tappu Wildlife Reserve, Nepal. Diversity 2013, 5, 335–351. [Google Scholar] [CrossRef] [Green Version]
  39. Olofsson, P.; Foody, G.M.; Stehman, S.V.; Woodcock, C.E. Making better use of accuracy data in land change studies: Estimating accuracy and area and quantifying uncertainty using stratified estimation. Remote Sens. Environ. 2013, 129, 122–131. [Google Scholar] [CrossRef]
  40. Olofsson, P.; Foody, G.M.; Herold, M.; Stehman, S.V.; Woodcock, C.E.; Wulder, M.A. Good practices for estimating area and assessing accuracy of land change. Remote Sens. Environ. 2014, 148, 42–57. [Google Scholar] [CrossRef] [Green Version]
  41. Reed, R.A.; Johnson-Barnard, J.; Baker, W.L. Fragmentation of a forested Rocky Mountain land-scape. Biological Conservation. 1996, 75, 267–269. [Google Scholar] [CrossRef]
  42. SRTM. Hole-Filled SRTM for the Globe Version 4. The Consultative Group on International Agricultural Research (CGIAR)-SXI SRTM 90 m Database, 2008. Available online: http://srtm.csi.cgiar.org (accessed on 3 February 2018).
  43. Singh, G.; Chandra, S.; Babu, R. Soil Loss and Prediction Research in India; Bulletin No. T-12/D9; Central Soil and Water Conservation Research Training Institute: Dehradun, India, 1981. [Google Scholar]
  44. GLOVIS. USGS Global Visualization Viewer (GLOVIS) Earth Resources; Observation and Science Center (EROS): 2008. Available online: http://glovis.usgs.gov/ (accessed on 12 April 2015).
  45. Renard, K.G.; Foster, G.R.; Weesies, G.A.; McCool, D.K.; Yoder, D.C. Predicting Soil Erosion by Water: A Guide to Conservation Planning with the Revised Universal Soil Loss Equation (RUSLE); United States Department of Agriculture: Washington, DC, USA, 1997; Volume 703.
  46. Meusburger, K.; Steel, A.; Panagos, P.; Montanarella, L.; Alewell, C. Spatial and temporal variability of rainfall erosivity factor for Switzerland. Hydrol. Earth Syst. Sci. 2012, 16, 167–177. [Google Scholar] [CrossRef] [Green Version]
  47. Fick, S.E.; Hijmans, R.J. WorldClim 2: New 1-km spatial resolution climate surfaces for global land areas. Int. J. Climatol. 2017, 37, 4302–4315. [Google Scholar] [CrossRef]
  48. McGarigal, K. Landscape pattern metrics. Encycl. Environ. 2002, 2. [Google Scholar] [CrossRef]
  49. Panagos, P.; Meusburger, K.; Alewell, C.; Montanarella, L. Soil erodibility estimation using LUCAS point survey data of Europe. Environ. Model. Softw. 2012, 30, 143–145. [Google Scholar] [CrossRef]
  50. Franklin, S.E. Remote Sensing for Sustainable Forest Management; Lewis Publishers: Boca Raton, FL, USA, 2001. [Google Scholar]
  51. Gardner, R.A.M.; Gerrard, A.J. Runoff and soil erosion on cultivated rainfed terraces in the Middle Hills of Nepal. Appl. Geogr. 2003, 23, 23–45. [Google Scholar] [CrossRef]
  52. Khosrowpanah, S.; Heitz, L.; Wen, Y.; Park, M. Developing a GIS-Based Soil Erosion Potential Model of the UGUM Watershed; Water and Environmental Research Institute of the Western Pacific, University of Guam: Mangilao, Guam, 2007.
  53. Jain, S.K.; Kumar, S.; Varghese, J. Estimation of Soil Erosion for a Himalayan Watershed Using GIS Technique. Water Resour. Manag. 2001, 15, 41–54. [Google Scholar] [CrossRef]
  54. Mandal, D.; Sharda, V.N. Appraisal of soil erosion risk in the eastern himalayan region of india for soil conservation planning. Land Degrad. Dev. 2013, 24, 430–437. [Google Scholar] [CrossRef]
  55. Van der Knijff, J.; Jones, R.; Montanarella, L. Soil Erosion Risk Assessment in Italy; European Soil Bureau, European Commission: Brussels, Belgium, 1999; p. 51. [Google Scholar]
  56. De Jong, S.M. Derivation of vegetative variables from a Landsat TM image for modelling soil erosion. Earth Surf. Process. Landf. 1994, 19, 165–178. [Google Scholar] [CrossRef]
  57. Prasannakumar, V.; Vijith, H.; Abinod, S.; Geetha, N. Estimation of soil erosion risk within a small mountainous sub-watershed in Kerala, India, using Revised Universal Soil Loss Equation (RUSLE) and geo-information technology. Geosci. Front. 2012, 3, 209–215. [Google Scholar] [CrossRef]
  58. Sonneveld, B.; Nearing, M. A nonparametric/parametric analysis of the Universal Soil Loss Equation. Catena 2003, 52, 9–21. [Google Scholar] [CrossRef] [Green Version]
  59. Wang, G.; Gertner, G.; Parysow, P.; Anderson, A. Spatial prediction and uncertainty analysis of topographic factors for the revised universal soil loss equation (RUSLE). J. Soil Water Conserv. 2000, 55, 374–384. [Google Scholar]
  60. Dissmeyer, G.E.; Foster, G.R. Estimating the cover-management factor (C) in the universal soil loss equation for forest conditions. J. Soil Water Conserv. 1981, 36, 235–240. [Google Scholar]
  61. DFRS. Forest Resources of Nepal (1987–1998); Department of Forest Research and Survey, Ministry of Forest and Soil Conservation: Kathmandu, Nepal, 1999.
  62. Shrestha, S.M.; Shakya, C.-O.R.; Thapa, M.H.B.; Ojha, M.S.K.; Malla, R. Banko Janakari. In A Journal of Forestry Information for Nepal; Department of Forest Research and Survey (DFRS), Ministry of Forests and Soil Conservation, Government of Nepal: Kathmandu, Nepal, 2009; Volume 19, p. 44. [Google Scholar]
  63. DFRS. State of Nepal’s Forests. Forest Resource Assessment (FRA) Nepal; Department of Forest Research and Survey (DFRS): Kathmandu, Nepal, 2015.
  64. Rukhovich, D.; Wagner, V.; Vil’chevskaya, E.; Kalinina, N.; Koroleva, P. Problems of using digitized thematic maps on the territory of the former Soviet Union upon the creation of the “Soils of Russia” geographic information system. Eurasian Soil Sci. 2011, 44, 957. [Google Scholar] [CrossRef]
  65. Frith, M.W. Measuring Error in Manually Digitized Maps; University of Regina: Regina, SK, Canada, 1999. [Google Scholar]
  66. Chen, G.; Weng, Q.; Hay, G.J.; He, Y. Geographic object-based image analysis (GEOBIA): Emerging trends and future opportunities. GISci. Remote Sens. 2018, 55, 159–182. [Google Scholar] [CrossRef]
  67. Costa, H.; Foody, G.M.; Boyd, D.S. Supervised methods of image segmentation accuracy assessment in land cover mapping. Remote Sens. Environ. 2018, 205, 338–351. [Google Scholar] [CrossRef]
  68. Keenan, R.J.; Reams, G.A.; Achard, F.; de Freitas, J.V.; Grainger, A.; Lindquist, E. Dynamics of global forest area: Results from the FAO Global Forest Resources Assessment 2015. For. Ecol. Manag. 2015, 352, 9–20. [Google Scholar] [CrossRef]
  69. Ozsahin, E.; Duru, U.; Eroglu, I. Land Use and Land Cover Changes (LULCC), a Key to Understand Soil Erosion Intensities in the Maritsa Basin. Water 2018, 10, 335. [Google Scholar] [CrossRef]
  70. Luleva, M.I.; Van Der Werff, H.; Van Der Meer, F.; Jetten, V. Gaps and opportunities in the use of remote sensing for soil erosion assessment. Chemistry 2012, 21, 748–764. [Google Scholar]
  71. Mandal, U.K. Geo-information-Based Soil Erosion Modeling for Sustainable Agriculture Development in Khadokhola Watershed, Nepal. In Land Cover Change and Its Eco-Environmental Responses in Nepal; Springer: Singapore, 2017; pp. 223–241. [Google Scholar]
  72. Kavian, A.; Hoseinpoor Sabet, S.; Solaimani, K.; Jafari, B. Simulating the effects of land use changes on soil erosion using RUSLE model. Geocarto Int. 2017, 32, 97–111. [Google Scholar] [CrossRef]
  73. Nayak, T.; Jaiswal, R.; Galkate, R.; Thomas, T. Impact Assessment of Alternate Land Cover and Management Practices on Soil Erosion: A Case Study. In Hydrologic Modeling; Springer: Singapore, 2018; pp. 211–223. [Google Scholar]
  74. Kc, B.; Wang, T.; Gentle, P. Internal Migration and Land Use and Land Cover Changes in the Middle Mountains of Nepal. Mt. Res. Dev. 2017, 37, 446–455. [Google Scholar] [CrossRef] [Green Version]
  75. Anup, K.; Bhandari, G.; Joshi, G.R.; Aryal, S. Climate Change Mitigation Potential from Carbon Sequestration of Community Forest in Mid Hill Region of Nepal. Int. J. Environ. Prot. 2013, 3, 33–40. [Google Scholar]
  76. Dahal, G.R.; Adhikari, K.; Thwaites, R. Forest tenure and community forestry in Nepal: Trends and implications. In Community Forestry in Nepal; Routledge: Abingdon, UK, 2017; pp. 132–150. [Google Scholar]
  77. Fisher, R.; Shrestha, K. Labour migration, the remittance economy and the changing context of community forestry in Nepal. In Community Forestry in Nepal; Routledge: Abingdon, UK, 2017; pp. 171–192. [Google Scholar]
Figure 1. Study area used for land cover change detection and soil loss mapping of Nepal.
Sustainability 10 04715 g001
Figure 2. Flow diagram of land cover assessment using object-based image analysis.
Sustainability 10 04715 g002
Figure 3. Flow diagram of soil erosion assessment.
Sustainability 10 04715 g003
Figure 4. Four factors used in RUSLE: (a) Rainfall-erosivity factor; (b) soil erodibility factor; (c) slope length factor; and (d) slope steepness factor.
Sustainability 10 04715 g004
Figure 5. Spatial distribution of the cover management factor: (a) 1990; (b) 2000; and (c) 2010.
Sustainability 10 04715 g005
Figure 6. Land cover map of Nepal (a) 1990; (b) 2000; and (c) 2010; used for the preparation of the support practice factor.
Sustainability 10 04715 g006
Figure 7. Soil erosion map of Nepal: (a) 1990; (b) 2000; and (c) 2010 to identify priority areas for soil erosion control.
Sustainability 10 04715 g007
Figure 8. Identified priority areas of Nepal for soil erosion control.
Sustainability 10 04715 g008
Table 1. Input data sources, and published equations used in RUSLE.
Soil Erosion FactorInput DataData SourceEquation or Published Factor
Rainfall erosivity factor (R)Precipitation (ESRI grids, 10 arc-minutes)World climate precipitation data
[41]
R = 0.0483 × P1.610
where P = annual precipitation (mm)
Soil erodibility factor (K)Soil maps from Nepal Literature review
Slope length factor (L)SRTM 30 m digital elevation data[42]L = (λ/22.13) m
where λ is the field slope length (m), and m assumes a value from 0.2 to 0.5 [43]
Slope steepness factor (S)SRTM 30m digital elevation data[42]S = (0.43 + 0.30 s + 0.043 s2)/6.613 [13]
Land cover management factor (C)NDVI from Landsat [44]C = 0.431 − 0.805 x NDVI [45]
Support practice factor (P)Land cover map ICIMOD ([28]Literature review
Table 2. Slope length exponent.
Slope GradientValue of m
1%0.2
1–3%0.3
3–4.5%0.4
4.5% or more0.5
Table 3. Land cover and estimated erosion rates in Nepal in 1990, 2000, and 2010.
Land CoverLand Cover Area (ha)Annual Soil Loss (t)Mean Erosion Rate (t/ha/yr)
Year199020002010199020002010199020002010
Forest6,668,3366,148,4016,202,8099,557,4434,968,7625,488,1941.430.810.88
Shrubland328,142346,930342,9861,223,757849,3521,449,6703.732.454.23
Grassland1,728,5611,379,4851,264,55225,198,39113,941,82113,982,88414.5810.1111.06
Agriculture area3,753,9334,096,9684,039,82069,054,80336,115,16360,071,67218.408.8214.87
Barren area1,006,8311,702,0021,535,85121,299,99238,469,81623,266,67621.1622.6015.15
Water body81,05273,05172,6852,029,0871,608,6711,597,41725.0322.0221.98
Snow/glacier1,168,741974,1761,255,347919,372682,0814,537,5580.790.703.61
Built-up area32,91647,49954,46233,95239,974152,4391.030.842.80
Total14,768,51214,768,51214,768,512129,316,79696,675,641110,546,5098.766.557.49
Table 4. Change matrix for soil erosion classes from 1990 to 2000 (%).
Soil Erosion Risk Rank (t/ha/yr)Very Low (<0.5)Low (0.5–1)Low Medium (1–2)Medium (2–5)High Medium (5–10)High (10–20)Very High (20–50)Extremely High (>50)Total 2000
Very low (<0.5)29.565.622.590.630.800.600.390.0840.27
Low (0.5–1)1.442.683.290.370.190.110.080.028.18
Low medium (1–2)1.500.926.014.111.730.550.320.0615.20
Medium (2–5)1.030.210.801.282.171.040.420.067.00
High medium (5–10)1.380.400.750.502.573.021.790.1910.61
High (10–20)0.900.350.420.390.742.643.540.649.63
Very high (20–50)0.590.090.320.080.420.952.911.817.16
Extremely high (>50)0.190.010.050.030.020.150.520.981.95
Total 199036.5710.2714.247.408.669.069.973.84100
Table 5. Change matrix for soil erosion classes from 2000 to 2010 (%).
Soil Erosion Risk Rank (t/ha/yr)Very Low (<0.5)Low (0.5–1)Low Medium (1–2)Medium (2–5)High Medium (5–10)High (10–20)Very High (20–50)Extremely High (>50)Total 2010
Very low (<0.5)32.442.231.641.081.551.020.630.1940.79
Low (0.5–1)3.873.161.190.160.310.370.160.019.23
Low medium (1–2)1.492.035.110.610.680.330.260.0610.57
Medium (2–5)0.680.344.341.300.510.460.080.027.72
High medium (5–10)0.830.222.082.602.970.910.560.0210.20
High (10–20)0.570.110.480.893.303.231.160.229.94
Very high (20–50)0.320.070.310.321.173.023.240.559.00
Extremely high (>50)0.060.010.050.050.120.301.090.872.55
Total 201040.278.1815.207.0010.619.637.161.95100

