Article

Erosion Control in the Sustainable Cultivation of Maize (Zea mays L.) and Beans (Phaseolus vulgaris L.) at Two Stages of the Agricultural Cycle in Southern Guatemala

by
Rafael Blanco Sepúlveda
1,* and
Francisco Enríquez Narváez
2
1
Geographic Analysis Research Group, Department of Geography, University of Málaga, Campus of Teatinos, s/n. 29071 Málaga, Spain
2
Association for Welfare, Progress and Development (ABPD), 1a. avenida 3-50, zona 2, Chimaltenango 04001, Guatemala
*
Author to whom correspondence should be addressed.
Sustainability 2018, 10(12), 4654; https://doi.org/10.3390/su10124654
Submission received: 23 October 2018 / Revised: 29 November 2018 / Accepted: 4 December 2018 / Published: 6 December 2018
(This article belongs to the Special Issue Soil Erosion and the Sustainable Management of the Landscape)

Abstract

:
Agricultural intensification in the mountains of Central America has increased soil vulnerability to erosion by water. This study was undertaken to analyse the erosion that affects the mixed cultivation of maize and beans at two stages of the crop development cycle (at 3 and 6 months after sowing) in southern Guatemala, together with the influence of the ground and crop canopy vegetal cover on soil erosion. The main aim of this analysis is to establish the soil erosion threshold enabling sustainable agriculture. The results obtained show that the soil surface was severely eroded, with mean values of area affected of 88.4% and 73.5% at 3 and 6 months, respectively. In the 3-month plots, the erosion bore scant relation to the factors analysed. Conversely, the area affected by soil erosion in the 6-month plots was significantly related to the degree of ground cover by weeds and litter, and the erosion threshold was located at 80% of vegetal cover. However, plots with this level of cover did not achieve effective erosion control, due to the low level of plant litter cover (15.7%) compared to that of weeds (75.5%). We conclude that this low content of vegetal residue in the soil, together with the tillage practices employed, explains the large surface area affected by erosion and the impossibility of establishing an erosion threshold.

1. Introduction

Maize (Zea mays L.) and beans (Phaseolus vulgaris L.) are staple foods in Central America [1] and are the two most important crops in the region, far ahead of coffee and cocoa, the main export crops. Over the last 53 years, the cultivation of maize in Central America has expanded in the region, and nearly nine million hectares of farmland are currently dedicated to this crop (increasing from 7.67 million hectares in 1961 to 8.93 million hectares in 2014, with an annual growth of 0.29%) [2]. For the same period, the cultivated area of bean (dry and green) increased from 1.89 million to 2.47 million hectares (annual growth of 0.51%). Moreover, this increase was accompanied by increased productivity. The yield of maize cultivation rose at an average annual rate of 2.17%, from 974 to 3037 kg ha−1 between 1961 and 2014. For beans, the rate of increase was irregular, with the productivity of dry beans increasing by 1.0% per year, from 466 to 791 kg ha−1, while that of green beans increased much faster, at 3.44% per year, from 1498 to 8992 kg ha−1. The intensification of agriculture in Central America, and in Guatemala in particular, has been analysed by Klepek [3], who highlighted the technological “Green Revolution”, which began in the 1950s with US development aid, in a Cold War context of geopolitical tension. Apart from the characteristics affecting specific regions of the planet, agricultural intensification is a global phenomenon [4], and appears likely to continue in the coming decades, according to FAO forecasts, which suggest that by 2050 more than 80% of the world’s agricultural production growth will have resulted from the increased productivity of land currently under cultivation [5].
The intensification of agricultural activity in Central America has profoundly changed maize and bean cultivation systems in the region. With respect to soil and biomass management, the traditional system, based on shifting cultivation patterns and on no-tillage farming, has given way to a new model characterised by permanent agriculture and by tillage using ploughs or hoes. Soil erosion by water is a major problem in tropical mountain areas [6,7,8] and the above-described changes in the agricultural system have aggravated this problem [9]. The new model has replaced woodland fallow with (mainly inorganic) fertilisation, which meets the immediate needs of crops, but does not compensate for the losses of organic matter from the soil due to mineralisation. Accordingly, there may be decreased stability of aggregates and greater vulnerability to soil erosion [10]. Tillage also facilitates the mineralisation of organic matter, especially in tropical conditions [11], and provokes similarly negative consequences.
From the economic and social standpoint, this soil degradation provokes the loss of the most fertile layers of soil, and thus reduces crop productivity [12,13,14]. Agriculture is the means of livelihood for many families of small and medium-scale producers living in these mountainous areas, and its sustainability is threatened by the degradation of resources [15]. Moreover, this circumstance may be aggravated in coming years by climate change. In recent years, temperatures have increased and there has been a higher intensity of precipitation–drought extreme events in the wet and dry regions, respectively, of Central America [16,17], a tendency that is expected to continue [18]. Furthermore, and especially relevant to the present study, climate models suggest that the isthmus will experience a greater frequency and intensity of extreme rainfall events in the form of hurricanes and tropical storms [17]. This outcome is predicted to affect all the tropical zones of the planet, with rising sea surface temperatures being the main cause of this process [19].
Over time, these changes may have severe environmental and economic consequences. In particular, extreme rainfall events can produce significant environmental impacts, greatly increasing the risk of erosion [17,20], especially in mountain soils where vulnerability is most acute. In economic terms, a general loss of agricultural production is expected [17,21,22], affecting the cultivation of maize in particular [23].
In view of the uncertain environmental and economic context of Central America, measures must be taken to prevent erosion and the loss of soil fertility. With this aim in mind, studies have examined erodibility factors (both environmental and specifically with respect to agricultural management) to determine the erosion threshold [24,25]. This concept, which has been defined as “the value (of the erodibility factor) beyond which the effective control of erosion is achieved” [26], is of particular interest for practical purposes because it can be used to improve the planning of agricultural activity, from the viewpoint of soil conservation, which is in line with the goals of UNEP [27]. Specifically for Latin America, knowledge of erosion thresholds could provide useful means of monitoring and responding to soil degradation, in actions such as those described by Lee et al. [22], who sought to design strategies for local development in which climate change effects were taken into account. The need for such strategies had previously been highlighted by Eakin and Lemos [28,29]. With respect to the methods to be employed in these strategies, the erosion threshold can be used to complement the Visual Soil Assessment method [30], thus facilitating decision making aimed at sustainable land use.
Soil erosion by water depends, among other factors, on the types of crops involved and the different levels of vegetal cover they provide [31]. The case of annual crops is particularly significant because they may experience significant differences in cover during the agricultural cycle, and therefore the impact of erosion may vary depending on the stage of development of this type of crop. Determining the erosion threshold in annual crops is especially complex because it requires taking into account different conditions of development and cover during the agricultural cycle.
The present study has the following aims, (1) to compare values for soil erosion by water at two stages of the crop development cycle (at 3 and 6 months after sowing) in the mixed cultivation of maize (Zea mays L.) and beans (Phaseolus vulgaris L.) and (2) to analyse the influence of the ground and crop canopy vegetal cover on this erosion and to determine soil erosion thresholds by means of the factors cited above.

2. Materials and Methods

2.1. Site Characteristics

The study was carried out in 2016 on 43 sample plots of maize and bean cultivation, belonging to smallholders and located in the former woodlands of the mountains of Patzun (14°40′59′′ N, 91°0′53′′ W) and Santa Apolonia (14°47′24′′ N, 90°58′26′′ W) (Chimaltenango, Guatemala) (Figure 1).
The climate is tropical subhumid, with an average annual precipitation of 1050 mm and marked seasonality. The rainy season is April to November and the remaining months are dry. The rainfall intensity measured during the study period did not vary significantly from the average value. The mean annual air temperature ranges from 18 to 21 °C. The soils in this area are classified as Mollic Andosols [32], with mainly clay loam texture (24.9 ± 1.9% clay, 23.9 ± 1.2% fine silt, 9.1 ± 1.3% coarse silt, 42.1 ± 2.1% sand), with 24.5 ± 1.4 g kg−1 organic carbon, 12.4 ± 8.2 g kg−1 equivalent calcic carbonate, 17.1 ± 1 meq 100 gr−1 cationic exchange capacity, and 78.6 ± 3.4% base saturation rate. The study plots had a slope gradient of 12 to 52% (mean value 38 ± 1.8%).

2.2. Tillage and Crop Management

The agricultural system commonly applied in the region consists of the mixed cultivation of criollo maize (Zea mays L.) and Parramos criollo beans (Phaseolus vulgaris L.). The sowing of maize and bean is done by hoe, after the first rains, between April and May, but if these are delayed the sowing period can be extended until June. The sowing is performed at a ratio of five seeds of maize to two of beans. The interplant distance is 1 m (in the maize–bean rows) and 1.1 m (in the inter-rows), which results in a density of about 9000 crop points (~9000 points × 5 plants ≈ 45,000 maize plants ha−1, ~9000 points × 2 plants ≈ 18,000 bean plants ha−1). The maize, with a crop cycle of 8 months, is harvested from November to February, depending on the date of sowing. Bean has a 5-month cycle and is harvested from September to November, according to the date of sowing.
Weed control is performed by hoe and consists of two to three sessions during the cycle (w-f in Figure 2), according to the start date and regularity of the rains. The first task is mainly weeding but may also involve earthing up the milpa (maize field). This is usually done in June–July, or even in late May if sowing took place early. The second and third stages of weeding and earthing up are performed in July–August and August–September, respectively (Figure 2). After harvesting, the maize and bean residues are usually left on the soil surface and burned just before sowing in the next crop cycle. Coinciding with the weed control, two or three applications of 400 kg ha−1 of NPK fertiliser are made (20:20:0 in the first stage and 15:15:15 in the second and also in the third, if performed) (Figure 2).
The present study was conducted during two stages of the crop cycle. The first sampling was carried out at 3 months (on average) after sowing, between mid-July and early August, coinciding with phenological stage 6 (“Flowering, anthesis”) of the BBCH (Biologische Bundesanstalt, Bundessortenamt and Chemical industry) scale [33]. This sampling took place in plots where a second weed control had recently been performed (5–20 days later) (Figure 2). During this stage, the soil is more vulnerable to erosion due to the elimination of vegetal cover and the alteration of the soil. The second sampling took place at 6 months (on average), in the final stage of crop development and before harvesting, between mid-October and early November, which corresponds to stage 7 (“Development of fruit”) of the BBCH scale [33]. This sampling reflected a period in which no weed control was performed, for at least one month (Figure 2), and so the soil was more protected against erosion.

2.3. Methods

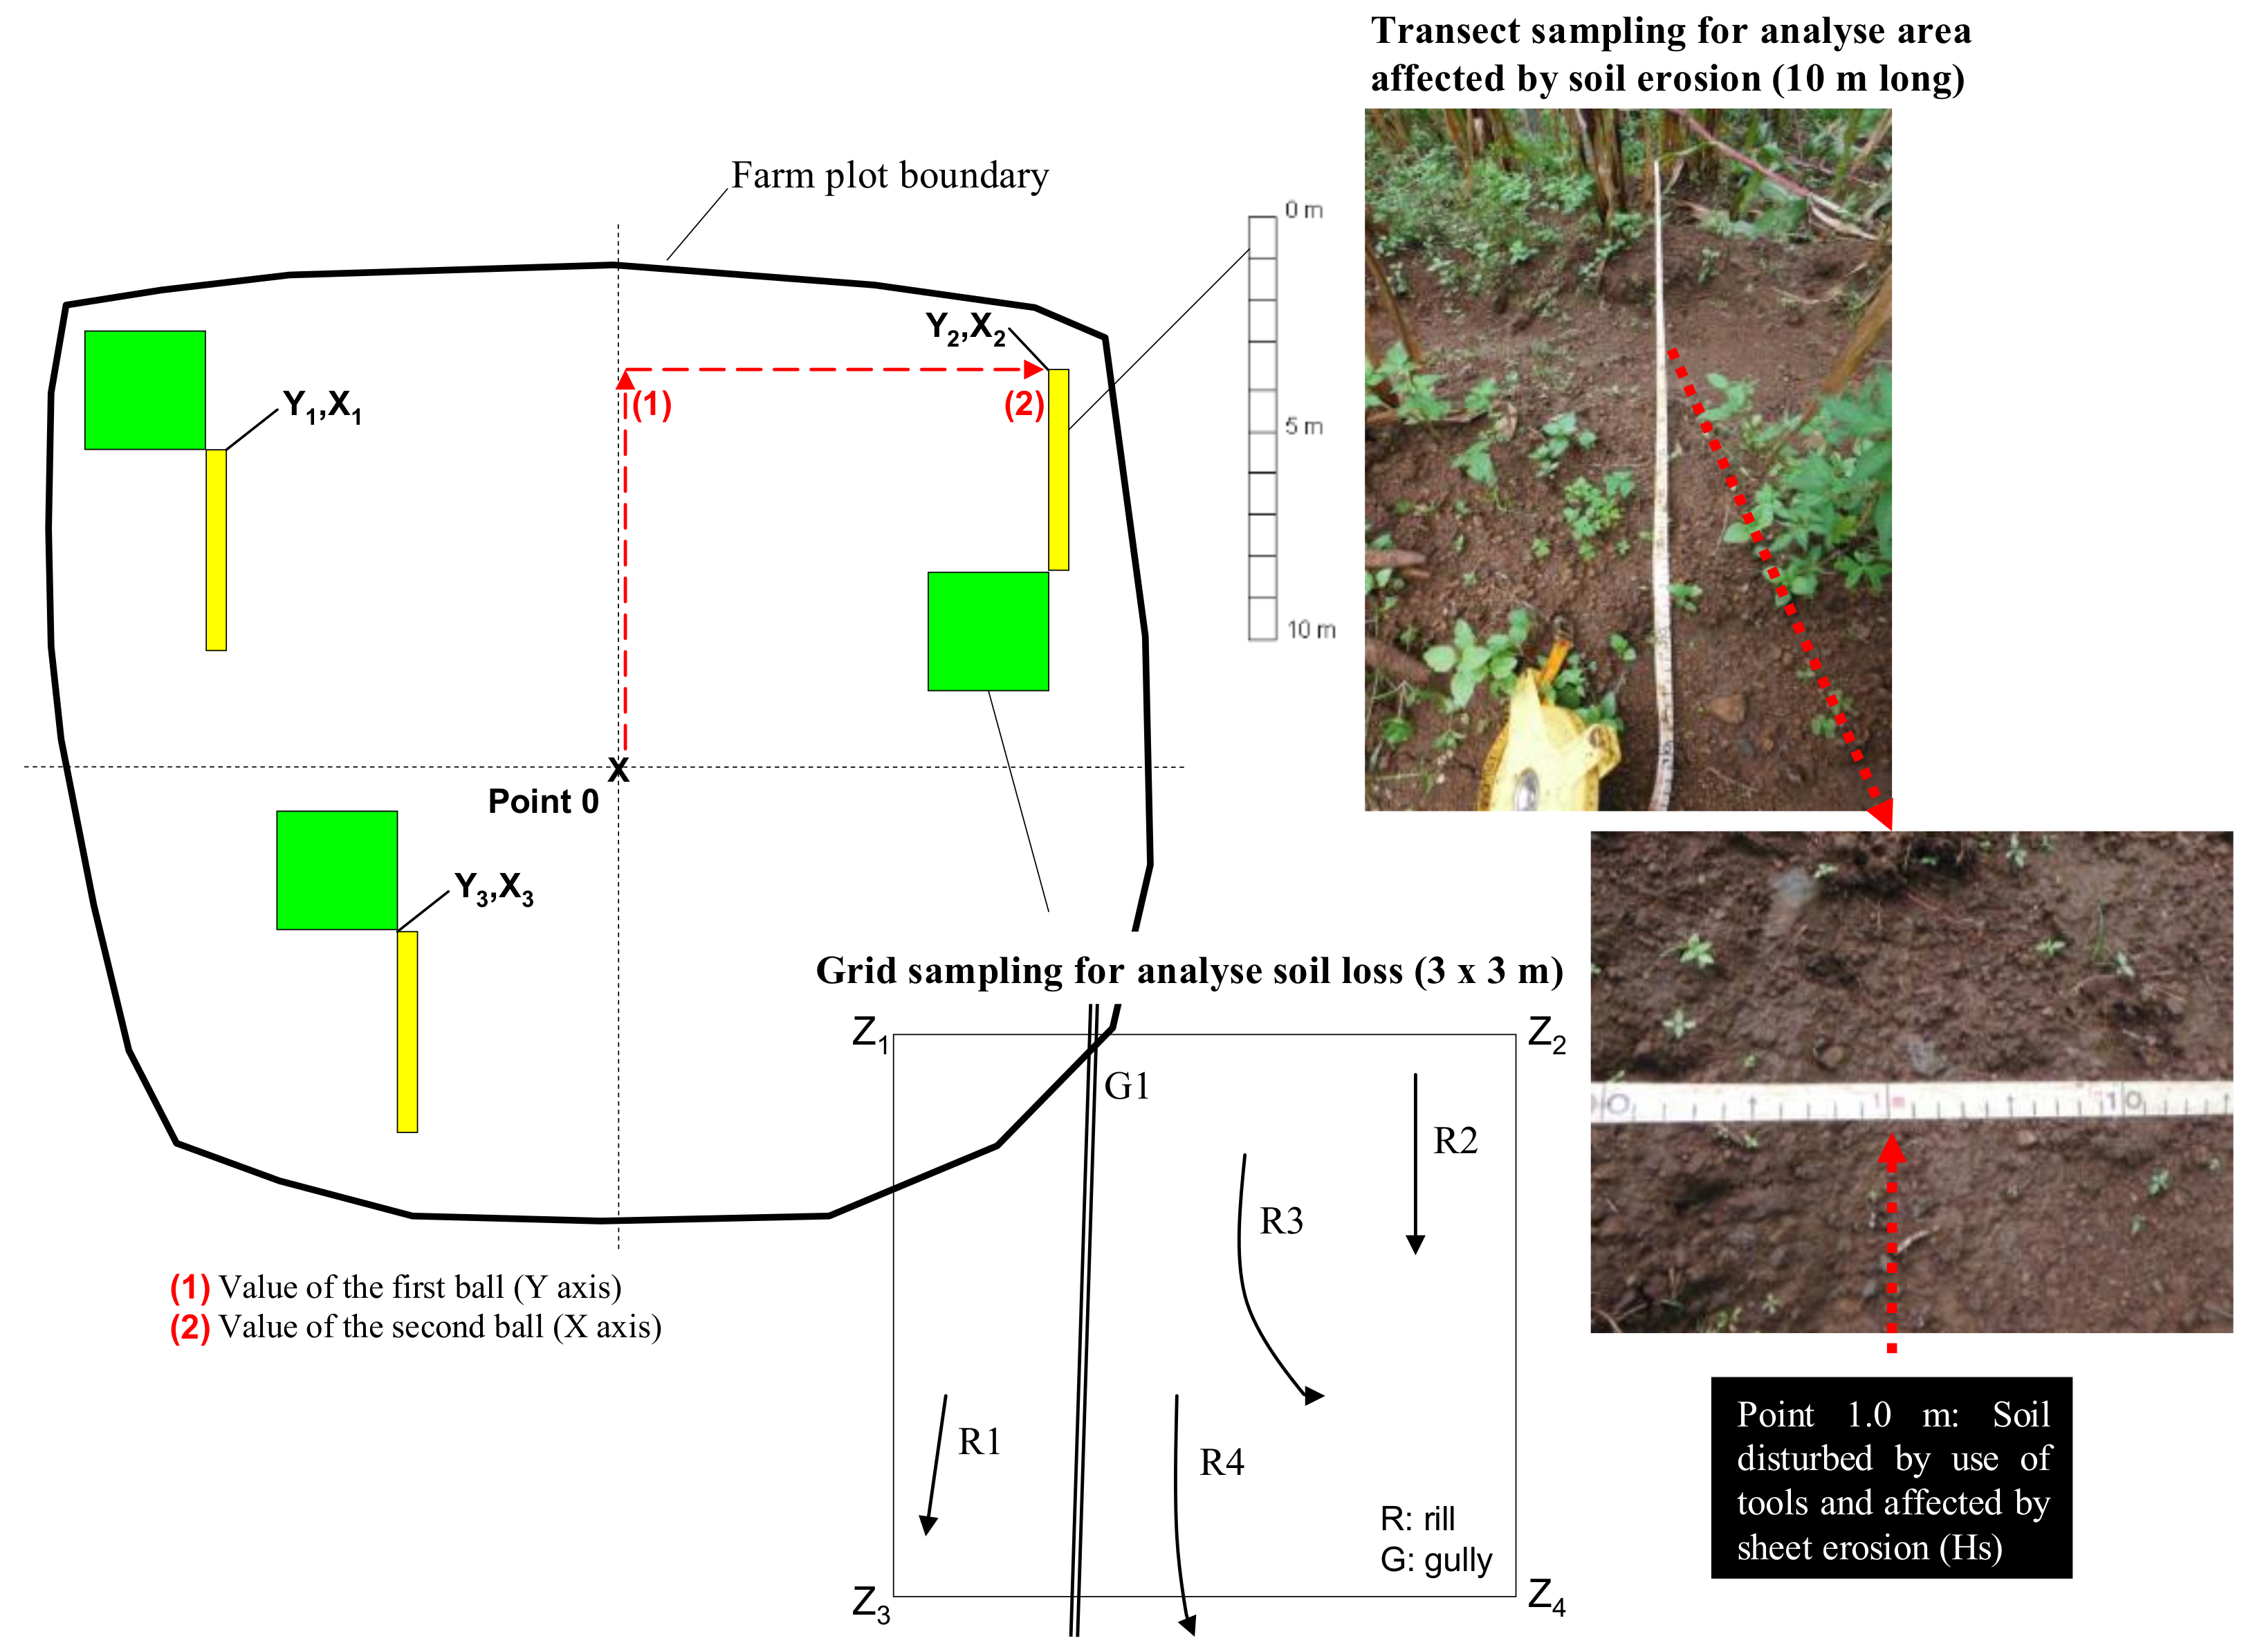
The method described by Blanco [26] was used to analyse the area affected by soil erosion (as % of land area affected by the different surface processes) and soil loss (in m3 ha−1) and to determine the corresponding erosion threshold (ET). Surface processes affecting the soil were identified using the visual indicators listed in Table 1. Figure 3 shows the visual indicators of common surface processes in maize–bean crop cultivation. The sample plots illustrated coincide with the cultivation plots. For each plot, three transects were used to analyse the area affected by soil erosion and three grids were used for soil loss analysis. All transects and grids were located at distances from point 0 of the plot (measured on both the x-axis and the y-axis) determined randomly by the blind extraction of numbered balls (Figure 4). The 10 m long transects were divided into regular sections of 0.25 m for data collection (in total, 40 sampling points per transect). At each point (over a surface area of 1 cm2), the surface process affecting the soil was determined, together with the soil cover (distinguishing between bare soil, weeds, and litter layer) and the cover provided by the maize and bean plants. The slope gradient was measured by a manual clinometer. The grid size was 3 × 3 m. The rills and gullies observed within the grid were measured (length, width, and depth) to calculate the volume of soil loss, assuming the cross sections of the rills and gullies were geometrically shaped [34,35]. Further details of the sampling process are given by Blanco [26].
The erosion threshold is defined as “the value (of the erodibility factor) beyond which effective control of erosion is achieved” [26], and is determined by analysis of the variance. The analysis process is described in the paper cited. To assess whether the erosion threshold reflects effective erosion control, we applied a verification method to assess the intensity of erosion by means of a qualitative classification (Table 2).
Analysis of variance (Kruskal–Wallis and Mann–Whitney tests), bivariate correlation analysis (Spearman correlation coefficient, Rho), and multiple linear regression analysis (stepwise method) were used to analyse the results obtained.

3. Results

3.1. Crop Canopy and Ground Cover

The total overlap cover (sum of crop canopy and ground vegetal cover) presented important differences between the two stages of the agricultural cycle: 52.2 ± 3.8% at 3 months and 88.6 ± 5.1% at 6 months. The cover provided by maize and beans was 28.1 ± 2.0% at 3 months and 38.8 ± 2.5% at 6 months. The ground cover (provided by weeds and plant litter) also varied significantly between the two stages of the crop cycle: 24 ± 2.9% at 3 months and 49.7 ± 4.4% at 6 months. The largest differences were observed in the cover provided by weeds (11.9 ± 2.2% at 3 months and 36.4 ± 4.4% at 6 months), while the plant litter presented similar values in both periods (12.2 ± 1.5% and 13.3 ± 1.9% at 3 and 6 months, respectively) (Table 3). The 3-month plots presented less ground cover because this was the stage of the crop cycle in which weeding takes place. In contrast, the 6-month plots were examined at the final stage of the crop, when weeding was no longer carried out because weeds did not threaten the development of the maize and beans.

3.2. Soil Erosion at 3 and 6 Months after Sowing

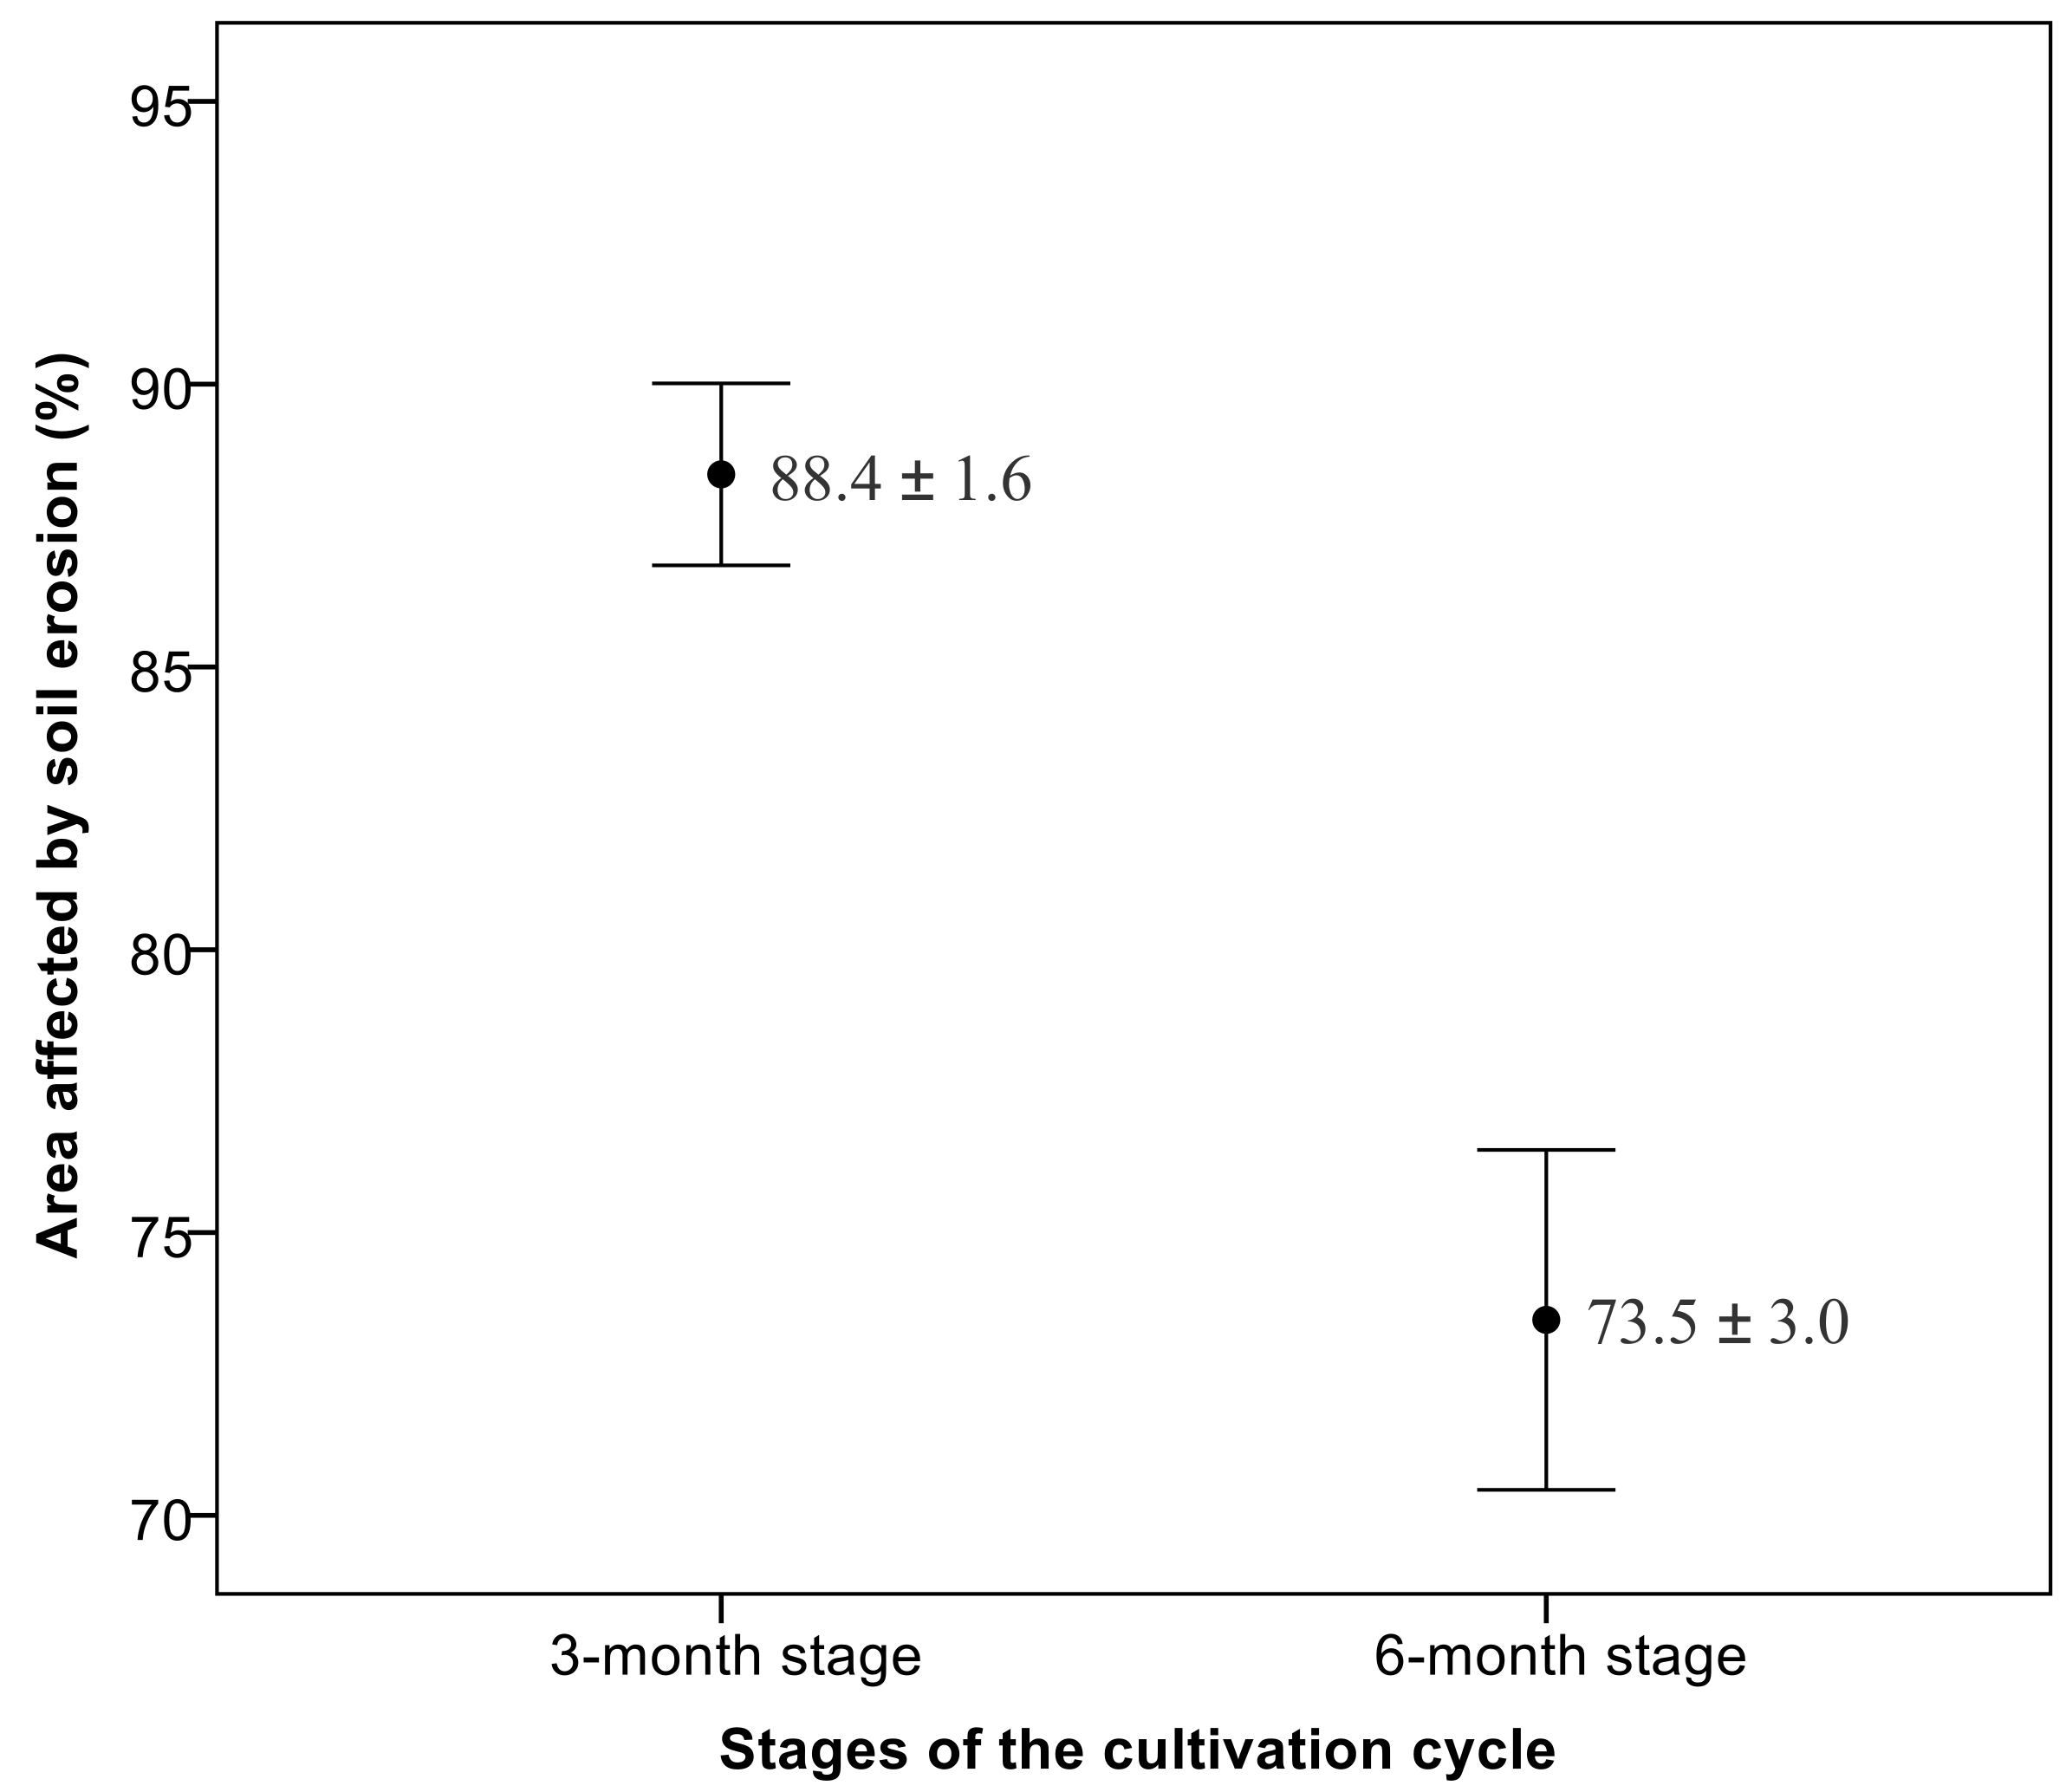
The results of the Mann–Whitney test indicated significant differences in erosion, at a confidence interval of 99% (U = 498.0, p < 0.001), between the two stages of the cultivation cycle. Among the 3-month maize–bean crops, 88.4 ± 1.6% of the mean surface area was affected by erosion, while at 6 months, the area of land affected by erosion had fallen to 73.5 ± 3.0% (Table 4, Figure 5). The main type of erosion highlighted by the analyses was sheet erosion on soil that had been altered by tillage (Hs) (50.5 ± 1.9% and 51.9 ± 2.0%); this was followed, with a much smaller degree of effect, by splash erosion (Hi) (15.2 ± 2.9% and 12.3 ± 2.2%). In the 3-month stage, only 11.6 ± 1.6% of the study area was free of erosion, and of this proportion only 3.4 ± 0.7% was protected by plant litter cover (Nl). By contrast, in the 6-month stage the plots were less affected by erosion. In this case, 24.0 ± 3.0% of the surface area was unaffected by erosion, and of this proportion, 12.6 ± 1.9% was protected by plant litter cover. The soil loss observed was by rill erosion and was slight and widely dispersed, between 1.5 ± 0.6 m3 ha−1 and 3.8 ± 1.6 m3 ha−1 at 3 and 6 months, respectively.

3.3. Erosion-Related Soil Cover Variables

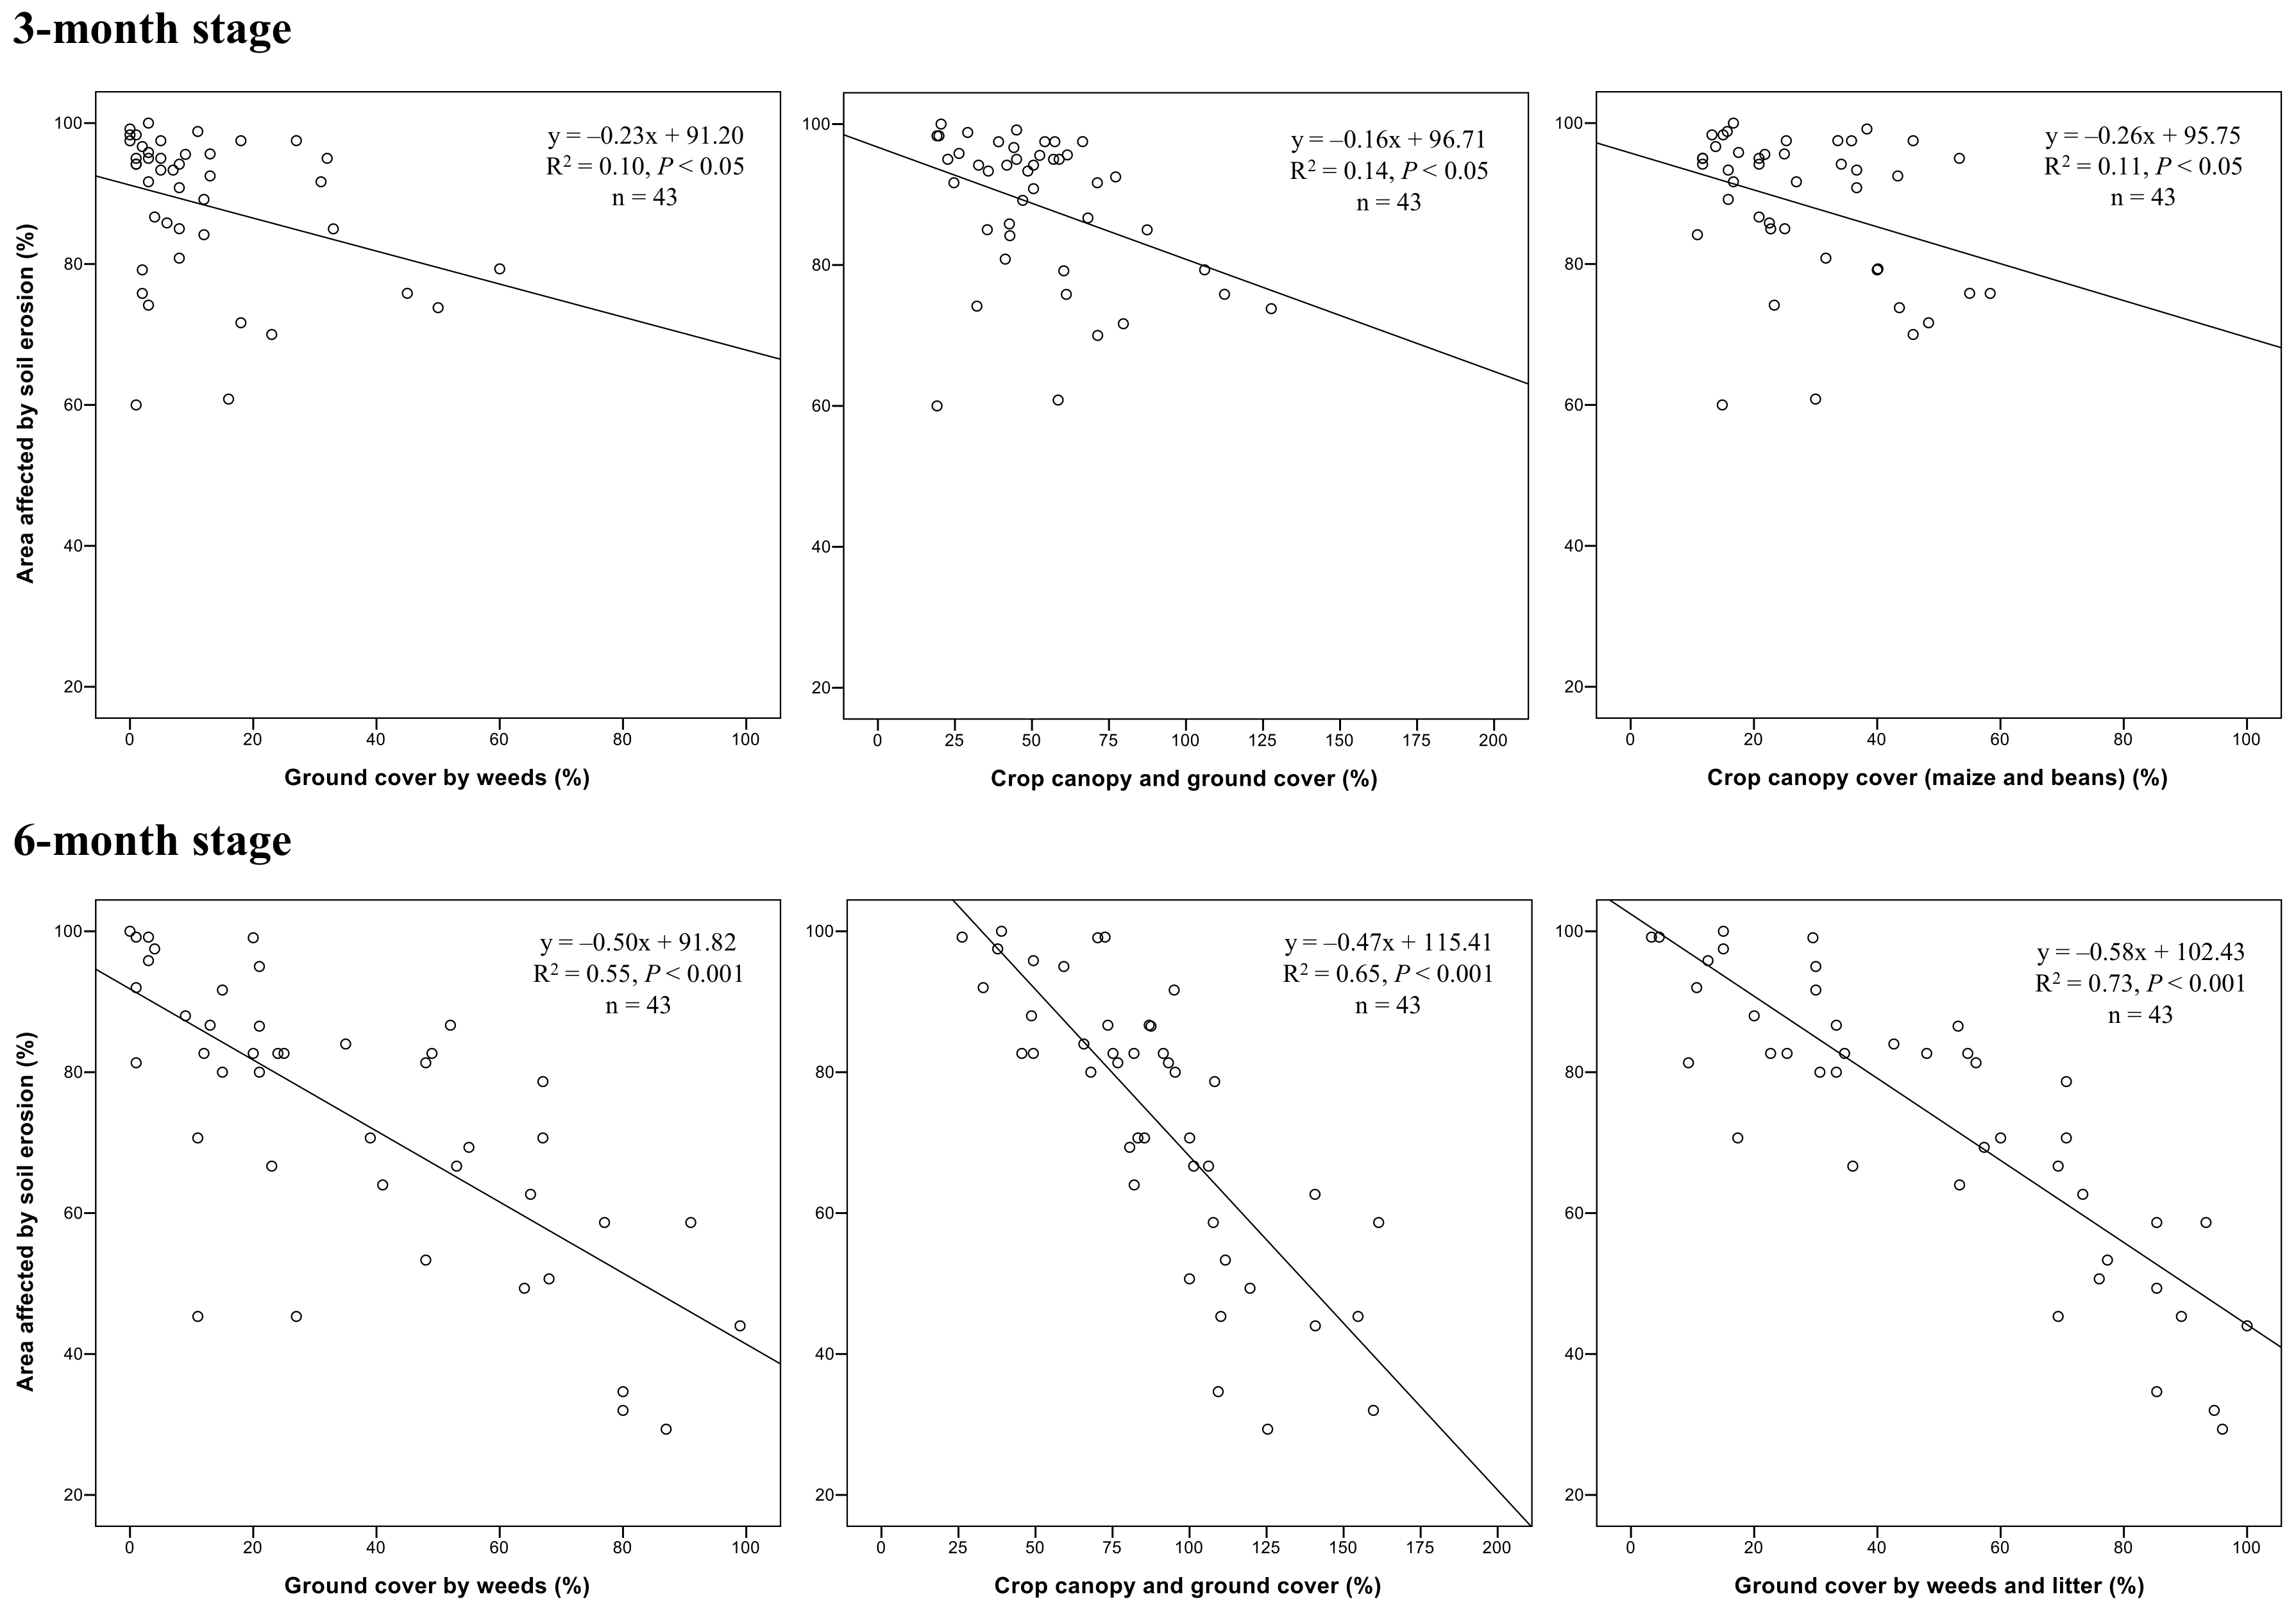
Correlation and regression analysis of the variables revealed significant differences between the two stages of the cultivation cycle. At the 3-month stage, the area affected by soil erosion was significantly correlated with crop canopy cover (Rho = −0.32, p < 0.05), with ground cover by weeds (Rho = −0.35, p < 0.05) and with the crop canopy and ground cover (Rho = −0.39, p < 0.05) (Table 5). At the 6-month stage, erosion in the plots was significantly correlated with ground cover by weeds (Rho = −0.75, p < 0.01), with the crop canopy and ground cover (Rho = −0.85, p < 0.01), and with the ground cover by weeds and litter (Rho = −0.86, p < 0.01) (Table 5). However, the regression analysis did not confirm the impact on erosion of these variables in the 3-month stage. The coefficients of determination (R2) were very low (0.11, 0.10, and 0.14), although the significance was p < 0.05 (Figure 6). In contrast, the regression analysis did confirm the impact on erosion of the weed layer and of the total plant cover at the 6-month stage. The best equation thus obtained presented a coefficient of determination (R2) of 0.73 (p < 0.001) between the ground cover (sum of weeds and litter) and soil erosion, with an inverse linear relationship (Figure 6). Soil loss was not correlated with any of the variables analysed (Table 5).

3.4. Erosion Threshold in Relation to the Ground Cover by Weeds and Litter in Maize–Bean Crops at 6 Months after Sowing

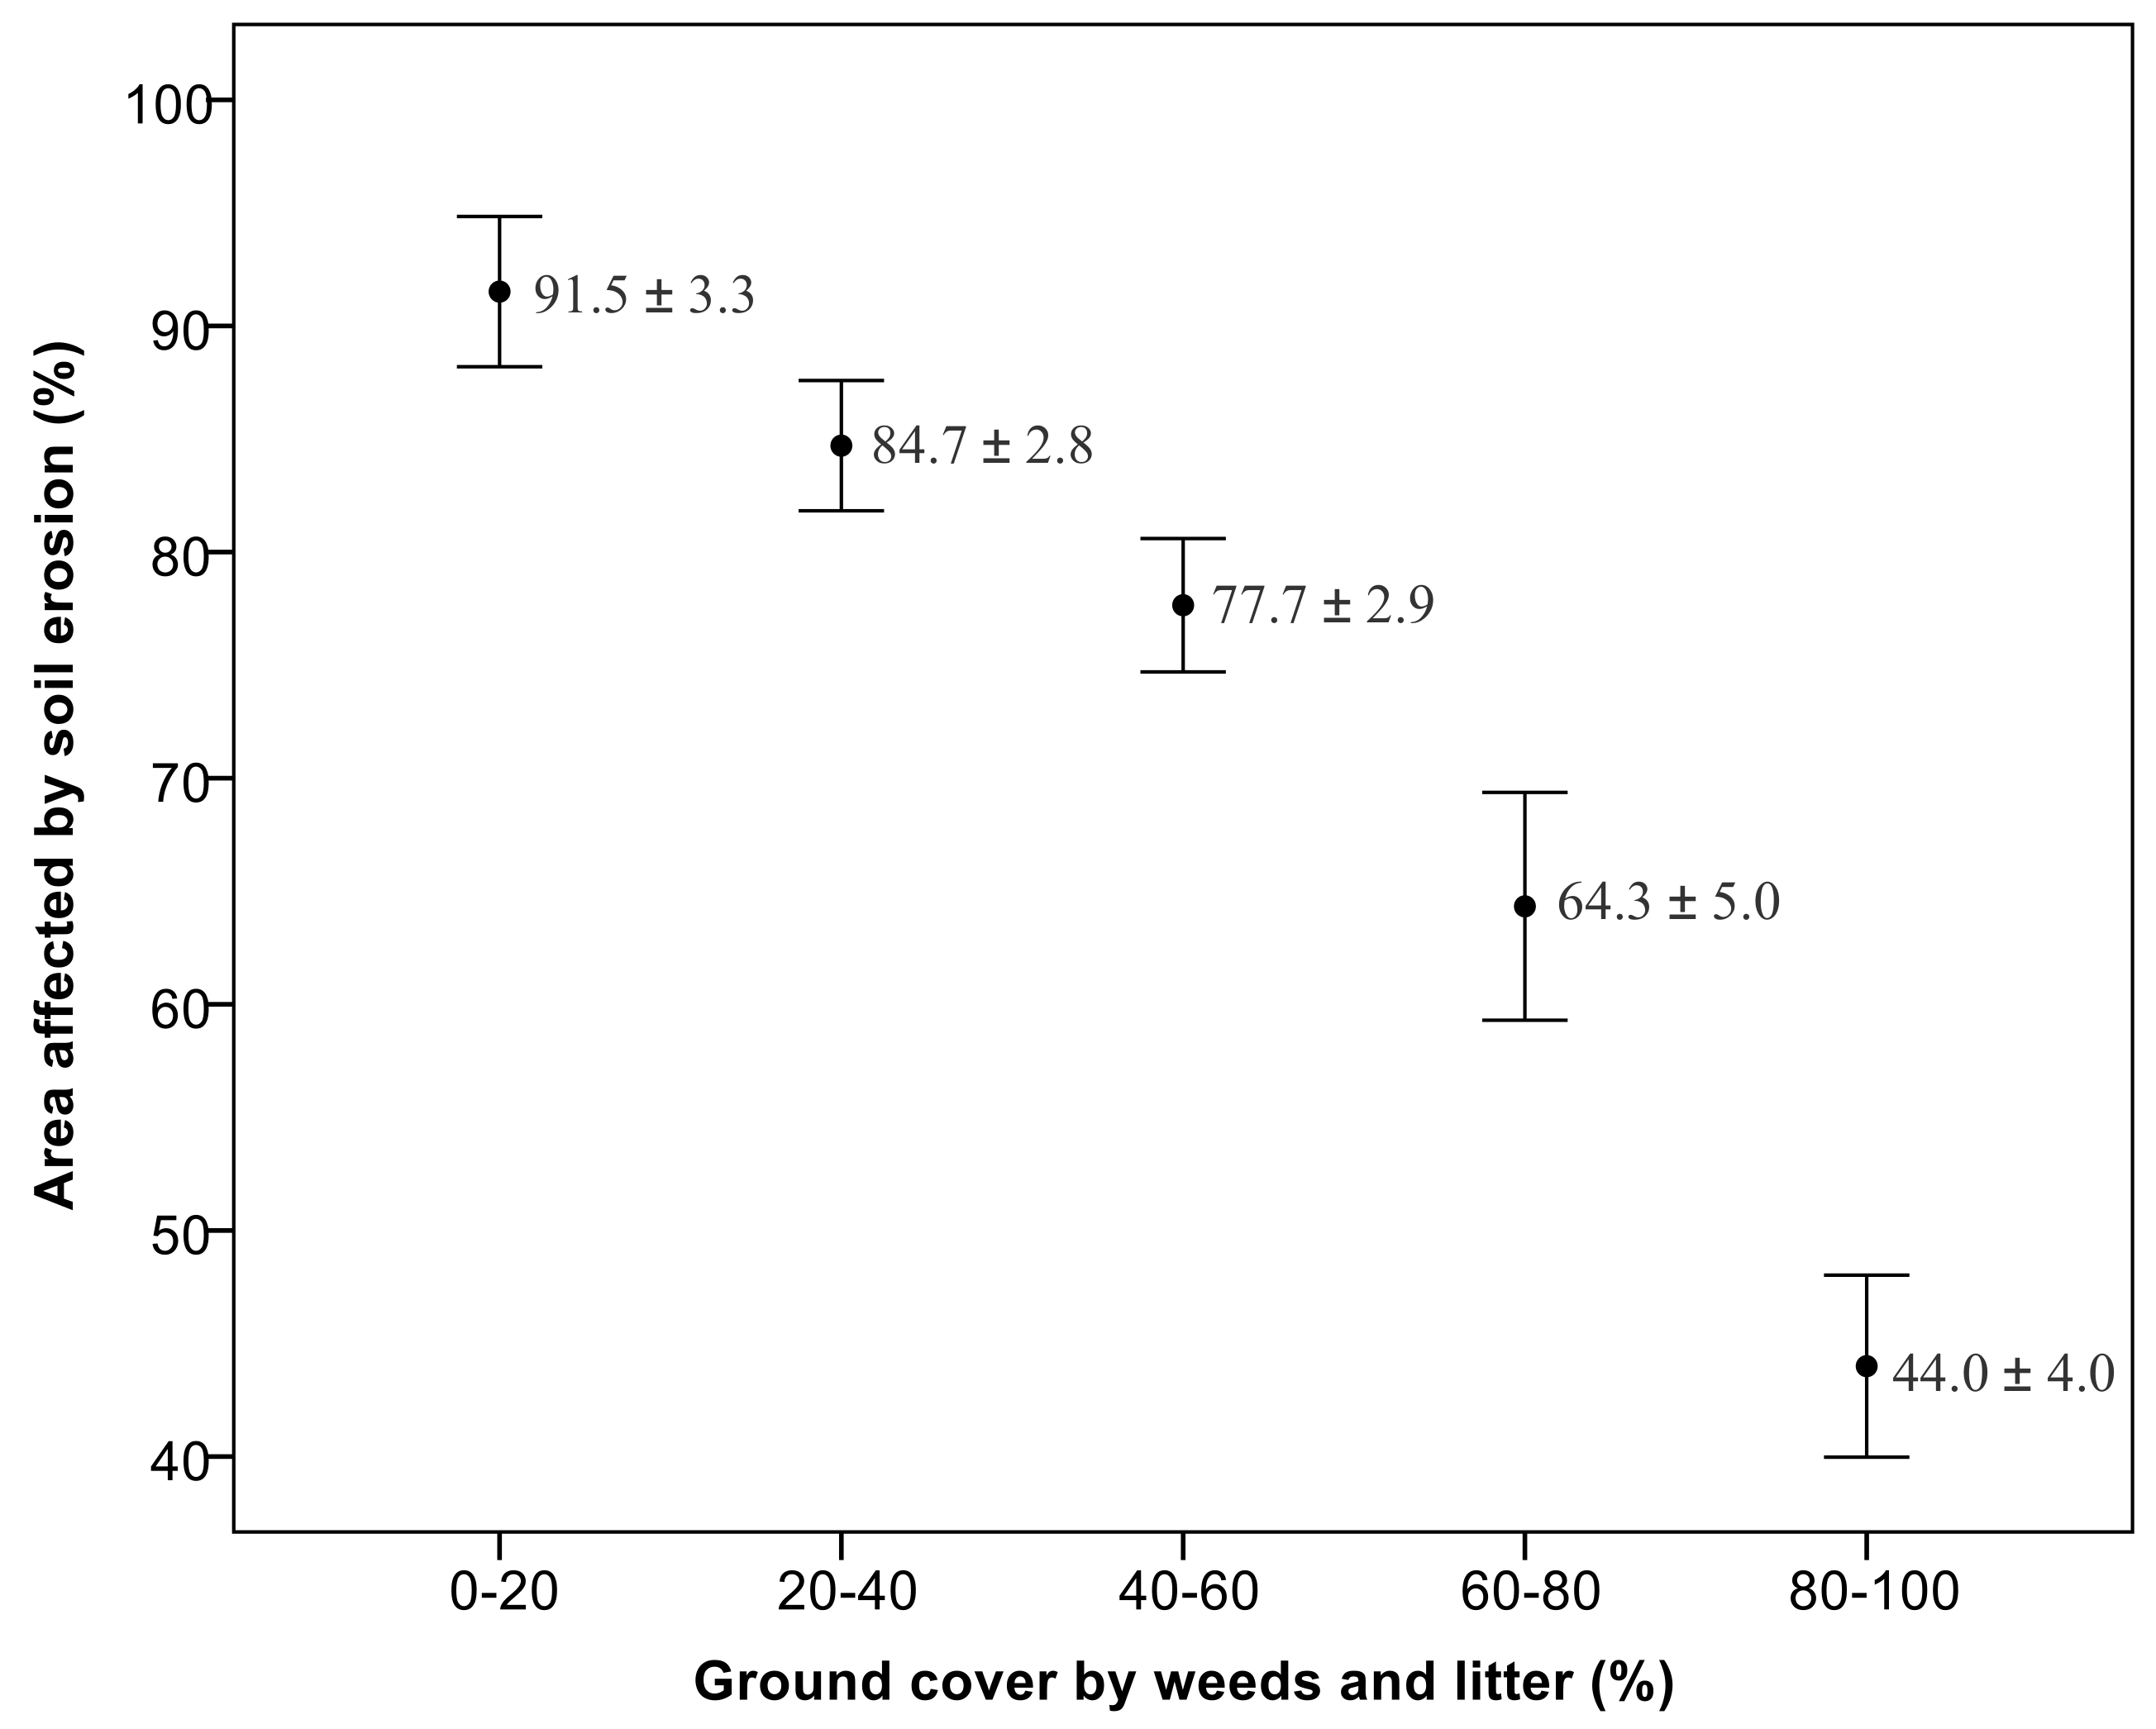
The analysis of variance revealed statistically significant differences (99% confidence ) between erosion and soil cover by weeds and litter (chi-square = 28.67, p < 0.001) (Table 6), clearly showing that the area affected by soil erosion falls as the plant cover of the soil increases (Figure 7). Thus, soils with less than 20% cover had the largest eroded area (91.5 ± 3.3%). These were followed by soils with 20 to 60% cover, where erosion did not fall below 75%. This level of erosion fell to 64.3 ± 5.0% in the soils with 60 to 80% cover and to 44.0 ± 4.0% with >80% cover.
The Mann–Whitney test of the relationship between area affected by soil erosion and pairs of total soil cover intervals indicated that erosion differences were statistically more significant at the 80% cover threshold (Pair 4, p = 0.007) (Table 7). Therefore, this value for soil cover can be taken as the threshold above which erosion is significantly reduced.
This threshold did not reflect effective erosion control. Thus, maize crops with 64% and 77% ground cover by weeds and litter were affected by erosion intensities of class 3 (severe) and 2 (moderate) (Table 2), respectively (Figure 8a,b), categories that do not represent effective erosion control according to Blanco’s verification method [26] (Table 2). Indeed, even the plot with 95% cover did not reduce erosion to class 1 (reduced) intensity, the category that has been considered satisfactory for adequate erosion control, because erosion was still present beneath the dense vegetal cover (Figure 8(c2)).

4. Discussion

The results obtained show that the threshold of 80% of ground cover by weeds and litter in cultures of maize–bean at 6 months after sowing did not correspond to effective erosion control. In the plots with the highest levels of ground cover, a large proportion of the surface area continued to be affected by soil erosion, at an average of 44.0% in plots with 80 to 100% cover. This figure is well above that observed in agricultural systems that achieve better erosion control results, such as agroforestry coffee systems, where only 10.5% of the soil area is reported to be affected [24].
The forest canopy changes the kinetic energy of rainfall by altering the size and velocity of the raindrops, and thereby changes the potential for the initiation of splash erosion [36]. The same effect could be expected in the case of crops, that is, the vegetal cover, comprised of the crop canopy cover (maize and bean) and of the ground cover (layer of weeds and litter), would protect the soil against the impact of rainfall and act as a barrier to surface runoff. The results obtained in this study of maize–bean plots at 6 months after sowing show that the soil cover provided by weeds was significantly correlated with the area affected by soil erosion, unlike the cover provided by crop canopy and plant litter. However, the variable that presented the best linear fit with the area affected by soil erosion was that of ground cover by weeds and litter. The litter layer did not correlate independently with the area affected by soil erosion, probably due to its low presence and considerable dispersal over the sampling plots. However, a clear relationship with erosion can be assumed, given that the dependent variable is best explained in terms of total soil cover. In other words, the results obtained highlight the importance of the litter layer in preventing erosion.
Previous studies of erosion in maize and bean cultivation have demonstrated the importance of plant litter ground cover in protecting against splash erosion and increasing resistance to surface water flow [25,37,38]. In addition, plant litter is an important source of organic matter, increasing the stability of soil aggregates and enhancing resistance to erosion [39,40].
Ground cover by weeds and litter in the maize–bean plots at 6 months after sowing contained a higher proportion of weeds (36.4 ± 4.4%) than of plant litter (13.3 ± 1.9%) (Table 1). When focusing solely on cases of maize–bean cultivation with over 80% cover, the differences are even larger. In these cases, plant litter accounts for only 15.7% of total ground cover, compared to 75.5% covered by weeds (Table 8). These values contrast with those reported in earlier studies of bean cultivation (16.7% and 35.4% weed and litter cover, respectively) [25] and of maize cultivation (0–1.2% weeds and 0–44.2% litter) [37].
The lower proportion of plant litter cover measured in the present study means that the soil was not effectively protected, as erosion was still present under the dense weed cover, while there was little plant litter. Under these conditions, the area affected by soil erosion remained high, because there was no surface litter cover to prevent runoff (Figure 8(c2)). In short, the increased canopy cover did not compensate for the observed lack of a substantial litter layer.
The results obtained showed that plant cover at the 3-month stage was lower than at the 6-month stage because this is when the surface presence of weeds was reduced by soil inversion, using hoes. Under these circumstances, the ground cover was insufficient to exert much control over erosion. Moreover, the resulting disturbance of the soil further increased its susceptibility to erosion [25]. In summary, the soil at this stage of the crop cycle was far removed from the ideal conditions for achieving erosion control, which accounts for the greater area affected by soil erosion.
The soil and vegetation management performed in the study area are key factors in explaining the considerable area of soil surface affected by erosion, and the impossibility of establishing an erosion threshold. Labrière et al. [8] and Derpsch et al. [41] argued that special attention should be paid to these factors in order to achieve effective control of erosion in tropical areas.
In the study area, soil loss was slight and widely dispersed during the two sampling periods. Soil loss was only recorded in 29 of the 43 study cases (14 at 3 months and 15 at 6 months). In the remaining plots, there was no erosion in rills and gullies during the sampling periods. Various reasons for this absence of erosion can be suggested. At the 3-month stage, there is a scant presence of rills because the soil is disturbed during tillage; this action eliminates the furrows and gullies that may have formed previously [31]. At the 6-month stage, the large amount of weed cover limits the formation of rills [31].

5. Conclusions

The mixed maize–bean crops studied, at 6 months after sowing, presented 15% less surface area affected by erosion than at 3 months after sowing (the eroded areas were 73.5 ± 3.0% and 88.4 ± 1.6%, respectively). The ground cover, consisting of weeds and plant litter, was inversely related to the area affected by soil erosion at 6 months after sowing. However, this factor could not be used to establish an erosion threshold for effective erosion control. Previous research has shown that ground cover by plant litter is the factor that is most strongly associated with reducing the area affected by soil erosion, and that it can be used to establish a useful threshold of erosion. However, the maize–bean crops analysed in this study, with a total ground cover ranging from 80% to 100%, bore a higher proportion of weed cover (75.5%) than of plant litter (15.7%). This low degree of plant litter cover, together with the continuing practice of tillage, explains the high values of area affected by soil erosion in the two crop stages and the impossibility of establishing an erosion threshold in relation to land cover management.

Author Contributions

R.B.S. designed the research framework and contributed with the application of methodology and statistical analysis. R.B.S. and F.E.N. wrote the paper, reviewed and approved the final version.

Funding

This study was performed within the framework of a Project of International University Volunteering in Cooperation for Development (funded by UMA-AACID), in collaboration with Association for Welfare, Progress and Development of Guatemala. The University of Málaga (Spain) provided financial support for this study, through the I Research and Transfer Plan (Research Project in International Cooperation).

Acknowledgments

We sincerely thank the anonymous reviewers for their useful comments and suggestions.

Conflicts of Interest

The authors declare no conflicts of interest.

References

  1. FAO. The State of Food-Based Dietary Guidelines in Latin America and the Caribbean; FAO: Rome, Italy, 2014; Available online: http://www.fao.org/3/a-i3677s.pdf (accessed on 10 January 2018). (In Spanish)
  2. FAO. Food and Agriculture Organization of the United Nations, FAOSTAT, 2017. Available online: http://data.un.org/Explorer.aspx?d=FAO (accessed on 15 October 2017).
  3. Klepek, J. Selling Guatemala’s next Green Revolution: Agricultural modernization and the politics of GM maize regulation. Int. J. Agric. Sustain. 2012, 10, 117–134. [Google Scholar] [CrossRef]
  4. Foley, J.A.; DeFries, R.; Asner, G.P.; Barford, C.; Bonan, G.; Carpenter, S.R.; Chapin, F.S.; Coe, M.T.; Daily, G.C.; Gibbs, H.K.; et al. Global consequences of land use. Science 2005, 309, 570–574. [Google Scholar] [CrossRef] [PubMed]
  5. FAO. The State of the World’s Land and Water Resources for Food and Agriculture. Managing Systems at Risk; Food and Agriculture Organization of the United Nations (FAO): Rome, Italy; Earthscan: London, UK, 2011; p. 285. Available online: http://www.fao.org/docrep/017/ i1688e/i1688e.pdf (accessed on 6 December 2017).
  6. El-Swaify, S.A. Factors affecting soil erosion hazards and conservation needs for tropical steeplands. Soil Technol. 1997, 11, 3–16. [Google Scholar] [CrossRef]
  7. Nyssen, J.; Poesen, J.; Deckers, J. Land degradation and soil and water conservation in tropical highlands. Soil Tillage Res. 2009, 103, 197–202. [Google Scholar] [CrossRef]
  8. Labrière, N.; Locatelli, B.; Laumonier, Y.; Freycon, V.; Bernoux, M. Soil erosion in the humid tropics: A systematic quantitative review. Agric. Ecosyst. Environ. 2015, 203, 127–139. [Google Scholar] [CrossRef] [Green Version]
  9. Augustine, C.M.J.; Vogt, K.A.; Harrison, R.B.; Hunsaker, H.M. Nitrogen-fixing trees in small-scale agriculture of mountainous southeast Guatemala. J. Sustain. For. 2007, 23, 61–80. [Google Scholar] [CrossRef]
  10. Wuddivira, M.N.; Stone, R.J.; Ekwue, E.I. Influence of cohesive and disruptive forces on strength and erodibility of tropical soils. Soil Tillage Res. 2013, 133, 40–48. [Google Scholar] [CrossRef]
  11. Fernandes, E.C.M.; Motavalli, P.P.; Castilla, C.; Mukurumbira, L. Management control of soil organic matter dynamics in tropical land-use systems. Geoderma 1997, 79, 49–67. [Google Scholar] [CrossRef]
  12. Lal, R. Soil erosion impact on agronomic productivity and environment quality. Crit. Rev. Plant Sci. 1988, 17, 319–464. [Google Scholar] [CrossRef]
  13. Campbell, L.C. Managing soil fertility decline. J. Crop Prod. 1998, 1, 29–52. [Google Scholar] [CrossRef]
  14. Pimentel, D.; Harvey, C.; Resosudarmo, P.; Sinclair, K.; Kurz, D.; McNair, M.; Crist, S.; Shpritz, L.; Fitton, L.; Saffouri, R.; et al. Environmental and economic costs of soil erosion and conservation benefits. Science 1995, 267, 1117–1123. [Google Scholar] [CrossRef] [PubMed]
  15. Öborn, I.; Vanlauwe, B.; Atta-Krah, K.; Thomas, T.; Phillips, M.; Schut, M. Integrated systems research for sustainable intensification of smallholder agriculture. In Sustainable Intensification in Smallholder Agriculture: An Integrated Systems Research Approach; Öborn, I., Atta-Krah, K., Phillips, M., Thomas, R., Vanlauwe, B., Brooijmans, W., Eds.; Routledge: London, UK; Earthscan Food and Agriculture: New York, NY, USA, 2017; pp. 32–46. [Google Scholar]
  16. Aguilar, E.; Peterson, T.C.; Ramírez, P.; Frutos, R.; Retana, J.A.; Solera, M.; Soley, J.; González, I.; Araujo, R.M.; Rosa, A.; et al. Changes in precipitation and temperature extremes in Central America and northern South America, 1961–2003. J. Geophys. Res. 2005, 110, D23107. [Google Scholar] [CrossRef]
  17. IPCC. Global Warming of 1.5 °C. Chapter 3: Impacts of 1.5 °C Global Warming on Natural and Human Systems; Intergovernmental Panel on Climate Change: Geneva, Switzerland, 2018; Available online: https://www.ipcc.ch/pdf/special-reports/sr15/sr15_chapter3.pdf (accessed on 10 November 2018).
  18. Neelin, J.D.; Münnich, M.; Su, H.; Meyerson, J.E.; Holloway, C.E. Tropical drying trends in global warming models and observations. Proc. Natl. Acad. Sci. USA 2006, 103, 6110–6115. [Google Scholar] [CrossRef] [PubMed] [Green Version]
  19. Hoyos, C.D.; Agudelo, P.A.; Webster, P.J.; Curry, J.A. Deconvolution of the factors contributing to the increase in global hurricane intensity. Science 2006, 312, 94–97. [Google Scholar] [CrossRef] [PubMed]
  20. Kang, M.S.; Banga, S.S. Global agriculture and climate change. J. Crop Improv. 2013, 27, 667–692. [Google Scholar] [CrossRef]
  21. Hertel, T.W.; Burke, M.B.; Lobell, D.B. The poverty implications of climate-induced crop yield changes by 2030. Glob. Environ. Chang. 2010, 20, 577–585. [Google Scholar] [CrossRef] [Green Version]
  22. Lee, D.R.; Edmeades, S.; De Nys, E.; McDonald, A.; Janssen, W. Developing local adaptation strategies for climate change in agriculture: A priority-setting approach with application to Latin America. Glob. Environ. Chang. 2014, 29, 78–91. [Google Scholar] [CrossRef]
  23. Jones, P.G.; Thornton, P.K. The potential impacts of climate change on maize production in Africa and Latin America in 2055. Glob. Environ. Chang. 2003, 13, 51–59. [Google Scholar] [CrossRef]
  24. Blanco, R.; Aguilar, A. Soil erosion and erosion thresholds in an agroforestry system of coffee (Coffea arabica) and mixed shade trees (Inga spp. and Musa spp.) in Northern Nicaragua. Agric. Ecosyst. Environ. 2015, 210, 25–35. [Google Scholar] [CrossRef]
  25. Blanco, R.; Aguilar, A. The erosion threshold for a sustainable agriculture in cultures of bean (Phaseolus vulgaris L.) under conventional tillage and no-tillage in Northern Nicaragua. Soil Use Manag. 2016, 32, 368–380. [Google Scholar] [CrossRef]
  26. Blanco, R. An erosion control and soil conservation method for agrarian uses based on determining the erosion threshold. MethodsX 2018, 5, 761–772. [Google Scholar] [CrossRef] [PubMed]
  27. Hartemink, A.E. Soils are back on the global agenda. Soil Use Manag. 2008, 24, 327–330. [Google Scholar] [CrossRef] [Green Version]
  28. Eakin, H.; Lemos, M.C. Adaptation and the state: Latin America and the challenge of capacity-building under globalization. Glob. Environ. Chang. 2006, 16, 7–18. [Google Scholar] [CrossRef]
  29. Eakin, H.; Lemos, M.C. Institutions and change: The challenge of building adaptive capacity in Latin America. Glob. Environ. Chang. 2010, 20, 1–3. [Google Scholar] [CrossRef]
  30. FAO. Visual Soil Assessment. Field Guides; FAO: Rome, Italy, 2008; Available online: http://www.fao.org/docrep/010/i0007e/i0007e00.htm (accessed on 10 September 2017).
  31. Morgan, R.P.C. Soil Erosion and Conservation, 3rd ed.; Blackwell Publishing Ltd.: Hoboken, NJ, USA, 2005. [Google Scholar]
  32. FAO-ISRIC-ISSS. World Reference Base for Soil Resources; World Soil Resources Report; Food and Agriculture Organization of the United Nations: Rome, Italy, 1998; Volume 84. [Google Scholar]
  33. Enz, M.; Dachler, C. Compendium of Growth Stage Identification Keys for Mono- and Dicotyledonous Plants. Extended BBCH scale. AgrEvo-Basf-Bayer-Novartis. 1997. Available online: http://www.gartneriraadgivningen.dk/upl/website/bbch-skala/scaleBBCH.pdf (accessed on 9 November 2018).
  34. Bergsma, E.; Charman, P.; Gibbons, F.; Hurni, H.; Moldenhauer, C.C.; Panichapong, S. Terminology for Soil Erosion and Conservation; ISSS-ITC-ISRIC: Wageningen, The Netherlands, 1996; Available online: http://library.wur.nl/isric/fulltext/isricu_i24693_001.pdf (accessed on 10 September 2017).
  35. Stocking, M.; Murnaghan, N. Handbook for the Field Assessment of Land Degradation; Earthscan Pub. Ltd.: London-Sterling, VA, USA, 2001. [Google Scholar]
  36. Brandt, J. The transformation of rainfall energy by a tropical rain-forest canopy in relation to soil-erosion. J. Biogeogr. 1988, 15, 41–48. [Google Scholar] [CrossRef]
  37. Van Dijk, P.M.; Van der Zijp, M.; Kwaad, F.J.P.M. Soil erodibility parameters under various cropping systems of maize. Hydrol. Process. 1996, 10, 1061–1067. [Google Scholar] [CrossRef]
  38. Bravo-Espinosa, M.; Mendoza, M.E.; Medina-Orozco, L.; Prat, C.; García-Oliva, F.; López-Granados, E. Runoff, soil loss, and nutrient depletion under traditional and alternative cropping systems in the transmexican volcanic belt, Central Mexico. Land Degrad. Dev. 2009, 20, 640–653. [Google Scholar] [CrossRef]
  39. Barthès, B.; Azontonde, A.; Boli, B.Z.; Prat, C.; Roose, E. Field-scale run-off and erosion in relation to topsoil aggregate stability in three tropical regions (Benin, Cameroon, Mexico). Eur. J. Soil Sci. 2000, 51, 485–495. [Google Scholar] [CrossRef]
  40. Rachman, A.; Anderson, S.H.; Gantzer, C.J.; Thompson, A.L. Influence of long-term cropping systems on soil physical properties related to soil erodibility. Soil Sci. Soc. Am. J. 2003, 67, 637–644. [Google Scholar] [CrossRef]
  41. Derpsch, R.; Sidiras, N.; Roth, C.H. Results of studies made from 1977 to 1984 to control erosion by cover crops and no-tillage techniques in Paraná, Brazil. Soil Tillage Res. 1986, 8, 253–263. [Google Scholar] [CrossRef]
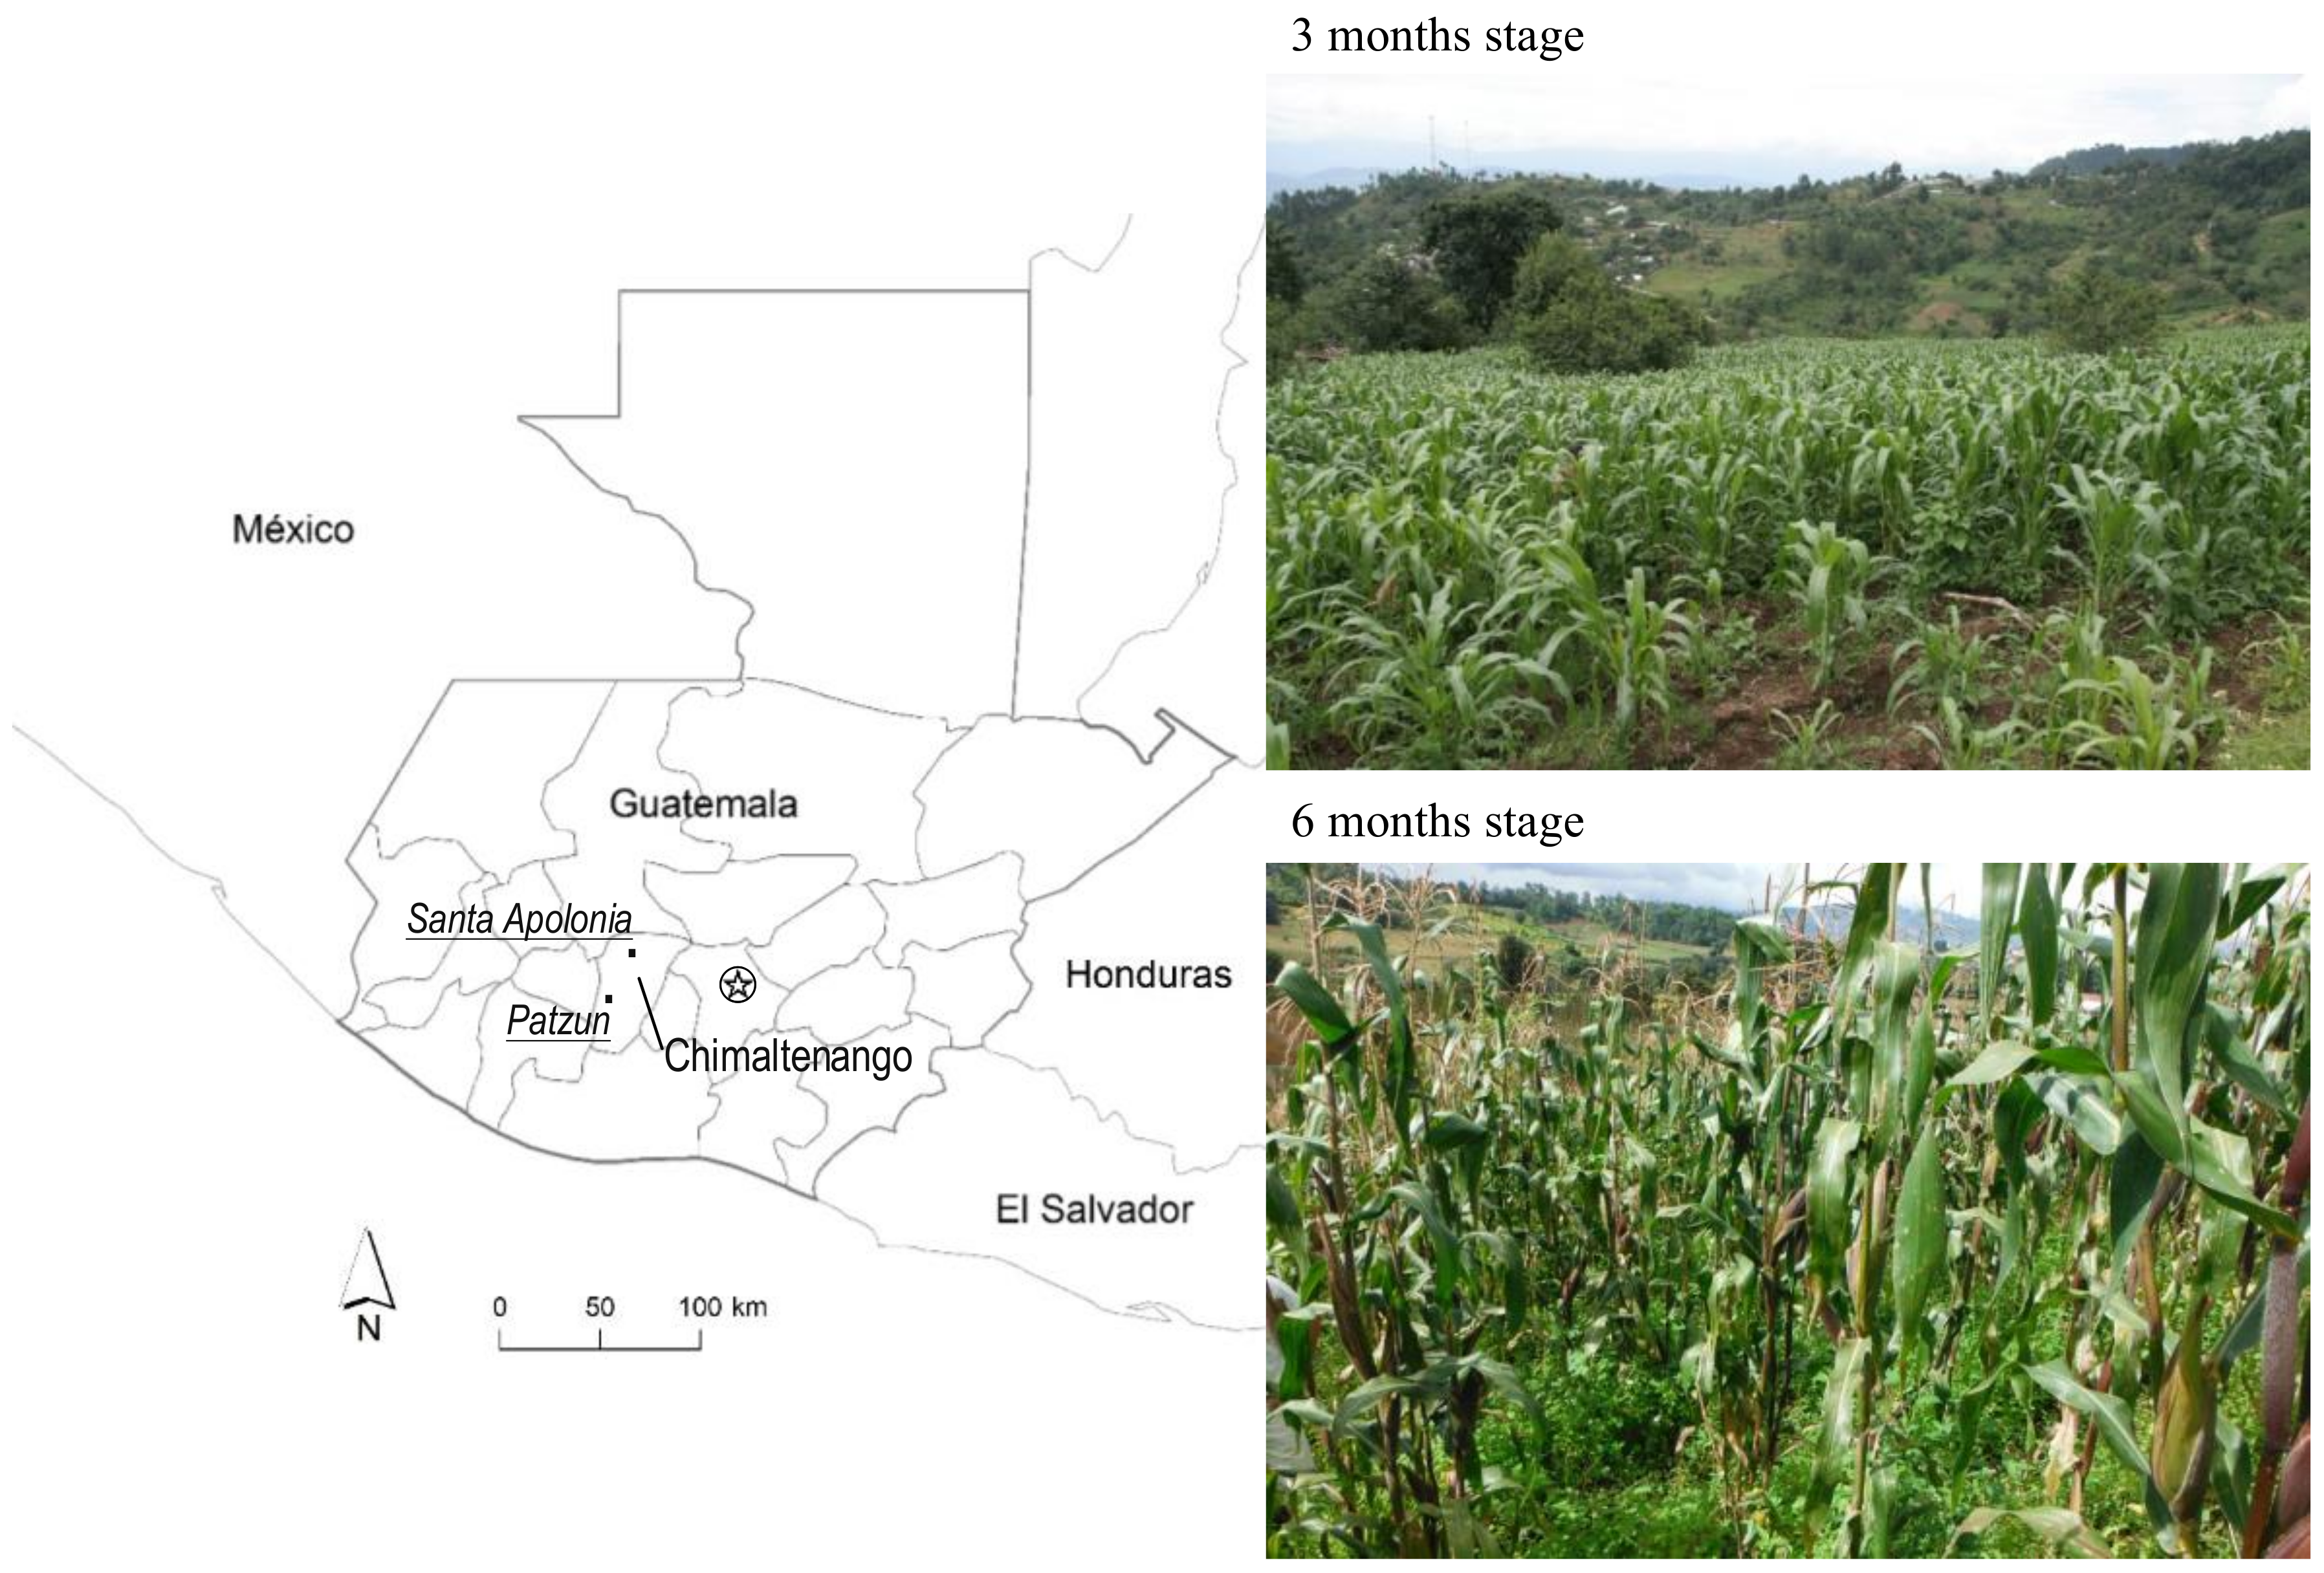
Figure 1. Location of study sites and photos of the crop stages, at 3 and 6 months after sowing.
Sustainability 10 04654 g001
Figure 2. Cycle of mixed maize–bean cultivation in the mountains of Chimaltenango (Guatemala) and sampling periods (at 3 and 6 months after sowing).
Sustainability 10 04654 g002
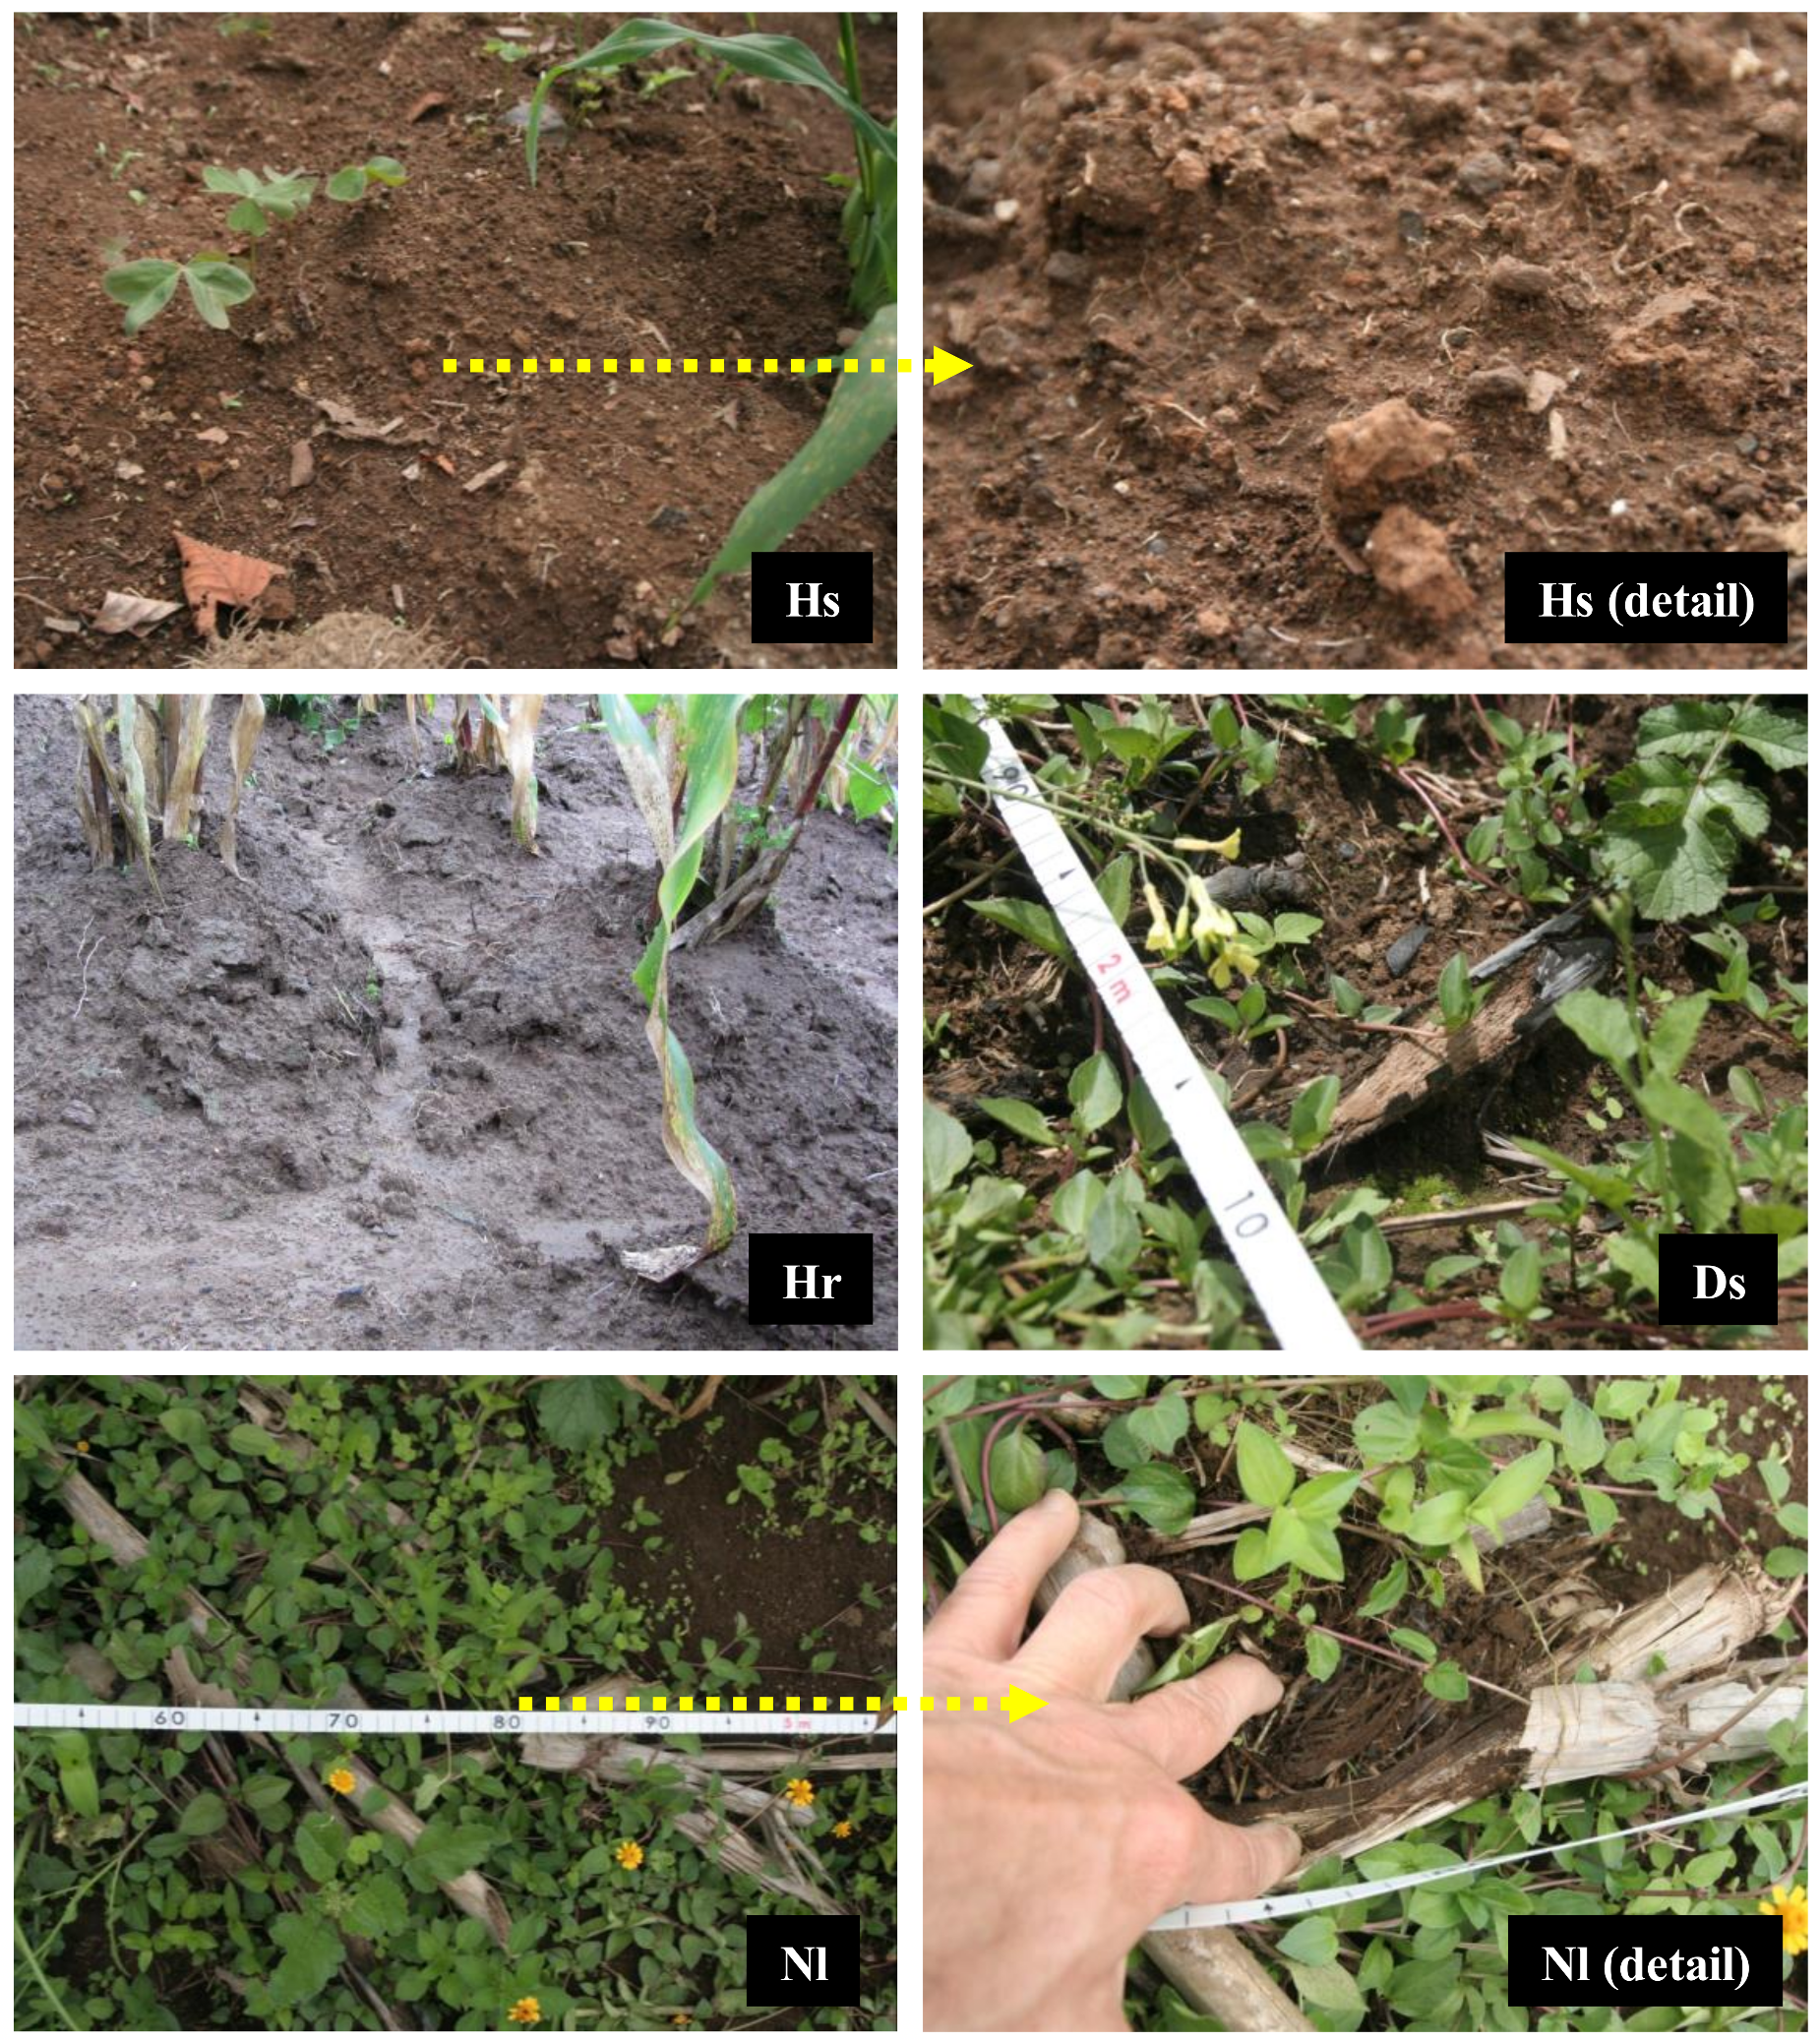
Figure 3. Common surface processes affecting the soil in maize–bean cultures: (Hs) Sheet erosion. The soil surface presents a moderately rough texture, and the edges are very rounded. Numerous erosion pedestals can be seen in the detail photo. (Hr) Rill erosion. (Ds) Soil deposition, favoured by the maize stalks remaining on the soil surface and affected by sheet erosion. (Nl) Non-eroded soil beneath a cover of litter layer. Under this cover, decomposing plant remains are visible, which indicates that the soil is not affected by erosion (detail photo).
Sustainability 10 04654 g003
Figure 4. Diagram of sampling process by transects and grids.
Sustainability 10 04654 g004
Figure 5. Area of soil surface affected by erosion in maize–bean cultures at 3 and 6 months after sowing (n = 43). Values are mean ± standard error.
Sustainability 10 04654 g005
Figure 6. Relationships between erosion-related soil cover variables and the soil surface area affected by erosion in the maize–bean cultivation plots at 3 and 6 months after sowing.
Sustainability 10 04654 g006
Figure 7. Area affected by soil erosion with increasing ground cover by weeds and litter in maize–bean cultivation plots at 6 months after sowing (n0–20 = 9, n20–40 = 10, n40–60 = 8, n60–80 = 8, n80–100 = 8). Values are mean ± standard error.
Sustainability 10 04654 g007
Figure 8. Intensity of soil erosion by water in maize–bean cultivation plots at 6 months after sowing and with different degrees of ground cover by weeds and litter): (a) Plot with 64% cover and 87% eroded surface. Affected by Class 3 erosion (severe): (b) Plot with 77% cover and 53% eroded surface. Affected by Class 2 erosion (moderate): (c) Plot with 95% cover and 32% eroded surface. Affected by Class 2 erosion (moderate).
Sustainability 10 04654 g008
Table 1. Visual indicators of surface processes affecting the soil in maize–bean cultures (adapted from Blanco [26]).
T. Mechanical soil disturbance by trampling, affected by erosion, or erosion-susceptible
1. (Tes) Soil disturbed by trampling and susceptible to erosion (but not visible at present)
2. (Ti/Ts/Tr/Tg) Soil disturbed by trampling and affected by splash erosion (raindrop impact)/by sheet erosion/by erosion in rills/by erosion in gullies
H. Mechanical soil disturbance by tool (hoe), affected by erosion, or erosion-susceptible
1. (Hes) Soil disturbed by tool use and susceptible to erosion (but not visible at present)
2. (Hi/Hs/Hr/Hg) Soil disturbed by tool use and affected by splash erosion (raindrop impact)/by sheet erosion/by erosion in rills/by erosion in gullies
D. Soil deposition affected by erosion or erosion-susceptible
1. (Des) Soil deposition susceptible to erosion (but not visible at present)
2. (Di/Ds/Dr/Dg) Soil deposition affected by splash erosion (raindrop impact)/by sheet erosion/by erosion in rills/by erosion in gullies
N. No erosion
1. (Nw) No evidence of erosion beneath cover of weeds
2. (Nl) No evidence of erosion beneath litter layer
O. Others
1. (Or) Stones
2. (Oa) Animals: tracks, faeces, carcasses, others.
Table 2. Qualitative classification of the evaluation of the intensity of soil erosion by water [26].
Class (cod)Intensity of ErosionExplanation
0None/very slightThe soil is not affected or is only slightly affected by erosion. In the latter case, it is not immediately apparent. Evidence of erosion is occasional and only present in certain specific places, such as at the base of trees, bushes, or rocks.
1SlightThe soil is somewhat affected by erosion, and this is clearly visible throughout the plot. The evidence of erosion is more widespread and also more apparent than in the previous case, but is only clearly concentrated in very specific locations.
2ModerateThe soil is clearly affected by a moderate degree of erosion. Evidence of erosion is widespread and may be concentrated at any point on the plot, but the majority of the surface area remains unaffected by erosion.
3SevereThe soil is strongly affected by erosion. The majority of the surface area is affected by erosion (in case of doubt, the plot is classified as Class 2).
Table 3. Crop canopy and ground cover of the mixed cultivation of maize and beans at two stages of the agricultural cycle (at 3 and 6 months after sowing) (n = 43).
CharacteristicsAbbreviation3-Month Stage 6-Month Stage
Mean ± Standard ErrorMean ± Standard Error
Crop canopy cover (maize and bean) (%)CC28.1 ± 2.038.8 ± 2.5
Ground cover by weeds (%)GCW11.9 ± 2.236.4 ± 4.4
Ground cover by litter (%)GCL12.2 ± 1.513.3 ± 1.9
Ground cover by weeds and litter (%)GCW-L24.1 ± 2.949.7 ± 4.4
Crop canopy and ground cover (%)CC–GCW-L52.2 ± 3.888.6 ± 5.1
Table 4. Surface processes that affected the soil at two stages of the maize–bean cultivation cycle (at 3 and 6 months after sowing) (n = 43).
Surface Processes and ActionsAbbreviation3-Month Stage6-Month Stage
Mean ± Standard ErrorMean ± Standard Error
Soil disturbed by trampling and susceptible to erosion (but no erosion currently visible) (%)Tes1.0 ± 0.20.1 ± 0.1
Soil disturbed by trampling and affected by sheet erosion (%)Ts0.3 ± 0.10
Soil disturbed by hoe and susceptible to erosion (but no erosion currently visible) (%)Hes3.2 ± 1.20.1 ± 0.1
Soil disturbed by hoe and affected by splash erosion (%)Hi15.2 ± 2.912.3 ± 2.2
Soil disturbed by hoe and affected by sheet erosion (%)Hs50.5 ± 1.951.9 ± 2.0
Soil disturbed by hoe and affected by rill erosion (%)Hr1.0 ± 0.20.2 ± 0.2
Soil deposition susceptible to erosion (but no erosion currently visible) (%)Des2.9 ± 0.81.9 ± 0.4
Soil deposition affected by splash erosion (%)Di0.5 ± 0.40.5 ± 0.2
Soil deposition affected by sheet erosion (%)Ds21.1 ± 3.08.5 ± 1.1
No evidence of erosion beneath cover of weeds (%)Nw1.1 ± 0.69.3 ± 1.9
No evidence of erosion beneath litter layer (%)Nl3.4 ± 0.712.6 ± 1.9
Other topsoil characteristics (stones) (%)Or02.5 ± 0.6
Area affected by soil erosion (total) (%)Et88.4 ± 1.673.5 ± 3.0
Area presenting no evidence of erosion (total) (%)Ene11.6 ± 1.624.0 ± 3.0
Soil loss (m3 ha−1)Esl1.5 ± 0.63.8 ± 1.6
Table 5. Correlation between soil erosion and vegetal cover of the maize–bean cultivation plots at 3 and 6 months after sowing (n = 43).
EtEslCCGCWGCLGCW-LCC–GCW-L
3-month stage
Et10.15−0.32 *−0.35 *−0.10−0.27−0.39 *
Esl 10.10−0.05−0.15−0.090.05
CCB 10.29−0.210.060.67 **
GCW 10.300.82 **0.72 **
GCL 10.74 **0.40 **
GCW-L 10.72 **
CC–GCW-L 1
6-month stage
Et10.02−0.20−0.75 **−0.06−0.86 **−0.85 **
Esl 1−0.110.100.060.04−0.04
CC 10.010.100.100.45 **
GCW 1−0.200.92 **0.78 **
GCL 10.080.08
GCW-L 10.89 **
CC–GCW-L 1
Et: area affected by soil erosion; Esl: soil loss; CC: Crop canopy cover (maize and bean); GCW: Ground cover by weeds; GCL: Ground cover by litter; GCW-L: Ground cover by weeds and litter; CC-GCW-L: Crop canopy and ground cover. * Significant correlations at p < 0.05; ** Significant correlations at p < 0.01.
Table 6. Kruskall–Wallis test of the relation between area affected by soil erosion and ground cover by weeds and litter (grouping variable) in maize–bean cultivation plots at 6 months after sowing.
Cover Intervals (%)
(n for Each Interval)
Results
0–20, 20–40, 40–60, 60–80, 80–100
(n = 9, 10, 8, 8, 8)
Chi-square = 28.67, p < 0.001
Table 7. Mann–Whitney test of the relationship between area affected by soil erosion and pairs of intervals for ground cover by weeds and litter (grouping variable) corresponding to analyses in Table 6.
Analysis Pairs (Gradient Interval, %)Results
Pair 1 (0–20 to 20–40)U = 23.00, p = 0.079
Pair 2 (20–40 to 40–60)U = 26.00, p = 0.237
Pair 3 (40–60 to 60–80)U = 14.50, p = 0.065
Pair 4 (60–80 to 80–100)U = 7.50, p = 0.007
Table 8. Proportions of ground cover by weeds and litter and area affected by soil erosion in maize–bean cultivation plots at 6 months after sowing, with over 80% soil cover.
Sampling Plots No.Ground Cover by Weeds (%)Ground Cover by Litter (%)Total Ground Cover (%)Eroded Area (%)
164.021.385.349.3
280.114.794.832.0
390.62.793.358.7
486.79.396.029.3
577.38.085.358.7
699.01.010044.0
726.662.789.345.3
880.05.385.334.7
MEAN VALUE75.515.791.244.0