1. Introduction
1.1. International Market of Vietnam
At the start of the mid-1980s, Vietnam was considered an underdeveloped country under a socialist economic system. Then, the Doi-Moi movement was launched in 1986, which focused on a Socialist-oriented market economy, focusing on improving the economic growth and development in Vietnam by increasing its global contribution [
1]. The Doi-Moi movement was motivated by the inflation rate of the market, per capita trade, famines, fiscal deficits, and poor revenue in Vietnam. In addition, the country also saw low export activities in comparison to the rate of imports made [
2]. The Doi-Moi movement included the reformation of foreign investment law; it increased the independence of private organizations and agricultural and rural development, and it improved banking systems, taxation laws, national expenditures, the ease of exporting and import, tariffs, and civil laws. These extensive reformation strategies helped the government to reduce the pressure of inflation and improve the economic climate of Vietnam [
1,
2]. This also improved the value of exports compared to the value of imports.
In the Vietnamese economy, the degree of “Internationalization”, a process of business evolution according to Johanson et al. [
3] and Melin [
4], was accelerated when it became a member of the economic community of the Association of Southeast Asian Nations (ASEAN) in 1995 and connected with the World Trade Organization (WTO) in 2007 [
5,
6]. The association with these organization directly increased Vietnam’s competition and supported the development of new, market-oriented legal and judicial regimes [
7]. This led to an increase in the foreign direct investment (FDI) by
$71.7 billion in 2008, and the economy of Vietnam increased at an annual average rate of 6.3% from 2007–2012 [
8]. This has widened Vietnam’s opportunities for renewable energy projects, technological advancement in agriculture, and so on, in several sectors, apart from the traditional sectors like the garment, footwear, and electronics industries [
9]. Vietnam’s ease-of-doing-business index, estimated by the World Bank, increased to 68 in 2018 from 78 in 2017, out of the 190 countries [
9]. This index measures the aspects of regulation that affect some areas of the life of a business, such as getting credit, getting electricity, paying taxes, resolving solvency, and others [
10]. According to the World Bank [
10], the 34 countries that are considered to have economies that are improving the most include Vietnam. Vietnam also achieved the 55th rank in a Global competitiveness report from amongst 137 countries in 2017–2018, showing a jump of five places from last year [
11]. In the recent global innovation index (GII) of 2017, which measures various ideas of innovation and involves the political environment, education, infrastructure, and the business market, Vietnam jumped 12 places to 47th from among the 127 countries, with a score of 37.8, its highest rank during the last 10 years [
12].
Most of the FDI comes from Asian countries [
10]. It was recorded that there were a total of 115 foreign investors in Vietnam in 2017. It is a fact that Japan and South Korea caused half of the total FDI. Japan’s investment capital accounted for
$9.11 billion, 25.4% of the total FDI [
9]. South Korea contributes to 23.7% of Vietnam’s total FDI, with investments totaling
$8.49 billion, whereas Singapore’s investment was
$5.3 billion, representing 14.8% of the total FDI in 2017. Surprisingly, China appeared to be the fourth largest investor in Vietnam [
9].
FDI inflows play an extremely important role in international trade in Vietnam. After 2000, the FDI in the processing industries and export-oriented fields has been rising significantly, which leads to a surge in not only the total exports, but also in the imports of Vietnam in recent years [
13]. The FDI inflow increased from 3.4% in 2005 to 6.1% in 2016 [
14].
More than ever before, Vietnamese firms are able to absorb external resources, technology, and know-how, so as to improve their competitive positions. They have also been involved in negotiations for the EU–Vietnam Free Trade Agreement (FTA’s) and the Trans-Pacific Partnership (TPP), which will be in effect by 2018. This will make Vietnam a clear “winner”, as it will have most of the benefits, making it a prime investment destination in the international market in the future [
15]. As it has signed 12 complete free trade agreements (FTAs), three of which have been under negotiation over the years [
16], the FTAs will eliminate most of the tariffs on Vietnamese goods trading with the 12 member states, allowing for a nearly 0% rate of tariffs in the future, and making Vietnam more competitive in the exportation arena [
17]. Vietnam’s gross domestic product (GDP) increased to 6.81% in 2017, had a record high FDI, and had its trade figures achieved an all-time high of
$400 billion in 2017 [
9]. Therefore, Vietnam will remain an attraction for investors in 2018.
1.2. Exports from Vietnam
In 2018, 10% of the domestic production was exported, and the growth of exports accounted for only 3.5% per annum from 1977 to 1988 [
18]. But after liberalizing markets, the foundation of private firms, integration of the world economy, and ever-increasing FDI inflows increased exports growth and product development [
15]. According to the General Statistics Office of Vietnam in 2018 [
19], the main products of exports in recent years include raw products, including mineral resources; agriculture; forestry; and fishery products. In 2015, its agricultural and hunting contributed about a 1.9% share in the world, forestry and fishing contributed 0.4%, mining contributed 0.3%, and petroleum contributed 0.4% share in the world [
20].
In 2017, the exports turnover of goods was valued at
$154 billion, which shows a 19.8% increase from the last year [
21]. Out of the total export turnover of goods, the domestic economic sector was estimated at
$43.2 billion, and showed a 16.8% rise relative to the previous year. Also, the FDI (including crude oil) achieved
$110.8 billion, with 21% increase in 2017 [
21], while the import turnover of goods reached
$154.5 billion. The trade deficit reached
$442 million in 2017, whilst the FDI sector showed a trade surplus of
$17.64 billion [
21].
On the other hand, the export turnover of services reached
$13.1 billion, up 7.3% over 2016. Out of the total services, the exports of travel service achieved
$8.9 billion, representing 67.6% of the total export turnover, and was up 7.4%; the exports in transportation service attained
$2.6 billion, at 19.7%, which was up by 5.7% [
21].
According to the world trade value by country and region (2016), Vietnam was placed at number 1766 (in
$100 million USD) in terms of export value in the world economy, contributing 1.1% to the world exports [
22]. High growth rates of a 9.0% increase in exports were recorded in 2016. In 2016, its export growth was mainly due to growth in telephones, mobile phones, and their parts, as well as computers, electrical products, and their parts [
22]. In 2016, Vietnam entered the top ten exporters of textiles for the first time, with a 2% export share and positive 9% annual percentage change [
23]. Processed products comprised of 30% of the total exports, whereas crude oil comprised of about 20% of the total exports. The mining sector also plays an important role in the exports structure. According to The National of Assembly Vietnam in 2012, the total enterprises rose from 427 enterprises in 2000 to about 2000 enterprises in 2014 [
24]. Amongst all of these enterprises, small and medium scale enterprises make up 60%. It can also be seen that there has been a significant decline in the relative importance of agriculture exports, whilst the industrial shares of Vietnamese trade has seen a considerable rise during the last ten years. Therefore, it can be implied that the main export merchandise of Vietnam includes raw materials and manufacturing, which are again based upon low value-added and labor-intensive productions.
1.3. Economic Contribution of Export Good from Vietnam
As trade in Vietnam has increased sharply, it shows that its economy has integrated very quickly into the world economy. It started with very low levels of imports and exports as a percent of the GDP, then trade increased sharply, whereas the imports remained usually higher than the exports. The late 1980s gave evidence of a sharp increase in the trade openness of the economy, then showed a rapid rise in the next decade [
25]. By 2000, the total trade as a share of the GDP became more than three times the level of the late 1980s.
In past years, the government has devalued its currency seven times, which helps to change export competitiveness significantly, as well as lessening its trading band. Vietnam suffered from a high-level fiscal deficit of 7.2% of the GDP in 2009, which gradually brought down the GDP to 2.5% in 2012, due to a decrease in investment in public spending [
26].
According to the World Bank Group [
27], the sum of the exports and imports as a percentage of the GDP reached around 200% in 2015. However, some challenges remain; reliance on trade and foreign investment makes Vietnam open to global economic certainty [
28]. There is a low demand in its major trading partners, and interest rate increases in the United States could also result in capital outflows. Also, there is a high reliance on imports from Asia-Pacific, especially China, which makes Vietnam vulnerable. Furthermore, a report from Euromonitor International [
28] in 2018 shows that Vietnam’s productivity in the labor market has been lower relative to its regional peers, and that it lacks in vocational skills.
Vietnam’s total export value has increased by 134.9% from 2009–2013 [
29]. Out of which, marginal growth due to world trade’s growth increased by 48.7%, growth due to product geographic specialization increased by 3.0%, and growth due to competitiveness increased by 84.4%. Only growth due to specialization declined by 1.2% during this period [
29]. The ratio of exported services to total exports fell from 11.6% in 2005 to 7.6% in 2012, and to 7.6% in 2014. Vietnam’s service trade balance has constantly shown a negative balance (i.e., crucial services such as transportation, telecommunication, finance, insurances etc., all suffered from deficits). However, in the year 2016, the export value of goods from Vietnam rose to
$207 billion, which also led to the positive trade balance of
$11 billion. Moreover, it was also reported by the Government of Vietnam that the export–import turnover was estimated to be
$400 billion in the 2017 financial year [
21]. It was also estimated that the export turnover of Vietnam reached increased by 21.1% in the 2017 financial year. An increased volume of exports has helped generate a trade surplus of
$2.7 billion, and the export value is expected to rise by 7–8% by the 2018 financial year [
20].
1.4. The Scope of the Study
The economic revolution in Vietnam has been able to attract many international markets. However, it is important to understand which of the international markets have been efficiently produced in the economic growth of Vietnam. The innovative point of this study compared with previous studies is the application of the integrated DEA model, which combines Super SBM and the Malmquist Productivity Index, as well as the indicators for evaluating the output efficiency of export goods and of selecting the most effective export markets. This will help in the recognition of new international markets, especially for a country like Vietnam, which is a typical example for conduct export. Another objective of the study is to assess the most efficient country with respect to export business with Vietnam, so that other developing economies too can consider choices for the international market.
In addition, the study will provide information on the impact of import tariffs, exchange rates, and the ease of doing business of Vietnam on the export of goods and services to international markets. In this regard, the research question of the study is which are the most productive export markets for Vietnam? The study will also address another research question, which is, how does the tariffs, exchange rate, and ease of doing business of Vietnam impact the export of goods and services of international markets?
In previous studies, there was a lack of information on the productivity of international markets, with respect to the export market of Vietnam. In addition, previous studies have not used the international export market of Vietnam for the export of goods for developing nations. The former also focused on the ease of doing business. Furthermore, the previous studies lacked an assessment of the impact of import tariffs and exchange rates on the export market with respect to Vietnam. These gaps have been covered and assessed in this study in order to select international markets for the export of goods for developing nations.
2. Literature Review
There are various studies that have demonstrated interest in the DEA model and international market selection. However, none of the previous research has addressed the integration of the DEA approach for selecting export markets for the case in Vietnam, or taking lessons for developing countries. A number of previous studies focused on topics such as data envelopment analysis for the international export market, Vietnam’s exports, and DEA for international market selection, which given below.
2.1. Data Envelopment Analysis for International Export Market
DEA is a benchmarking technique and is considered as a very important service management tool. It is used as an efficiency and performance measurement tool, based on the “data-oriented” approach. It was originally developed by Charnes and Cooper [
30], in order to measure the relative performance of decision-making units (DMUs) based on the values of the chosen input and output variables [
31]. Martin and Roman [
32] mention that DEA can also be applied by international suppliers for market selection, and to then evaluate their performance, because it acts as a mathematical tool that analyzes stochastic efficiency and deals with the uncertainties linked to political, legal, economic, socio-cultural, and technological attributes [
33].
This analysis is also used by governments while promoting export programs in the world, especially for those companies who are looking for new international markets [
34]. Governments use DEA to promote export programs, especially, for companies who try to find new international markets [
35]. In the international market, companies use DEA to identify when they are able to compete and help in recognizing market export opportunities [
36]. The study by Wang et al. [
37] applied DEA and heuristic techniques to identify the most suitable candidates and partners for helping the industry of department stores. It was concluded that the candidate selection of strategic alliances could be an influential approach for enterprises to choose the appropriate partners for assistance.
Slacks-based efficiency (SBM) was introduced by Tone [
38], in order to improve some of the problems in the CCR model (Charnes, Cooper, and Rhodes) given while evaluating the model efficiency, as CCR does not include non-zero slacks. Another study used DEA and SBM super efficiency to explore the technical efficiency index of a bank [
39]. The efficiency was also checked for significant account risk in 43 Taiwanese banks from 1998 to 2002. It was analyzed that super efficiency gives a good framework for ranking efficient units in Taiwanese banks. Chien et al. [
40] conducted a study to determine the performance of Vietnamese banks to a DMU level in the improvement of business association through the Super SBM model. The findings show that the input and output factors calculated scores for the efficiency of the banks, and it was found that VIB bank remains at the top with a score of 1.52, from 2013 to 2016 period.
2.2. Empirical Review of Malmquist DEA
The Malmquist Productivity Index (MPI), or more commonly Malmquist DEA, was first introduced by Sten Malmquist in 1953 as a quantity to be used in the analysis of consumption of inputs [
41]. Then, in 1994, R.S Fare developed the Malmquist Productivity Index, which is based on DEA, in order to test the productivity change over time [
42]. Moreover, the index was divided into two components; change in the technology frontier is measured by one component and change in technical efficiency is measured by other components [
41]. According to Coelli [
43], the Malmquist Productivity Index can theoretically be divided into two components, “catch up” and “frontier shift” [
41].
The catch-up, also called recovery, is concerned with the amount that a DMU obtains for increasing its efficiency significantly. On the other hand, the frontier-shift is the difference between the efficient frontiers from two time periods [
44]. Moreover, if the DMUs are among all of the firms in a time period, the frontier shift means a change at the industry level. It also has some other components that are used in performance measurement [
45]. The study conducted by Raphael aims to measure the changes in productivity of Tanzanian commercial banks for seven years [
45]. To investigate the efficiency and productivity change in Tanzanian banks, the Malmquist Productivity Index (MPI) based on DEA was used. It was found that the efficiency gains in banks were due to a significant increase in the technical efficiency rather than scale efficiency [
45].
The Malmquist Productivity Index (MPI) was used by Shen et al. [
46] to explore the road safety performance of 26 EU countries, as well as the efficacy of the changes from 2000 to 2007. It was found that most of the improvements were achieved through the (technical efficiency) adoption of new road safety technologies.
The main aim of the study by Benli and Degirmen [
47] is to compute the total factor productivity, and to estimate the changes in the TFP created by the banks in the Turkish banking sector (TBS) from 2004–2009. The Malmquist total factor productivity index was calculated using the DEA approach, and then it estimated the changes in the total factor productivity of the banks over these years.
2.3. Empirical Review of Vietnam Export
Regarding the research on Vietnam’s export performance, Duong Thi Thanh Mai [
48] analyzed the current status of export activities in Vietnam during 2010–2014. Vietnam’s export performance was assessed through SWOT analysis, and on that basis, some measures were proposed to promote the export of Vietnamese goods in the future. Through the statistics, the study shows that the total export turnover and export growth rate of Vietnam always increased during 2010–2014, together with the recovery of the world economy. Basically, Vietnam implemented the objectives set out in their export strategy for the period 2011–2020 and for their vision for 2030. However, the export activities of Vietnam still exist. Some limitations include trade deficits with traditional markets such as China, and the shift of export structure towards export of hi-tech items was slow. Therefore, in the future, Vietnam should take positive steps to increase export turnover, but at the same time to improve the competitiveness of Vietnamese exports.
In another aspect of research, Nguyen Dong Xuan [
49] mentions trade liberalization and their impact on Vietnam’s exports from 2001–2010. A metric, referred to in this study, is a sophisticated metric of exports proposed by Hausmann, which has been used to calculate export performance. Since then, research has shown that Vietnam, Indonesia, the Philippines, and Thailand have similar export structures.
Using the regression analysis of Vietnam’s export data from 1990 to 2015, Nguyen Thanh Hai [
50] made a statement about the dialectical relationship between export and economic growth with the case study of Vietnam. Exports not only affect the aggregate demand of the economy, but also the relative level of consumption, investment, and GDP growth. The study also provides six recommendations to promote export activities for Vietnam’s economic development.
According to Newman et al. [
51], the exports and productivity from Vietnam are a significant learning experience for African countries, by researching and analyzing the data of enterprises from 2005–2012. The research results indicate that exports and productivity are closely related. The study also provides a comparative assessment of the economic context of Vietnam and Africa, which concludes lessons learned from Vietnam’s exports to economic development. In addition, the study also provided an important lesson—to expand the scale of exports to the local market, focus on improving R&D policy, and promote trade market liberalization. This would boost exports and economic growth.
2.4. DEA for International Market Selection
Over the years, the usage of the data envelopment analysis has expanded to the international market selection for exporting goods. One of the most recent studies by Cano et al. [
52] used the export-based data from over 30 countries, and found that the United States, Chile, and Singapore were the best international markets for the export of meat-related products, whereas Germany and Belgium were efficient for doing business with food-related products. In another study by Shabani et al. [
53], the data envelopment analysis was also used to develop a new model for international market selection for the export of motorcycles and bicycles. This study helped to assess the efficiency of motorcycles and bicycles to Iran from different countries, thereby helping to choose an international market. Movahedi [
54] found that the usage of DEA for international market selection was based on the performance of SMEs and their involvement in export capabilities. The higher the export performance of the SMEs, the better the export revenues are to a country. This study indicated the selection of an international SME that are efficient in export processes. Although there has been a lack of international market selection studies using DEA, Wang et al. [
55] focused on the agro-forestry industry of Vietnam, and assessed their productivity with regards to the exports and economy of the Vietnamese market. The study used 10 Vietnam agro-forestry enterprises, and found that the productivity index helped decision-makers in the development of the economy of the agro-forestry industry of Vietnam. Similarly, Vixathep and Matsunaga [
56] and Dang Thanh [
57] used the DEA analysis to analyze the efficacy of the garment industry and the Vietnamese banking system, respectively. However, these studies did not focus on the international market selection, but they may be linked to the export industry and market for future studies.
In the following sections, the methods of international market selection using predictive and efficiency modeling are presented. The efficiency and productivity models help in choosing the right international market to conduct export businesses and to help improve the economy of the host company. The methodology section presents the techniques and data used for analyzing the efficiency and productivity of the case country, Vietnam. Lastly, the findings from these analyses and their interpretations were presented in order to show the most efficient and productive export partners of Vietnam, as well as their choice of targeting an international market.
3. Materials and Methods
3.1. Research Development Flow
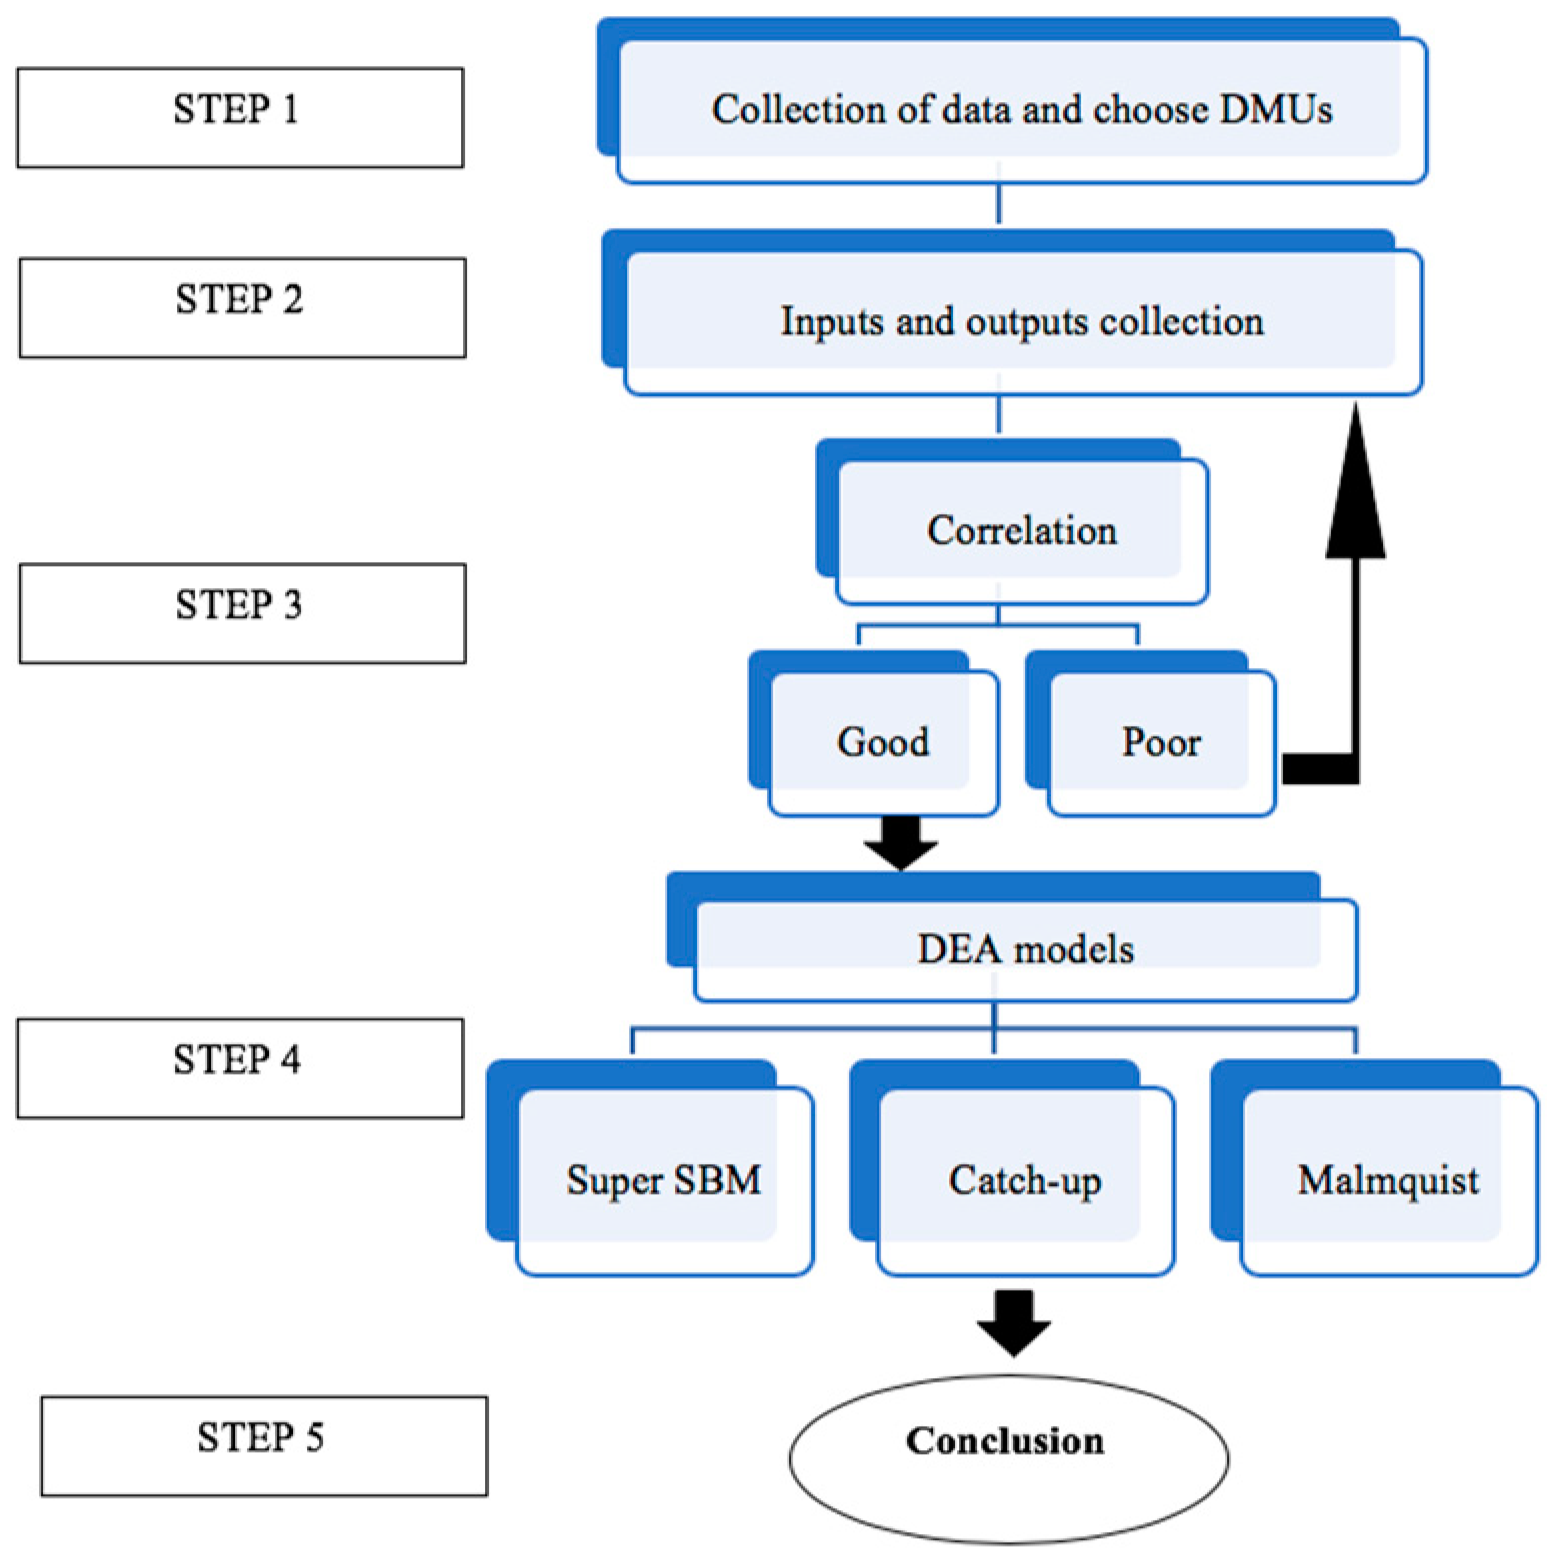
This study applies a Malmquist DEA productivity index and Super SBM model to evaluate the export situation of Vietnam, using all of the DMU’s in the international market. The process of conducting this study is shown in
Figure 1.
Step 1: DMUs collection: The information about Vietnam’s export partners in the international market have been collected from The World Integrated Trade Solution, World Bank, and OECD. The export partners that were considered were based on the top Asian and non-Asian international markets, and on the availability of the data sources.
Step 2: Inputs and outputs collection: The import tariff, exchange rate, and ease of doing business have been taken as the inputs and output, and includes exports and the exports of goods and services. Import tariffs are responsible to attract a host country to export its products. Lower the exchange rate higher is the profitability of the exports. Ease of doing business is based on the ease of regulations of conducting international businesses.
Step 3: Pearson Correlation method: Coefficients are recorded in order to check the correlation between inputs and outputs. Correlations show the interrelationship between all of the variables and their impact on each other.
Step 4: DEA Models: DEA models are extensively used to estimate the efficiency and performance of the DMU’s.
Malmquist DEA is used here to test the productivity change over time, and super-SBM is commonly used to choose the right international market along with catch-up analysis. It is a non-parametric linear programming-DMU-based technique to estimate the relative performance of the (DMUs) based on the values of the chosen input and output variables; it avoids the assignment of weights and the standardization of values of variables in a homogeneous scale. The Super SBM model can measure the super-efficiency of the variables and the catch-up measures of how much closer to the frontier a decision-making unit (DMU) or organization moves, while the frontier does not move—it is composed of the DEA efficiency measure.
Step 5: (Conclusion): The last step is to analyze the results from the findings, and then draw a conclusion.
3.2. DMU Collection
After researching and studying Vietnam’s export industry, the data for the decision-making units (DMU’s) denotes countries (i.e., Australia, Cambodia China, Japan, Korea Republic, Malaysia, Singapore, Thailand, and the United States, as well as others that were extracted from the World Integrated Trade Solution [
58], and the World Bank [
59]. There are 15 countries in
Table 1 representing exports to Vietnam for the years 2014–2017. These 15 countries fall under the category of Vietnam’s top trading partners in the international market [
60,
61].
For the creation of DEA methodology in the international export market, DMU’s represent the countries with the potential to export goods from Vietnam. DEA will help in classifying DMU’s in order to facilitate in the international market selection (IMS) decision-making process. Therefore, the DEA model uses the notation where “N” DMU, which will be evaluated, consumes “M” inputs to generate “S” outputs. For this, two output variables and three input variables were chosen. Exports of goods and services are the percentage of exports of goods and services in comparison to the GDP, whereas total exports indicate the value of goods and services that are sold across national borders for foreign exchange. On the other hand, import tariff represents the fee imposed on goods that come into Vietnam from a foreign country. Exchange rate provides the currency valuation between two countries, and ease of business presents the ease of regulations for businesses for international markets. However, each secondary data were collected either from The World Bank, OECD, and/or the World integrated Trade solution. The complete depiction can be seen below, as follows:
Inputs:
Import tariff—IT (%): A tariff imposed on goods coming into a country from a foreign country, as a means of reducing imports and protecting local industries.
Exchange rate—ER (units): Exchange rate is the amount of currency a country can exchange for another
Ease of doing business—EDB (ranking): Is a grading system initiated by the World Bank Group. The higher the ranking of a country, the better the position, which means easy regulations for businesses and stronger protections of property rights.
Outputs:
Exports of goods and services—EGS (% of GDP): It is the percentage of exports of goods and services in comparison with the GDP.
Exports ($ in thousands): Value of goods and services that are sold across national borders for realizing foreign exchange.
The historical data of 15 DMUs are shown in
Appendix A, through
Table A1,
Table A2,
Table A3 and
Table A4. The statistical data of the inputs/outputs for 15 countries representing the exports of Vietnam for the period of 2014–2017 are presented in
Table 2 below.
3.3. DEA Models
To evaluate the performance of the international market selection for the export of goods in Vietnam, the authors used the following two DEA models:
3.3.1. Super SBM (Slack-Based Measure) of Efficiency
The Super SBM (Slack-Based Measure) model is adopted to estimate the overall efficiency of the DMU’s for the whole, as well as the term efficiencies. This analysis comes under the assumptions of constant and variable returns to scale. Empirical analyses are generated using DEA-solver-pro software [
39,
62,
63].
The Super SBM model can be expanded using the super efficiency to the DEA models (super efficiency rate is identified as the distance between the inputs and outputs of both units [
64], the distance is shown in variable ρ). Assuming that a set of “N” DMUs exists that is producing the same set of outputs, which would consume the same set of inputs. The input and output matrix is matrix (X, Y), where X = (x
ij) ϵ Rmxn and Y = (y
ij) ϵ Rsxn. λ is a nonnegative vector in Rn. The vectors S− ϵ Rm and S+ ϵ Rs, show an excess input and a short falling output, respectively [
65]. The SBM model is found as follows [
66]:
subject to the following:
Suppose (x
0, y
0) is the SBM efficient of DMU, and (ρ*, λ*, s−*, s+*) is the final representation of SBM, when ρ* = 1, so, s−* = 0 and s+* = 0. Hence, a super-efficiency model is developed to help ranking DMUs [
67] (pp. 32–41).
subject to the following:
When the denominator is 1, the obtained feedback value of the objective function is greater or equivalent to 1. The inputs are positive, and the outputs become a negative value.
Suppose y
r0 ≤ 0, it has defined
r+ and
-r+ by the following:
If it seems that there is no positive component in the output r, then it will be = = 1. The element /yr0 is instead the following, while the is unchanged, as follows:
When
where B is a large positive value, and the value of B is about 100. It is a fact that if the denominator is relatively low,
, it increases with the decrease of the distance (
), and vice-versa.
Therefore, the non-positive values are significantly affected in this model. The obtained score is a one-dimensional unit for using units of the measurement and constant [
66]. The higher the value, the more efficient the unit [
64].
3.3.2. Malmquist Productivity Index (MPI)
The Malmquist Productivity Index concept was originally developed for assessing the consumption of inputs by Malmquist [
68]. Later, it was used as a productivity index—directly from input and output data by using DEA, defined as DEA–MPI—and also to be applied in various fields as a tool to measure the productivity change of DMU’s over time [
69].
Suppose there are “N” DMU’s, where each country is consuming “m” different inputs for the production of “s” different outputs. x
rj and y
rj represent the i
th input and r
th output, respectively, of the j
th DMU at time “t” [
46].
Subject to ≤ θ, i = 1, 2, …, m,
≤ θ, r = 1, 2, …, s,
λj ≥ 0, j = 1, 2, …, n,
The reduction in the DMU0’s outputs is denoted by θ (0 < θ ≤ 1). The DEA efficiency score is equal to the distance function of the DMU0 in year t (i.e., ). If the value of θ = 1, then the DMU will be efficient, and its input–output combination lies on the efficiency frontier. If the value of θ < 1, then the DMU will be inefficient, and its input–output combination lies inside the efficiency frontier.
Using
t + 1 instead of
t for the above model can be interpreted in a similar way, and the efficiency score of DMU
0 in the time period
t + 1, can be obtained as
. For the mixed-period measures, the first is defined as
for DMU
0. which is computed as the optimal value resulting from the following linear programming problem, as follows:
Subject to ≤ θ, i = 1, 2, …, m,
≤ θ, r= 1, 2, …, s,
λj ≥ 0, j = 1, 2, …, n,
This model compares
to the frontier at time
t. Similarly, the mixed-period measure
= can be obtained, and it compares (
,
) to the frontier at time
t + 1. Therefore, DEA–MI estimates the productivity change of a specific DMU
0 at time
t + 1 and
t, can be shown by the following equation:
where MI0 shows the progress in the total factor productivity of the DMU0 from the period
t to
t + 1, while MI0 = 1 and MI < 1 indicates the status quo and decay in the productivity, respectively [
48]. If MPI = 1, there is no productivity change, and if MPI < 1, it reflects that there is a productivity reduction
4. Results
4.1. Pearson Correlation
Now, there is a need to perform a correlation test between the input and output variables in order to check that each variable provides different information from the other variables in the model, increasing the differentiation among the evaluated countries. A significant correlation between the input and output variable shows the relatedness between different factors. Therefore, this input–output combination will be suitable for the test. The correlation values imply that the “exports of goods and services” are inversely influenced by the exports values, tariffs of exports of the countries, exchange rates, and ease of doing business. This indicates that if the exports of goods increase, then there must be a decrease in the tariffs on exports and a reduction in the exchange rates. So, the greater the opposing relationship between the values, the better a country’s export feasibility is, and improves the international market selection.
4.2. Super SBM Model of Efficiency
It was assessed that the forecasting values for every 15 countries were worked out, because the means absolute percentage error (MAPE) is results small in
Table 3, with 7.07%.
MAPE is used to verify the accuracy of the forecast, in order to ensure suitable predictive methods, and to act as a source of highly reliable assessments and to identify the prediction with a good performance. The MAPE is divided into our ranks, and the results are shown in
Table 3. The forecast is calculated by the actual data, and if the error is in the allowable range, then it will be a reliable and usable model for the study. The average MAPE of the 15 DMU’s is less than 10% of the limit. Therefore, based on these rules, the forecasted results of this study have a high level of accuracy, as the average MAPE of 15 DMU’s comes out to be 7.07%. If the MAPE is smaller, the volatility in the forecasts will be less, so the slacks-based measure of efficiency can be predicted.
The study applies forecasted results as input factors so as to assess the performance of the DMUs being exported from the period of 2018–2021, as shown in
Table 4. The forecasting shows the results for the exports of goods and services and the exports of the 15 countries from 2018–2021. Moreover, for future countries wanting trade with Vietnam, it helps by providing information on the output factors, which is very important for partner selection. The forecasting results indicate that there are slight changes of output factors in five of the DMUs during 2018–2021, for DMU1 (Australia), DMU2 (China), DMU9 (Malaysia), DMU11 (Singapore), and DMU15 (USA). The decreasing tendency in the output factors means that these countries must have a suitable strategy in place in order to create and sustain a competitive advantage, or to start up a new investment in order to meet the increased demand. The results indicate that the ranking of the exporting countries to Vietnam vary in the future. The DMUs are divided into the following three major groups:
Group 1: DMUs get effective market; they are always at the top position and include DMU1, DMU2, DMU9, DMU11, and DMU15;
Group 2: DMUs can prosper in the future: DMU8 and DMU12 (ranking for both of these DMU’s has increased from 2018–2021;
Group 3: DMUs have an inefficient market in the future: DMU3, DMU4, DMU5, DMU6, DMU7, DMU10, DMU13, and DMU14.
This also reflects the intense competition of exports in the international market of Vietnam, and provides good information to the future countries looking to choose an international market for trade.
From the DEA Super SBM model and the results shown in
Table 5, it is analyzed that the United States and Singapore remained the most efficient amongst the 15 DMU’s from 2014–2017. Malaysia showed a declining trend in efficiency, by achieving a score of 1.29237 in 2015, down from 1.59239 in 2014. Although the Republic of Korea showed a slow improvement, Italy remained in 10th position for all of the years. France showed an increasing trend in efficiency from 0.42375 in 2014 to 0.47215 in 2015. Moreover, the Netherlands followed a very poor trend of efficiency change, and hence remained at the bottom rank amongst all of the other countries. Similarly, the UAE and United Kingdom too showed poor efficiency change, and hence drooped as per their ranks from 2014 through to 2017.
The development of the efficiency showed that the average efficiency increased during the period of 2014–2017. This can be the result of the technological advancement and integration of economies. Therefore, the countries may either decrease or increase their inputs in order to increase or decrease the output of the country, and to improve its efficiency values.
4.3. Malmquist Index
In this study, the Malmquist Productivity Index is used to assess the performance of 15 DMU’s. DEA-solver-pro was used for the further analysis. This index also helps in identifying the productivity change in the international export market, as well as to assess the productivity change within groups, therefore giving an opportunity to the poor performers in the export markets to catch up. To facilitate the analysis, the values of efficiency change, technological change, and MPI are depicted in details in
Table 6,
Table 7, and
Table 8 below.
4.3.1. Catch Up Effect
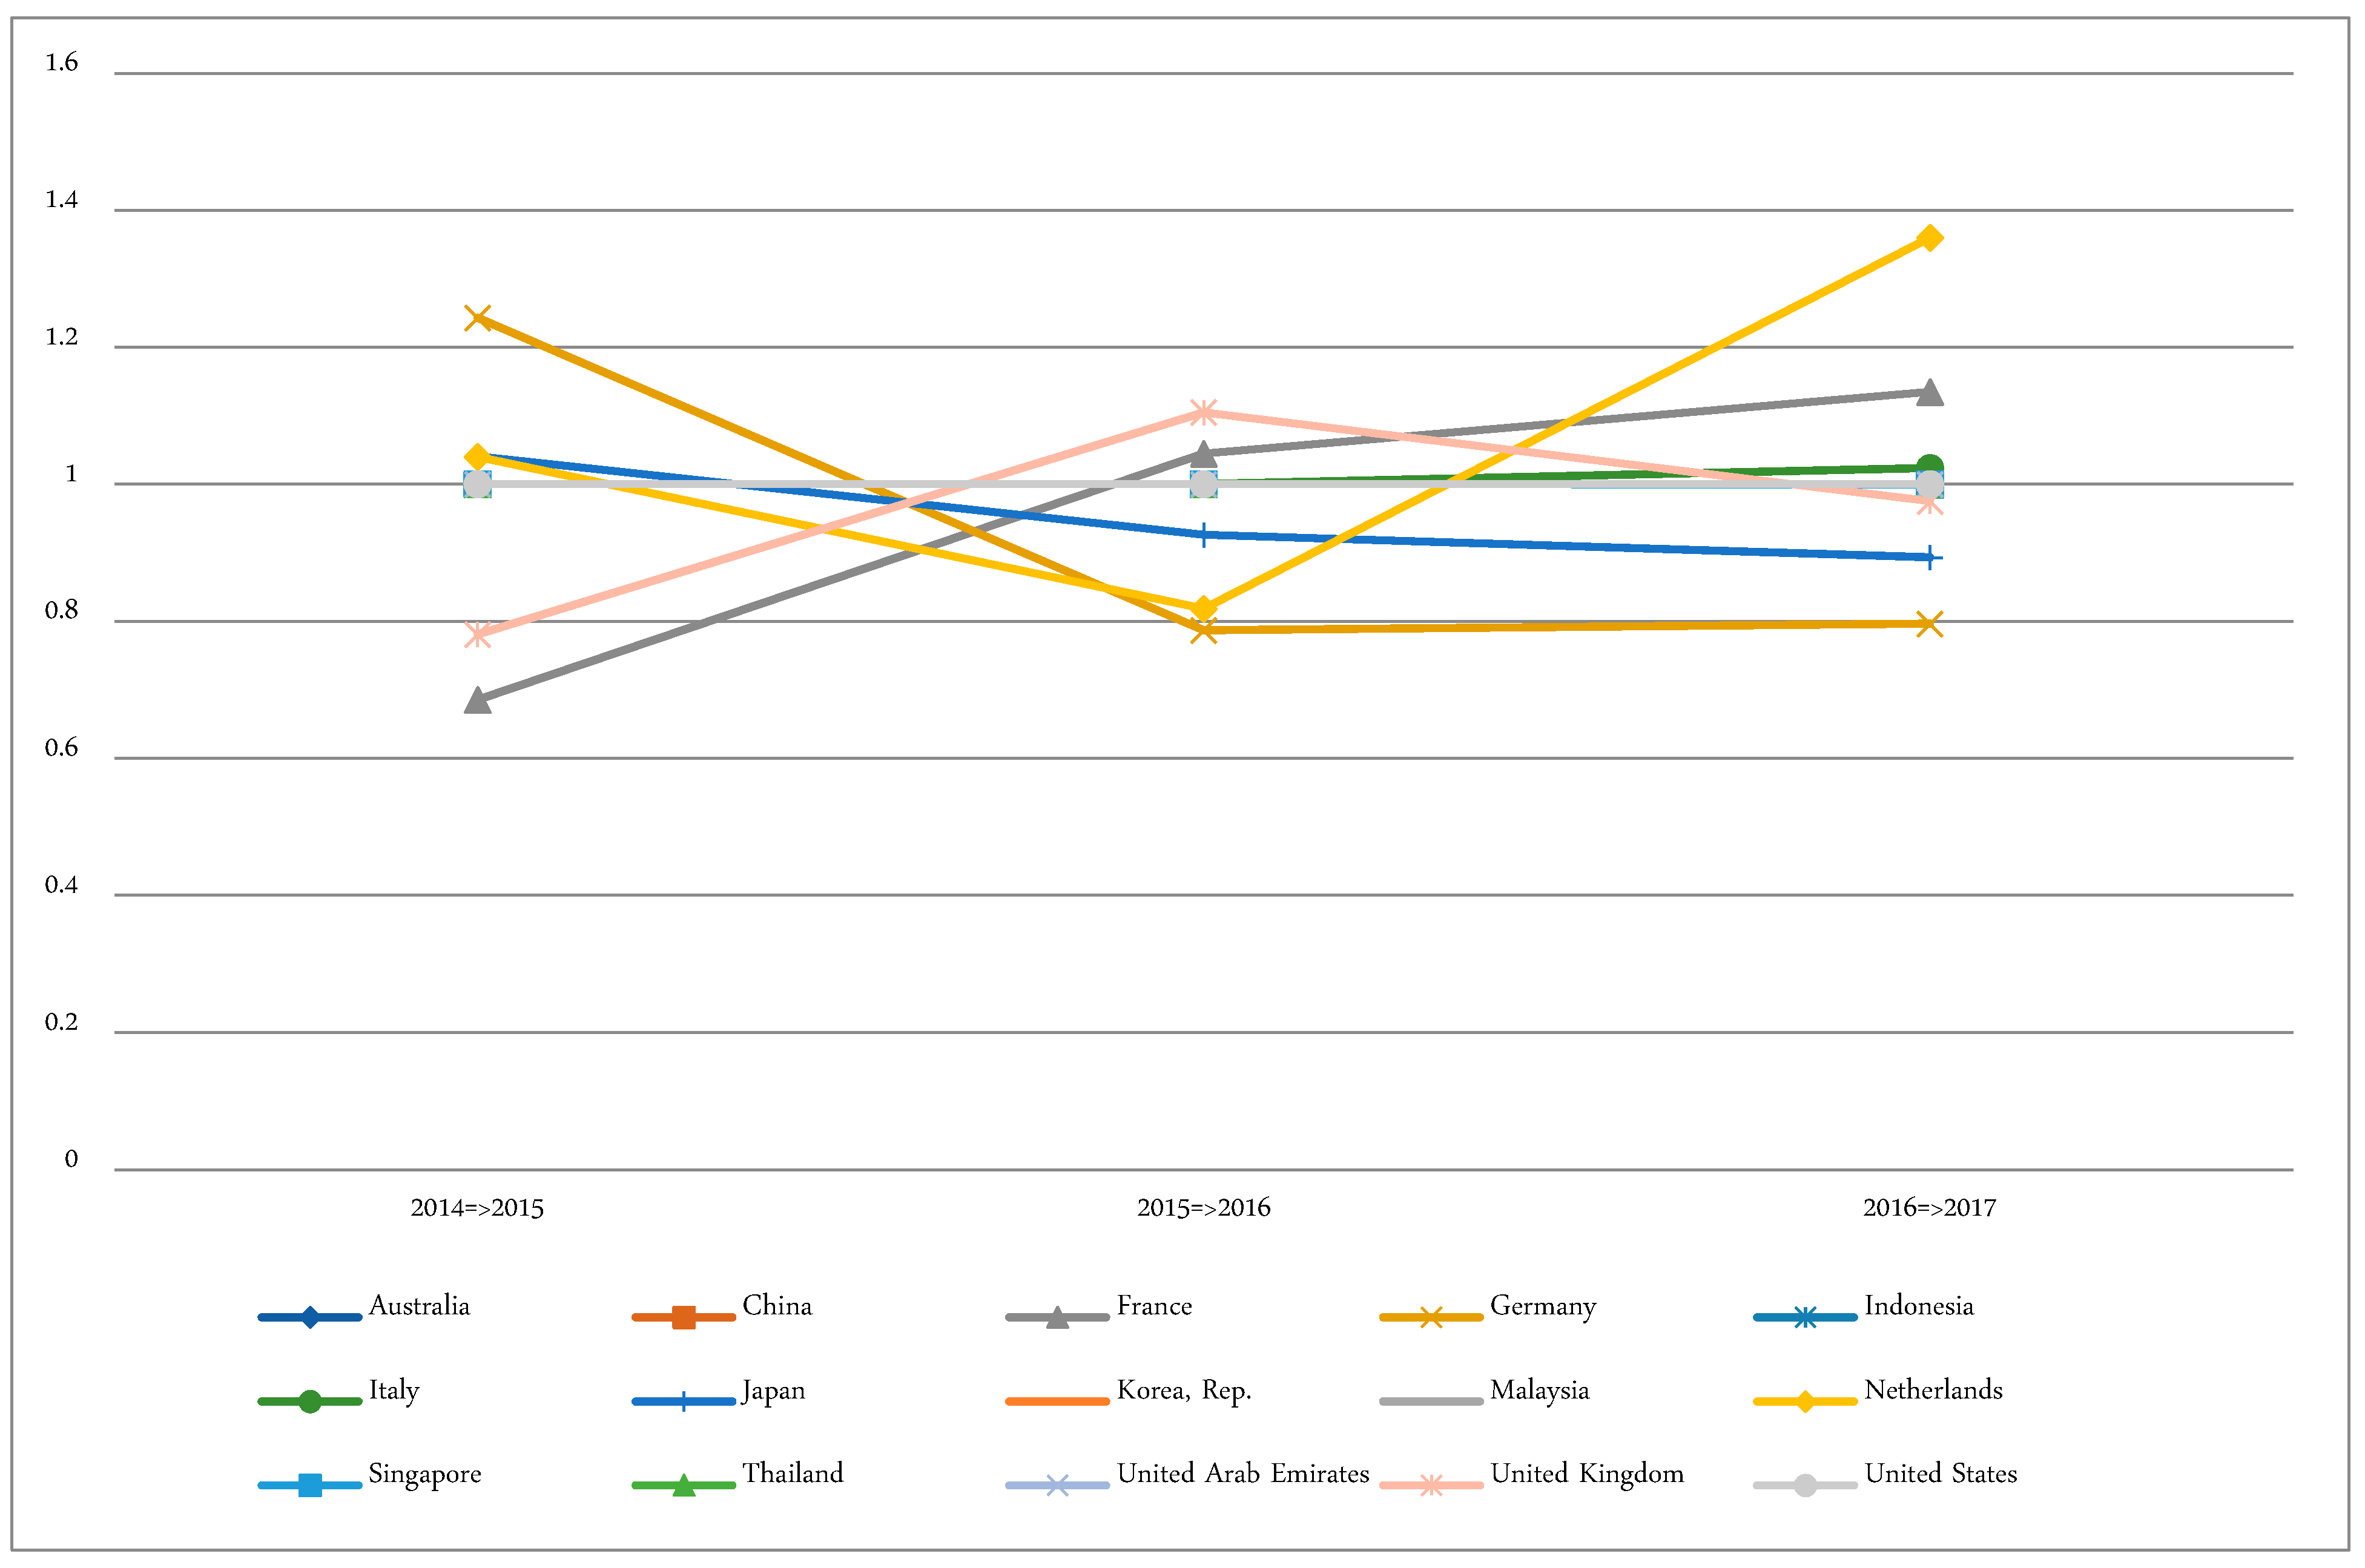
The catch-up effect in
Table 6 identifies the value needed by a DMU to enhance its productivity and efficiency; Germany and Singapore are the only two countries that need constant catch-up with the efficiency values.
Figure 2 shows the “efficiency change” (catch-up effect) of the 15 DMUs from 2014–2017. It hs been found that DMU3 (France), DMU4 (Germany), DMU11 (Singapore), and DMU14 (United Kingdom) represented a decreasing trend of closeness between the frontier and a decision-making unit. France needs to catch-up to its efficiency values by 5% on average, while Germany need 6%, Japan 4%, Singapore and Malaysia 1%, and the United Kingdom 5%. On the other hand, Australia, China, Indonesia, Korea, Thailand, the USA, and UAE are efficient enough and do not need to catch-up. However, the trend of the catch-up values implies that most of the DMU’s had started improving their efficiency.
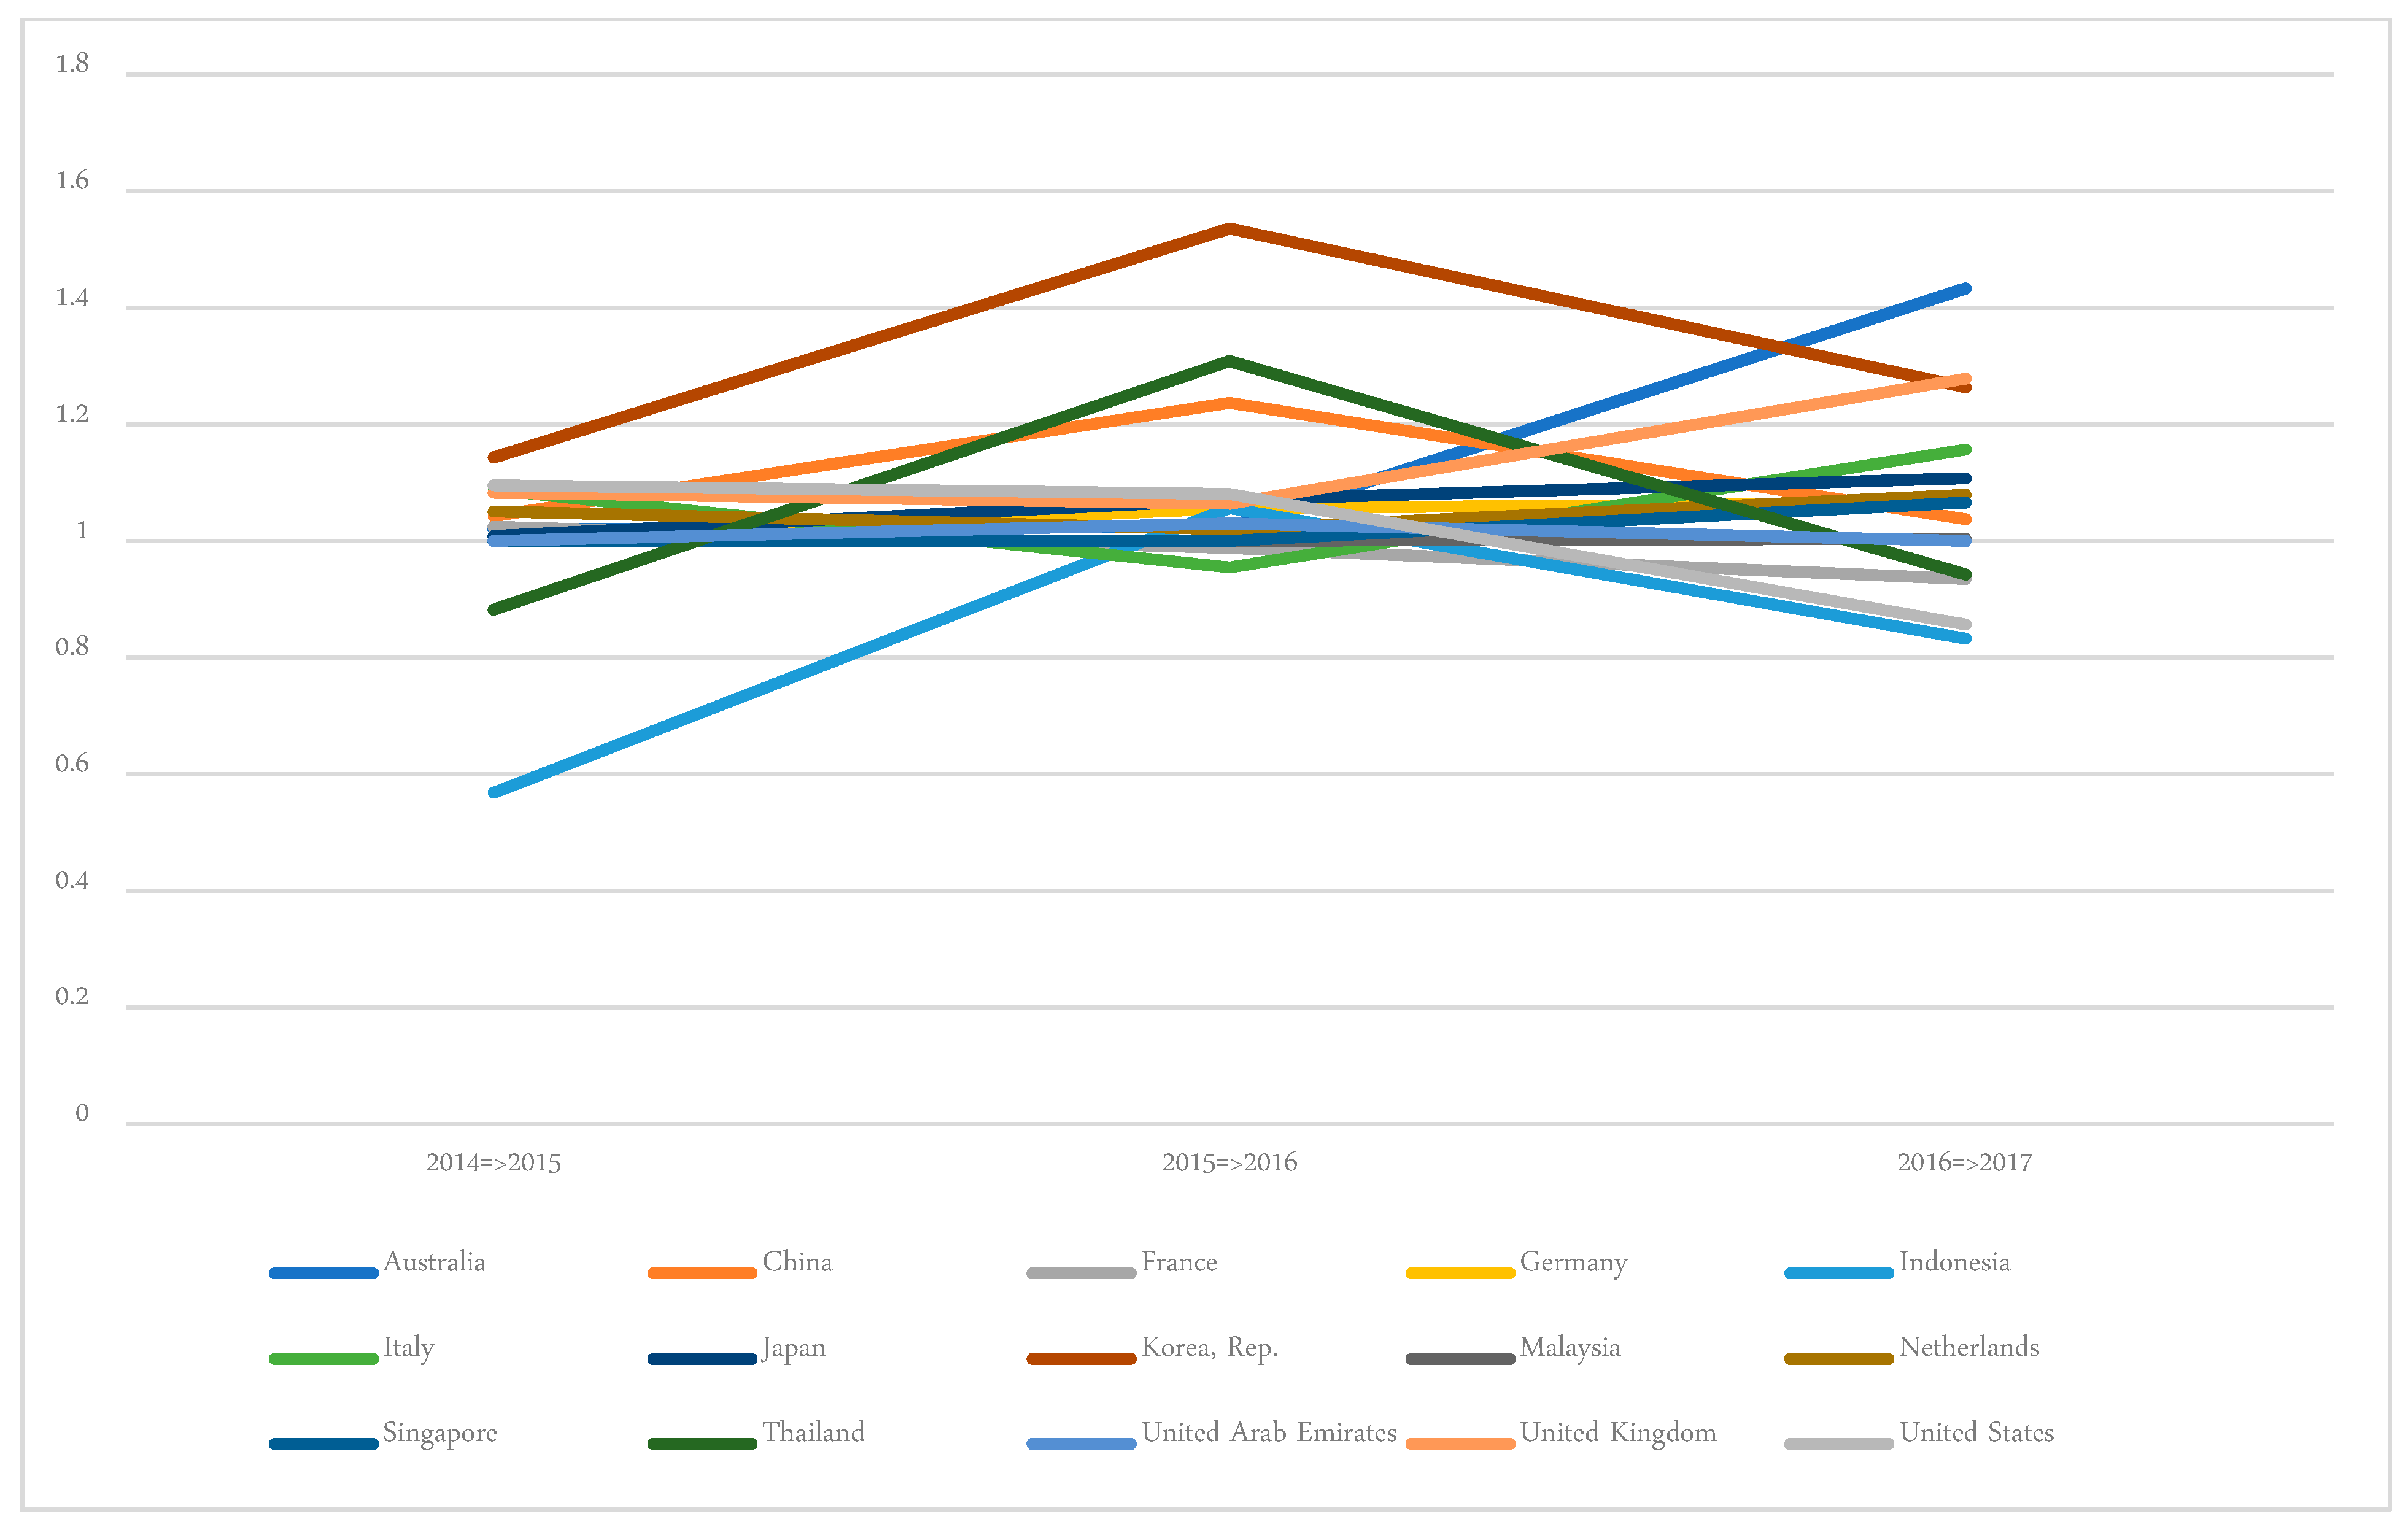
4.3.2. Frontier Shift
Table 7 and
Figure 3 show the “technological changes” or frontier shift of 15 DMU’s from 2014–2017. It was assessed that almost all of the DMU’s were enhancing their technology and going for technological efficiency, except for Australia, Italy, and the United Kingdom. This results in an increased overall efficiency. This also implies most of these DMUs continued to improve their technological capabilities. In terms of “technological change”, DMU8 (the Republic of Korea), DMU2 (China), and DMU12 (Thailand) are the top three best countries, while the three worst countries are DMU6 (Italy), DMU3 (France), and DMU9 (Malaysia). Thus, it may be implied that the overall frontier shift of the countries increased. The highest frontier shift was found for Korea, followed by Thailand and China. The Netherlands on the other hand, along with Indonesia and UAE indicated the low frontier shift. This might be because these countries are constantly efficient and did not need to benchmark any other country for improving their efficiency.
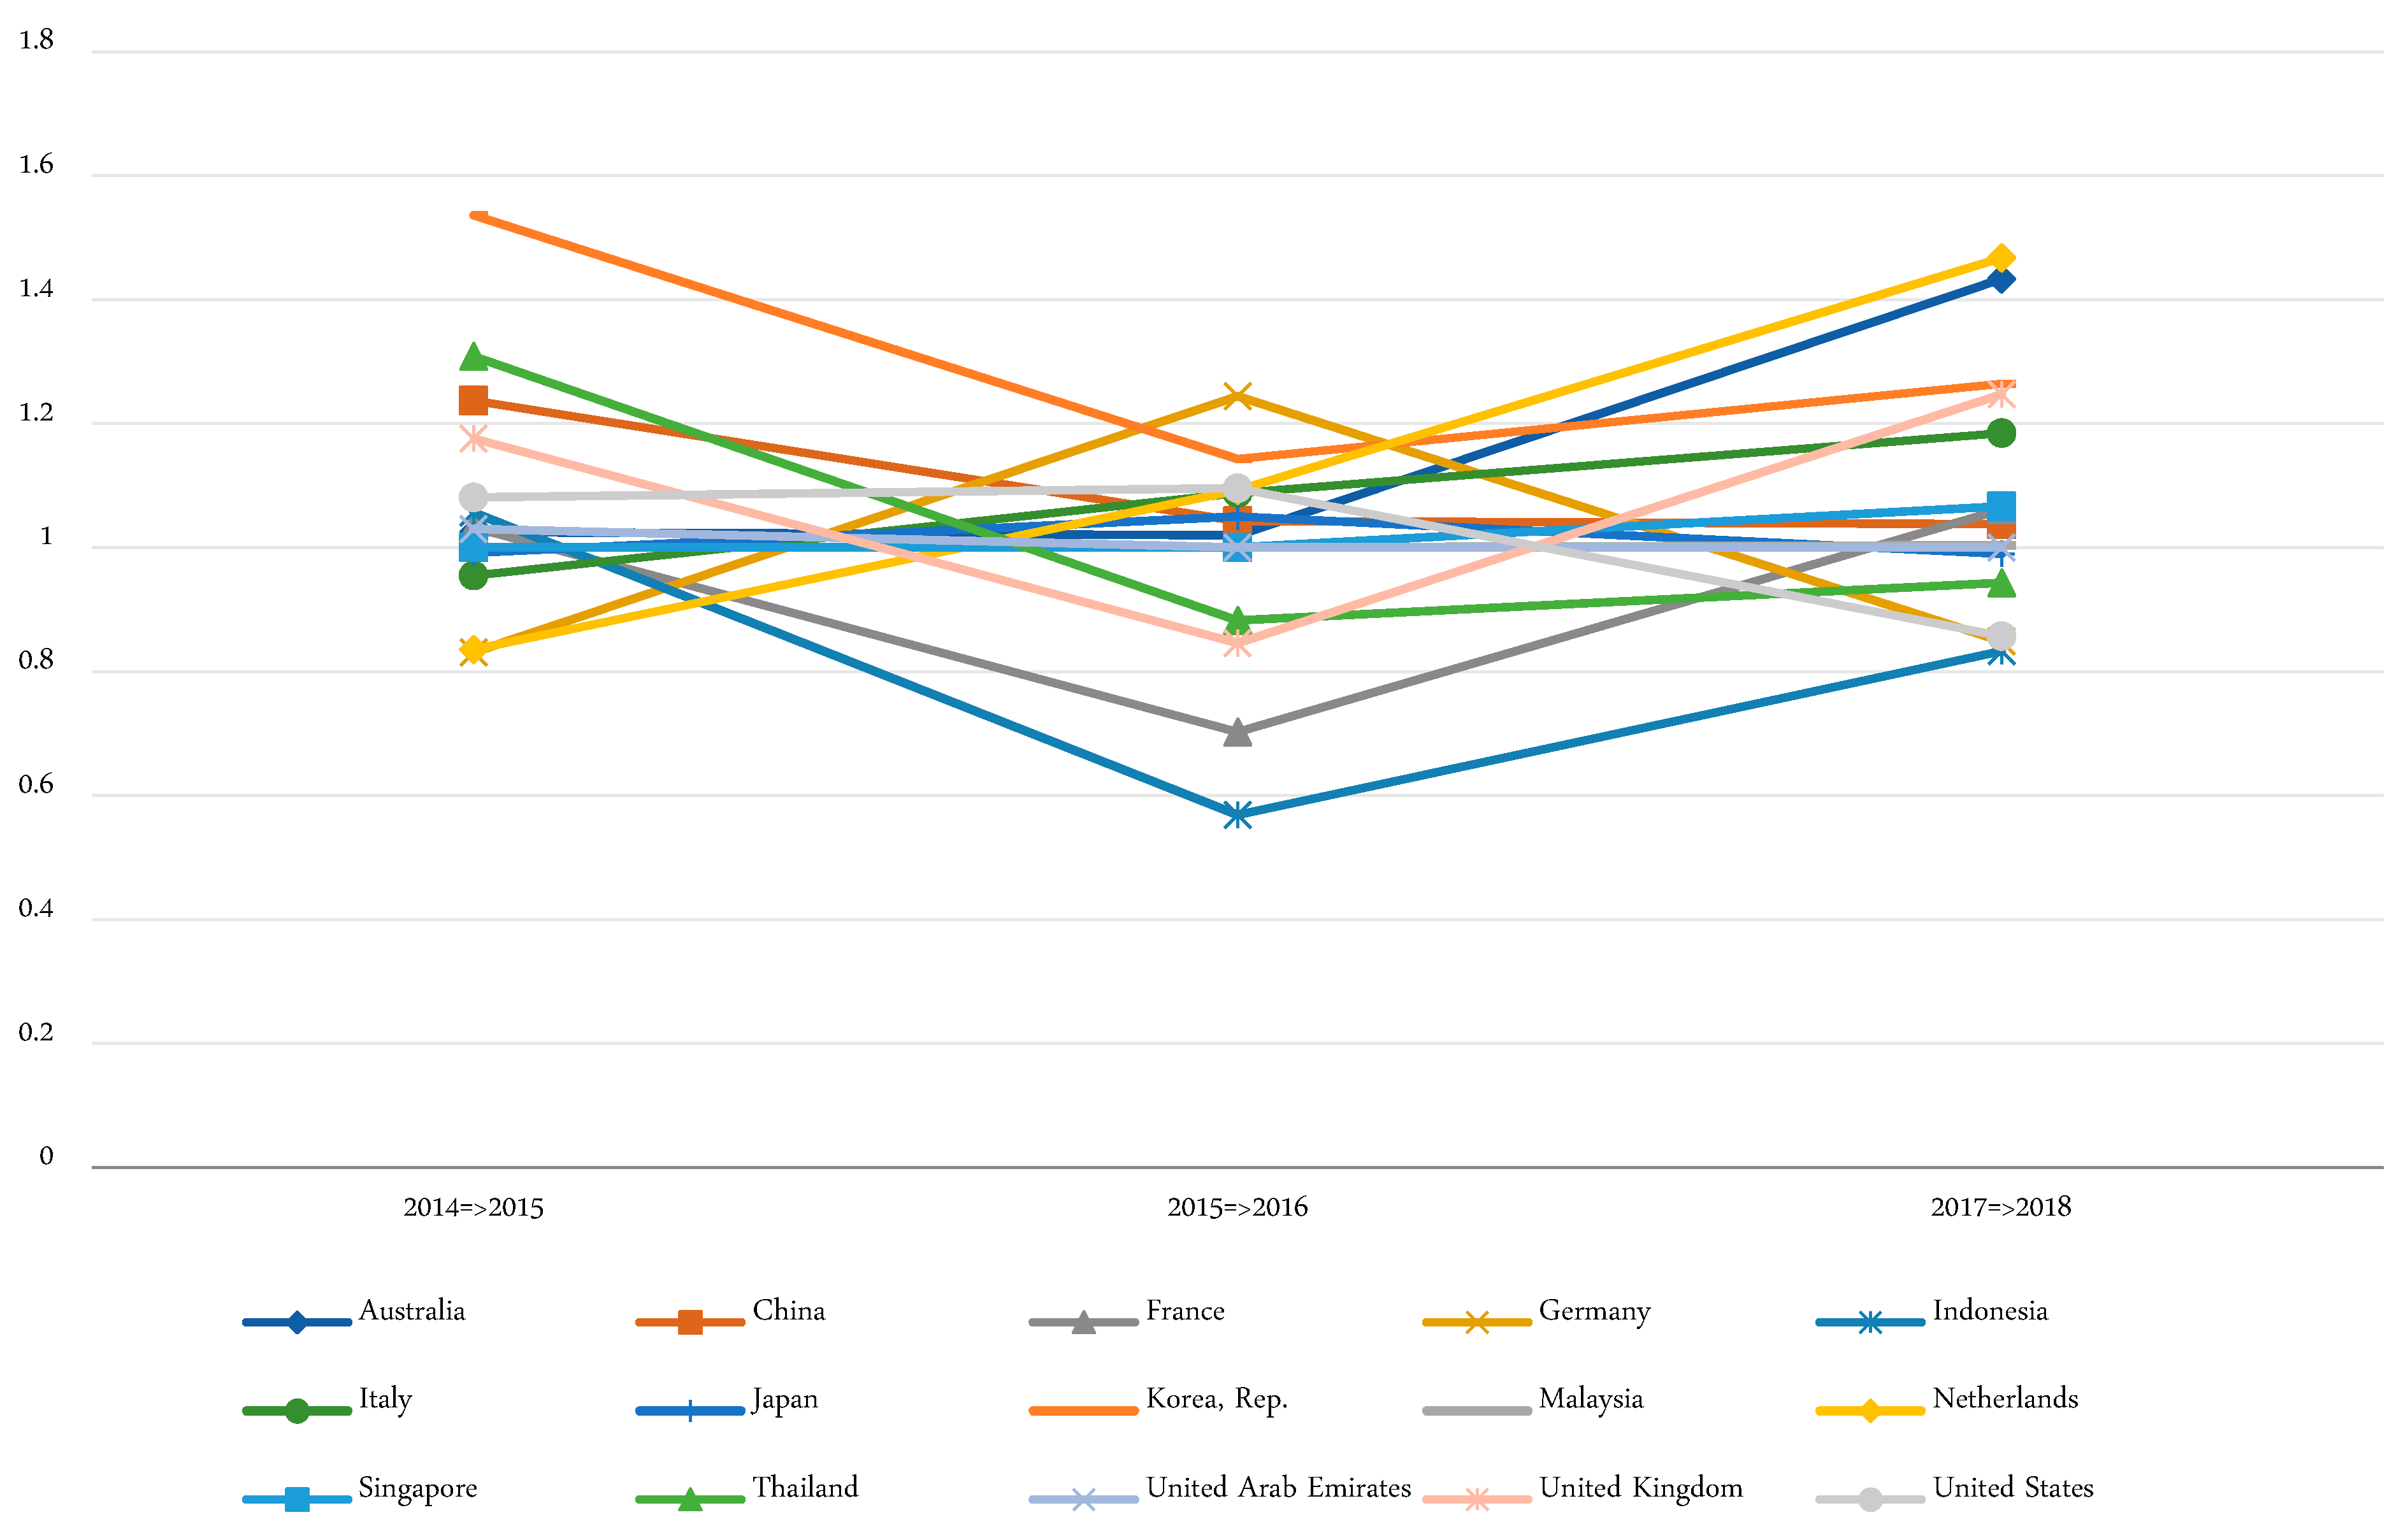
4.3.3. Malmquist Productivity Index
Table 8 shows the MPI. The total productivity of the 15 DMUs from 2014–2017 noted that DMU5 (Indonesia), DMU4 (France), DMU15 (UAE), DMU2 (China), and DMU14 (Thailand) had a long-term upward trend during 2014–2017. However, DMU4 (Germany) and DMU10 (Netherlands) experienced a drop during 2015–2016. According to
Figure 4, the countries with an upward trend indicate that the efficiency change over time either remained constantly efficient or exceeded their predicted efficiency values. In terms of MPI, DMU2, DMU8, and DMU14 are the top three best exporting countries, while the three worst exporting countries are DMU4 (Germany), DMU6 (Italy), and DMU7 (Japan), while DMU10 (Netherlands) appears unstable as it has the largest fluctuation. Therefore, it requires increasing trade relations with these countries. As the majority of countries were found to be effective, it may be implied that trade with these countries is important so that there is an improvement in the economics and growth of the trading countries.
5. Discussion
The aim of the paper was to evaluate Malmquist DEA analysis approach and Super SBM for the efficiency of DMU’s. Another objective was to adopt a forecasting model to make a prediction about the future export market during the period of 2014–2017. The MPI models were used to evaluate the productivity change in Vietnam’s export industry. This research is conducted on 15 of Vietnam’s leading exporting countries during the period of 2014–2017. On the basis of the completed data, the study showed the forecast future export performance. The accurate forecasting value was significant, showing a reliable accuracy of 7.07%.
The empirical analysis of this research gives a broad support to the study, and confirms that the DEA analysis is able to explain the efficiency in Vietnam’s export market. Amongst these 15-leading export markets for Vietnam, the results shown by the Super-SBM model implies that the performance of the top three from 2014–2017 is DMU9, DMU11, and DMU15. With the lowest score, the three DMUs with an inefficient market in the past include DMU1, DMU3, and DMU6. However, in the period of 2018–2021, there were five of the most efficient markets for Vietnam (i.e., DMU1, DMU2, DMU8, DMU9, and DMU15). On the other hand, with the lowest score, three DMUs with an inefficient market in the future included DMU3, DMU6, and DMU14. They needed action with a strong improvement to get an effective performance in the future.
It can be interpreted that three DMU’s were the most efficient for the selection of the export market (i.e., Malaysia, Singapore, and the United States) in the year 2017. The reason behind increasing the trade of Vietnam with these countries can be their involvement with world trade organization, ASEAN (Association of South East Asian Nations) and TPP (Trans-Pacific-Partnership), and their regional comprehensive economic partnership negotiations with other economies, among others. After ASEAN’s free trade agreement, there was a significant reduction in the tariff and non-tariff barriers with 10 countries, which included Singapore, Indonesia, Malaysia, and Thailand. On the other hand, the United States–Vietnam bilateral trade agreement in 2001 and after the effect of the United States–Vietnam Comprehensive Partnership 2013 improved their relations, and both became increasingly cooperative and comprehensive. However, if the TPP with the United States brings the tariff rates down for export–import between these economies to near zero, then Vietnam’s exports to the United States are going to surge.
With Australia, although Vietnam started its diplomatic relations in 1973, there are existing differences in the system and in political values. After the initiative of the bilateral relationship into a strategic partnership in 2018, a significant amount of changes can be seen between Australia and Vietnam. Also, Malaysia used to be an efficient country for the export market of Vietnam in 2014, but its decline in efficiency can be seen in the later years, from both of the Super SBM and DEA-MPI techniques. Despite the fact that Vietnam has good relations with Japan because of the Vietnam–Japan Economic Partnership Agreement (VJEPA), Vietnam needs to change its export structure concerning reducing its share of primary goods, and needs to increase the ratio of processed products and also industrial products, in order to improve its efficiency and to remain consistent with sustainable economic development and market orientation. In addition, there is a need to strengthen its cooperation with Japan, and it should work on information provision and trade promotion as well.
6. Conclusions
The results of this study can be considered as a basis for selecting a market that will help the government and businessmen make for profitable deals in exports with a long-term vision. The effective market will have positive conditions in order to achieve better results, which is helpful for the economy of Vietnam. Vietnam is a developing nation and over the years has mainly focused on exports and FDI to improve its economic conditions. Trade agreements and exports with strategic and developed nations were a key to their success, and hence the case of Vietnam is relevant for other developing nations to consider for the selection of an international market. Moreover, developing nations may also improve their tariff rates and exchange rates to increase the ease of doing business. However, it is also important that the developing nations need to improve their trade and export policies for foreign investments. Larger foreign investments mean better business capabilities and larger volumes of export. This study should not only be a reference point to the selection of the international market, but should also act as a benchmark to improve the economy. The paper also demonstrates that DEA is an effective model for identifying and selecting the most effective international markets for the export of goods. In the context of previous studies, the DEA integration method used in this study widely provides a novelty in the application of a model in the IMS, and is not limited to any field. This method is not only suitable for evaluating and selecting international markets for a country’s export activities, but can also be applied in enterprises and companies to find the best market, limit risk, and promote strategy to expand to overseas markets.
This study provides an overview of Vietnam’s commodity export markets from 2014–2017, through the assessment of the export performance of Vietnamese goods to the 15 selected countries. The analysis is similar to previous studies that give an insight into the choices of international export markets. This research seems to be the first to apply the DEA model to highlight Vietnam’s export performance and to provide some basic forecasts for future market choices. The MPI model is applied to approach the performance of 15 DMU’s, such as the changes in technical efficiency, changes in technological change, changes in pure technical efficiency, and changes in scale of efficiency as well as in the total factor productivity in the period of 2014–2017. The next model to be used is the Super-SBM model, which identifies and ranks the countries in which Vietnam has the highest export performance and also gives positive results for the export activities of Vietnam for the period 2018–2021. By using the integrated DEA model to measure Vietnam’s export performance through 15 countries, this study can summarize the following conclusions: (i) an overview of export performance Vietnamese goods for 15 countries, through the integrated model DEA for the period 2014–2017; (ii) based on the performance targets, we found three countries—Malaysia, Korea, and the United Stated—with the most efficient exports of goods, while Australia, France, and Italy were the most inefficient; (iii) Vietnam may seek new markets besides traditional markets such as Europe, the United States, and Northeast Asia; (iv) seriously implement the economic and trade commitments when the ASEAN community was put into operation on 31 December 2016. Strictly implementing the agreement reached in Vietnam in the future for export will be advantageous and achieve good results.
Although this study tried to show that DEA is an optimum method of selecting good export markets, there is no denying that there are still many limitations in these statistical methods for further studies. Other DEA models like the BCC (Banker, Charnes, and Cooper) models and the algorithm can also be tested to explore more changes. Different DEA models and optimization algorithms can also be tested to reveal more changes, and other industries can be studied in the future using this model. This study is based on only the quantitative model, and the external environmental factors are not considered. In addition, recently, Vietnam will be signing some bilateral agreements with other countries, therefore it would be more useful to study the export market changes to get the reliability and for stable indicators. In addition, only a few countries were chosen for study as DMUs. A lack or gap of secondary data with respect to export and economic information also acts as a limitation of the study.
This paper provides an evaluation of the export market efficiency in these countries. Furthermore, this research gives further measures to analyze the market efficiency of the countries in the export market selection. Lastly, a larger dataset of DMUs and output/input variables must be chosen for future studies. Another important future scope is the exploration of the export market of other developing nations. This will help provide a comparative study of the most productive international market for developing nations globally.


