RAFFIA: Short-term Forest Fire Danger Rating Prediction via Multiclass Logistic Regression


Abstract
1. Introduction
1.1. Forest Fire Danger Rating Prediction Models
1.2. AI for Forest Fire Danger Prediction
1.3. Factors Used for Forest Fire Danger Prediction
- Variety of Observed Data: Different forest fire danger influencing parameters have different measurement units (e.g., C, m/s, etc.) and data ranges. Some parameters have positive effect on forest fire danger; others may be negative. There are desires for an unified metric to aggregate the diverse influences.
- Accuracy Guarantee for Online Prediction: To provide effective early guidance for forest fire prevention, the prediction requires a high accuracy performance. To guarantee the prediction accuracy, WSNs-based real-time parameters should be computed in real time and the prediction model construction should be capable of dealing with a large-volume of cumulative sample data.
- Complexity of Solution Space: It is very difficult to recognize complex patterns from the diverse, large-volume of data and guarantee the effectiveness of online prediction results. To provide a generalized model construction methodology for forest fire danger rating prediction which can scale for different regions, the decision-making process cannot be handled by traditional models. The complex reasoning regularities and the high-accuracy requirements will result in a high computational overhead.
2. Methods
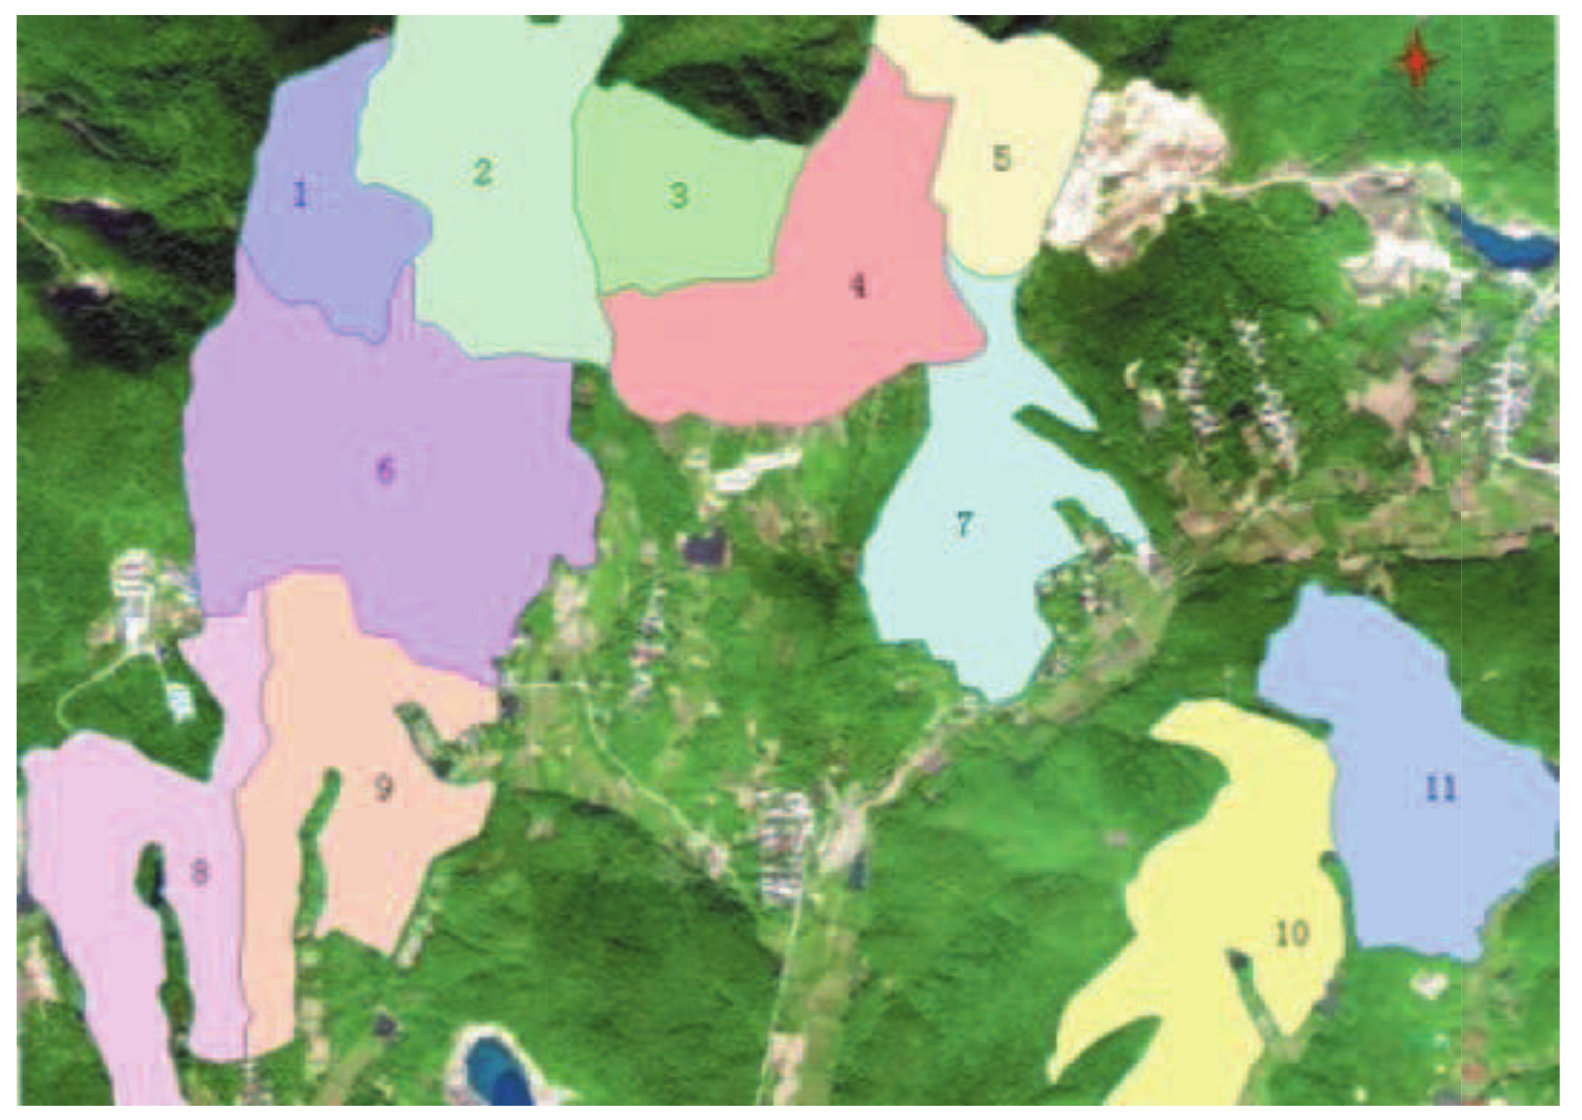
2.1. Study Area
2.2. Forest Fire Danger Ratings Online Prediction
2.2.1. Data Preparation
2.2.2. RAFFIA Model Construction
- Step 1: we initialize each value of .
- Step 2: We randomly select S sample vectors from the training set, and calculate the L value of cost function according to the selected samples.
- Step 3: We update , for , using a grad function. Specifically, the purpose of updating weight values is reducing the value of cost function. For each , we assign a new value using the following equation:in which is defined as learning rate, which is used to control the speed of updating .
2.2.3. Online Prediction
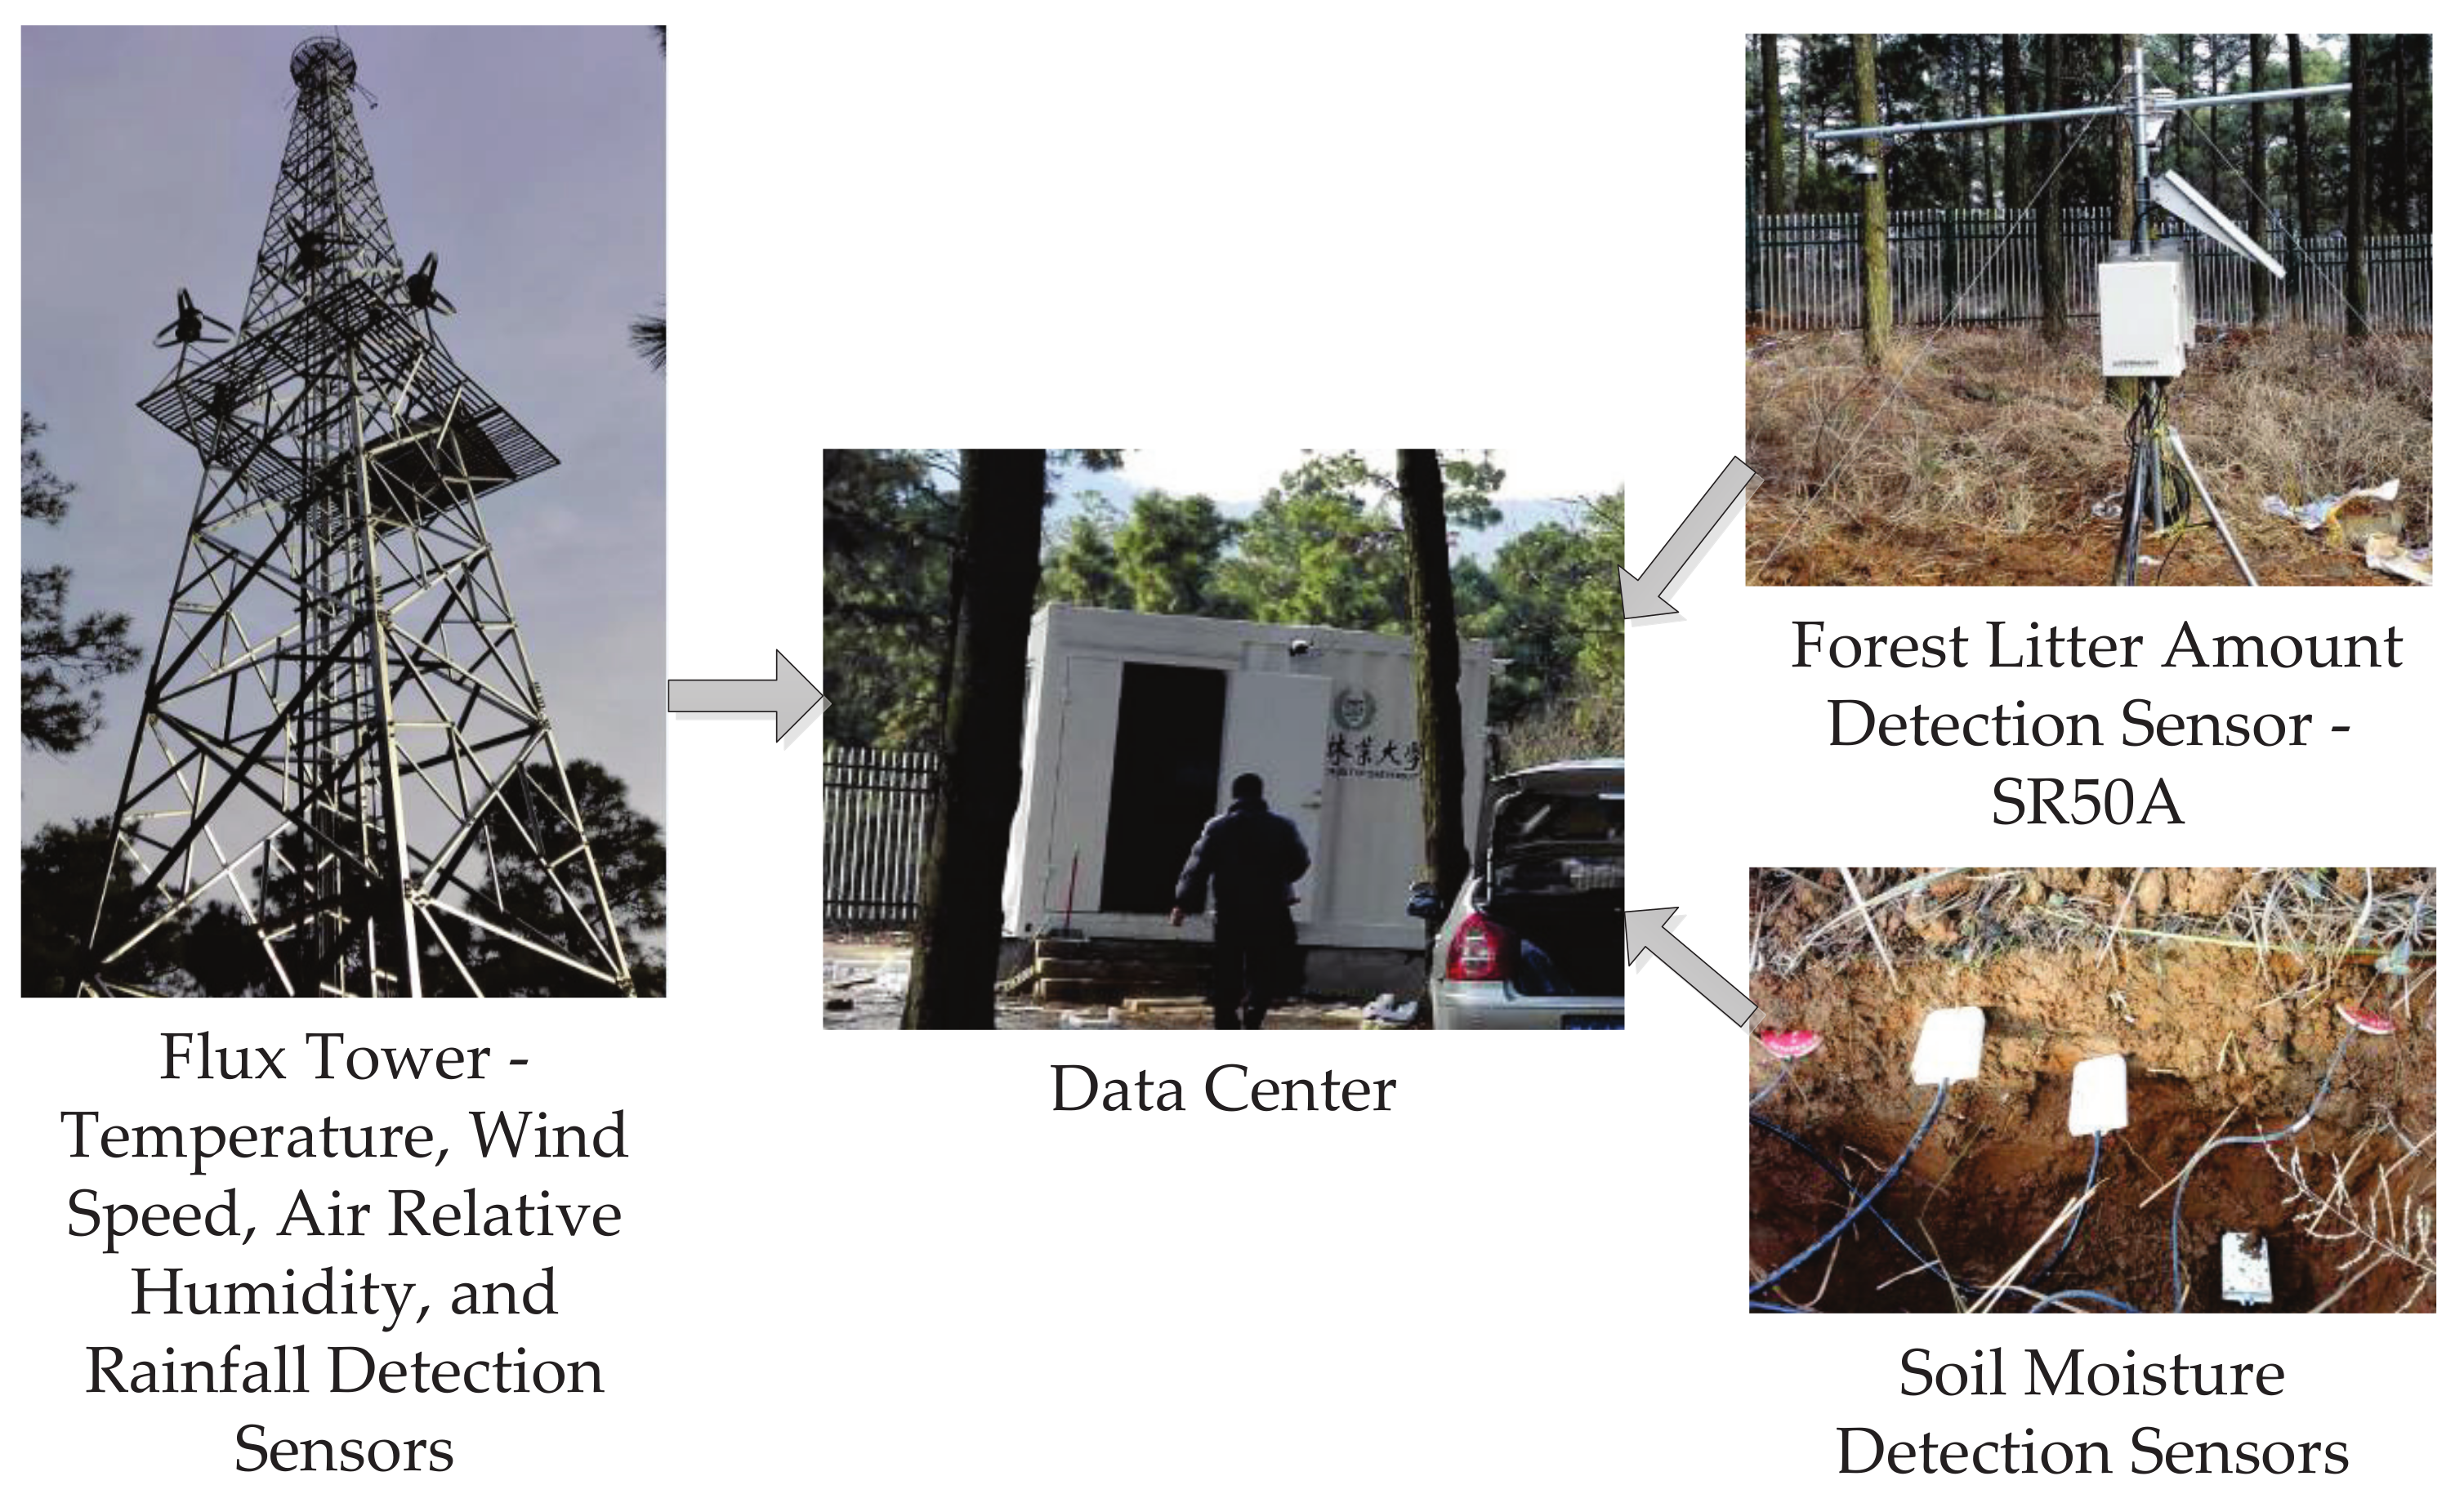
2.3. Framework of Xiashu Forest Fire Prevention Experimental Station
2.4. Data Set
2.5. Metrics
2.6. Approaches Subjected to Comparison
- for method, and
- for method
3. Results
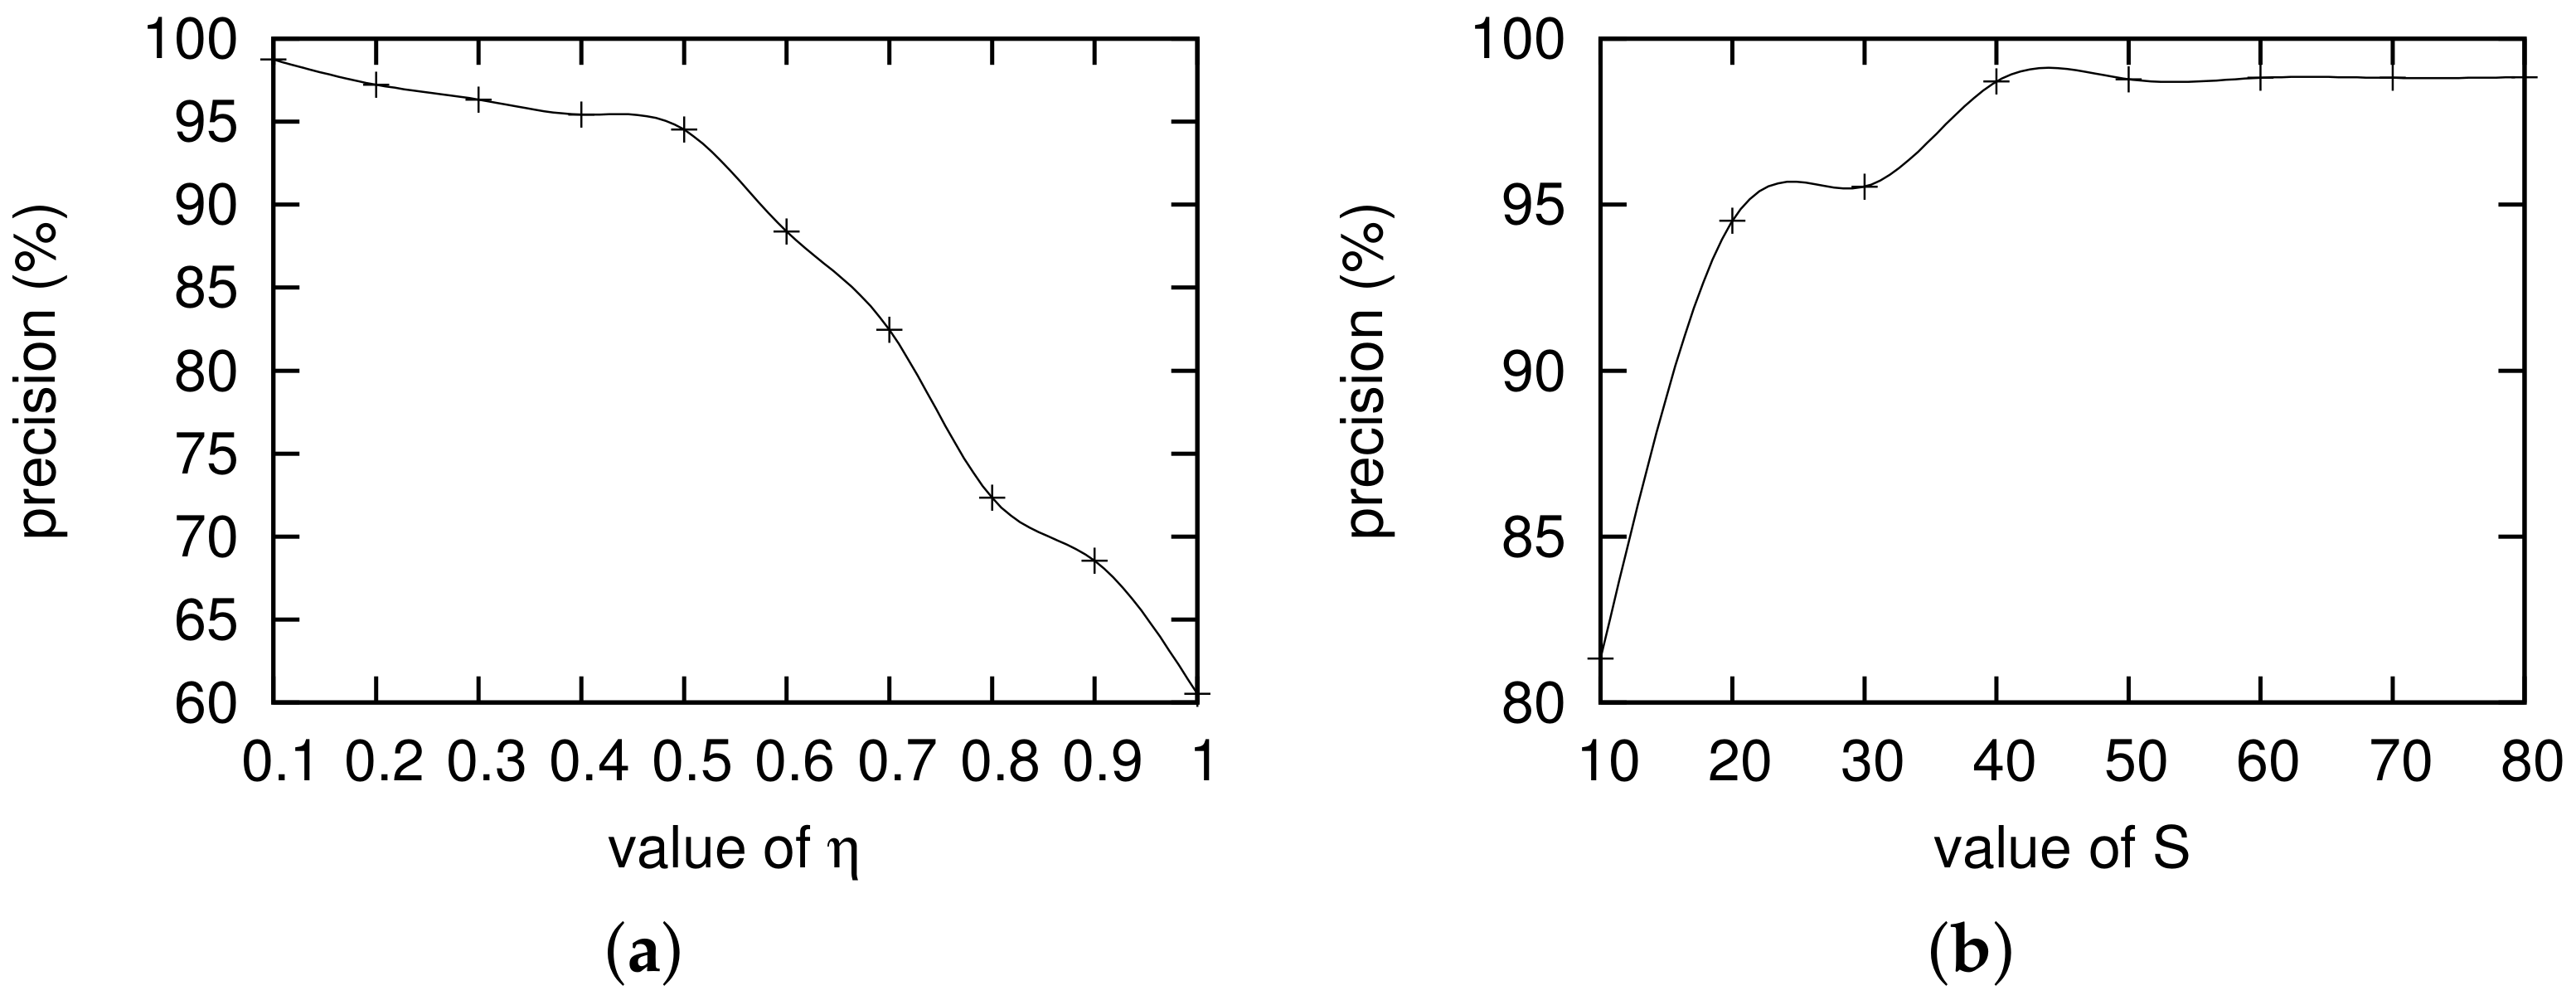
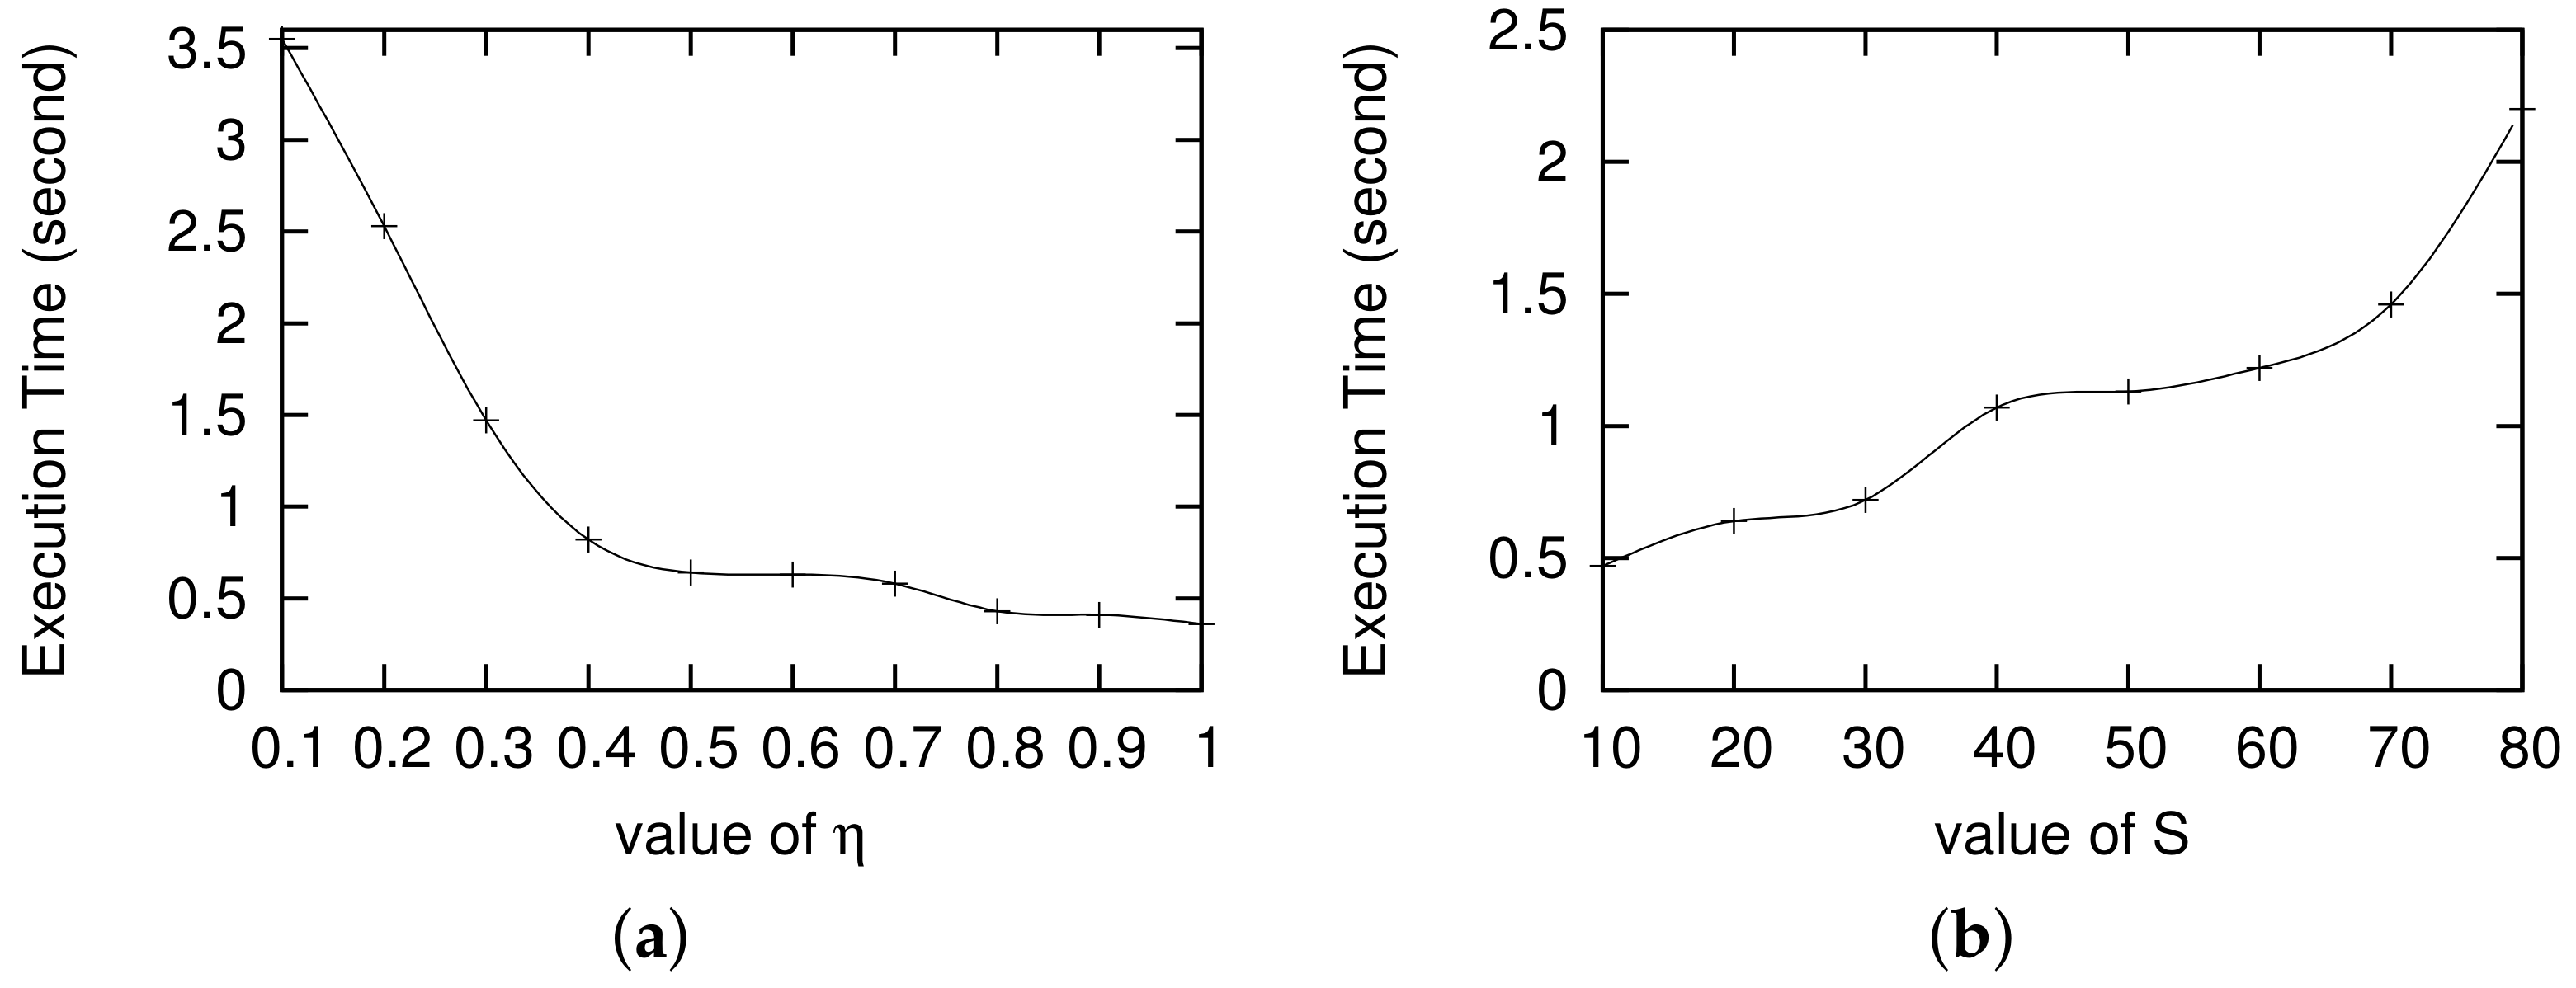
3.1. Impact of and S
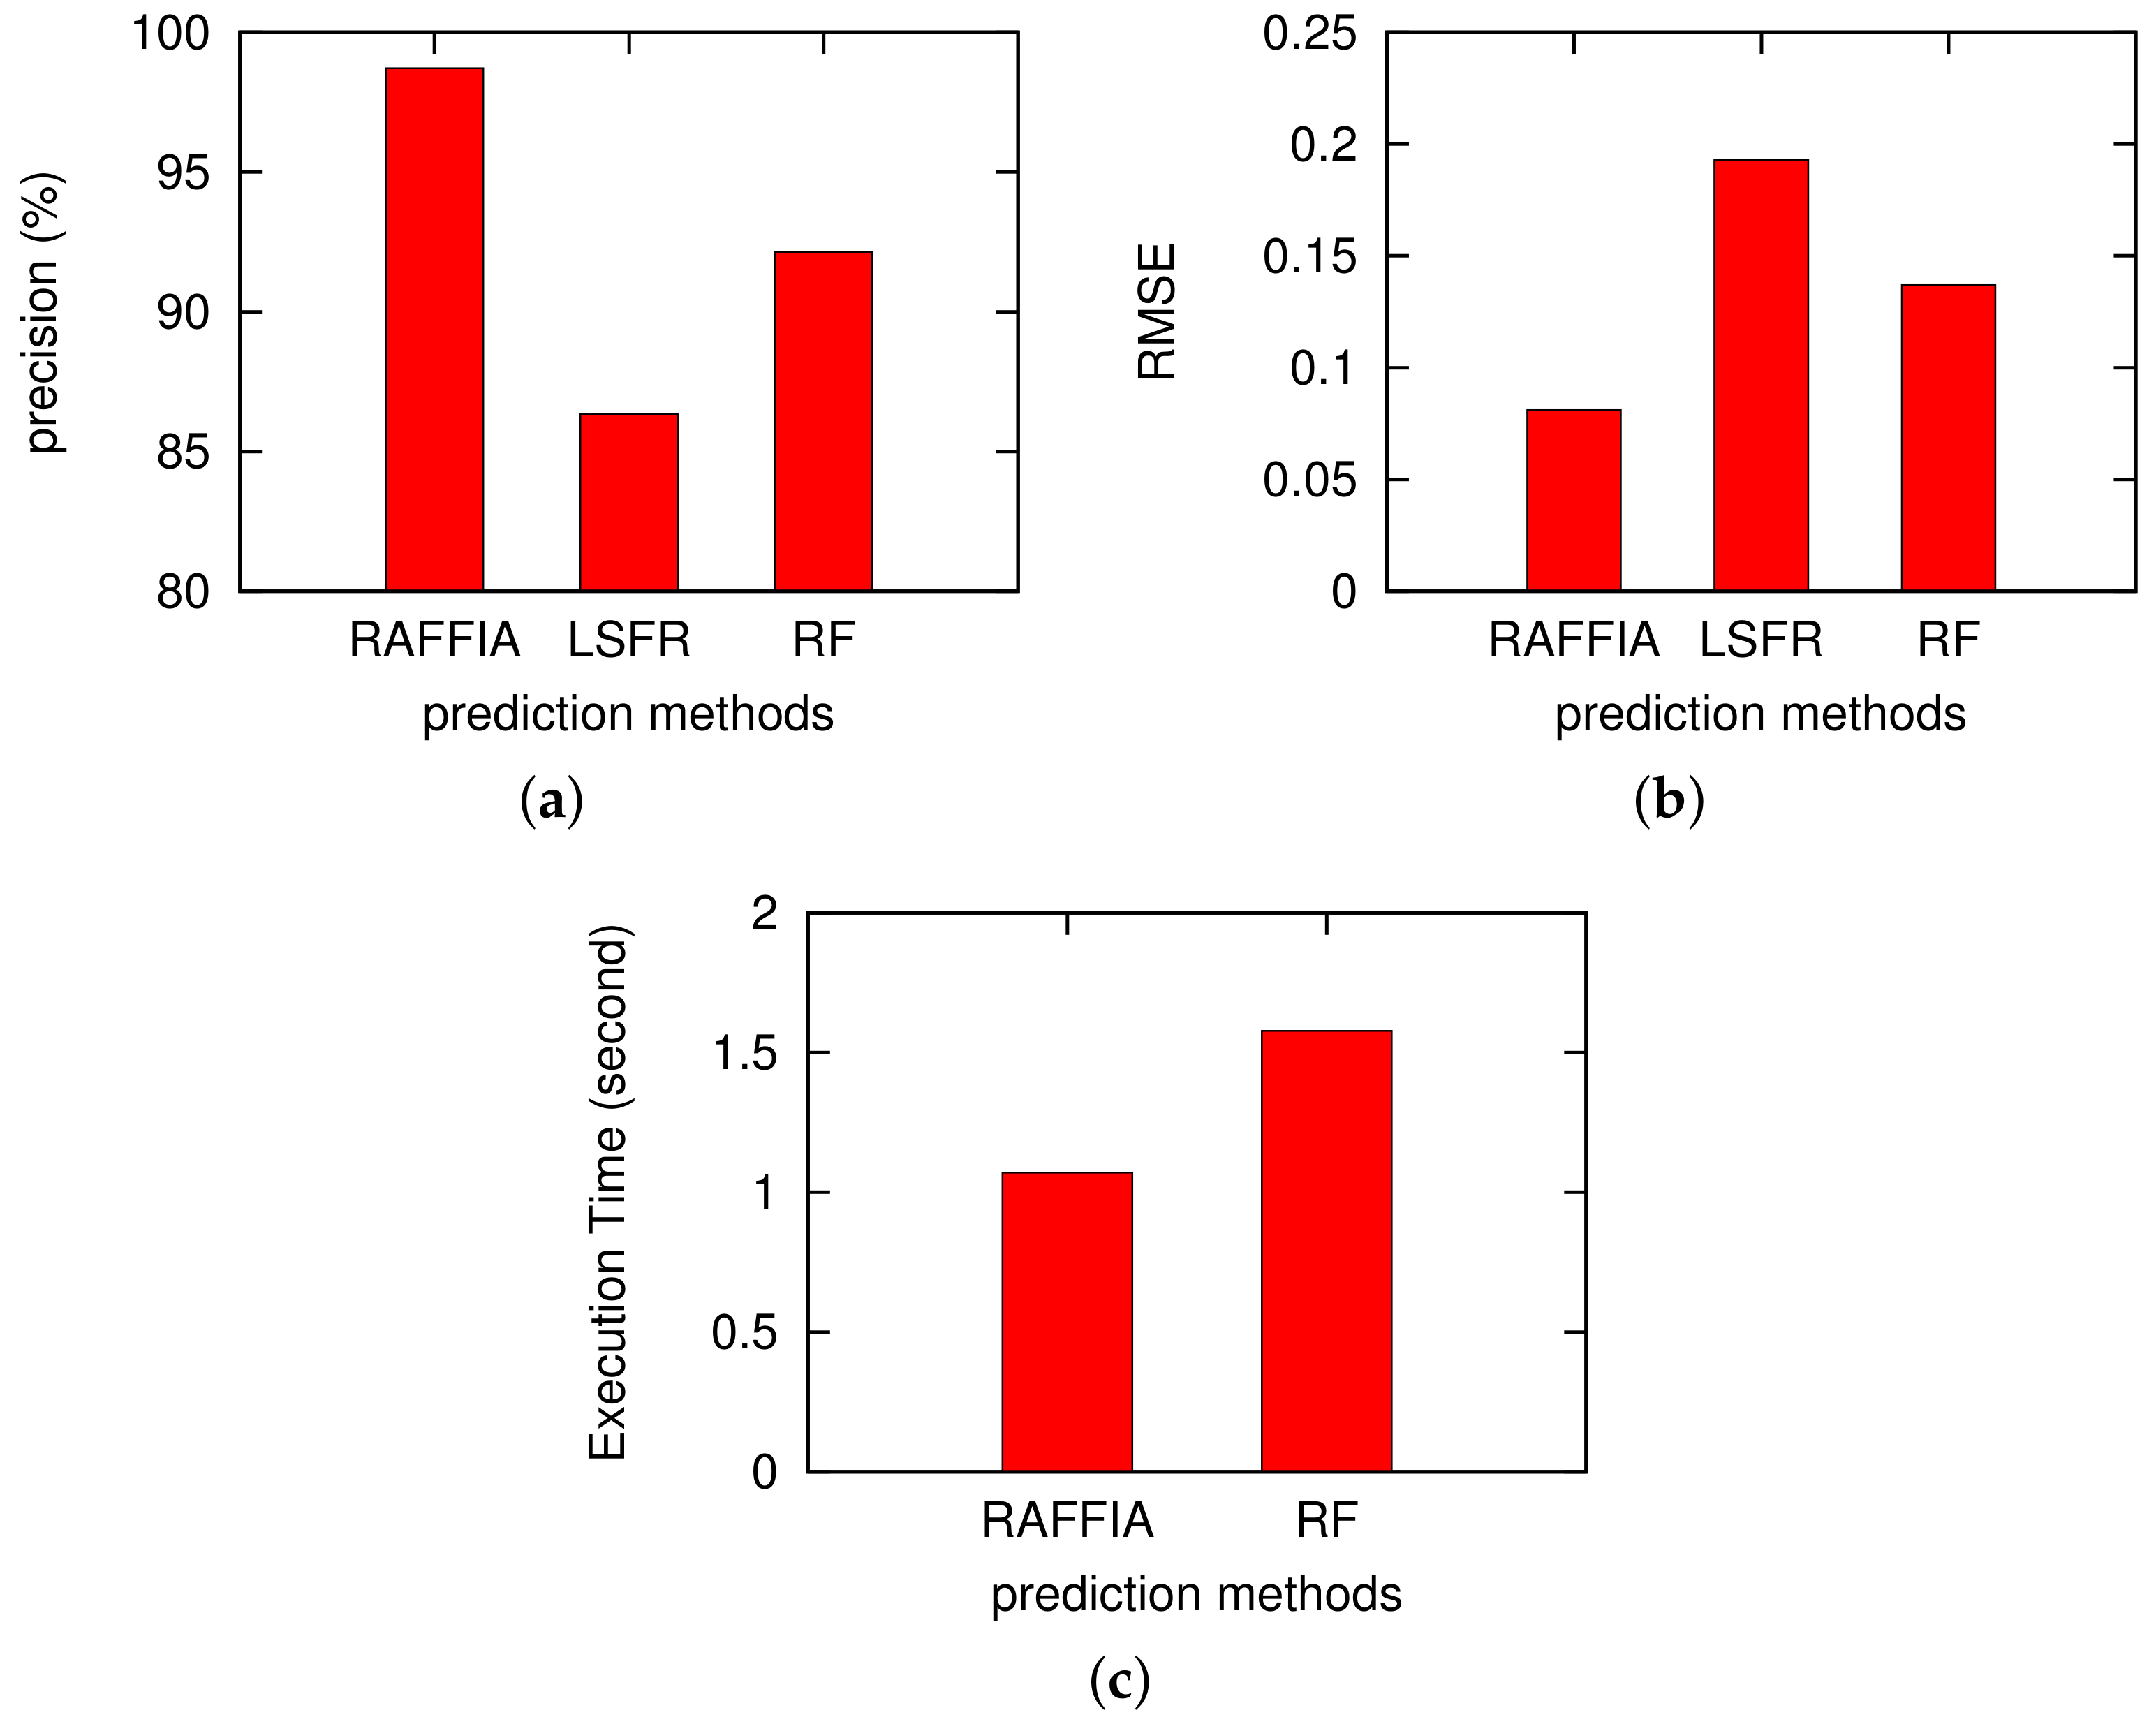
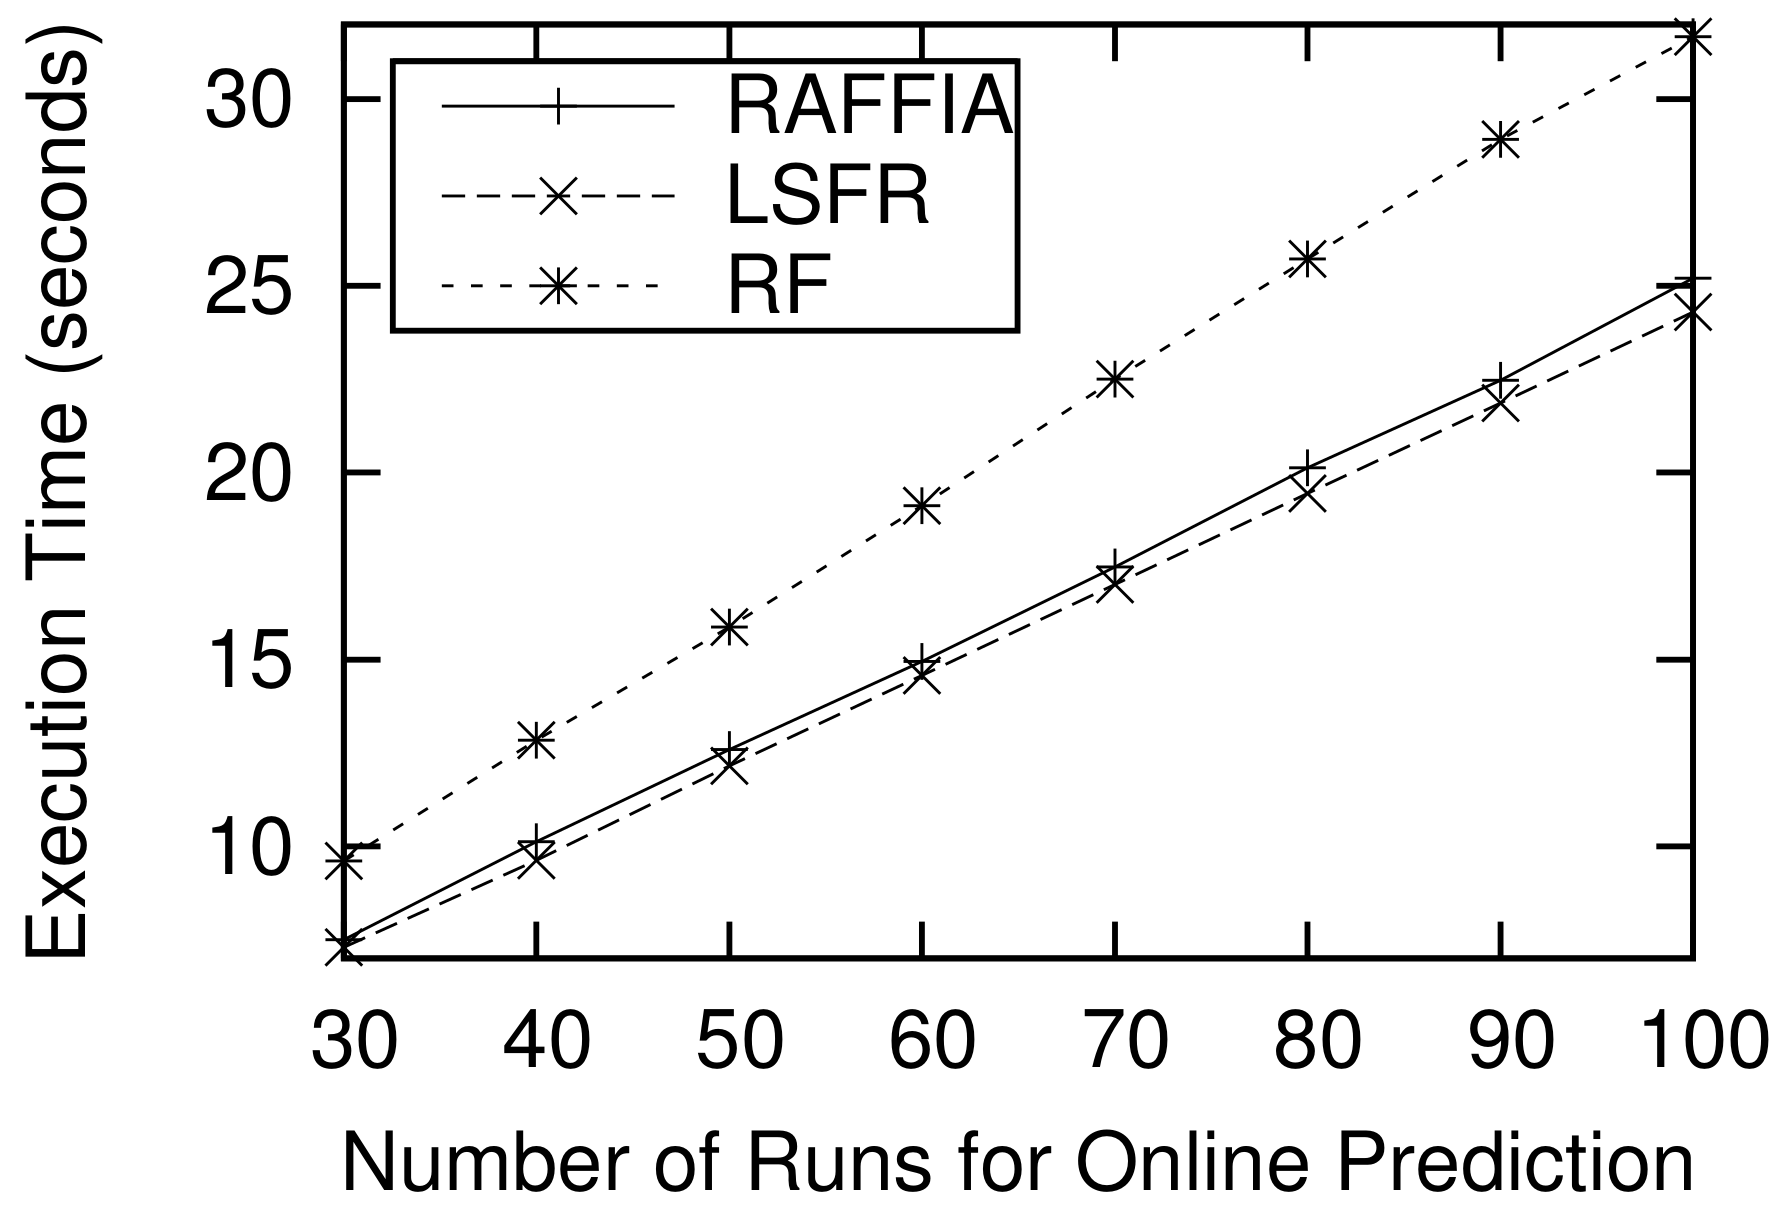
3.2. Performance Comparison
4. Discussion
5. Conclusions
Author Contributions
Funding
Conflicts of Interest
References
- Mithal, V.; Garg, A.; Boriah, S.; Steinbach, M.; Kumar, V.; Potter, C.; Klooster, S.; Castilla-Rubio, J.C. Monitoring global forest cover using data mining. ACM Trans. Intell. Syst. Technol. 2011, 2, 36. [Google Scholar] [CrossRef]
- Jurvélius, M. HEALTH AND PROTECTION | Forest Fires (Prediction, Prevention, Preparedness and Suppression). In Encyclopedia of Forest Sciences; Burley, J., Ed.; Elsevier: Oxford, UK, 2004; pp. 334–339. [Google Scholar]
- Kurz, W.; Apps, M. Developing Canada’s national forest carbon monitoring, accounting and reporting system to meet the reporting requirements of the Kyoto Protocol. Mitig. Adapt. Strateg. Glob. Chang. 2006, 11, 33–43. [Google Scholar] [CrossRef]
- Feikema, P.M.; Sherwin, C.B.; Lane, P.N. Influence of climate, fire severity and forest mortality on predictions of long term streamflow: Potential effect of the 2009 wildfire on Melbournes water supply catchments. J. Hydrol. 2013, 488, 1–16. [Google Scholar] [CrossRef]
- de Groot, W.J.; Wotton, B.M.; Flannigan, M.D. Wildland Fire Danger Rating and Early Warning Systems. Wildfire Hazards Risks Disasters 2014, 207–228. [Google Scholar] [CrossRef]
- Saoudi, M.; Bounceur, A.; Euler, R.; Kechadi, T. Data Mining Techniques Applied to Wireless Sensor Networks for Early Forest Fire Detection. In Proceedings of the International Conference on Internet of Things and Cloud Computing; ACM: New York, NY, USA, 2016; p. 71. [Google Scholar]
- Beck, J. Equations for the forest fire behaviour tables for Western Australia. CALM Sci. 1995, 1, 325–348. [Google Scholar]
- Deeming, J.E.; Burgan, R.E.; Cohen, J.D. The National Fire-Danger Rating System–1978. In USDA Forest Service General Technical Report INTUS (USA), INT-39; Department of Agriculture, Forest Service, Intermountain Forest and Range Experiment Station: Ogden, UT, USA, 1977; p. 63. [Google Scholar]
- Van Wagner, C.; Forest, P. Development and Structure of the Canadian Forest Fire Weather Index System; The Print Shoppe LTO; Canadian Forestry Service: Ottawa, ON, Canada, 1987. [Google Scholar]
- Beverly, J.L.; Herd, E.P.; Conner, J.R. Modeling fire susceptibility in west central Alberta, Canada. For. Ecol. Manag. 2009, 258, 1465–1478. [Google Scholar] [CrossRef]
- Sharples, J.; McRae, R.; Weber, R.; Gill, A.M. A simple index for assessing fire danger rating. Environ. Modell. Softw. 2009, 24, 764–774. [Google Scholar] [CrossRef]
- Elmas, Ç.; Sönmez, Y. A data fusion framework with novel hybrid algorithm for multi-agent Decision Support System for Forest Fire. Expert Syst. Appl. 2011, 38, 9225–9236. [Google Scholar] [CrossRef]
- Hamadeh, N.; Hilal, A.; Daya, B.; Chauvet, P. Studying the factors affecting the risk of forest fire occurrence and applying neural networks for prediction. In Proceedings of the SAI Intelligent Systems Conference, London, UK, 10–11 November 2015; pp. 522–526. [Google Scholar]
- Sakr, G.E.; Elhajj, I.H.; Mitri, G.; Wejinya, U.C. Artificial intelligence for forest fire prediction. In Proceedings of the 2010 IEEE/ASME International Conference on Advanced Intelligent Mechatronics, Montreal, ON, Canada, 6–9 July 2010; pp. 1311–1316. [Google Scholar] [CrossRef]
- Chuvieco, E.; Aguado, I.; Yebra, M.; Nieto, H.; Salas, J.; Martín, M.P.; Vilar, L.; Martínez, J.; Martín, S.; Ibarra, P.; et al. Development of a framework for fire risk assessment using remote sensing and geographic information system technologies. Ecol. Model. 2010, 221, 46–58. [Google Scholar] [CrossRef]
- Ichoku, C.; Kaufman, Y.J. A method to derive smoke emission rates from MODIS fire radiative energy measurements. IEEE Trans. Geosci. Remote Sens. 2005, 43, 2636–2649. [Google Scholar] [CrossRef]
- Katurji, M.; Nikolic, J.; Zhong, S.; Pratt, S.; Yu, L.; Heilman, W.E. Application of a statistical emulator to fire emission modeling. Environ. Model. Softw. 2015, 73, 254–259. [Google Scholar] [CrossRef]
- Kane, V.R.; Lutz, J.A.; Cansler, C.A.; Povak, N.A.; Churchill, D.J.; Smith, D.F.; Kane, J.T.; North, M.P. Water balance and topography predict fire and forest structure patterns. For. Ecol. Manag. 2015, 338, 1–13. [Google Scholar] [CrossRef]
- Pourtaghi, Z.S.; Pourghasemi, H.R.; Aretano, R.; Semeraro, T. Investigation of general indicators influencing on forest fire and its susceptibility modeling using different data mining techniques. Ecol. Indic. 2016, 64, 72–84. [Google Scholar] [CrossRef]
- Sakr, G.E.; Elhajj, I.H.; Mitri, G. Efficient forest fire occurrence prediction for developing countries using two weather parameters. Eng. Appl. Artif. Intell. 2011, 24, 888–894. [Google Scholar] [CrossRef]
- Tian, X.; Zhao, F.; Shu, L.; Wang, M. Distribution characteristics and the influence factors of forest fires in China. For. Ecol. Manag. 2013, 310, 460–467. [Google Scholar] [CrossRef]
- Pacheco, A.P.; Claro, J.; Fernandes, P.M.; de Neufville, R.; Oliveira, T.M.; Borges, J.G.; Rodrigues, J.C. Cohesive fire management within an uncertain environment: A review of risk handling and decision support systems. For. Ecol. Manag. 2015, 347, 1–17. [Google Scholar] [CrossRef]
- Shang, Z.; He, H.S.; Lytle, D.E.; Shifley, S.R.; Crow, T.R. Modeling the long-term effects of fire suppression on central hardwood forests in Missouri Ozarks, using LANDIS. For. Ecol. Manag. 2007, 242, 776–790. [Google Scholar] [CrossRef]
- Mölders, N. Comparison of Canadian Forest Fire Danger Rating System and National Fire Danger Rating System fire indices derived from Weather Research and Forecasting (WRF) model data for the June 2005 Interior Alaska wildfires. Atmos. Res. 2010, 95, 290–306. [Google Scholar] [CrossRef]
- Wang, L.; Wang, H.; Yu, Q.; Sun, H.; Bouguettaya, A. Online reliability time series prediction for service-oriented system of systems. In Service-Oriented Computing; Springer: Berlin/Heidelberg, Germany, 2013; pp. 421–428. [Google Scholar]
- Wang, H.; Wang, L.; Yu, Q.; Zheng, Z.; Bouguettaya, A.; Lyu, M.R. Online Reliability Prediction via Motifs-Based Dynamic Bayesian Networks for Service-Oriented Systems. IEEE Trans. Softw. Eng. 2017, 43, 556–579. [Google Scholar] [CrossRef]
- Wang, H.; Wang, L.; Yu, Q.; Zheng, Z.; Yang, Z. A proactive approach based on online reliability prediction for adaptation of service-oriented systems. J. Parallel Distrib. Comput. 2018, 114, 70–84. [Google Scholar] [CrossRef]
- Iliadis, L. A decision support system applying an integrated fuzzy model for long-term forest fire risk estimation. Environ. Model. Softw. 2005, 20, 613–621. [Google Scholar] [CrossRef]
- Mahmood, A.; Shi, K.; Khatoon, S.; Xiao, M. Data mining techniques for wireless sensor networks: A survey. Int. J. Distrib. Sens. Netw. 2013, 2013, 1–24. [Google Scholar] [CrossRef]
- Sabri, Y.; Kamoun, N.E. A prototype for wireless sensor networks to the detection of forest fires in large-scale. Next Gener. Netw. Serv. 2012, 116–122. [Google Scholar] [CrossRef]
- Salfner, F.; Lenk, M.; Malek, M. A survey of online failure prediction methods. ACM Comput. Surv. 2010, 42, 10. [Google Scholar] [CrossRef]
- Wang, H.; Wang, L.; Yu, C. Integrating trust with qualitative and quantitative preference for service selection. In Proceedings of the IEEE International Conference on Services Computing, Anchorage, AK, USA, 27 June–2 July 2014; pp. 299–306. [Google Scholar]
- Wang, H.; Yu, C.; Wang, L.; Yu, Q. Effective BigData-Space Service Selection over Trust and Heterogeneous QoS Preferences. IEEE Trans. Serv. Comput. 2018, 11, 644–657. [Google Scholar] [CrossRef]
- Zeng, L.; Benatallah, B.; Ngu, A.H.; Dumas, M.; Kalagnanam, J.; Chang, H. Qos-aware middleware for web services composition. IEEE Trans. Softw. Eng. 2004, 30, 311–327. [Google Scholar] [CrossRef]
- Bishop, C. Pattern Recognition and Machine Learning; Springer: New York, NY, USA, 2006. [Google Scholar]
- LeCun, Y.; Bottou, L.; Bengio, Y.; Haffner, P. Gradient-based learning applied to document recognition. Proc. IEEE 1998, 86, 2278–2324. [Google Scholar] [CrossRef]
- Saaty, T.L. Decision making with the analytic hierarchy process. Int. J. Serv. Sci. 2008, 1, 83–98. [Google Scholar] [CrossRef]


| Rating | Danger Degree | Flammable Degree | Warning Color | |
|---|---|---|---|---|
| 1 | 0.2 | Very Low | Difficult | Green |
| 2 | 0.4 | Low | Very Difficult | Blue |
| 3 | 0.6 | High | Easy | Yellow |
| 4 | 0.8 | Very High | Very Easy | Orange |
| 5 | 1.0 | Extremely High | Extremely Easy | Red |
| Variables | Sensors | Units | Data Ranges |
|---|---|---|---|
| Model 107 Temperature Probe | C | ||
| IRGASON Integrated CO/HO Open-Path Gas Analyzer and 3D Sonic Anemometer | m/s | 65.553 | |
| Model HMP 155A Temperature and Relative Humidity Probe | %RH | [0,100] | |
| TE525 Tipping Bucket Rain Gage | mm/h | [0,30] | |
| SR50A | m | [0.5,10] | |
| Model HFP01 Soil Heat Flux Plate | %(m/m) | [0,100] |
© 2018 by the authors. Licensee MDPI, Basel, Switzerland. This article is an open access article distributed under the terms and conditions of the Creative Commons Attribution (CC BY) license (http://creativecommons.org/licenses/by/4.0/).
Share and Cite
Wang, L.; Zhao, Q.; Wen, Z.; Qu, J. RAFFIA: Short-term Forest Fire Danger Rating Prediction via Multiclass Logistic Regression. Sustainability 2018, 10, 4620. https://doi.org/10.3390/su10124620
Wang L, Zhao Q, Wen Z, Qu J. RAFFIA: Short-term Forest Fire Danger Rating Prediction via Multiclass Logistic Regression. Sustainability. 2018; 10(12):4620. https://doi.org/10.3390/su10124620
Chicago/Turabian StyleWang, Lei, Qingjian Zhao, Zuomin Wen, and Jiaming Qu. 2018. "RAFFIA: Short-term Forest Fire Danger Rating Prediction via Multiclass Logistic Regression" Sustainability 10, no. 12: 4620. https://doi.org/10.3390/su10124620
APA StyleWang, L., Zhao, Q., Wen, Z., & Qu, J. (2018). RAFFIA: Short-term Forest Fire Danger Rating Prediction via Multiclass Logistic Regression. Sustainability, 10(12), 4620. https://doi.org/10.3390/su10124620