Article

Measure or Management?—Resource Use Indicators for Policymakers Based on Microdata by Households

1
Wuppertal Institut fuer Klima, Umwelt, Energie gGmbH, Division Sustainable Production and Consumption, Doeppersberg 19, 42103 Wuppertal, Germany
2
Industrial Design, Folkwang University of the Arts, Klemensborn 39, 45239 Essen, Germany
3
Faculty of Management and Economics, Ruhr University Bochum, Universitätsstraße 150, 44801 Bochum, Germany
*
Author to whom correspondence should be addressed.
Sustainability 2018, 10(12), 4467; https://doi.org/10.3390/su10124467
Submission received: 28 September 2018 / Revised: 14 November 2018 / Accepted: 16 November 2018 / Published: 28 November 2018

Abstract

:
Sustainable Development Goal 12 (SDG 12) requires sustainable production and consumption. One indicator named in the SDG for resource use is the (national) material footprint. A method and disaggregated data basis that differentiates the material footprint for production and consumption according to, e.g., sectors, fields of consumption as well as socioeconomic criteria does not yet exist. We present two methods and its results for analyzing resource the consumption of private households based on microdata: (1) an indicator based on representative expenditure data in Germany and (2) an indicator based on survey data from a web tool. By these means, we aim to contribute to monitoring the Sustainable Development Goals, especially the sustainable management and efficient use of natural resources. Indicators based on microdata ensure that indicators can be disaggregated by socioeconomic characteristics like age, sex, income, or geographic location. Results from both methods show a right-skewed distribution of the Material Footprint in Germany and, for instance, an increasing Material Footprint with increasing household income. The methods enable researchers and policymakers to evaluate trends in resource use and to differentiate between lifestyles and along socioeconomic characteristics. This, in turn, would allow us to tailor sustainable consumption policies to household needs and restrictions.

1. Introduction

Meeting the resource demand of a growing global consumer class increasingly affects the environment and places a burden on climate and ecosystems [1]. Since household consumption and production for consumer goods are at the core of the present resource-intensive lifestyles, it is important to analyze the behavior of private households and assist them in transforming their routines into more sustainable ones. This means providing new technologies, products, and services that enable, perhaps even stimulate, a resource-friendly life. Production and consumption in this sense form an interlaced system that can only be thought and developed in an integrated way.
Resource efficiency in the context of sustainable production and consumption is currently gaining attention on a national and international level. The current trend towards Product Service Systems (PSS) as an approach for increasing sustainability can contribute to a sustainable way of linking consumption and production [2,3,4,5]. Several attempts have been made to support the development of low-resource and socially accepted approaches of integrating production and consumption. Examples for this are the Consumer Information Program of the 10 Year Framework of Programmes on Sustainable Consumption and Production (10YFP) as well as the European Union with its Ecodesign Directive [6,7].
The Sustainable Development Goal 12 (SDG 12) “Ensure sustainable production and consumption patterns” integrates a wide range of stakeholders into the process of increasing sustainability in consumption and production [8]. However, the ambitious SDGs and their subgoals require appropriate indicators for measuring the status quo and the progress until 2030. There is a lack of indicators which are able to provide the necessary differentiation for socioeconomic characteristics like sex, age, or income [9] and fields of consumption like housing or mobility that hampers the process of providing improved assistance for producers and consumers in implementing more sustainable product-service systems and production and consumption patterns [10] as advocated by SDG 12.
Germany published its first sustainability strategy in 2002 and reports the progress towards its goals every four years [11]. This strategy includes different indicators for measuring the development of sustainability in Germany. The latest update from 2016 adopts the framework of the Sustainable Development Goals (SDGs). Besides this strategy, Germany implemented a National Program on Sustainable Consumption that aims to identify the relevant fields of action and adequate measures [12]. It gives five guiding principles for a sustainable consumption policy, for example enabling consumers to implement a sustainable way of consumption. In this respect, the German Program on Resource Efficiency (Progress II) demands the implementation of a National Program on Sustainable Consumption in order to promote resource efficiency in consumption [13]. Therefore the program strives to develop and improve its set of indicators for a better measurement of the effects of changes in consumption. Behavioral changes in favor of more resource efficient consumption are still hampered by obstacles such as a lack of information and personalized feedback applications. The National Program on Sustainable Consumption suggests providing such information by the use of assisting carbon and resource calculators [12].
Certain routines and social practices in consumption, as well as patterns in production and existing business models, complicate a change towards a more sustainable behavior [14]. Sustainable consumption requires sustainably designed product service systems and infrastructures [15]. It is only possible to shape both together and step by step. Progress or regression, as well as rebound effects, must be visible and therefore demonstrable. Indicators play a crucial role in setting up goals and measuring progress in this regard. They simplify the complex cause-effect chains within our societies, economies, and with our environment. On a national level, indicators can be used to develop pathways for sustainability or to identify trends. Scenario developers usually use these goals and indicators to define a target corridor in comparison to a status quo or business-as-usual. They are but a tool for aggregated measurement of impacts and not their management.
However, indicators can potentially also be a tool to evaluate and inform in a differentiated way by depicting and sometimes explaining the differences—with the means of modern societies almost in real time. This would make them relevant not only politically (programmes and measures), but also in everyday decision-making situations, whether in a company (products, infrastructures) or in a household (lifestyles). This can be achieved using microdata (e.g., from online surveys) and combining it with already existing methods.
Recent research has managed to quantify some levels of sustainable resource use. While the global material extraction has drastically increased over the last four decades (from 26.7 billion tonnes in 1970 to 75.6 billion tonnes in 2010) [16], material consumption levels in Europe already reached 40 tonnes per capita and more at the beginning of the century [17]. By comparison, Lettenmeier et al. calculated a sustainable level of only 8 tonnes of a Material Footprint (per person and year) [18], using the MIPS concept (Material Input Per unit of Service) This means a reduction by the factor five, which requires an appropriate consumer policy and education for sustainable consumption patterns [19]. MIPS (developed by Schmidt-Bleek in the 1990s [20]) provides micro-economic indicators for the resource use of households that include the extraction of materials with and without economic use (e.g., overburden from mining). Its methodology is based on Material-Flow-Accounting and compatible with similar input indicators such as cumulated energy demand (ced) or cumulated raw material demand (KRA). Its indicator Material Footprint can also be adapted to the currently suggested SDG 12 indicator with the same name. Recent methodological developments make use of improved LCA data [21,22,23,24,25].
Further research in the field also allowed us to differentiate between different household types (milieus) and their resource use, although limited to small samples of selected households using a diary approach. It could also be shown that the calculation of Material Footprints for households is compatible with methods for the calculation of Carbon Footprints, thus allowing us to compare lifestyles with high resource use but low carbon intensity and vice versa [21,26].
Two tools have developed that aim at supporting consumers in transforming their consumption patterns and are supposed to develop synergy effects by combining them. Buhl et al. [10] developed a Material Footprint (MF) indicator based on the MIPS concept and microeconomic expenditure data in Germany. This indicator was already used to analyze the behavior of households in Germany and the German federal state of North Rhine-Westphalia (NRW) and allows for differentiation between regions (here, the federal states of Germany and Germany itself), socioeconomic characteristics of households and between categories of consumption. The other method is based on microdata that is directly obtained from an online tool. The “Resource Calculator” [27] is a free online application that enables consumers to examine their consumption patterns by calculating their own Material Footprint. Consumers can also supply information about their socioeconomic characteristics on a voluntary and anonymous basis (such as age or years of schooling). Thus, the Resource Calculator provides an anonymized dataset for analyzing the resource use of private households that—in future—could provide a representative basis for a new indicator of consumption in the future using a consumer panel. The calculator itself could also be developed further as an interactive tool for real-time decision making in all-day routines and practices.
The aim of this paper is to contribute to the process of examining the consumption patterns of households and to provide the means for micro-economic SDG indicators. Using the example of natural resource use, the authors show how environmental indicators can be differentiated for private household types and categories of consumption. We posit that using microdata is a viable solution to distinguish between the age, sex, income, ethnicity, geographic location, and other characteristics as required by national policies in Germany [28,29,30]. We propose to enhance the present highly aggregated macro-oriented indicator system for SDG 12 with the help of disaggregating microeconomic data and indicators.
We hypothesize that a micro-based Resource Consumption Indicator could be an adequate tool to monitor consumer’s Material Footprint and target achievement (measurement but also management). Differentiating indicators between arrays of consumption and different consumer groups reveal shifts and changes between arrays and groups that may otherwise stay undetected and camouflaged by aggregated macro indicators. Additionally, the online tool based Resource Lifestyle Footprint could help to facilitate achieving the given targets and address the different types of households and lifestyles appropriately in this process.
We start by introducing the data and methods that we used in Section 2: the Resource Consumption Indicator (RCI) and the Resource Lifestyle Footprint (RLF). The results are presented in Section 3, followed by a discussion of limitations and the derived implications in Section 3. In Section 5 (conclusion), we put the results into the context of research and consumer policies.

2. Methodology

The following section describes briefly the methods and data used for calculating the Material Footprints of both Resource Consumption Indicator and Resource Lifestyle Footprint. The Resource Consumption Indicator (1) relates top-down resource-intensities of consumption in a country to expenditures of consumers. The Resource Lifestyle Footprint (2) models the resources of product-services and their use bottom up. Both approaches account for the amount of extracted abiotic and biotic materials from nature and relate them annually on a per person or per capita basis.

2.1. The Resource Consumption Indicator (RCI)

The first approach is based on tables on international trade (see Reference [31] on multi-regional footprint analysis). These multi-regional Input-/Output tables (MRIO) allow for the accounting of globally extracted raw materials (alongside other indicators) for goods consumed within a country (including imports but excluding exports of an economy). By allocating these goods to the consumption of households, country-specific resource-intensities are that can be directly linked to country-specific household expenditures calculated (see also References [32,33]). This top-down model converts traded monetary value into the physical material use of households, thus linking the macro-economy with microdata on the level of households. It provides a holistic view of resource consumption and is consistent when comparing countries with each other. Thus, it can be used to generate representative data on the resource use of households in countries and to differentiate levels of resource consumption depending on socioeconomic characteristics in the microdata. Buhl et al. (2016) [10] successfully applied the resource intensities to household expenditure data for Germany in order to describe the Material Footprint (sum of globally induced resource extractions) of different households in the federal state of North-Rhine-Westphalia in Germany itself.
The weakness of this top-down approach is its inability to explain the differences between household types and their resource consumption sufficiently. The highly aggregated data with respect to resource intensities based on MRIO tables also does not allow the identification of specific product and service options for more sustainable measures by households or policies catering towards a more resource-efficient lifestyle. This is where bottom-up models can help to fill data gaps by focusing on the most relevant areas of consumption and disaggregating further into different services and products.
To measure private household consumption for the approach of the Resource Consumption Indicator, data from the German Survey of Household Income and Consumption (EVS) for the years 2003, 2008 and 2013 were used. The EVS is conducted by the Federal Statistical Office, using household expenditure as a proxy for consumption. The data are structured into eleven main categories and 152 subcategories according to the Classification of Individual Consumption per Purpose (COICOP). The analysis described here focuses on the eleven main categories. Furthermore, the EVS includes socioeconomic data and enables a differentiation between different groups of households or individuals, clustered by characteristics such as age or household net income [10].
Table 1 shows the summary statistics for the yearly expenditures of the main categories between 2003 and 2013 in Germany.
The expenditures of households in the EVS were related to so-called resource intensity factors (household resource use per Euro). These factors stem from multi-regional input-output analyses (MRIO) of economy-wide material flow accounts and the continuous household budget surveys for Germany in the year 2005. Table 2 provides an overview of the average resource intensities in the main consumption categories [34].
Resource intensities allow the measurement of the impact of private consumption on the environment and can be used to calculate the Material Footprint of consumption. The calculation of the Material Footprint based on microdata on expenditure (EVS) and respective resource intensities of the main COICOP categories are described in Appendix A.
The further analysis is based on the differentiation between the main COICOP categories from “Food and beverages” to “Miscellaneous”. However, Buhl et al. (2016) show an application of the method that further differentiates within the main COICOP category “Transport” by calculating resource intensities for specific transport services like local and long distance trains, air travel, or the use of second-hand cars [10].

2.2. The Resource Lifestyle Footprint (RLF)

The “Resource Calculator” tool (see https://www.ressourcen-rechner.de/) provides a footprint of a household’s lifestyles. It calculates the Material Footprint of products, their services, and usage directly and over the whole lifecycle of their production, use, and end-of-life (including material extractions in other countries). It combines quantitative (and often physical) survey data on household consumption with survey data on socioeconomic characteristics and household attitudes in order to calculate an individual or lifestyle footprint. This approach allows us to identify drivers and barriers of resource use and matches socio-demographic characteristics, lifestyle decisions, subjective attitudes or assessments, social norms, and individual preferences as well as budget restrictions to the individual footprint or ecological backpack (see References [35,36] on the concept). Resource use can thus be reduced not only by consuming resource efficient products, but also by improving the service these products provide. This bottom-up model has been successfully tested in several studies ([18,21,26]) and is compliant with the Material Flow Accounting (MFA) and Life Cycle Assessment (LCA) methodology. It is also compatible with generic databases for lifecycle inventories as well as assessments of output indicators such as carbon footprints (as shown by References [22,23]).
The calculator generates a growing database because of its permanent online accessibility. Besides questions regarding the most important fields of consumption like housing and mobility, users can voluntarily and anonymously provide data concerning their socioeconomic characteristics. This was surveyed alongside other subjective attitudes and norms such as relative household income in comparison, subjective health or subjective well-being. Table 3 lists the different areas of private consumption in the Resource Calculator.
The Resource Calculator application was advertised via different channels such as the website of the Wuppertal Institute, online blogs on sustainable living, and reviews of product testing magazines. Between the launch on 25 February 2015 and 13 February 2017, 49,037 persons participated without any incentives. Data preparation and the removal of invalid and implausible responses left a database of 44,514 being analyzed. For a more detailed description, necessary transformations and underlying assumptions see Buhl et al., 2017 [27]. Table 4 comprehends the most relevant dimensions and variables surveyed by the Resource Calculator. Socioeconomic, personal, and household characteristics, as well as subjective assessments and other lifestyle features, complement disaggregated information on the Material Footprint.

3. Results

The following section shows original results as well as results from recent studies on the Resource Calculator using the methods and data sets described in Section 2.

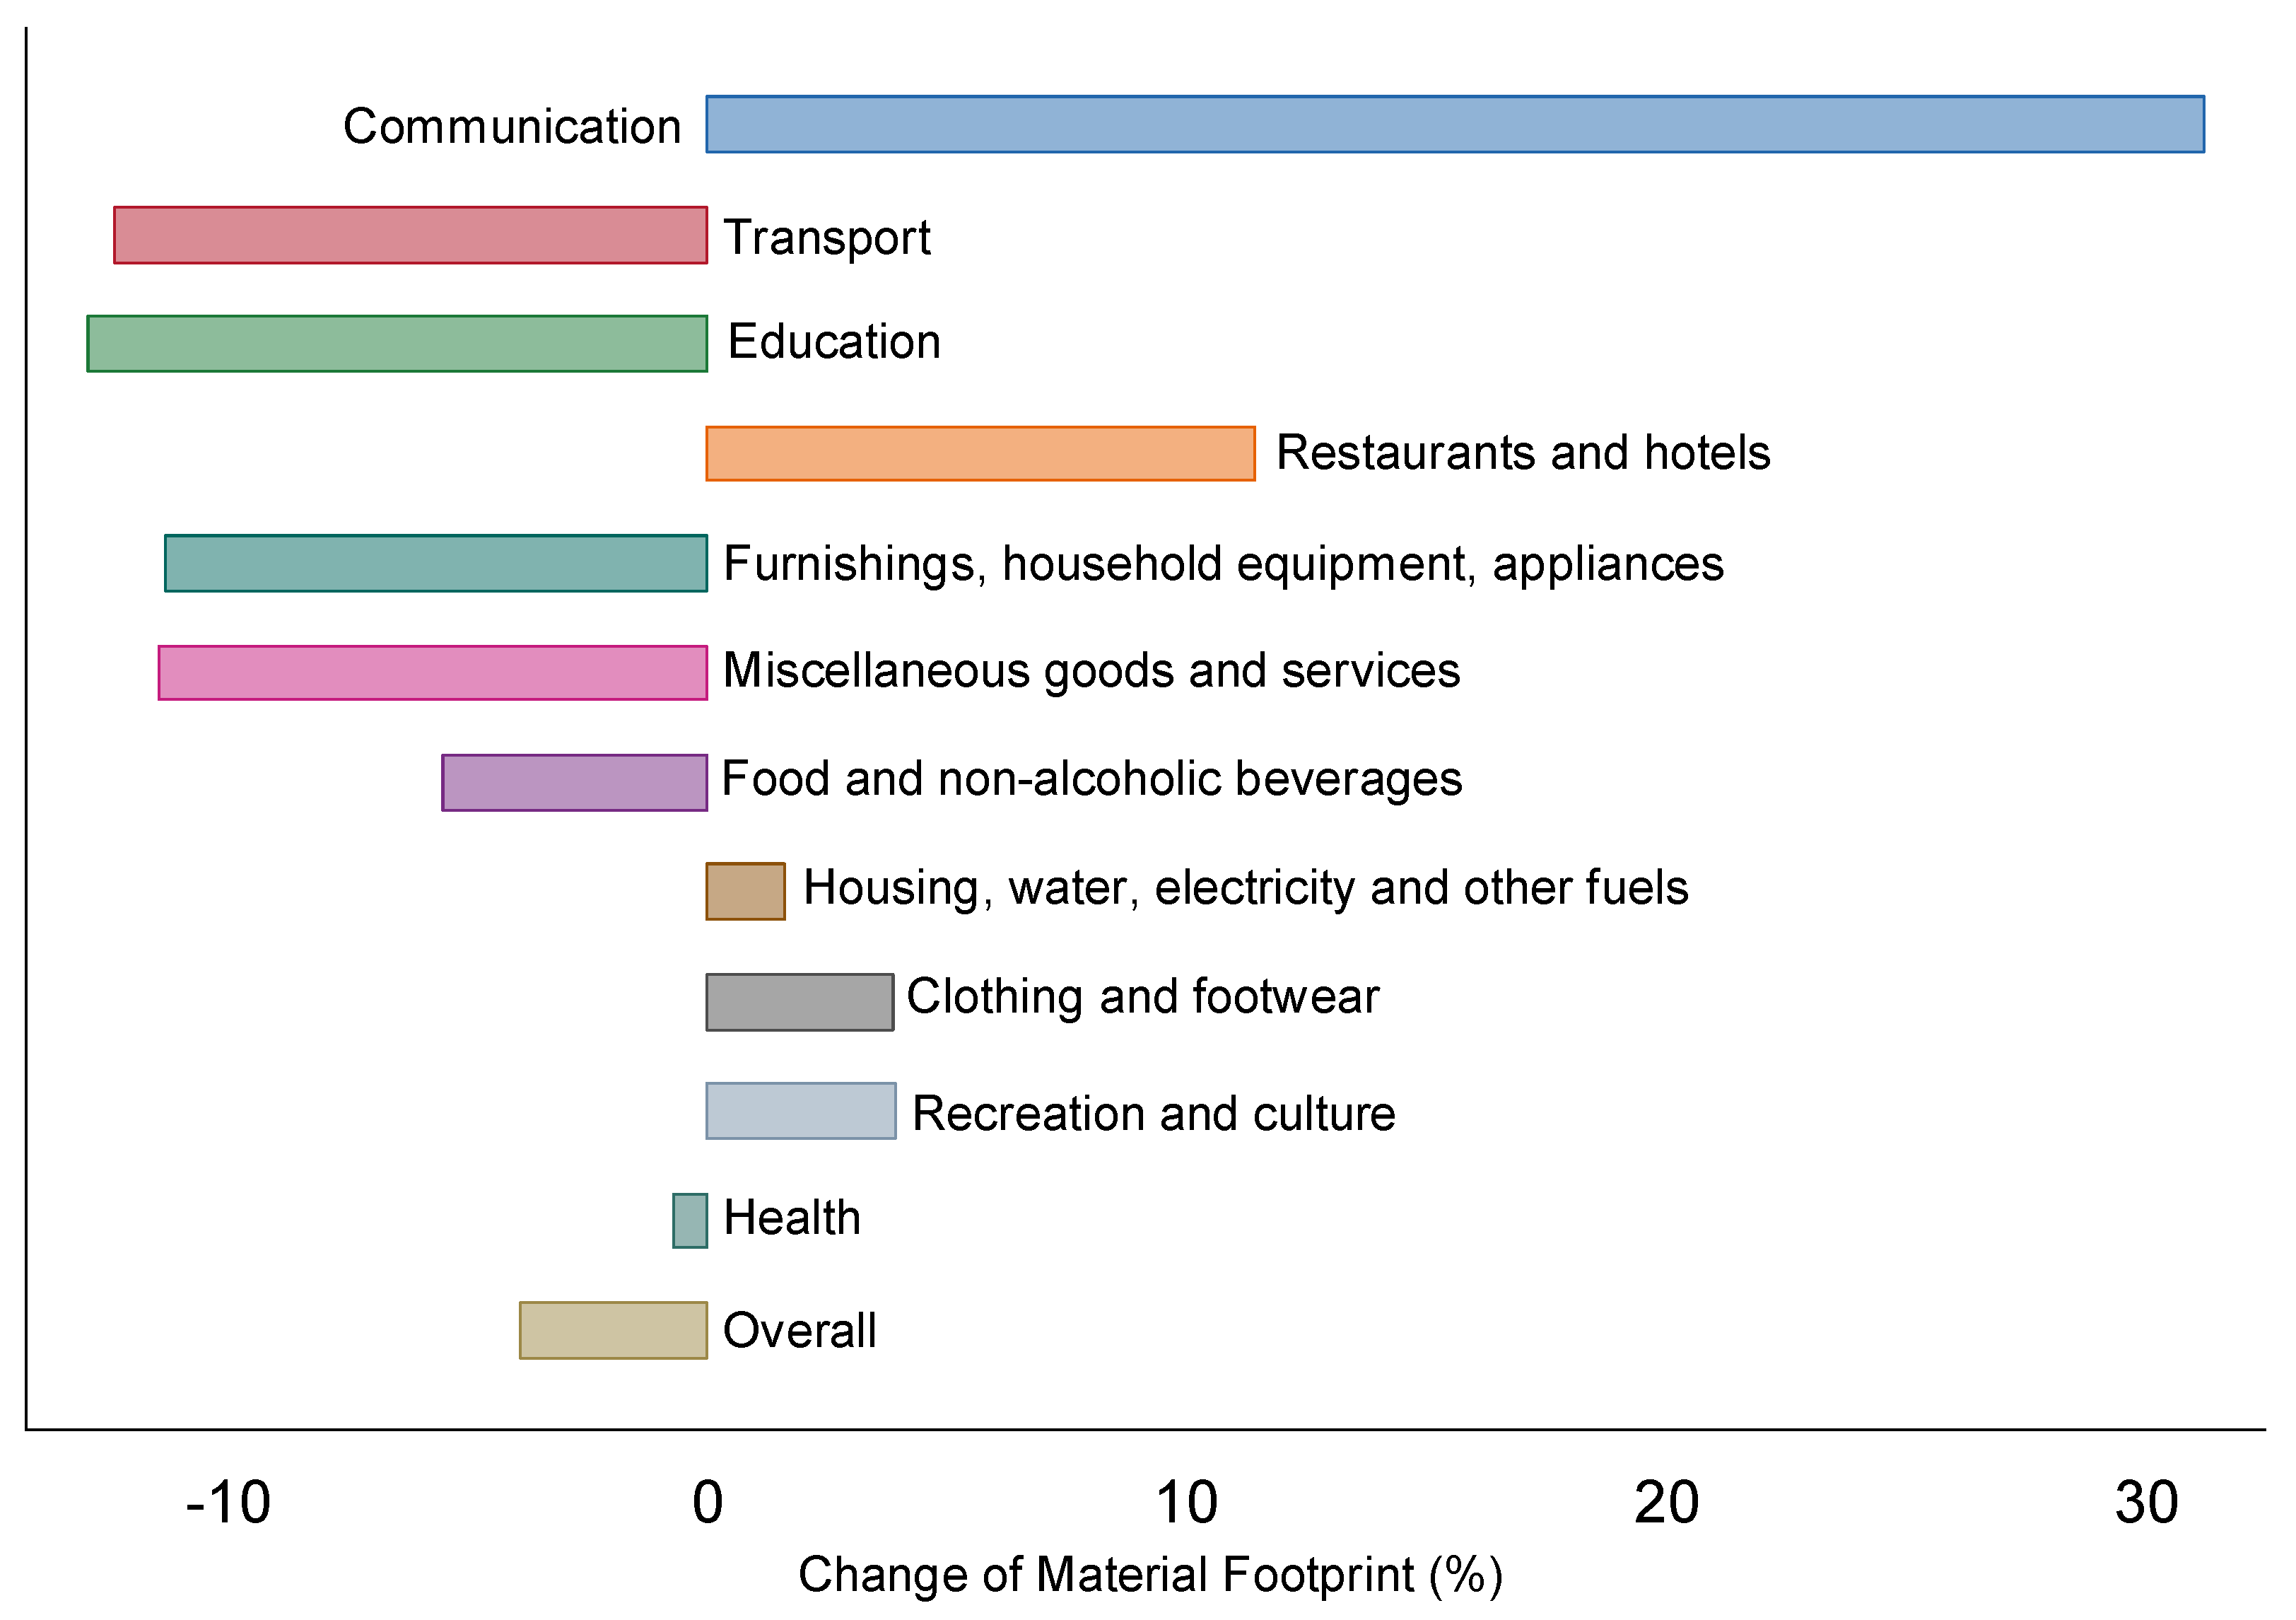
3.1. Resource Consumption Indicator Based on Microdata EVS and Resource Intensities

The RCF was used to monitor the resource use of private households in the sustainability report of the Ministry for Environment, Agriculture, Conservation, and Consumer Protection of the State of North Rhine-Westphalia (NRW). One aim was to examine if and to which extent the Resource Indicator can contribute to the goals and indicators of SDG 12 and how it could be improved. For this purpose, the EVS data and the resource intensity data described in Section 2.1. were used as a database.
The Material Footprint of private households in NRW accounted for 31 t per capita in 2013. Using microdata enabled the researchers to further analyze the distribution of the Material Footprint among households. Figure 1 shows a right-skewed distribution although the 99th percentile was removed. This implies a relatively strong bias of the average Material Footprint due to relatively few households being responsible for relatively high amounts of resource use.
The application of the indicator of private household data from NRW revealed three categories that accounted for the highest shares in resource consumption: housing, food, and transport [32,37]. However, smaller shares on household expenditure do not necessarily lead to lower Material Footprints, as resource intensities can be very different between categories of consumption.
Figure 2 shows the overall change in resource use of private households in NRW between 2003 and 2013. The environmental impact of these relative changes in resource consumption depends on the share of the categories in the overall Material Footprint. On the one hand, Communication, for example, exhibits a strong increase of more than 30%, which might come from rapid innovations in information and communication technologies. On the other hand, transport, for example, exhibits a decrease in the Material Footprint. Buhl et al. (2017) differentiate resource intensities in “Transport” and show that a decrease in its Material Footprint comes from, e.g., a reduction of gas consumption, reduced car ownership, and “other” reasons. Due to the relatively high resource intensity of transport, a small decrease in expenditure for transport cancels out a larger increase in expenditure for communication services and technologies between 2003 and 2013.
In sum, the total resource use in NRW remained almost unchanged over the three reporting periods with a reduction of 3.9% between 2003 and 2013 on a comparable high level of resource use. It is interesting to note that this small change in total is a result of significant shifts between the different fields of consumption. This implies that consumption patterns in NRW changed, even though the overall resource use did not by a large margin [16].

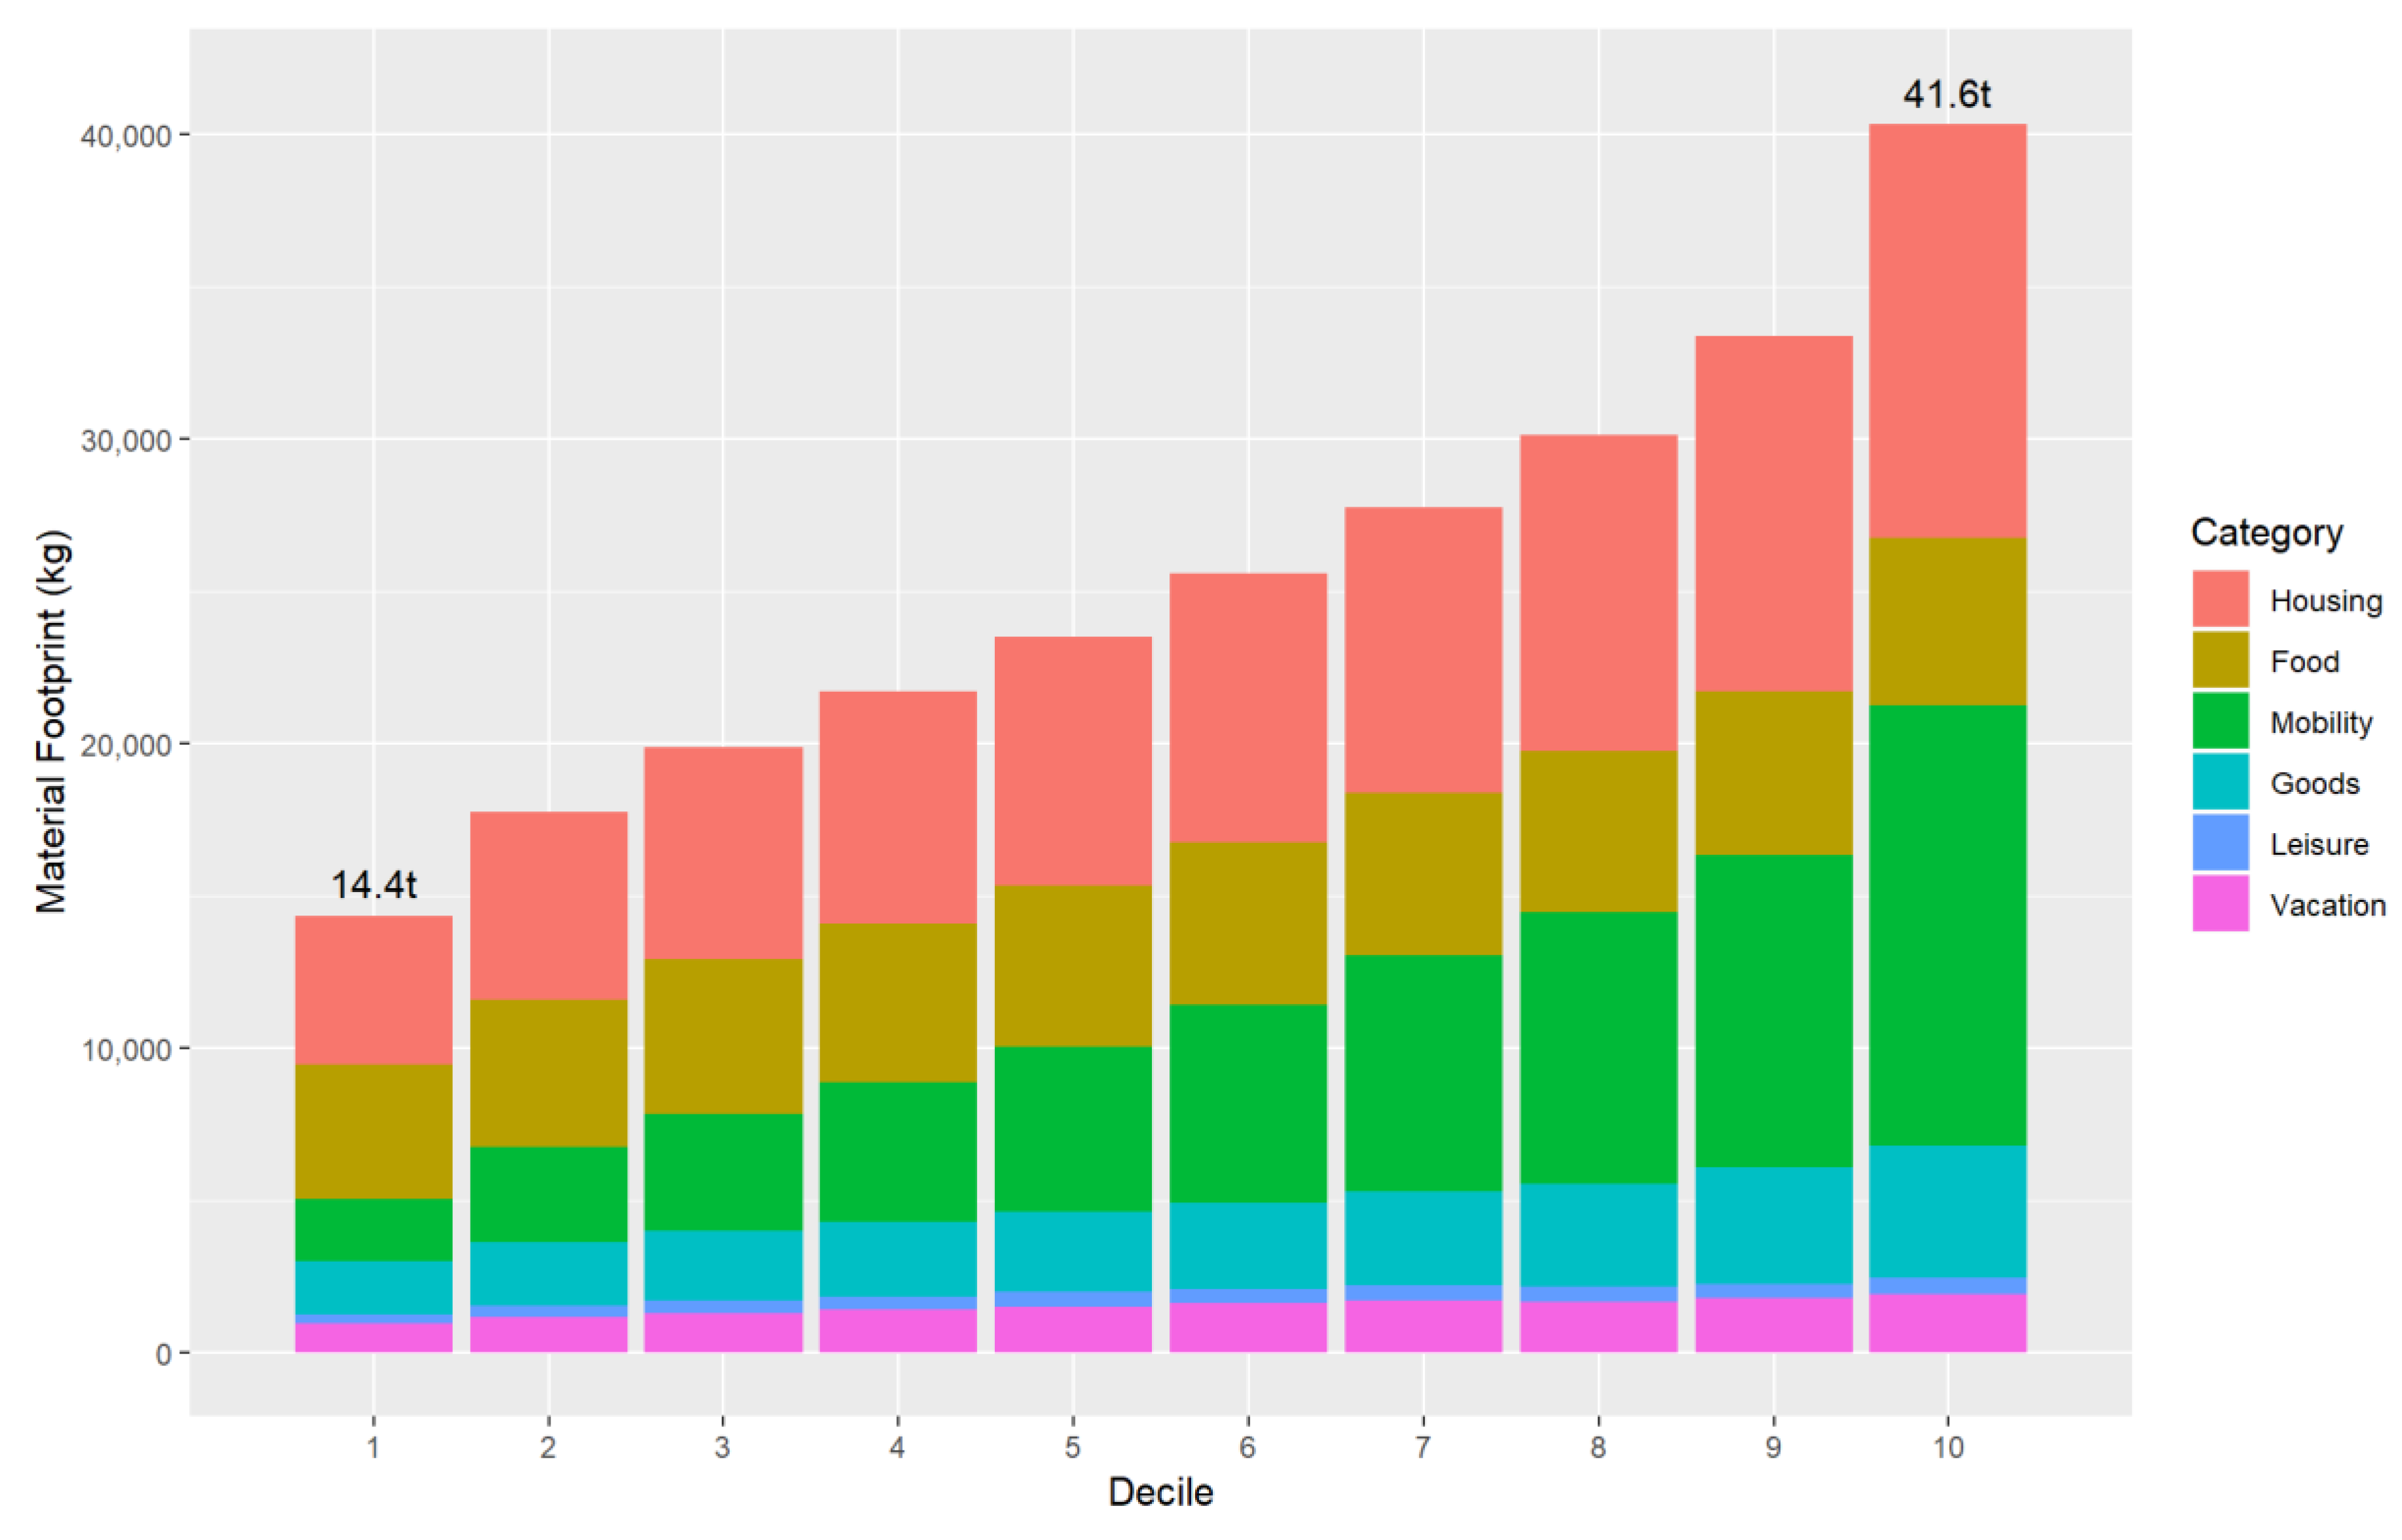
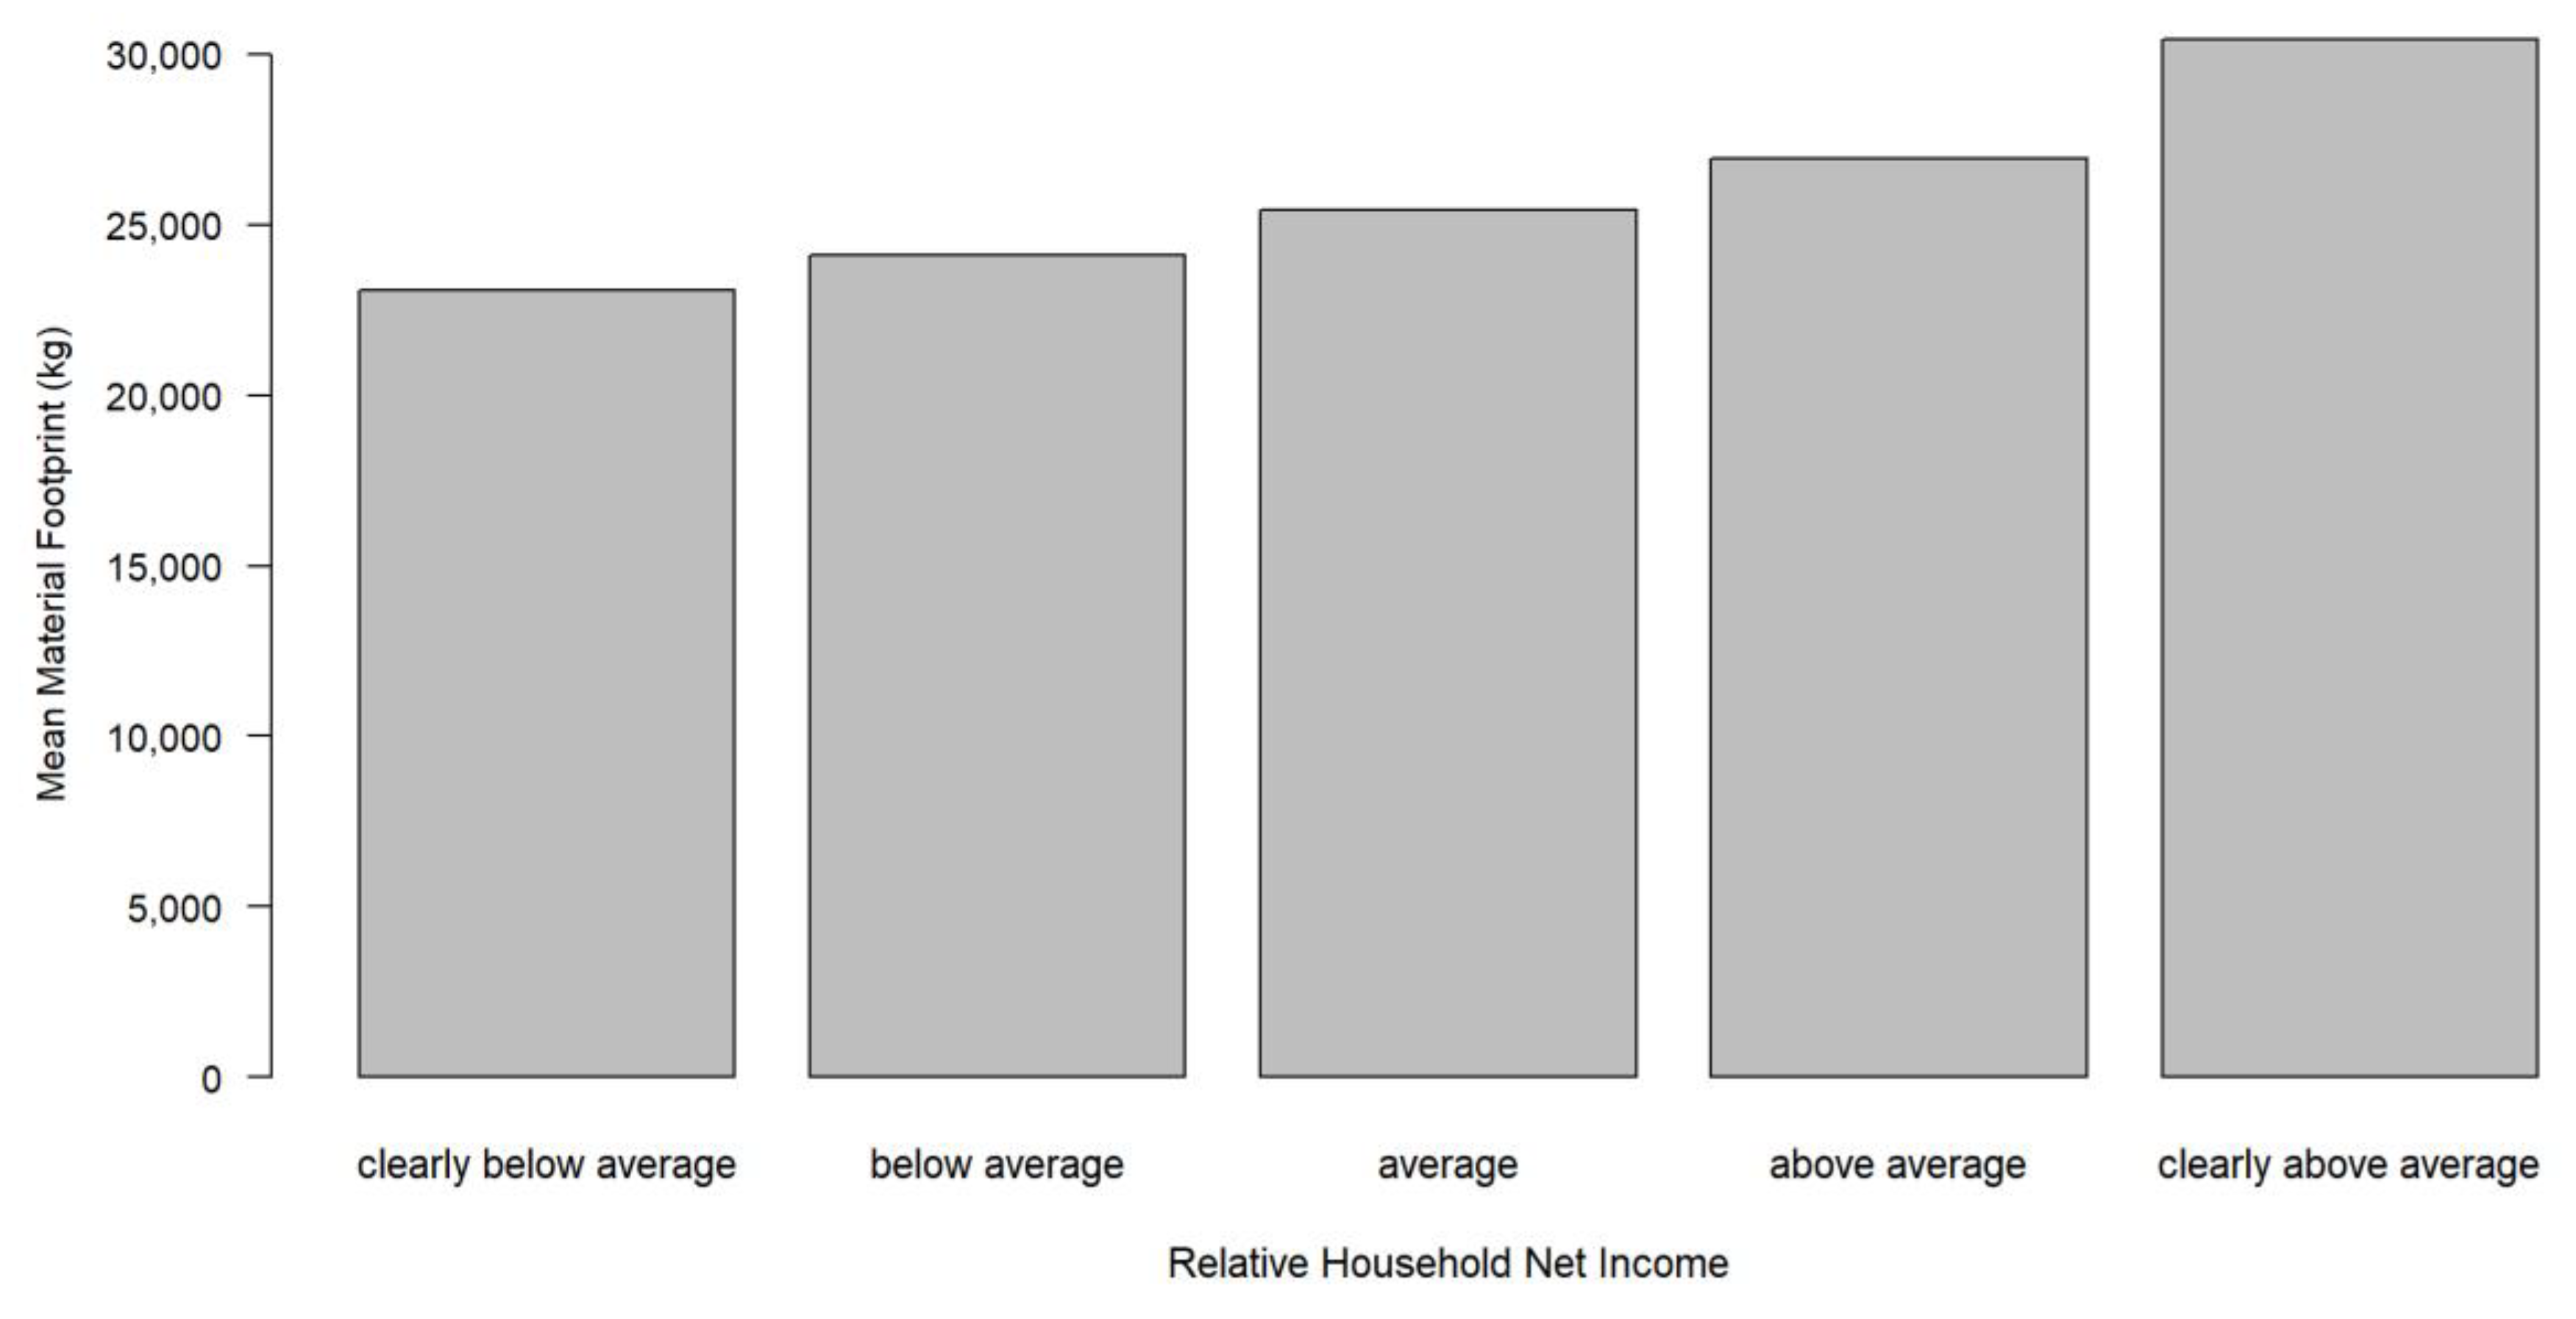
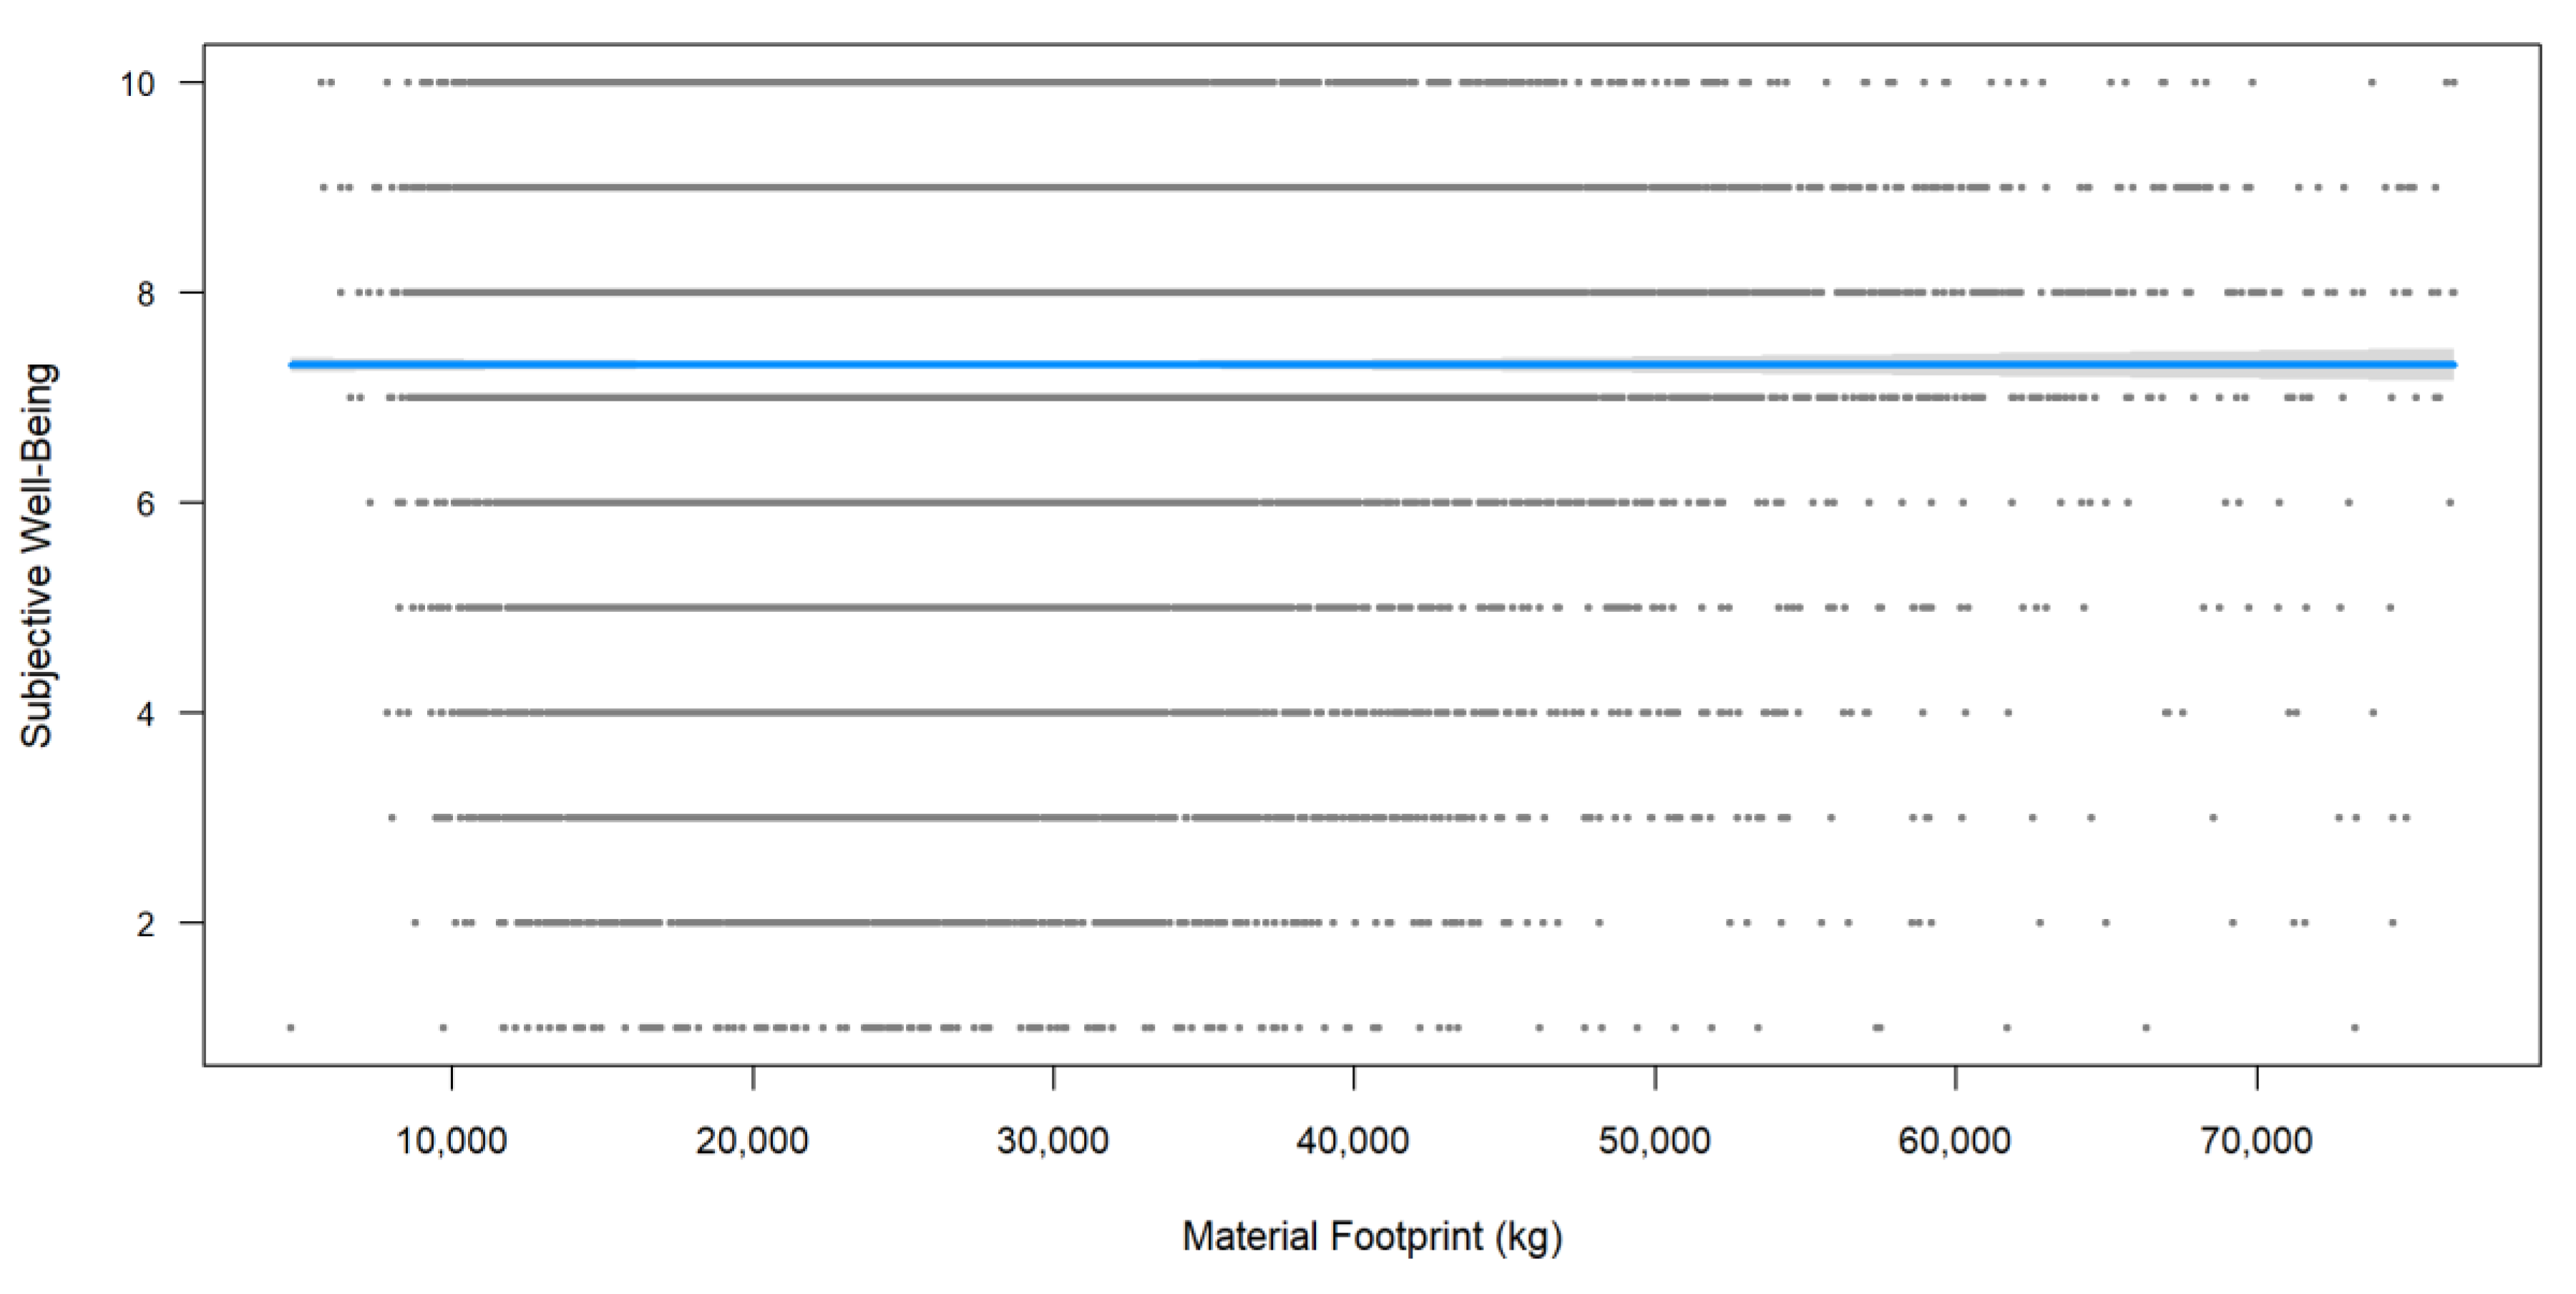
3.2. Resource Lifestyle Footprint Based on Survey Data from an Online Web Tool

The overall Material Footprint of users of the Resource Calculator accounts for 26 t per user (and year). The distribution of the Material Footprint shows a similar right-skewed distribution as revealed by the Resource Indicator. This corroborates our findings that the Material Footprint of private households is strongly biased by high resource use of relatively few households.
Figure 3 shows the six categories presented in Table 3 and their shares in the respective Material Footprints of the deciles. It is notable that some shares, such as food and vacation, remain nearly constant from the first to the tenth decile while others, such as housing and mobility, increase strongly. This allows us to conclude that the potential main drivers of a high Material Footprint appear to be these categories.
Users have been asked to classify their income in respect to the average household net income on a symmetric scale from clearly below average to clearly above average. Surveying the relative household net income makes it easier for users of the calculator to state their net income and to prevent non-response of users. Again, the results reveal an increasing Material Footprint with increasing household net income (see Figure 4).
The data was also used by Buhl et al., 2017 [27] to examine the relationship between the Material Footprint and life satisfaction. As postulated by Buhl et al., 2017, the use of natural resources is not clearly linked to users subjective well-being (see Figure 5).
To test their hypothesis, Buhl et al., 2017 conducted a stepwise multivariate regression analysis. They found that the strongest impacts on life satisfaction are measured for subjective health and for satisfaction with social ties. Real income and gender reveal smaller, but still notable effects. The influence of age, vacation days, and the Material Footprint is rather weak. Subjective assessments and norms appear to have the strongest impact on subjective well-being, followed by socio-demographic characteristics that seem to have less relevance in this context. The Material Footprint has the smallest impact with a slightly negative effect on life satisfaction [27].
Data from the Resource Calculator allows for the disaggregation of Material Footprints and the analysis of complex research questions in the realms of empirical consumer research regarding the link between socioeconomic features and the Material Footprint. In addition, the online web tool approach allows for a quick and flexible alteration of the variables surveyed and a constant flow of survey data.

4. Discussion

The results presented in the previous sections are based on two methods to analyze the Material Footprint of private households according to the requirements of SDG 12. Both concepts have certain strengths as well as potential weaknesses or limitations.

4.1. Resource Consumption Indicator

Regarding the RCI, limitations are the relatively high data aggregation of the main categories and the restriction to consumption expenditure as a proxy for consumption.
Using aggregated data limits the differentiation ability in regard to the consumption of products and services. For instance, one euro invested in the construction of a private house cannot be differentiated from another one invested in maintaining heating. Both are equally subsumed under “housing”. Due to this, the depth of analysis of resource use related to certain consumption patterns is restricted. Lifecycle data could be used to extend the current database by disaggregating resource intensities for specific products and services. Such an improved disaggregation of data was successfully conducted by Buhl et al., 2017 for transport and mobility services [37].
Additionally, expenditure data are used as a proxy for consumption. Expenditure data are available in internationally harmonized, official and representative household statistics, which ensure continuous surveys and high data quality. There is a proven correlation between expenditure, consumption and hence resource use. However, there are other factors influencing the measurable impact on the environment. Disregarding those factors can cause bias. Examples of such factors are the households’ repairing behavior, their willingness to decide on second-hand goods, and the way and intensity of using a certain good. Value conceptions may also lead a household to opt for goods that are more expensive than comparable alternatives, but cause a similar resource use [16].

4.2. Resource Lifestyle Footprint

The method and data limitations of the RLF stem from non-representative sampling on the one hand and the necessary time efficiency of the survey on the other hand.
Even though the Resource Calculator provides a large amount of user data due to the high usability and, thus, the acceptance of the calculator tool, the sample includes some bias due to the voluntary sampling. The share of young female users, vegetarians, and vegans, for example, is disproportionally high, which indicates a self-selection of pro-environmental users [27]. Future studies should aim for a more representative sampling when using the Resource Calculator as a survey tool. Adding more detailed questions regarding personal information about the users themselves could increase the informative value and the representativeness of the database.
The second limitation of the Resource Calculator relates to the requirement to conduct a survey within a certain amount of time. This results in a limited set of questions that do not allow us to analyze every aspect of consumer’s consumption patterns. Many products and services were omitted from the survey (e.g., compared to the “diary” approach in Reference [26]), because they would not contribute much to a higher footprint. Other questions were simplified, aiming at helping the households to complete the survey rather than asking for precise physical values. Finally, even the most comprehensive bottom-up survey would exclude certain products and could not account for every variation of the product types. So there is always some part of the Material Footprint that cannot be related to households individually. Further analysis of the available footprint data could help to identify the essential questions, e.g., by means of unsupervised learning and by using an average pedestal of resource consumption for areas of a low importance (e.g., durable goods such as jewelry or the use of non-living space).

5. Conclusions

5.1. Summary

We introduced two methods for analyzing the Material Footprint of private households based on microdata. The first method (resulting in the Resource Consumption Indicator) is based on expenditure data according to internationally harmonized COICOP. The second method (resulting in the Resource Lifestyle Footprint) is based on survey data from a web tool called Resource Calculator. Both methods allow us to differentiate the Material Footprint along arrays of consumption like housing and mobility as well as socioeconomic characteristics like age or income and thus meet the disaggregation requirement to SDG indicators. The results from applying the two methods in Germany shows that the Material Footprint ranges between 26 t and 31 t per capita in Germany and its distribution is right-skewed. The most relevant categories are housing, mobility, and nutrition. When it comes to disaggregating the Material Footprint along socioeconomic characteristics, we showed that an increasing household net income leads to an increasing Material Footprint.

5.2. Methods

Using microdata from the statistical offices for a Resource Indicator offers three main benefits [32].
  • First, it enables a representative depiction of private household consumption.
  • Second, private household consumption can be examined by looking at differentiated consumption categories such as energy or food and its shifts and changes for the past decades.
  • Third, private household consumption can be examined by looking at differentiated population groups (disaggregated for example by income or age).
Analyzing consumption by using resource intensities offers a possibility to evaluate its environmental impact. The concept relies on a representative, internationally harmonized and thus comparable data according to COICOP that is available in different countries.
The method used for the Resource Lifestyle Footprint (based on the Resource Calculator) provides new options for consumers to receive real-time feedback and for researchers to collect and gather data quickly, flexibly, and constantly over time [27]. Further research regarding the impact of socioeconomic characteristics on resource use could help us to identify appropriate reduction strategies for different groups of consumers as Lettenmeier 2018 successfully showed [38]. Moreover, we strive to collect more data from users abroad in order to compare the Material Footprints internationally (e.g., in a current project on sustainable lifestyles in 7 different countries). So far, the sample of users from abroad is too small to conduct a proper comparative analysis.
Despite some weaknesses, the presented Resource Consumption Indicator appears to be a good and expandable method for measuring the resource use of private households according to SDG 12. However, an improved database is crucial for increased reliability. This issue could be addressed by collecting lifecycle data.
The Resource Lifestyle Footprint is a promising attempt but should be improved regarding the aforementioned limitations. Especially, it will be important to focus on improving the database to receive a more representative sample while condensing the questions about resource use to the most essential ones. In this regard, the survey instrument that indicates the Material Footprint of private households could be incorporated into existing representative surveys like the Socioeconomic Panel (SOEP) or GESIS Panel in Germany or equivalent panels on a European level, e.g., the European Community Household Panel (ECHB). This way, environmental policy evaluation and research on sustainable consumption would benefit from the longitudinal design of the surveys and link environmental issues with an extensive set of socioeconomic predictors efficiently. In any case, it would be helpful to gather more detailed personal and household information to facilitate differentiation between them.
Combining the presented tools could address some of the aforementioned limitations and further improve the usability of microdata for measuring progress towards achieving SDG 12. The Resource Consumption Indicator offers a possibility to measure this progress over time and the status quo. The Resource Lifestyle Footprint can provide a new and more differentiated micro-level database for analyzing consumption-related resource use. The combination of both methods (or similar methods with microdata for that matter) would also enhance scenario building. As the majority of environmental scenarios currently focus on technological and economic feasibility, there is a lack of scenario models that also investigate the social and cultural drivers and barriers of sustainable development [39].

5.3. Policy Making

The Resource Consumption Indicator and the Resource Lifestyle Footprint appear to be promising tools for deepening the understanding of private household consumption, the interaction of production and consumption patterns, and detecting unused potentials to increase its sustainability according to the SDGs. First results from applying the tools already revealed insights about the structure of the resource use of private households. We conclude that microeconomic data offers an important enhancement of the present macro data-based indicator system. Indicators based on microdata are able to evaluate and inform in a differentiated and disaggregated way, in perspective even in real time. As such the methods reveal shifts in resource use between different arrays of consumption and consumer groups that would otherwise stay undetected and camouflaged by highly aggregated macro indicators. Policy evaluations benefit from a disaggregated perspective on the Material Footprint of private household instead of evaluating the overall trend in the Material Footprint. Policymakers may wonder why efforts to reduce the natural resource in mobility does not show a decreasing overall Material Footprint, e.g., due to indirect rebound effects and shifts of consumption patterns. For instance, differentiating the Material Footprint along arrays of consumption allows us to evaluate whether a reduction of the Material Footprint in mobility is offset by an increase in natural resource use by housing or communications. As such, policymakers may identify which policies in specific arrays of consumption may be more effective in reducing the Material Footprint since rebound effects and shifts of consumption are less pronounced.
A more differentiating approach to indicators is not relevant politically (for (inter)national policies and programs like the indicator framework of SDGs and national programmes striving to implement them), but also in everyday decision-making situations, whether in the company (products, infrastructures) or in the household (lifestyles). In fact, the households themselves may evaluate whether changes in one array of consumption are offset by shifts of their consumption into other arrays. For instance, private households may reduce their resource use by foregoing resource-intensive vacations abroad. At the same time, they may become aware that their savings are offset due to intensified leisure activities.
Indicators based on microdata (or indicator set for different goals) are fundamental for the implementation of national policies such as the National Program on Sustainable Consumption in Germany. They allow us to combine efforts for sustainable lifestyles by companies, households and policymakers alike. Does a product or service contribute to achieving an SDG? Are certain production and consumption patterns sustainable and to what extent? Which rebounds can be anticipated? Which trends evolve and do we leave certain groups behind in doing so? Does a policy instrument support sustainable development or not? This type of evaluation system would—in the long run and combined with real-time tools—help to manage and measure sustainable development.

Author Contributions

J.B. and C.L. drafted the thesis. J.B., C.L., J.T. and K.B. conceptualized the paper. J.B. and J.T. analyzed the data and wrote the paper. K.B. and N.S. contributed research and reviewed the paper. All authors draw the conclusions.

Funding

This research received no external funding.

Acknowledgments

No funding was received in support of this paper. The original research and discussion on the resource use of households was partly funded by the federal Ministry for the Environment in North Rhine-Westphalia, Germany (Ministerium für Umwelt, Landwirtschaft, Natur-und Verbraucherschutz des Landes Nordrhein-Westfalen).

Conflicts of Interest

The authors declare no conflict of interest.

Appendix A. Calculating the Material Footprint Based on Resource Intensities

The Resource Indicator is calculated as the Material Footprint of the consumption of private households. This Material Footprint is the product resulting from the multiplication of the consumption expenditure c by the resource intensity r.
Material   Footprint   =   c   ×   r
The consumption expenditure for the jth consumption category of k consumption categories in total is calculated as the arithmetic mean of the consumption expenditure of the ith household out of n households in total in time t (measured in years).
c j = 1 n i n c ij t
The consumption expenditure is then adjusted for inflation to the base year t by considering the inflation rate π of the subsequent years in the respective consumption category j. This prevents a bias resulting from inflation.
c j = 1 n [ i n c ij t   ( c ij t + 1 × π j t + 1 ) ]
The consumption expenditure of the ith household is put into the context of the household size h to obtain a per capita result instead of a per household result.
c j = 1 n [ i n [ ( c ij t ( c ij t + 1 × π j t + 1 ) ) / h i t ] ]
To enable a differentiation by different subgroups, Buhl et al. introduce a dimension X, representing socioeconomic characteristics like household income.
c j = 1 n [ i n [ ( c ijX t ( c ijX t + 1 × π j t + 1 ) ) / h iX t ] ]
The resource intensity is calculated by dividing the total resource use (indicated by household consumption) R j t by the associated consumption expenditure in category j in year t (Equation (A3)).
r j = R j t i n c ij t
The Material Footprint can be expressed as the arithmetic mean of the respective Material Footprints of the jth consumption category out of k consumption categories in total by inserting Equations (A5) and (A6) into Equation (A1):
Material   Footprint   =   1 k x 1 n x j k i n [ ( c ijX t ( c ijX t + 1 × π j t + 1 ) ) / h iX t ] × R j t i n c ij t

References

  1. Steffen, W.; Rockström, J.; Richardson, K.; Lenton, T.M.; Folke, C.; Liverman, D.; Summerhayes, C.P.; Barnosky, A.D.; Cornell, S.E.; Crucifix, M.; et al. Trajectories of the Earth System in the Anthropocene. Proc. Natl. Acad. Sci. USA 2018, 115, 8252–8259. [Google Scholar] [CrossRef] [PubMed]
  2. Van Beers, D.; Grossi, F.; Brüggemann, N.; CRI, N.K.; CRI, D.W.; Mont, O.; Voytenko, Y.; UBA, C.L.; Robey, M.; Jones, M.; et al. Reflections and Lessons Learnt from EEA’s Work on Innovative Business Models for Sustainable Lifestyles; Working Paper for the European Topic Centre on Waste and Materials in a Green Economy; ETC/WMGE: Boeretang, Belgium, 2014. [Google Scholar]
  3. Reim, W.; Parida, V.; Örtqvist, D. Product–Service Systems (PSS) business models and tactics—A systematic literature review. J. Clean. Prod. 2015, 97, 61–75. [Google Scholar] [CrossRef]
  4. Lewis, M. Product-Service Systems. In Wiley Encyclopedia of Management; Cooper, C.L., Ed.; John Wiley & Sons, Ltd.: Chichester, UK, 2015; p. 1. ISBN 978-1-118-78531-7. [Google Scholar]
  5. Hankammer, S.; Steiner, F. Leveraging the sustainability potential of mass customization through product service systems in the consumer electronics industry. Procedia CIRP 2015, 30, 504–509. [Google Scholar] [CrossRef]
  6. European Parliament; Council of the European Union. Directive 2009/125/EC of The European Parliament and of the Council of 21 October 2009 Establishing a Framework for the Setting of Ecodesign Requirements for Energy-Related Products (Recast); Publications Office of the European Union: Brussels, Belgium, 2009. [Google Scholar]
  7. UNEP. International Trading Center 10YFP Consumer Information Programme for Sustainable Consumption and Production (CI-SCP)—Guidelines for Providing Product Sustainability Information; UNEP: Nairobi, Kenya, 2016. [Google Scholar]
  8. German Federal Government. Die Deutsche Nachhaltigkeitsstrategie 2016—der Weg in eine enkelgerechte Zukunft; German Federal Government: Berlin, Germany, 2016.
  9. UN. General Assembly Work of the Statistical Commission pertaining to the 2030 Agenda for Sustainable Development: Resolution; UN: New York, NY, USA, 2017; 25p. [Google Scholar]
  10. Buhl, J.; Teubler, J.; Liedtke, C.; Stadler, K. Ressourcenverbrauch private Haushalte NRW—Explorative Analyse. Final Report of the Funded Project “Konzeptionelle Analysen und Überlegungen zur Ausgestaltung einer Nachhaltigkeitsstrategie aus wissenschaftlicher Sicht” for the State Agency for Nature, Environment and Consumer Protection NRW (LANUV); Wuppertal Institute for Climate, Environment and Energy: Wuppertal, Germany, 2016. [Google Scholar]
  11. German Federal Government. Perspektiven für Deutschland: Fortschrittsbericht...; unsere Strategie für eine nachhaltige Entwicklung; Presse-und Informationsamt der Bundesregierung: Berlin, Germany, 2002.
  12. German Federal Government. Nationales Programm für nachhaltigen Konsum. Gesellschaftlicher Wandel durch einen nachhaltigen Lebensstil; German Federal Ministry for the Environment, Nature Conservation and Nuclear Safety: Berlin, Germany, 2017. Available online: https://www.bmu.de/fileadmin/Daten_BMU/Download_PDF/Produkte_und_Umwelt/nat_programm_konsum_bf.pdf (accessed on 20 November 2018).
  13. Bundesministerium für Umwelt, Naturschutz, Bau und Reaktorsicherheit (BMUB) Deutsches Ressourceneffizienz- programm II Programm zur nachhaltigen Nutzung und zum Schutz der natürlichen Ressourcen; BMUB: Berlin, Germany, 2016.
  14. Hölsgens, R.; Lübke, S.; Hasselkuß, M. Social innovations in the German energy transition: An attempt to use the heuristics of the multi-level perspective of transitions to analyze the diffusion process of social innovations. Energy Sustain. Soc. 2018, 8, 8. [Google Scholar] [CrossRef]
  15. Spangenberg, J.H. Design for Sustainability (DfS): Interface of Sustainable Production and Consumption. In Handbook of Sustainable Engineering; Kauffman, J., Lee, K.-M., Eds.; Springer: Dordrecht, The Netherlands, 2013; pp. 575–595. ISBN 978-1-4020-8938-1. [Google Scholar]
  16. Bringezu, S.; Ramaswami, A.; Schandl, H.; O’Brien, M.; Pelton, R.; Acquatella, J.; Ayuk, E.T.; Chiu, A.S.F.; Flanegin, R.; Fry, J.; et al. Assessing Global Resource Use: A Systems Approach to Resource Efficiency and Pollution Reduction; United Nations Environment Programme: Nairobi, Kenya, 2017; p. 99. [Google Scholar]
  17. Bringezu, S.; Schütz, H.; Saurat, M.; Moll, S.; Acosta-Fernández, J.; Steger, S. Europe’s resource use. Basic trends, global and sectoral patterns and environmental and socioeconomic impacts. In Sustainable Resource Management: Global Trends, Visions and Policies; Bringezu, S., Bleischwitz, R., Eds.; Greenleaf Publishing: Sheffield, UK, 2009; pp. 52–154. [Google Scholar]
  18. Lettenmeier, M.; Liedtke, C.; Rohn, H. Eight Tons of Material Footprint—Suggestion for a Resource Cap for Household Consumption in Finland. Resources 2014, 3, 488–515. [Google Scholar] [CrossRef] [Green Version]
  19. Speck, M.; Liedtke, C. Chancen und Grenzen nachhaltigen Konsums in einer ressourcenleichten Gesellschaft. Jahrbuch Nachhaltige Ökonomie 2016/2017: im Brennpunkt: Ressourcen-Wende; Metropolis-Verl: Marburg, Germany, 2016; pp. 255–269. [Google Scholar]
  20. Schmidt-Bleek, F. Das MIPS-Konzept: Weniger Naturverbrauch—mehr Lebensqualität durch Faktor 10; Droemer Knaur: München, Germany, 2000; ISBN 3-426-77475-5. [Google Scholar]
  21. Teubler, J.; Buhl, J.; Lettenmeier, M.; Greiff, K.; Liedtke, C. A Household’s Burden—The Embodied Resource Use of Household Equipment in Germany. Ecol. Econ. 2018, 146, 96–105. [Google Scholar] [CrossRef]
  22. Wiesen, K.; Saurat, M. Michael Lettenmeier Calculating the Material Input per Service Unit using the Ecoinvent Database. Int. J. Perform. Eng. 2014, 10, 357–366. [Google Scholar]
  23. Wiesen, K.; Wirges, M. From cumulated energy demand to cumulated raw material demand: The material footprint as a sum parameter in life cycle assessment. Energy Sustain. Soc. 2017, 7, 13. [Google Scholar] [CrossRef]
  24. Teubler, J.; Kiefer, S.; Liedtke, C. Metals for Fuels? The Raw Material Shift by Energy-Efficient Transport Systems in Europe. Resources 2018, 7, 49. [Google Scholar] [CrossRef]
  25. Saurat, M.; Ritthoff, M. Calculating MIPS 2.0. Resources 2013, 2, 581–607. [Google Scholar] [CrossRef] [Green Version]
  26. Greiff, K.; Teubler, J.; Baedeker, C.; Liedtke, C.; Rohn, H. Material and Carbon Footprint of Household Activities. In Living Labs: Design and Assessment of Sustainable Living; Keyson, D.V., Guerra-Santin, O., Lockton, D., Eds.; Springer International Publishing: Cham, Switzerland, 2017; pp. 259–275. ISBN 978-3-319-33527-8. [Google Scholar]
  27. Buhl, J.; Liedtke, C.; Bienge, K. How Much Environment Do Humans Need? Evidence from an Integrated Online User Application Linking Natural Resource Use and Subjective Well-Being in Germany. Resources 2017, 6, 67. [Google Scholar] [CrossRef]
  28. United Nations High Commissioner for Human Rights (OHCHR). A Human Rights Based Approach to Data—Leaving No One Behind in the 2030 Development Agenda; United Nations High Commissioner for Human Rights (OHCHR): Geneva, Switzerland, 2018. [Google Scholar]
  29. United Nations System Chief Executives Board for Coordination (CEB). Leaving No One Behind: Equality and Non-Discrimination at the Heart of Sustainable Development; United Nations: New York, NY, USA, 2017. [Google Scholar]
  30. United Nations. The Road to Dignity by 2030: Ending Poverty, Transforming All Lives and Protecting the Planet; United Nations: New York, NY, USA, 2014. [Google Scholar]
  31. Wood, R.; Stadler, K.; Bulavskaya, T.; Lutter, S.; Giljum, S.; de Koning, A.; Kuenen, J.; Schütz, H.; Acosta-Fernández, J.; Usubiaga, A.; et al. Global sustainability accounting—Developing EXIOBASE for multi-regional footprint analysis. Sustainability 2014, 7, 138–163. [Google Scholar] [CrossRef] [Green Version]
  32. Buhl, J.; Acosta, J. Work Less, Do Less? Working Time Reductions and Rebound Effects. Sustain. Sci. 2016, 11, 261–276. [Google Scholar] [CrossRef]
  33. Watson, D.; Acosta Fernandez, J.; Wittmer, D.; Pedersen, O.G. Environmental pressures from European consumption and production: A study in integrated environmental and economic analysis; Publications Office of the European Union: Luxembourg, 2013. [Google Scholar]
  34. Buhl, J. Revisiting Rebound Effects from Material Resource Use. Indications for Germany Considering Social Heterogeneity. Resources 2014, 3, 106–122. [Google Scholar] [CrossRef] [Green Version]
  35. Schmidt-Bleek, F. Der ökologische Rucksack. Wirtschaft für eine Zukunft mit Zukunft; Schmidt-Bleek, F., Ed.; Hirzel: Stuttgart, Germany, 2004. [Google Scholar]
  36. Liedtke, C.; Bienge, K.; Wiesen, K.; Teubler, J.; Greiff, K.; Lettenmeier, M.; Rohn, H. Resource Use in the Production and Consumption System—The MIPS Approach. Resources 2014, 3, 544–574. [Google Scholar] [CrossRef] [Green Version]
  37. Buhl, J.; Teubler, J.; Liedtke, C.; Stadler, K. Der Ressourcenverbrauch privater Haushalte in NRW. Uwf UmweltWirtschaftsForum Sustain. Manag. Forum 2017, 25, 255–264. [Google Scholar]
  38. Lettenmeier, M. A sustainable level of material footprint—Benchmark for designing one-planet lifestyles Materiaalijalanjäljen kestävä taso –mittapuu yhden planeetan elämäntapojen toteuttamiseen; Aalto University: Espoo, Finland, 2018. [Google Scholar]
  39. Kirby, P.; O’Mahony, T. Planning Future Pathways: Implications and Outcomes of Scenario Studies. In The Political Economy of the Low-Carbon Transition; Springer: New York, NY, USA, 2018; pp. 115–141. [Google Scholar]
Figure 1. The distribution of Material Footprint (years 2003, 2008, 2013) according to Buhl et al., 2016 [10].
Sustainability 10 04467 g001
Figure 2. The change in the Material Footprint in NRW 2003–2013 according to Buhl et al., 2016 [16]. Data: Buhl and Acosta 2015 [32].
Sustainability 10 04467 g002
Figure 3. The Material Footprints for deciles and category shares.
Sustainability 10 04467 g003
Figure 4. The relative household net income categories and related mean Material Footprint.
Sustainability 10 04467 g004
Figure 5. The scatter and line prediction plot of the Material Footprint (in kg) vs. life satisfaction (10-point scale). Confidence band with a = 0.01 . Buhl et al., 2017 [27].
Sustainability 10 04467 g005
Table 1. The overview of selected variables and descriptive statistics of the EVS.
N (Sample Size)MeanStd.Dev. (Standard Deviation)
Variables200320082013200320082013200320082013
Food and beverages42,74444,08842,7923634.73831.693825.741933.352060.82100.27
Clothing42,74444,08842,7921646.341514.81577.431572.121569.621665.11
Housing42,74444,08842,7929449.249642.2510,746.56337.314900.785129.06
Furnishing42,74444,08842,7921900.511624.521671.714191.313805.173702.8
Health42,74444,08842,7921332.441438.111552.153822.463694.824232.48
Transport42,74444,08842,7924610.354687.234628.1711,824.110,489.911,369.6
Communication42,74444,08842,792896.51833.13821.45668.83527.96554.92
Recreation and Culture42,74444,08842,7923807.113701.093575.994002.474512.234743.77
Education42,74444,08842,792298.38292.53272.98865.561046.731070.36
Hotels42,74444,08842,7921477.481654.371782.771890.122143.42316.07
Miscellaneous42,74444,08842,7921379.761351.691297.621892.592103.991948.51
Household size42,74444,08842,7922.432.282.101.231.171.09
NRW922377087823111000
Data: German Survey of Household Income and Consumption, 2003, 2008, 2013. Expenditure data in Euro. “Household size” and “NRW” (i.e., living in the federal state of NRW in Germany) represent socio-demographics of the sample.
Table 2. The resource intensities of private household consumption in Germany.
Consumption CategoriesResource Intensity (kg/€)
Food and beverages5.09
Housing etc.3.18
Furnishings etc.2.99
Transport1.50
Restaurants and hotels1.40
Health0.60
Education0.48
Recreation and culture0.41
Communication0.37
Clothing0.19
Miscellaneous0.19
Based on Buhl et al., 2016 [10]. Data: Buhl and Acosta 2015 [32].
Table 3. The description of consumption categories in the Resource Calculator.
Groups of Consumption in Resource CalculatorDescription of Category
Nutritiondiets, food waste, and consumption of foodstuffs and drinks
Housingbuildings, heat, and electricity use
Consumer Goodsappliances, clothes, furniture
Mobilityday-to-day travel with cars, bikes, public transport
Leisurehobbies, sports, cultural activities
Vacationvacation travel and accommodation
Table 4. The overview of variables and descriptive statistics of the Resource Calculator.
StatisticNMeanStd. Dev.MinMax
Personal characteristics
Female26,1030.620.4901
Age24,59636.0012.001871
Schooling years26,11814.003.20921
Occupational status18,4633.001.1014
Unemployed18,4630.140.3501
Household characteristics
Household size44,2382.201.001.006.00
Number of children91191.600.7114
Size of dwelling (m2)30,48295.0047.007.00300.00
Subjective assessments
Subjective health17,2971.300.57−12
Relative income22,125−0.411.00−22
Life satisfaction26,0417.301.80110
Social ties satisfaction17,6901.000.71−22
Lifestyle
Diet44,3172.200.8414
Vegetarian44,3170.330.4701
Hobby hours44,0918.0012.000.0075.00
Days on vacation44,05615.0013.00081
Trips (in km)44,086220.00327.000.001,800.00
Material Footprints (kg)
Housing44,0688722.004059.004526,804
Consumer goods44,0682859.001161.0026936
Nutrition44,0685160.001323.00829145
Leisure44,069446.00639.0005113
Mobility43,4566682.006407.00139,447
Vacations44,0681525.001532.00010,200
Overall Material Footprint44,06825,897.0010,041.002.71176,570
Note: Descriptive statistics include the number of observations (N), mean, standard deviation (Std.Dev.), minimum (Min.) and maximum (Max.) of observations. “Trips” is the distance in km for trips and events during the past month. “Days on vacation” are days on vacation overall in the past year. “Hobby hour” are the hours overall spent on hobbies on average per month. “Social ties satisfaction” is the personal evaluation on how often social relations are perceived as satisfying (as the Likert scale). “Relative income” is the assessment of the household net income in comparison (as the Likert scale).

