Abstract
Over recent decades, it has become essential to establish preventive long-term maintenance plans for public housing developments. Also, deterministic maintenance strategies have been increasingly replaced by those based on reliability and risk, which are probabilistic. Efforts to obtain optimized long-term maintenance plans have included management of service life and prediction of service lifetime. Accordingly, the present research develops a system for various finishing works of public housing and analyzes the service life pattern of each component using a probabilistic approach. For the analysis, this research analyzed 46,201 South Korean public housing maintenance records from the last 21 years and determined the maintenance frequency distribution. The purpose of the research is to suggest efficient long-term maintenance plans using the analyzed results of service life patterns. Results from the analysis showed that each component has a different service life pattern that can be applied to establish the service lifetime and decision making for floating maintenance. Since the interaction between finishing works is affected due to various components and parameters, the results are useful to reduce the uncertainty and risk of deterministic maintenance plans. The meaning of this research is to analyze the service life pattern using a probabilistic approach and recommend how to establish an efficient maintenance system.
1. Introduction
Building maintenance management has become more firmly positioned in the context of strategic management in both public and private sectors [1]. All buildings require maintenance to provide optimal performance to occupants over its lifecycle since it also affects occupants’ safety and performance. The building maintenance problem has gained prominence in the field of maintenance planning because a lack of maintenance can have a negative effect on customers such as defects or failures in apartments and the physical/financial depreciation of buildings caused by inadequate or aging building stock [2]. Apartments are one of these facilities that have recently experienced problems with maintenance plans and social adverse effects due to lack of comprehensive maintenance [3]. These apartments have a wide variety of users and are undergoing difficulties in their management entities and maintenance plans [4]. In particular, in South Korea, the type of public housing was apartments that were collectively supplied and managed by the government [5]. Moreover, difficulties in maintenance were caused by limited maintenance budgets and plans such as bulk repairs without considering the characteristics of mixed occupants with diverse lifestyles [6]. In this context, demands for efficient maintenance plans to prevent the degradation of residence services for public housing is increasing around the world [7]. South Korea is also experiencing problems such as increasing maintenance costs with the increasing number of aging public housing apartments, and societal interest in the establishment of long-term maintenance plans is also increasing [8]. With the emerging need for long-term maintenance plans, related studies have been conducted, which focused on the concepts regarding service life assessment such as service life design and service lifecycle management [9]. Service life assessment determines the optimum service lifetime and is essential for sustained maintenance without lowering the service quality during the maintenance period [10]. In particular, the assessment of service life is a key to long-term maintenance plans for public housing and infrastructure which are managed in an integrated manner by public agencies [11].
In order to establish a long-term maintenance plan by efficiently distributing the limited maintenance budget for public housing, the maintenance cost and maintenance frequency of each component must be analyzed. An analysis of various repair items of public housing for the last 10 years revealed that the most frequent repair items were finishing works such as plastering, interior finishing, and painting [4]. This is because finishing works have various uncertainties from the construction stage, and, as a result, they cause more problems than foundation work and structure work [12]. The uncertainties affecting finishing works include various components and factors such as occupants, use environment, location, and climate which intersect in a complex manner. Therefore, the establishment of a long-term maintenance plan considering the various components of finishing works is critical in order to prepare a systematic maintenance plan for public housing [13].
The conventional maintenance of public housing is based on deterministic repair cycles which generally determine the repair times of each component [3,4], but this has limitations in reflecting uncertainties in terms of the service life assessment of finishing work components [3]. To overcome these limitations, studies have been conducted on the establishment of maintenance plans which consider uncertainties and apply a probabilistic approach to maintenance [14,15,16], but they mainly focus on infrastructure failures and new materials. Furthermore, most existing studies on the prediction of service life using a probabilistic approach are limited to single components and are insufficient for considering the individual service life of various components. This study aims to systematize the finishing work components of public housing and analyze the service life patterns of various components through a probabilistic approach. The results of this study will contribute to the establishment of a flexible long-term maintenance plan by reflecting uncertainties in service life patterns through a consideration of various cases and by breaking away from the conventional deterministic repair cycle with respect to service lifetime.
2. Literature Review
Public housing is a type of apartment supplied by the government to guarantee the residences of citizens from the low and middle classes in developing countries [17,18]. Most studies on public housing have focused on the planning stage such as the schedule performance improvement of public housing, the supply patterns, and methods of public housing [17,19] Even if public housing has a variety of occupants, the maintenance plans are important because they are managed collectively by the government. Although there are studies on the maintenance stages of public housing [7,20], most of them are related to the post-occupancy evaluation (POE) of occupants and there has been insufficient research on maintenance plans from the long-term perspective.
The percentage of new buildings is continuously decreasing among all buildings and the importance of performance maintenance of existing buildings is being emphasized [13]. This means maintenance management plays a major role in the performance of constructed facilities [21]. Furthermore, unlike the planning and construction stages, the maintenance stage of a building is subject to various human, social, and environmental factors. Studies on maintenance plans and decision-making methods to control these factors have been conducted. Amaratunga et al. [21] provided a performance-based approach that considers the FM process elements for measurement to be people-process and output-customers. Cristiano et al. [22] proposed a multicriteria model based on the time-delay concept to provide the builder with a quantitative tool to support the creation of a maintenance inspection plan. Liu and Frangopol [23] formulated the life-cycle maintenance planning of deteriorating bridges as a multiobjective optimization problem that treats the life-time condition and safety levels as well as life-cycle maintenance cost as separate objective functions.
Related studies from various perspectives have been searching for maintenance methods to maintain service quality and save costs. The trend of maintenance plans is gradually evolving from corrective to preventive plans [24], and relevant studies have argued that service life assessment is an essential element for establishing efficient maintenance plans and for decision making [25,26]. As the importance of service life assessment is emphasized, studies on service life prediction for components of buildings have been conducted. Silva [27] developed a model for predicting the service life of ceramic tile installations and validated the model based on a survey of 117 case studies in Lisbon. Rabaiotti [28] proposed pavement rehabilitation design through service life prediction using a case study of runway 14/32 at Zurich International Airport. Huaizhi et al. [11] proposed a model evaluating the probability of independent and/or correlated failure service life for dams, considering the components that caused deterioration of dams. However, most of existing literature on service life focused on specific projects, specific components, and specific time points; thus, the literature had limitations in reflecting the uncertainties associated with service life throughout the building lifecycle.
As can be seen from existing literature, establishing maintenance strategies in consideration of the service life of various components is very important in terms of safety and cost, and is indispensable to satisfy the needs of occupants. The probabilistic approach has been adopted to establish a maintenance plan reflecting the uncertainties in the maintenance stage [24], because the existing deterministic maintenance plans have limitations in responding to uncertainties caused by complex effects of various components in the maintenance stage [14]. Various studies on probabilistic maintenance plan have been carried out because it enables the establishment of an efficient maintenance plan that reflects uncertainties when compared to the conventional deterministic maintenance plan. Kong [15] presented a probabilistic method for the optimization of aging structures considering maintenance and failure costs. Frangopol et al. [14] proposed an interaction model between structural safety analysis, through the safety index, and visual inspections and nondestructive tests through the condition index for deteriorated civil infrastructures. Chen [16] proposed the optimization of decision making to support multi-objective maintenance decision making, by emphasizing the importance of obtaining efficient solutions for decision making for infrastructure.
However, even though existing studies that attempted a probabilistic approach have sought ways to reduce the failure costs and improve the structural reliability for infrastructure such as bridges and dams, they were limited in analyzing the service life from a long-term maintenance perspective. The establishment of a long-term maintenance plan for public housing in which occupants with various lifestyles live is critical, especially in the maintenance stage because there is a high possibility of uncertainties. However, related works have limitations in reflecting the various uncertainties in the maintenance stage and had difficulty in establishing flexible maintenance plans due to deterministic service life assessments [22]. To incorporate uncertainties, this study analyzes service life patterns through the probabilistic approach. From a long-term maintenance perspective of public housing, the works that have the greatest uncertainties due to the complex interactions of the most frequent and diverse components are finishing works [12,29]. In this perspective, service life assessment is urgently needed, but related studies are being conducted narrowly.
Related studies have been conducted as a part of efforts to reduce risks about the uncertain factors of finishing works. As finishing works involve various uncertain factors, these studies were carried out largely in two categories: studies applying BIM, robot construction, etc., to enhance the accuracy and efficiency of finishing works [30,31], and studies for shortening the time and stabilization of these finishing works by applying virtual simulation, lean construction, etc. [12,32]. It can be seen that most studies focused on reducing risks in the construction stage. However, because finishing works have the varying and unpredictable characteristics, studies on planning are required not only in the construction stage, but also in the maintenance stage. Particularly for public housing, since finishing works gives rise to risks by the complex actions of various factors rather than defects resulting from the deterministic actions of single factors, it is essential to determine and manage the service life in the maintenance stage.
In this respect, this study intends to analyze service life patterns reflecting uncertainties by breaking away from the existing framework of deterministic maintenance plans for the finishing work components of public housing in South Korea, where problems due to the deferred maintenance have been increasing recently. The service life pattern analysis results based on the probabilistic approach are used for setting the service lifetime of each component and deriving the patterns and timings of maintenance inspections and maintenance activities. The results of this study will build a foundation for flexible long-term maintenance planning of public housing.
3. Method and Data
3.1. Research Methodology
This study aims to establish the flexible and efficient long-term maintenance plans through analysis of the service life pattern of each component of finishing works. To that end, annual maintenance frequency data of public housing finishing work components have been collected. The probabilistic approach was applied based on this data, and a Monte-Carlo simulation was performed with the annual frequency distribution of each component as input. Through this simulation, the service life patterns of public housing components were analyzed from the perspective of long-term maintenance plans that reflect uncertainties. This study was conducted largely in three steps: (1) Setting up the service life matrix; (2) Estimating frequency distributions by cell; and (3) Estimating service life distribution by finishing work components [33] (Figure 1).
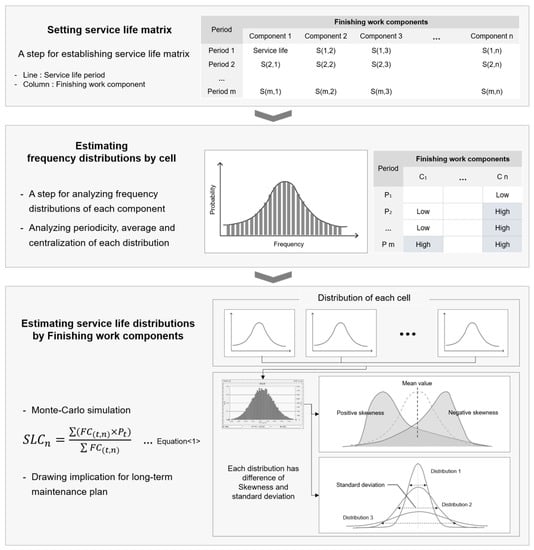
Figure 1.
Flowchart for service life analysis.
- Setting up the service life matrix: In this step, finishing work components are set by reviewing existing literature on apartments, public housing, and their finishing works. Then a service life matrix is set up by putting the components and repair years as columns and rows, respectively. The purpose of this matrix is to identify the repair frequency of each component at each time point during the maintenance period of finishing work components, and the frequency by each time point of each component is also derived.
- Estimating frequency distributions by cell: In this step, the frequency distribution of each cell of the matrix is derived. For this purpose, the frequency distribution for each cell is determined through fitting. For the frequency distribution, the Poisson distribution is applied, which is a typical discrete distribution model. For analysis, the frequency distribution is derived by performing a Monte-Carlo simulation of the maintenance frequency data. Then, the periodicity and centralization of the derived frequency distribution are analyzed to determine which maintenance activity type is appropriate for the corresponding component.
- Estimating service life distribution by finishing work components: In this step, the Monte-Carlo simulation is carried out by applying the frequency distribution for each cell derived previously into Equation (1). The equation used to determine the service life distribution of various components of finishing works iswhere = Service lifetime of component, = Frequency distribution of component, and = Period.
Equation (1) gives the weighted average of frequency for each period of the finishing work components and provides the basis for setting the service lifetime. This analysis method is different from the existing method of calculating the service life because, rather than simply entering the average value, it can consider various cases through the Monte-Carlo simulation after inputting the frequency distribution derived in step 2. Using the service life distribution of each finishing work derived through this process, the uncertainty can be identified by deriving the standard deviation. The centralization of maintenance activity can also be efficiently determined by analyzing skewness. Therefore, this study will provide the foundation for overcoming the limitations of the service lifetime of deterministic maintenance plans and foster the establishment of a flexible long-term maintenance plan.
3.2. Data Requirements
To analyze the service life pattern of finishing works and derive maintenance strategies for each finishing work component, the maintenance history during the service period of public housing is required. Thus, to analyze the service life patterns of finishing works in this study, the maintenance history data of public housing managed by the Seoul Housing and Communities Corporation (SH) were collected. The collected data were 46,201 maintenance cases of finishing works for 41 buildings in in six public housing complexes in Seoul for 21 years between 1997–2017, which correspond to 5 to 25 elapsed years of public housing apartments aged 25 years or older. The data include all of the maintenance cases in public housing complexes in addition to finishing work repair. For accurate analysis and filtering out redundant data, the data was filtered to only include those maintenance cases that occurred at a household unit and excluded public sharing space cases such as entrance and parking lots. This research used a probabilistic approach in order to secure sufficient historical data for each matrix cell. It is important to note that this research methodology is a probabilistic approach model based on actual data; thus, insufficient data may lead to an incorrect result. In order to secure sufficient data, components with fewer occurrences, such as masonry work, were excluded from the data filtering process.
First, the finishing work components were classified as follows (Table 1) through reviews of domestic and international papers on housing units. The following papers in Table 1 include content about housing or apartment construction and involve the classification of work type. For establishing classification of finishing work components, components that included finishing work are selected from the entire components. Although the classification levels of the finishing works varied by paper, the common components were selected and classified for this study (Table 2).

Table 1.
Finishing work classification.
Table 2.
Finishing work components of this research.
By referring to the classification system of the SH’s FMIS (Facility Management Information System), the finishing works were classified into eight components: painting work, plaster work, doors and windows, waterproofing work, interior finishing, tile work, carpentry work, and roof and drains.
As can be seen in Table 3, the component that has the largest number of repair records among all the components was interior finishing, which accounted for 42.69%. This is because the interior finishing, which consists of interior decoration works such as linoleum, wallboard, and wallpaper are affected the most by the use patterns of occupants and the environment. The components that had the next largest numbers of repair records were doors and windows, and painting work. This is because the doors and windows consist of larger numbers than all the other components inside the public housing and need replacement and repair due to damage. Furthermore, painting work had many repairs because of frequent problems due to aging and corrosion issues such as discoloring and peeling. Unlike the components that require frequent repairs carpentry work, roof and drains, and plaster work had relatively low numbers of repairs.
Table 3.
Statistics of maintenance cases.
4. Results
4.1. Establishing the Service Life Matrix Framework
To examine the repair frequency at each time for each component, a service life matrix was set up based on the service lifetimes of the classified components (Table 4).
Table 4.
The service life matrix.
The lines of the service life matrix represent the elapsed time, or the service period after completion of each public housing building, and the columns represent the components of the classified finishing works. For these matrices, the 46,201 repair history data points of finishing works during maintenance activities for public housing in six complexes for about 20 years from 1997 to 2017 were collected and allocated to the cells of the matrices. Care should be taken because this is a probabilistic model based on actual repair history data, the analysis results may be incorrect if the amount of data allocated to each cell is insufficient. Thus, the matrices were built so that an appropriate number of data points for the analysis would be allocated to each cell.
4.2. Estimating Frequency Distributions by Cell
The frequency distribution of each cell was derived based on the matrix (Figure 2). The following example shows the S(14,4) of the service life matrix, which corresponds to a frequency distribution of interior finishing repairs of the 18th year. The distribution in Figure 2 was derived based on the maintenance repair frequency per period of each component in each cell, and the distributions varied as the ratios changed.
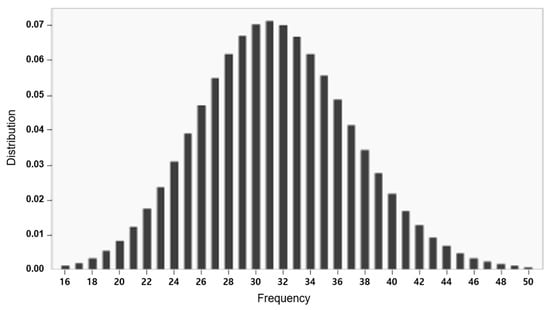
Figure 2.
Frequency distribution example - Interior finishing 18 years (S(14,4)).
Table 5 below shows the mean values of frequency distribution by cell. Most cells had a frequency distribution except for the time periods when maintenance and repair were not performed. As shown in this table, unlike the existing deterministic repair times of finishing works, repairs were performed at various times due to risks in use such as the use patterns of occupants, climate, use environment, and carelessness as well as various factors such as aging over time. This suggests that because the finishing works have risks due to various factors during the maintenance period, efficient maintenance is not carried out under the existing deterministic repair cycle. This implies a need for the calculation of service life that reflects uncertainties due to various factors when establishing a long-term maintenance plan for finishing works.
Table 5.
Mean value of frequency distributions by cell.
An examination of the distribution of each cell in each component reveals the centralization, regularity, and periodicity of repairs. The service lifetime setting and inspection time setting can be affected by when the repair frequencies are centralized and whether they have a certain period. The analysis results of frequency distribution in each cell are as follows. First, interior finishing and doors and windows, which had relatively high repair frequencies, showed a high repair frequency at an early time of 6–7 years after completion, and the repair frequency increased again in the 20th year after completion. This means that interior finishing and doors and window components not only have very high use frequencies, but also require continuous inspections and management of aging in periods of 3–4 years. Painting work and waterproofing work, which had next highest repair frequencies, showed a sharp increase of repair frequency at around 7–8 years after completion, and the repair frequency increased again from around the 18th to 20th years, indicating centralization of repairs at specific times. Tile work also showed a sharp increase of repair frequency at 7–8 years after completion, but after that, it showed an increasing repair frequency from the 13th year, which is relatively early. In the case of plaster work, carpentry work, and roof and drains, which had relatively low repair frequencies, the highest repair frequency appeared in the 22th year for plaster and carpentry works, and in the 24th year for roof and drains. These components generally showed very low repair frequencies, were centralized at specific times, and had a very long periodicity.
4.3. Estimating Service Life Distributions by Finishing Work Components
The service life distribution of each component of public housing finishing works was created by performing a Monte-Carlo simulation and was performed for the distribution of each derived cell based on Equation (1), which can reflect various cases of distributions in each cell (Figure 3). As shown in Figure 3, through the average (µ), standard deviation (σ), minimum, and maximum of the derived service life distribution, the distribution pattern, the degree of uncertainty, and skewness can be analyzed. The centralization of maintenance activities can then be determined and an efficient long-term maintenance plan can be established.
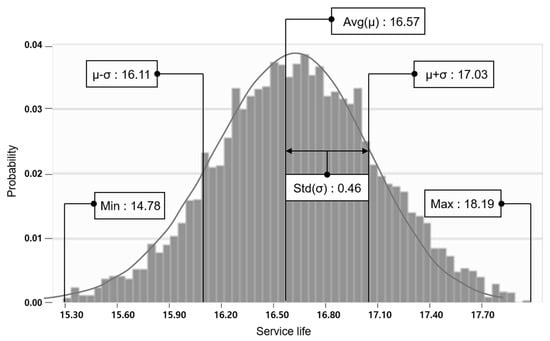
Figure 3.
Service life distribution example—Painting work.
Table 6 below summarizes the characteristics of service life distribution of the repair components. First, painting work, waterproof work, interior finishing, tile work, and doors and windows, which had relatively high repair frequencies, all showed a service life distribution of the normal distribution type. Furthermore, these components had a low standard deviation lower than 0.5. The standard deviation indicates how widely the values are distributed from the mean value (average). A low standard deviation indicates that the component has relatively small deviations and the mean value is appropriate as the service lifetime. In contrast, plaster work, carpentry work, and roof and drain components, which had a low repair frequency, showed a large standard deviation compared to the other components. This means that the values have large deviations, and the service lifetime of the corresponding component is uncertain. Consequently, for these components, we need to search for response measures considering various factors including occupants, use environment, and climate, even if a long-term service life is set.
Table 6.
Statistics of service life distributions.
Furthermore, the existing service life of finishing works in the long-term repair plan establishment standards under the Housing Act in South Korea, was compared with the mean value of the service life distribution derived in this study (Table 6). In general, the long-term repair plans announced in South Korea are classified into building exteriors, building interiors, equipment, appurtenant facilities, etc., and finishing works correspond to building exteriors and interiors. It was found that there is no legally announced service life for tile work and carpentry work. Consequently, unlike other finishing work components, the repairs of these components are determined depending on the condition when repair is needed. However, in the case of the public housing analyzed in this study, risks may occur due to various factors; thus, the service life of every component must be considered when a long-term maintenance plan is established. The service life results derived in this study will be useful for this purpose.
In the case of other components, such as waterproofing work, and doors and windows, the official service life was similar to the service life derived in this study, but they were different in some components. The public housing buildings, which are the subject of this study, have limitations in maintenance costs and activities unlike other residence buildings for which maintenance activity can be performed at the desired time, because they are managed collectively by the government. For this reason, the calculation of accurate service life will enable more economic maintenance such as reducing unnecessary maintenance costs. The implications for the maintenance planning based on the results of this study considering the distribution patterns including the standard deviation of each distribution are summarized in Table 7.
Table 7.
Implication for the maintenance planning.
In order to calculate the service life and establish a long-term maintenance plan of each component in Table 7, this study considered three values:
- Mean value: The standard deviation and skewness were considered comprehensively to determine whether it is appropriate to set the mean value as the service lifetime.
- Standard deviation: The standard deviation means the degree of uncertainty and a small standard deviation implies that repairs are centralized near the mean value and the uncertainty is relatively low. Therefore, the service lifetime was set to the mean value of distribution. In contrast, a large standard deviation implies a large uncertainty and there may be risks if the mean value is set as the service lifetime. Thus, continuous maintenance activities are required around the mean value.
- Skewness: Skewness is classified into negative or positive depending on the possibility of high frequency, which is considered when the centralization of maintenance activities is determined. Furthermore, in order to determine the centralized time of maintenance activities, the average frequency distribution for each cell in Table 5 was considered to determine whether periodic management or centralized management at the service lifetime is necessary.
The service life pattern of each component was analyzed by considering the characteristics of frequency distribution and the frequency distribution of each cell (Table 5) in a comprehensive manner, and the maintenance implications were derived. First, in the case of plaster work and waterproofing work, it will be appropriate to set the mean value as the service lifetime and perform centralized maintenance activities from the lower value. In the case of painting work, interior finishing, carpentry work, and doors and window components, which show periodicity, it is necessary to perform continuous inspections based on the cycle years while setting the mean value as the service lifetime. In contrast, there were also components whose skewness is not zero, such as tile work. In the case of these components, although the mean value is set as the service lifetime, it will be appropriate to perform continuous inspections in the periods where repair frequencies are centralized and to perform maintenance activities when there is a problem in the performance of the component. In particular, for roof and drains centralized inspections for 5 years around the service lifetime are necessary. Finally, in the case of carpentry work, whose skewness is positive and very large, centralized inspections for around 3 years based on the service life are necessary. Because the frequency change indicates periodicity in Table 5, a long-term maintenance plan needs to be established for continuous maintenance activities in cycles of 10 years.
Among the analyzed components, painting work, interior finishing, and doors and windows are directly used and come in contact with the occupants. Thus, these components generated problems according to risks in use such as carelessness and use patterns due to the direct use of occupants, and a distribution of high repair frequencies appeared even in the initial stage of maintenance (Table 5). Thus, for components that have risks in use, a long-term maintenance plan should be established after considering the maintenance plans for continuous inspections in the initial stage and the maintenance plans for the times when problems occur due to aging in a comprehensive manner. On the other hand, plaster work, waterproofing work, tile work, and carpentry work have very low repair frequencies before 10 years (Table 5), which means that the occurrences of repairs due to risks in use by occupants are low. This suggests that most repairs for these components are due to aging. Thus, it will be appropriate to establish a long-term maintenance plan according to the implications of Table 7.
5. Conclusions
This study analyzed the service life patterns of finishing work components for public housing in order to establish an efficient long-term maintenance plan. Public housing buildings whose maintenance plans are established collectively under the limited government budget experience limitations in maintenance that the characteristics of each finishing work component cannot be considered. Thus, the probabilistic approach was applied to reflect the uncertainties of each component. The analysis was performed on the 46,201 maintenance cases of finishing works for 21 years of public housing aged 25 years or older in South Korea. To break away from the limitations of the conventional deterministic model which cannot reflect risks of various factors, the service life distribution was derived based on the probabilistic approach.
An analysis of the service life patterns revealed that plaster work, waterproofing work, and tile work among the finishing work components had relatively low uncertainties and required centralized maintenance activities based on the service lifetime. Furthermore, since painting work, interior finishing, and carpentry work had periodicity in the repair frequency, these required continuous inspections according to specific cycles even though the service lift time is set to the mean value of distribution. In the case of roof and drains, which has a large standard deviation, it is necessary to set the mean value as the service lifetime and also set a centralized inspection period of around 5 years based on the service lifetime. Furthermore, painting work, interior finishing, and doors and windows components had high maintenance frequency at the initial maintenance stage. This research draw implications by dividing into these components and other components that showed a high frequency distribution in aging housing stock. It is possible to formulate a strategy of establishing maintenance plans by dividing the repair periods into an initial stage and an aging stage depending on the existence or absence of risks in use of each component.
This research analyzed service life patterns of the components using a probabilistic approach. The result of this research is applicable to long-term maintenance planning in order to improve the longevity of housing stock. This reduces the need for new construction; thus, extending service life improves the sustainability of public housing. As the number of aging public housings is increasing, the efforts for preventive maintenance are continuing, and the demands for long-term maintenance plans are also growing. Although the probabilistic approach is reducing the maintenance costs and improving the structural reliability, it is insufficient for predicting the maintenance times when planning. The long-term maintenance planning proposed in this study through an analysis of the service life patterns will provide a foundation for considering the characteristics of various components of public housings and for building efficient maintenance strategies through the probabilistic approach.
This study is meaningful in that it systematizes the components of finishing works that account for the largest frequencies among the repairs of public housings and suggests a flexible long-term maintenance plan by analyzing the service life patterns of each component. However, consideration about costs is indispensable for efficient maintenance of public housing from a long-term perspective. When planning public housing maintenance budgets, it is necessary to consider not only maintenance frequency of each component but also each component’s maintenance cost. Finishing work, which was the target of this research, has many maintenance cases but has relatively low maintenance costs of each case. Whereas structural parts and MEP which need replacement or major repair, represent low frequency of maintenance but a single maintenance case can be expensive. The analysis method of this research can be applied to the entire construction of public housing as well as finishing work. On this occasion, consideration of costs of each maintenance case will contribute significantly to the long-term maintenance planning and budget allocation of public housing. Thus, consideration of the maintenance cost for each period based on the service lifetime and maintenance planning derived in this study will enable the establishment of long-term maintenance plans through more efficient cost distribution.
Author Contributions
Supervision, S.L.; Writing—original draft, S.P.; Writing—review & editing, Y.A.
Funding
This research was funded by the Ministry of Science, ICT & Future Planning (No. 2015R1A5A1037548).
Acknowledgments
This research was supported by the Basic Science Research Program through the National Research Foundation of Korea (NRF).
Conflicts of Interest
The authors declare no conflict of interest.
References
- Chanter, B.; Swallow, P. Building Maintenance Management, 2nd ed.; Wiley Blackwell Publishing: Hoboken, NJ, USA, 2008. [Google Scholar]
- Ho, D.C.; Gao, W. Collective action in apartment building management in Hong Kong. Habitat Int. 2013, 38, 10–17. [Google Scholar] [CrossRef]
- Koo, S.K.; Kim, J.H.; Jun, I.Y.; Kim, Y.G.; Yoon, Y.S.; Hyun, C.T. Estimation and Adjustment Model Considering Time Value of Money for Long-Term Maintenance Cost of Apartment House. Korean J. Constr. Eng. Manag. 2017, 18, 12–21. [Google Scholar]
- Kim, S.H. An Empirical Analysis of Facility Maintenance Cost of Public Rental Housing; The Seoul Institute, Seoul Studies: Seoul, Korea, 2017; pp. 83–97. [Google Scholar]
- Wu, F. Changes in the Structure of Public Housing Provision in Urban China. Ed. Urban Stud. 1995, 33, 1601–1627. [Google Scholar] [CrossRef]
- Lee, H.C.; Kim, Y.S. A Study on the Problem Analysis and Improvements of Long-Term Maintenance for the Permanent Rental Housing in Korea. Korean J. Constr. Eng. Manag. 2005, 6, 169–176. [Google Scholar]
- Fan, S.; Lu, J. The Evaluation of the Construction and Management Situation of Chinese Public Housing: A case Study in Harbin. In Proceedings of the International Conference on Construction and Real Estate Management, Kunming, China, 27–28 September 2014. [Google Scholar]
- Song, S.H.; Lee, S.J.; Park, S.J. Determining Major Items of Scheduled Maintenance for Apartment through Cases Data: Focused on Improving the Establishment Standard for Long-term Repair program. LHI J. Land Hous. Urban Aff. 2016, 7, 43–51. [Google Scholar] [CrossRef]
- Yao, Y.; Chi-Wing Ho, D.; Chau, K.-W.; King-Chung Cheung, A.; Wong, K.-W.; Leung, H.-F.; Siu-Yu Lau, S.; Wong, W.-S. A survey of the health and safety conditions of apartment buildings in Hong Kong. J. Build. Environ. 2008, 43, 764–775. [Google Scholar]
- Qing Li, C. Reliability Based Service Life Prediction of Corrosion Affected Concrete Structures. J. Struct. Eng. 2004, 130, 1570–1577. [Google Scholar] [CrossRef]
- Su, H.; Hu, J.; Wen, Z. Service Life of Dam Systems with Correlated Failure Modes. J. Perform. Constr. Facil. 2013, 27, 252–269. [Google Scholar] [CrossRef]
- Brodetskaia, I.; Sacks, R.; Shapira, A. A workflow /model for systems and interior finishing works in building construction. J. Constr. Manag. Econ. 2011, 29, 1209–1227. [Google Scholar] [CrossRef]
- Wang, B.; Xia, X. Optimal maintenance planning for building energy efficiency retrofitting from optimization and control system perspectives. J. Energy Build. 2015, 96, 299–308. [Google Scholar] [CrossRef]
- Frangopol, D.M.; Neves, L.C. Probabilistic Maintenance and Optimization Strategies for Deterioration Civil infrastructures, Progress in Computational Structures Technology. In Progress in Computational Structures Technology; Topping, B.H.V., Mota Soares, C.A., Eds.; Saxe-Coburg Publications: Stirling, UK, 2004; pp. 353–377. [Google Scholar]
- Kong, J.S.; Frangopol, D.M. Probabilistic Optimization of Aging Structures Considering Maintenance and Failure Costs. J. Struct. Eng. 2005, 131, 600–616. [Google Scholar] [CrossRef]
- Chen, L.; Henning, T.F.; Raith, A.; Shamseldin, A.Y. Multiobjective Optimization for Maintenance Decision Making in Infrastructure Asset Management. J. Manag. Eng. 2015, 31, 04015015. [Google Scholar] [CrossRef]
- Choong Kog, Y. Project Management and Delay Factors of Public Housing Construction. Pract. Period. Struct. Des. Constr. 2018, 23, 04017028. [Google Scholar]
- Hui, E.C.M. Measuring Affordability in Public Housing from Economic Principles: Case study of Hong Kong. J. Urban Plan. Dev. 2001, 127, 34–49. [Google Scholar] [CrossRef]
- Cheng, C.; Shen, K.; Li, X.; Zhang, X. Major Barriers to Different Kinds of Prefabricated Public Housing in China: The Developers’ Perspective. In Proceedings of the International Conference on Construction and Real Estate Management, Guangzhou, China, 10–12 November 2017. [Google Scholar]
- Lin, G.; Ai-Lin Teo, E. Attributes Influencing the Determination of Building Adaptation Potential for Public Housing in Singapore: Occupants’ Perspectives. In Proceedings of the International Conference on Sustainable Design and Construction, Kansas City, MO, USA, 23–25 March 2011; pp. 119–128. [Google Scholar]
- Amaratunga, D. Assessment of facilities management performance. J. Prop. Manag. 2000, 18, 258–266. [Google Scholar] [CrossRef]
- Cavalcante, C.A.V.; Alencar, M.H.; Lopes, R.S. Multicriteria Model to Support Maintenance Planning in Residential Complexes under Warranty. J. Constr. Eng. Manag. 2017, 143, 04016100. [Google Scholar] [CrossRef]
- Liu, M.; Frangopol, D.M. Multiobjective Maintenance Planning Optimization for Deteriorating Bridges Considering Condition, Safety, and Life-Cycle Cost. J. Struct. Eng. 2005, 131, 833–842. [Google Scholar] [CrossRef]
- Ghosh, D.; Roy, S. Maintenance optimization using probabilistic cost-benefit analysis. J. Loss Prev. Process Ind. 2009, 22, 403–407. [Google Scholar] [CrossRef]
- Bowles, D.S. Evaluation and Use of Risk Estimates in Dam Safety Decision making. In Proceedings of the United Engineering Foundation Conference on Risk-Based Decision-Making in Water Resources IX, 20-Year Retrospective and Prospective of Risk-Based Decision-Making, Santa Barbara, California; ASCE: Reston, VA, USA, 2001; pp. 1–17. [Google Scholar]
- Su, H.Z.; Ping, W.Z.; Jiang, H.; Ru, W.Z. Evaluation model for service life of dam based on time-varying risk probability. J. Sci. China Serv. Eng. Technol. Sci. 2009, 52, 1966–1974. [Google Scholar] [CrossRef]
- Silva, A.; de Brito, J.; Gaspar, P.L. Service life prediction model applied to natural stone wall claddings (directly adhered to the substrate). J. Constr. Build. Mater. 2011, 25, 3674–3684. [Google Scholar] [CrossRef]
- Rabaiotti, C.; Anstad, M.; Schnyder, M. Pavement rehabilitation of runway 14/32 at Zurich International Airport: Service life prediction based on updated incremental damage approach. In Airfield and Highway Pavement 2013: Sustainable and Efficient Pavements; ASCE: Reston, VA, USA, 2013; pp. 609–627. [Google Scholar]
- Hong, S.O.; Hyun, C.T.; Ji, S.M.; Son, M.J. Selection of Primary Management Objects for Defect Prevention of Apartment Finishing Works. J. Archit. Inst. Korea Struct. Constr. 2011, 27, 185–194. [Google Scholar]
- Zhang, Y.; Liu, H.; Mohamed, A.H. Recommender system for Improving BIM Efficiency: An Interior Finishing Case study. In Construction Research Congress; ASCE: Reston, VA, USA, 2018; pp. 22–32. [Google Scholar]
- Kropp, C.; Koch, C.; König, M.; Brilakis, I. A framework for automated delay prediction of finishing works using video data and BIM-based construction simulation. In Proceedings of the 14th International Conference on Computing in Civil and Building Engineering, Moscow, Russia, 27–29 June 2012; Available online: https://www.researchgate.net/profile/Ioannis_Brilakis/publication/259115881_A_framework_for_automated_delay_prediction_of_finishing_works_using_video_data_and_BIM-based_construction_simulation/links/57d9659b08ae6399a39ad336/A-framework-for-automated-delay-prediction-of-finishing-works-using-video-data-and-BIM-based-construction-simulation.pdf (accessed on 27 November 2018).
- Irina, B.; Rafael, S.; Aviad, S. Stabilizing Production Flow of Interior and Finishing Works with Reentrant Flow in Building Construction. J. Constr. Eng. Manag. 2013, 139, 665–674. [Google Scholar]
- Lee, S.H.; Ahn, A.H. Analyzing the Long-Term Service Life of MEP Using the Probabilistic Approach in Residential Buildings. Sustainability 2018, 10, 3803. [Google Scholar] [CrossRef]
- Park, H.T.; Lee, B.H. A Study on WBS-based Hierarchical Classification of All Construction Information for Apartment House. Adv. Sci. Technol. Lett. 2014, 76, 12–16. [Google Scholar]
- Forcada, N.; Macarulla, M.; Gangolells, M.; Casals, M. Handover defects: Comparison of Construction and Post-handover housing defects. J. Build. Res. Inf. 2016, 44, 279–288. [Google Scholar] [CrossRef]
- Lim, H.C. Influence Factors and Management based on Phase of Building Construction for the Improvement of Post Occupancy Indoor Air Quality. J. Korea Inst. Build. Constr. 2011, 11, 576–586. [Google Scholar] [CrossRef]
- Roh, S.J.; Tae, S.H.; Suk, S.J.; Ford, G. Evaluating the Embodied Environmental Impacts of Major Building tasks and Materials of Apartment buildings in Korea. Renew. Sustain. Energy Rev. 2017, 73, 135–144. [Google Scholar] [CrossRef]
© 2018 by the authors. Licensee MDPI, Basel, Switzerland. This article is an open access article distributed under the terms and conditions of the Creative Commons Attribution (CC BY) license (http://creativecommons.org/licenses/by/4.0/).