1. Introduction
This paper is an extended version of work presented at the 10th Windsor Conference [
1].
Awareness of the role of social housing stock in today’s cities and the importance of dwellings built between 1939 and 1979 has increased. In the specific case of Seville, these buildings represent over 48% of current residential stock [
2]. This figure increases to over 51% if those built at the beginning of the 20th century are included. Therefore, more than half of the city’s dwellings display varying degrees of obsolescence. These buildings originally had no effective thermal insulation measures and display major deficiencies in terms of current energy standards and well-being and hygiene conditions (the first mandatory measures for limiting overall energy demand in buildings only came into effect with the Basic Building Standard on Thermal Conditions in Buildings, NBE CT-79 [
3]).
Of this percentage, the dwellings classified as ‘social’ make up over 60% of the total. This group of social housing is most at risk and accounts for more than 30% of all current housing in the city of Seville.
The building envelopes of a large part of the current housing stock result in the environmental performance of these dwellings being far from current comfort standards and also determine users’ expectations. These aspects are particularly important in order to meet the requirements set out in the European Energy Saving Directives [
4] and Horizon 2020 targets, as well as national regulations that establish minimum environmental and energy requirements for residential buildings [
5]. Many of these regulatory requirements often focus on the construction of new buildings, establishing patterns of energy use and consumption which are far removed from the current conditions in existing buildings. Recent studies show that a large number of the existing buildings have significantly lower energy demands than those predicted in the national energy assessment procedures [
6,
7] derived from Directive 2002/91/EEC [
8]. Current residential buildings generally have limited capability in terms of envelope thermal control, while indoor environments cannot generally be controlled due to the absence of thermal conditioning systems. This issue greatly affects less wealthy population groups, who often cannot afford to invest in artificial indoor climate control.
In the social housing stock built from the mid-20th century onwards there is an almost complete absence of built-in technical climate-control systems (boilers or heat pumps). Residents often solve the indoor climate issue partially by using portable devices or room-size systems such as split XD units, therefore controlling only some rooms in best-case scenarios.
This behaviour can be explained by energy poverty situations [
9], users’ social and cultural indoor-environment control traditions similar to those throughout southern Europe [
10], and a geographical adaptation to less-demanding environmental comfort bands, leading to higher thermal-comfort tolerances [
11,
12,
13,
14].
The study of this set of buildings, following general standards, many of which are derived from Central European or American models, tends to result in an inadequate interpretation of the usual conditions of use, even those preferred by the inhabitants. On many occasions this means greater energy intensity scenarios which, when used to establish baselines for comparison and analysis of the effectiveness of energy efficiency improvements, overestimating the amount of energy which can potentially be reduced, in turn distorting effectiveness and profitability calculations.
Consideration is required in order to understand the current habitability and energy use conditions of dwellings, thus allowing the definition of real targets to be defined based on geographical location and socio-economic context.
In order to establish a common procedure for the energy certification of housing stock in Spain official tools employ common standards for use and operation. However, as these programs calculate energy demand these tools are also used to calculate reduction in demand in energy retrofitting operations, forecasting the return period for the investment. This results in a gap between expected and actual results, often because these patterns for standard use and operation do not fit those found in retrofitted multi-family buildings in the south of Spain [
15].
2. Materials and Methods
This methodology analyses the environmental conditions of social housing in order to extract real patterns and forecast the design of energy models. The monitoring has been carried out in 16 residential buildings. The study was focused extracting representative elements which allow these dwellings to be characterised and the probability distributions to be defined.
The case studies are two groups of social housing in multi-family buildings: dwellings built before (pre) and after (post) 1979.
This section is divided into five subsections: monitoring, user surveys, location and climate, case studies, and descriptions of standards.
2.1. Monitoring
The monitoring methodology includes long-term measurements (air temperature, wall temperature, relative humidity, and CO2 level) to determine the behaviour of a given building over a given period such as a season or a full year.
The environmental monitoring system was designed following the specifications of UNE-EN ISO 7726: 2002 [
16]. A more detailed description of the procedure and methodology of monitoring is included within the Efficacia project, as reported by Sendra et al. [
17] and León et al. [
18] in relation to post-1979 dwellings.
Two Wohler CDL 210 indoor data-loggers were placed in each dwelling (one in the living room and the other in the main bedroom) to measure the variables at 30-minute intervals for a full year. Instrument accuracy levels were ±0.5 °C in temperature, ±3% in relative humidity, and ± 50 ppm in CO2. Monitoring was carried out while the housing was occupied, thus allowing us to consider the influence of inhabitants’ patterns on variations in energy consumption, and obtain user patterns.
Given that these dwellings have no systems to control humidity, and relative humidity is 40%–70% most of the time, this paper mostly focuses on air temperature. Statistical analysis techniques were used to classify the behaviour of individual groups of dwellings, identifying their different evolution and patterns in order to obtain probabilistic temperature distribution models for the different kinds of dwellings:
In the post-1979 group [
19], winter and summer models, dividing the latter into cooled, non-cooled, and free-running periods.
In the pre-1979 group [
20], winter and summer models, with the latter operating in free-running mode, given that none of the dwellings in the group have cooling systems.
2.2. User Surveys
This monitoring was completed with a series of surveys on the behavioural habits of tenants to establish correlations between energy consumption, air temperature and these patterns of behaviour in the use of ventilation and cooling and heating systems, thus avoiding the usual divergence between real and estimated patterns of consumption.
2.3. Location and Climate
All case studies are located in Seville, with a Mediterranean climate with mild winters and hot summers.
The current cooling and heating needs of a building depend on both climate conditions and the characteristics of the building envelope—its morphology, orientation, solar radiation capture, and accumulation capacity. In addition, the operational and use conditions, the use of the heating degree day (HDD) and cooling degree day (CDD) parameters have proved useful in assessing the importance of climate evolution in the conditions of use of thermal conditioning systems [
21,
22,
23].
In order to have sufficient accurate data adjusted to the climate affecting the building stock, a set of specific values of day degrees was developed for the city of Seville, both for heating and cooling and applicable to most of the monitored period as well as previous years (in this case 2010 to 2015). The detailed meteorological records of the LEZL station (meteorological station 83910 LEZL, Latitude: 37.41, length: −5.9, altitude: 34 m.a.s.l) were used for the city of Seville. Daily value sets were generated for each year, using threshold analysis methods [
24,
25].
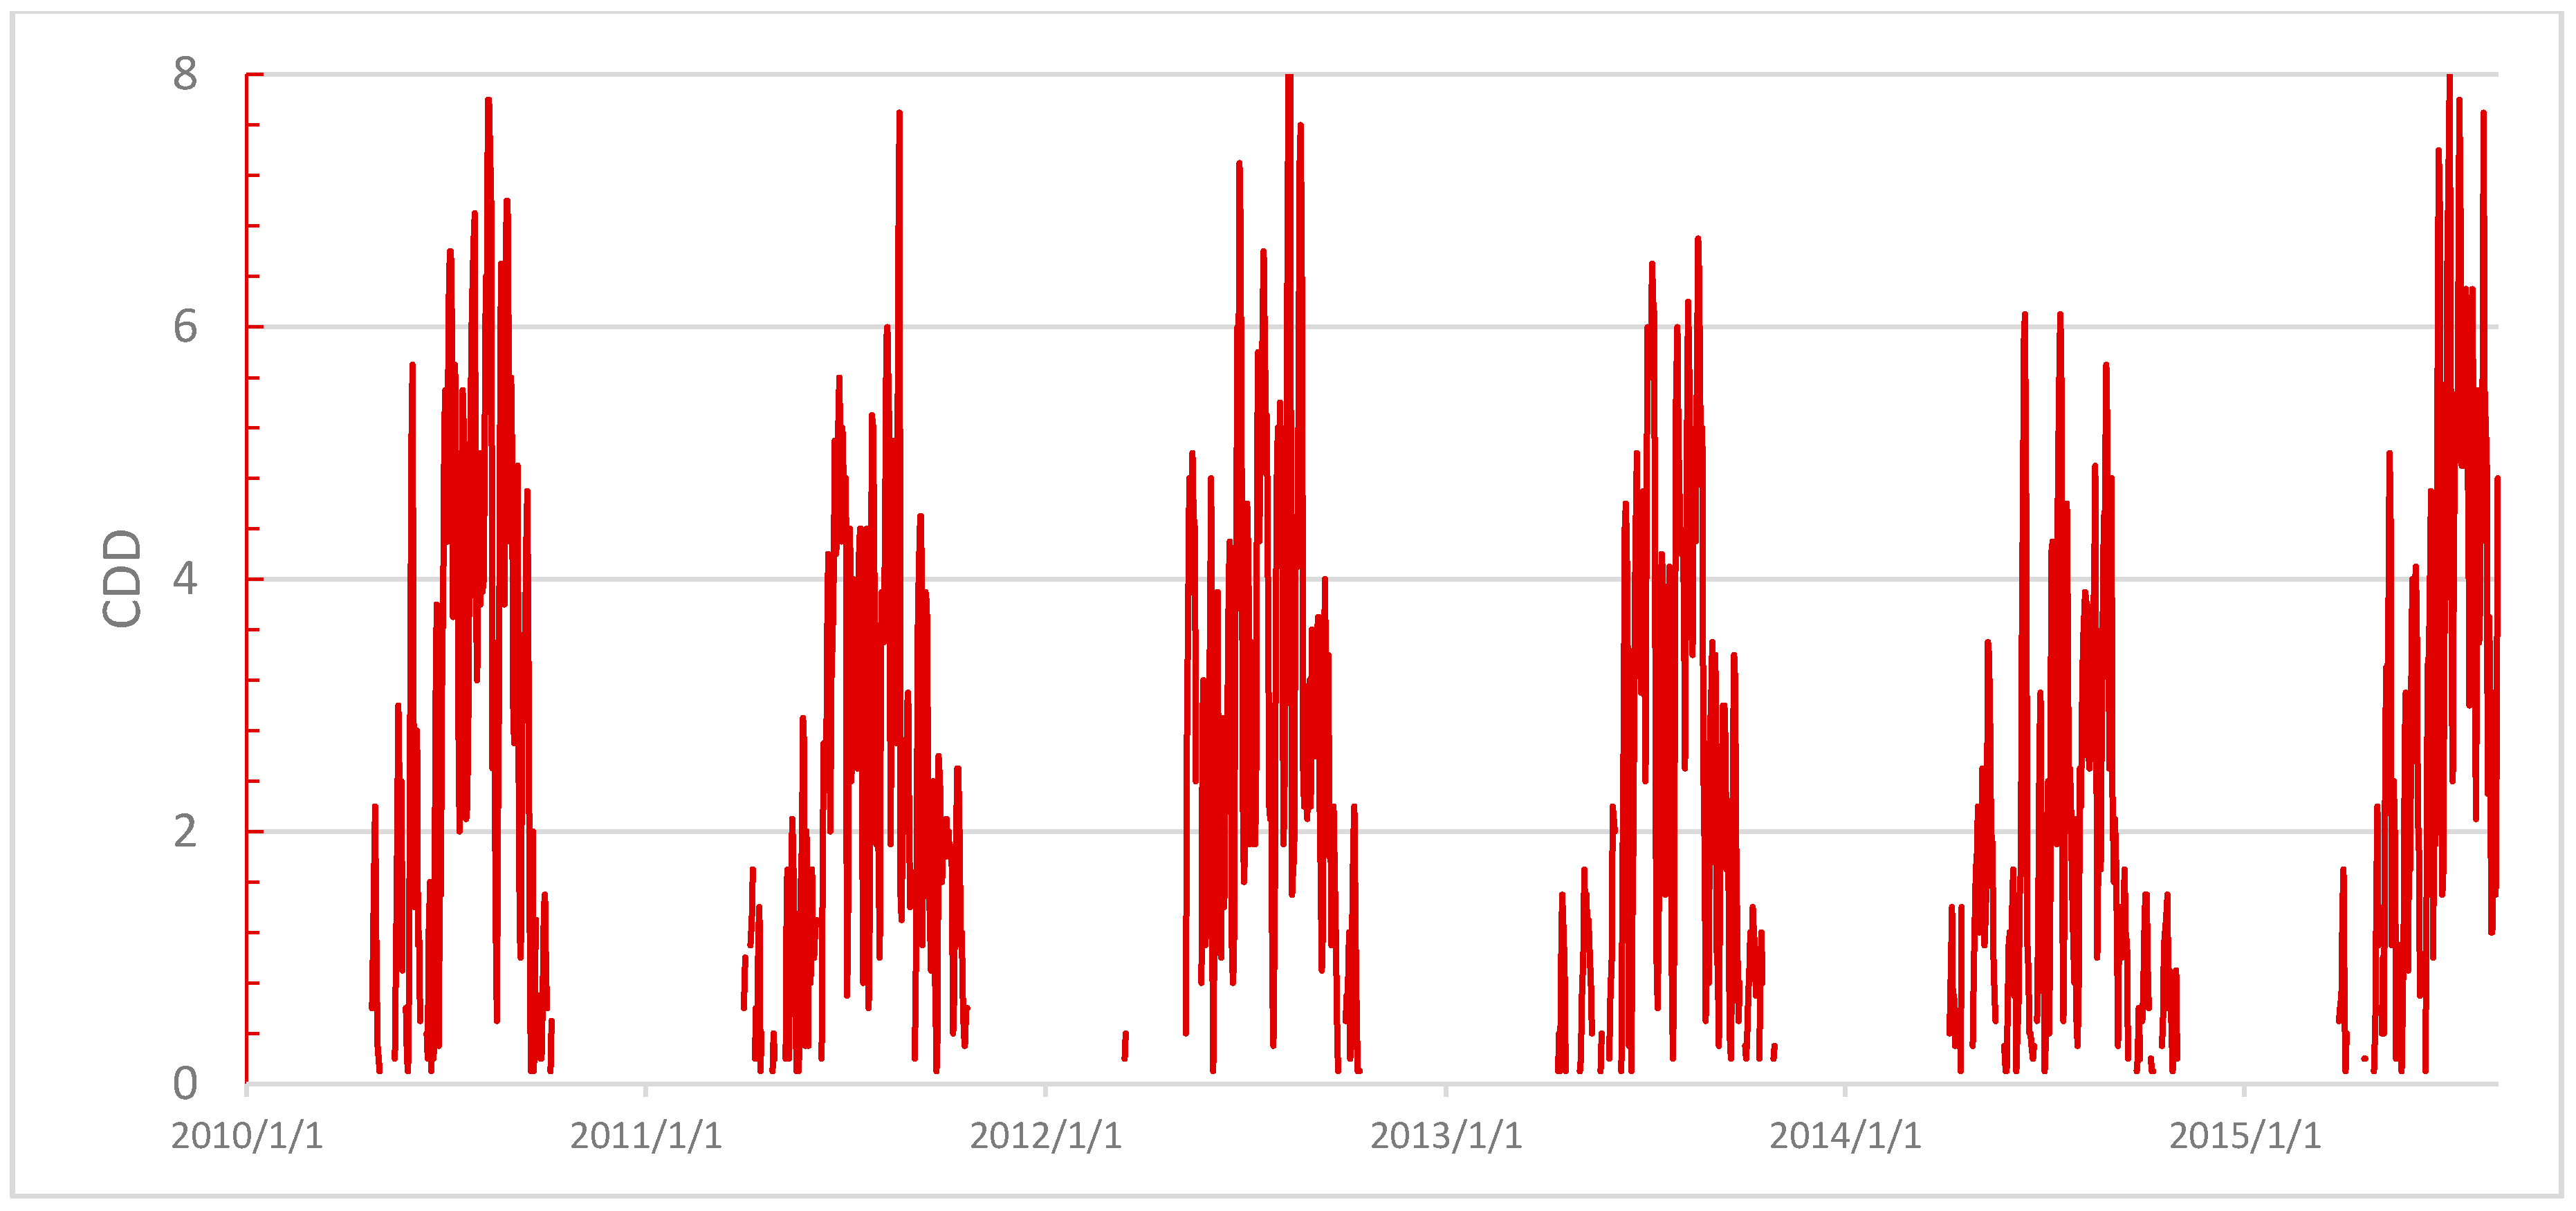
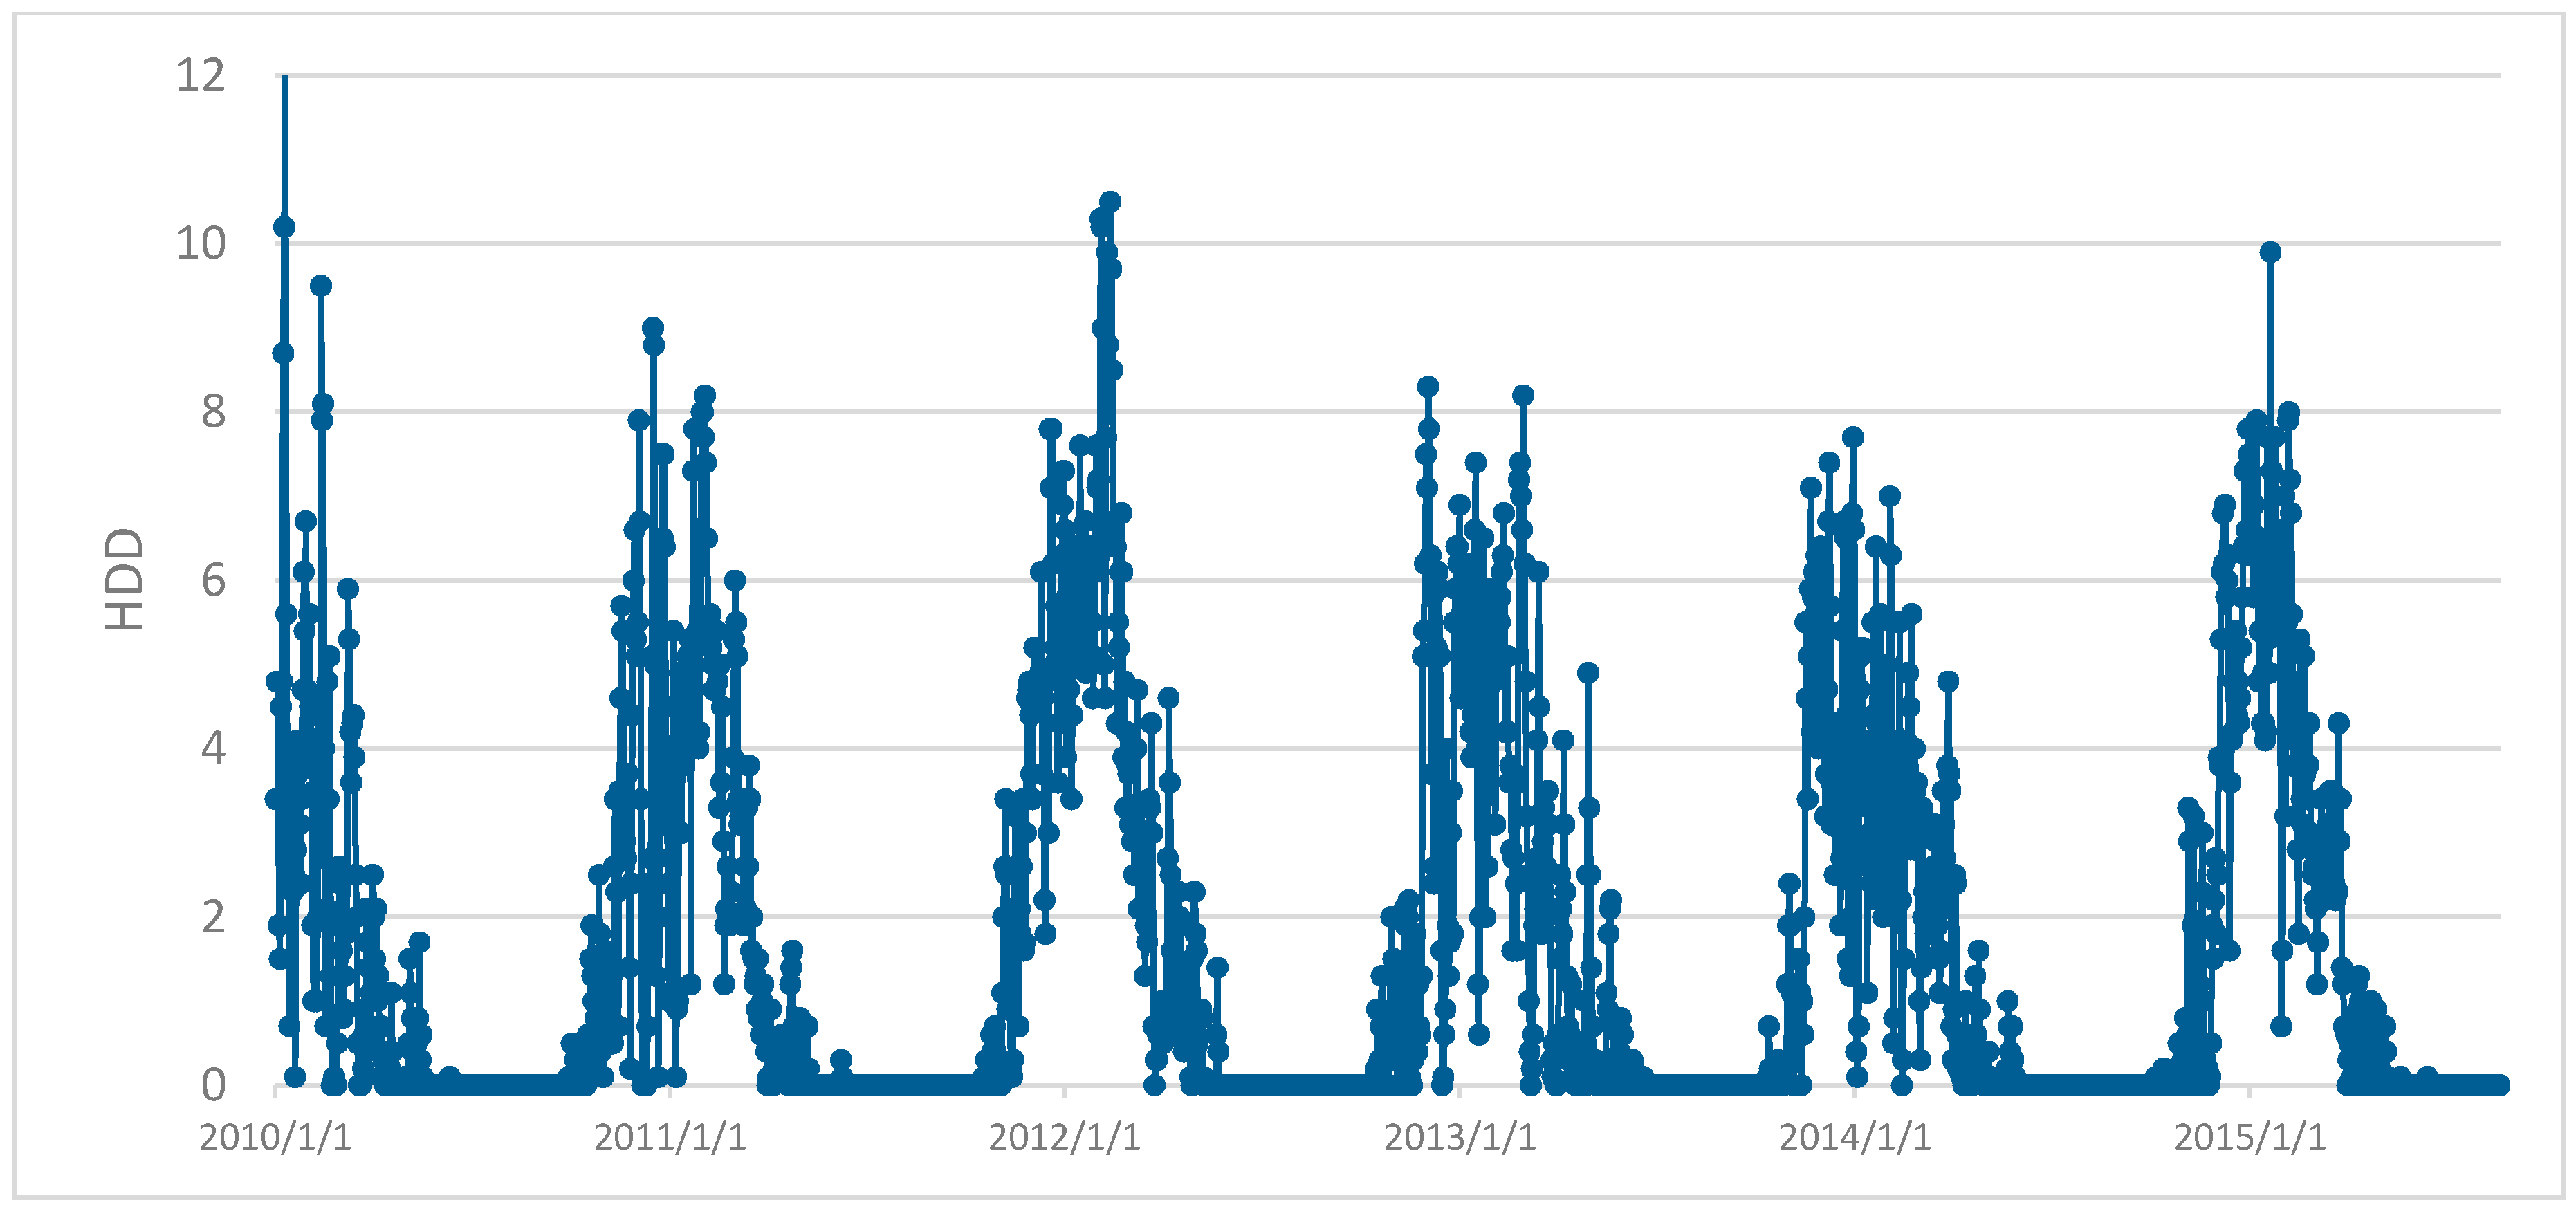
Figure 1 and
Figure 2 represent day degree values for cooling and heating respectively (for significance level greater than 95%). The base temperatures of 15 °C for heating and 25 °C for cooling were selected because they were the closest to the local building types of collective housing, based on occupants’ preferences and thermal tolerance. Moreover, these were chosen in agreement with other authors who have confirmed the best adjustment of these base temperatures to the situation of residential buildings in southern Europe [
26,
27,
28].
During the warm season (
Figure 1) the value of the median—less sensitive to extreme values and better information for the grouping of the central values for the days with a need for cooling during this period—is 2.2 CDD (STD of ± 1.85). Although maximums of 9.80 CDDs are reached in extreme episodes, it is normal for values to be below 4.00 CDD. During the cold season (
Figure 2), the distribution is much more irregular, with significant inter-annual dispersion, and no specific pattern was identified. The daily distribution trend shows mild winters at the beginning and end of the period, with harsher winters in the central part. The representative daily value of the period (median) is 2.3 HDD (STD of ± 2.13), which indicates its great variability in relation to the cooling equivalent. The extreme value can exceed 12 HDD, but represents a very extraordinary situation, with the values below 4.2 HDD.
Although common belief emphasises a greater need for cooling in mild climates such as Seville there is similar distribution of cooling and heating days. The central quartiles of the distribution are similar, if a little higher during heating, which combined with lower home occupation during summer (and thus lower use intensity) gives an idea of the importance of heating in regulating home energy in cities like Seville.
2.4. Case Study
Based on a previous analysis of the social housing stock in southern Spain [
29,
30], the more statistically representative morphological and constructive building typologies were identified, with some neighbourhoods being selected based on the environmental variable characterisation data for the two groups of dwellings examined in this study:
Post-1979 group (eight buildings) [
19]: social dwellings built in the 21st century and representative of social housing in accordance with NBE CT-79 and an average floor area of 65 m
2. There are two groups: a first group of dwellings with a reversible local heat pump in one or two bedrooms, and a second group with no thermal systems. Envelope thermal performance in these buildings is average, with medium-to-low thermal mass and wall thermal transmittance values of 0.5–1 W/m
2K.
Pre-1979 group (eight buildings) [
29,
30]: social dwellings which are representative of the period between 1939 and 1979, not subject to any specific regulation and with an average floor area of 58 m
2. As is common in social housing in southern Spain, most cases have no thermal systems, only portable electric air heaters. Envelope thermal performance in these buildings is average, with medium-to-high thermal mass and wall thermal transmittance values of 1–1.5 W/m
2K.
The blower door tests carried out on the case studies [
31,
32] show medium air permeability for all cases, according to the categories established by UNE EN 13829 [
33], with n
50 average of 6.9 h
−1 (post-1979) and 7.5 h
−1 (pre-1979).
2.5. Regulations on National Consumption and Energy Demand limitation CTE-HE
The ideal scenario for all the available homes would give rise to a set of high comfort values. Its energy analysis makes it possible to ascertain the weight of the intensive use of the house and its systems.
The patterns of use adopted include those established in the Basic Energy Rating Procedures and in the requirement to limit the National Consumption and Demand for Energy CTE-HE [
34,
35], the values of which are shown in
Table 1.
In winter, the EPDB code sets two fixed periods: a low setpoint air temperature of 20 °C for the central hours of the day, and 17 °C for the night-time period, from 11:00 p.m. to 8:00 a.m.
In summer the EPDB code sets three fixed periods: the main period for cooling systems is the evening, which lasts from 4:00 p.m. to 11:00 p.m., when the dwelling is controlled as it is assumed that the operation of the temperature threshold of the cooling systems is not exceeded, with a high setpoint temperature of 25 °C. This is followed by the night-time period, from 11:00 p.m. to 8:00 a.m., during which control is less intense, and natural ventilation cooling the dwelling, although a secondary control programme determines the use of cooling when the temperature is above 27 °C. Finally, a central band is established with the dwelling in free-running conditions (from 8:00 a.m. to 4:00 p.m.).
3. Results
The data monitored in all case studies were analysed, focusing the study on the hourly temperature, CO
2 concentration, and surveys on patterns of use of thermal systems and ventilation. In the temperature graphs, a comfort band was included following [
34,
35].
3.1. Post-1979 Group Temperature
In this group, the analysis was carried out on winter and summer models, dividing the latter into cooled, non-cooled, and free-running periods.
3.1.1. Winter
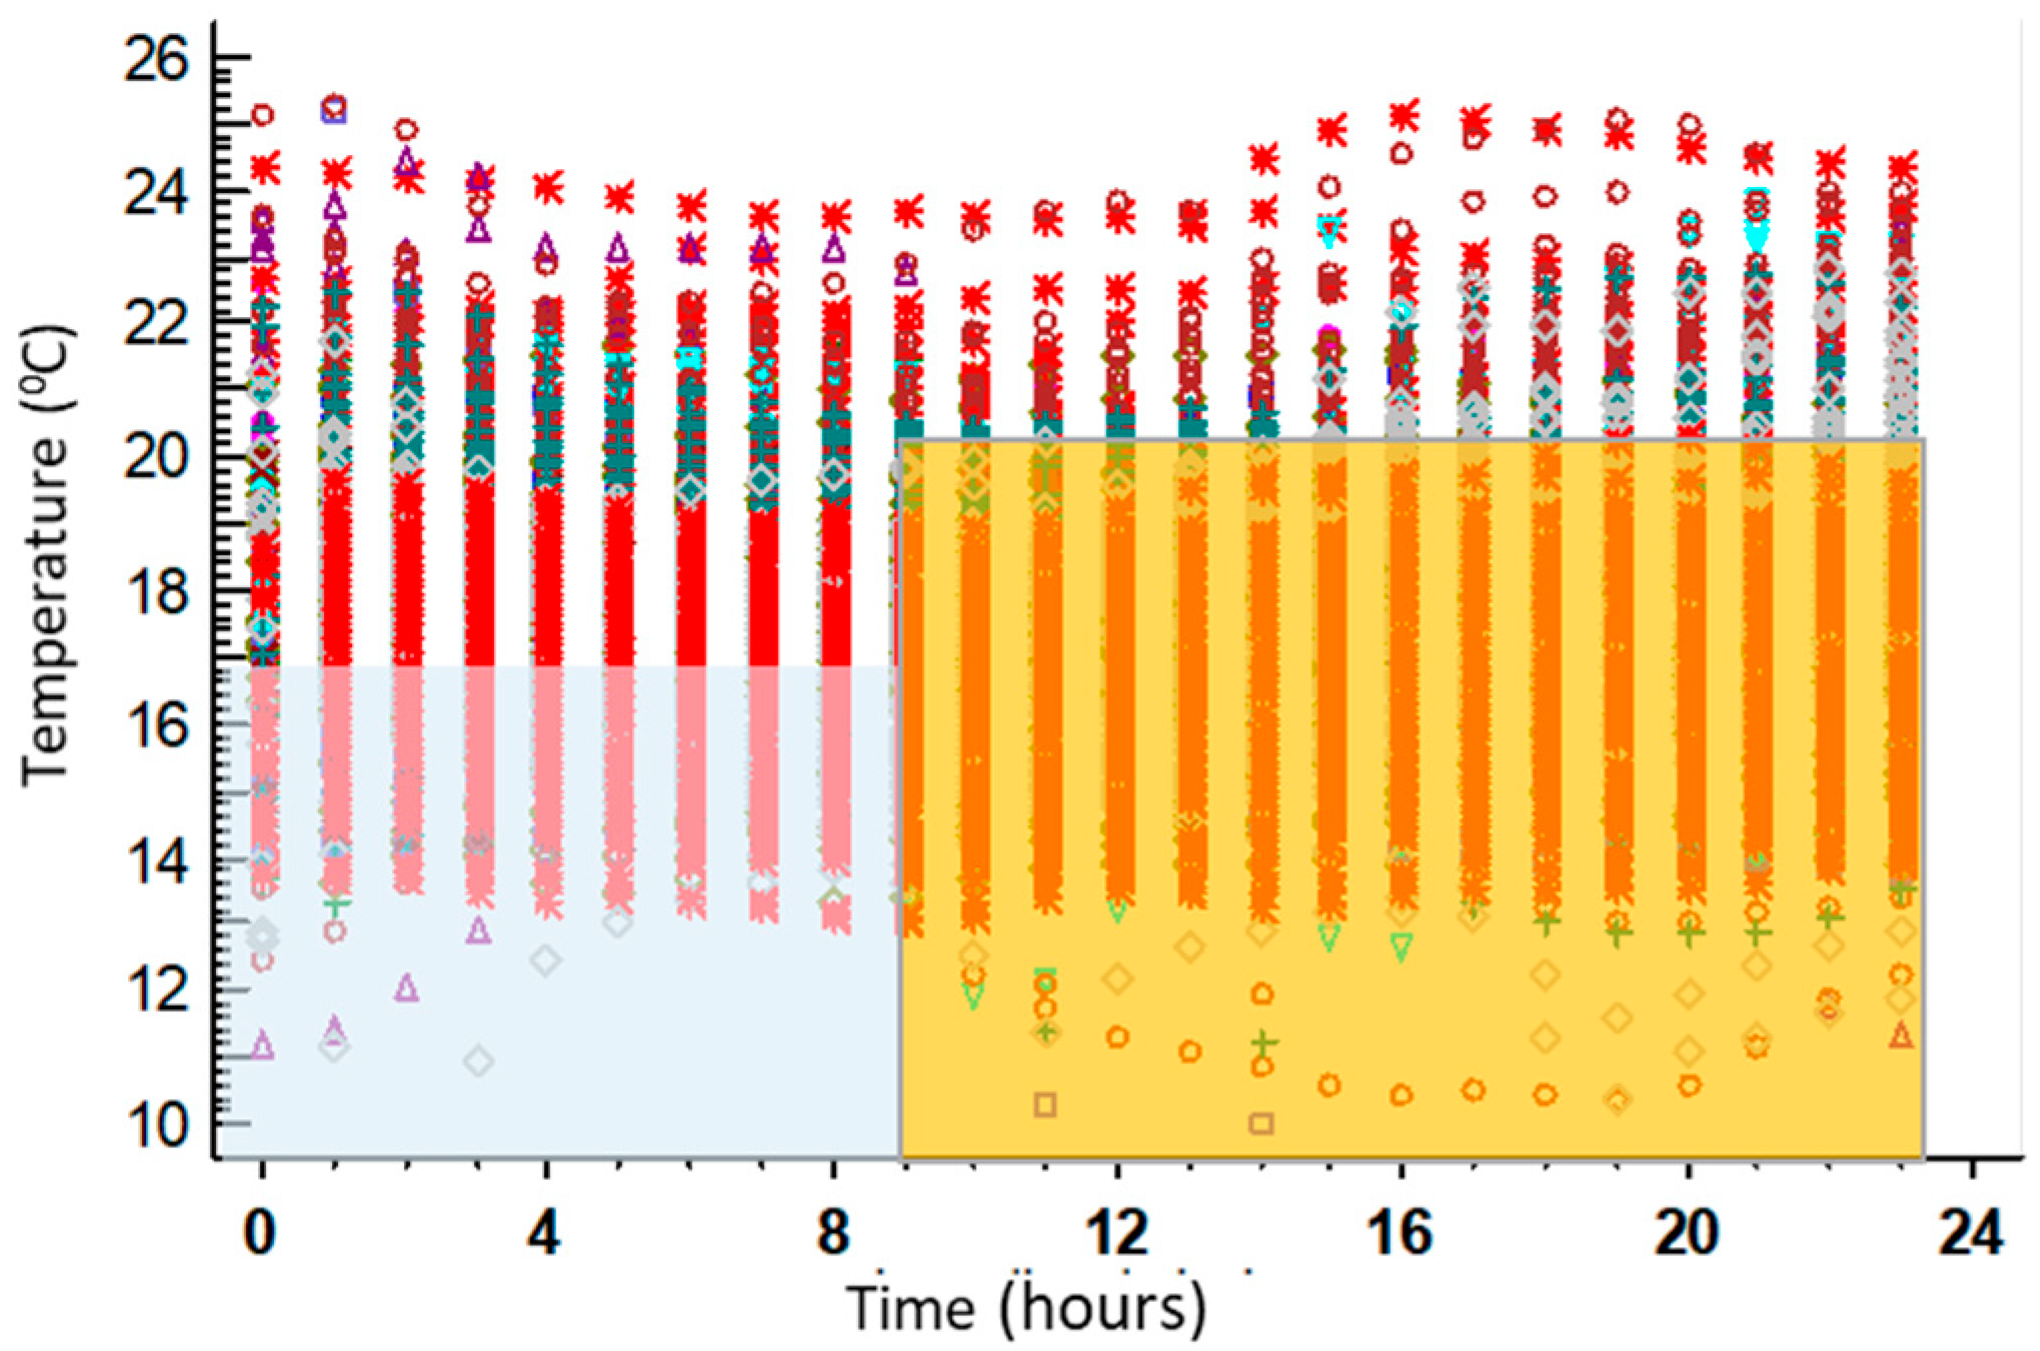
Figure 3 shows the evolution of daytime temperatures during winter for the post-1979 housing group, taking the setpoint temperatures (night and day) established as a reference to assess demand and the basic procedure for energy rating. Daytime variability and the difference in performance between dwellings are shown. The frequent presence of low temperatures should be noted, along with the high temperatures on warm winter days.
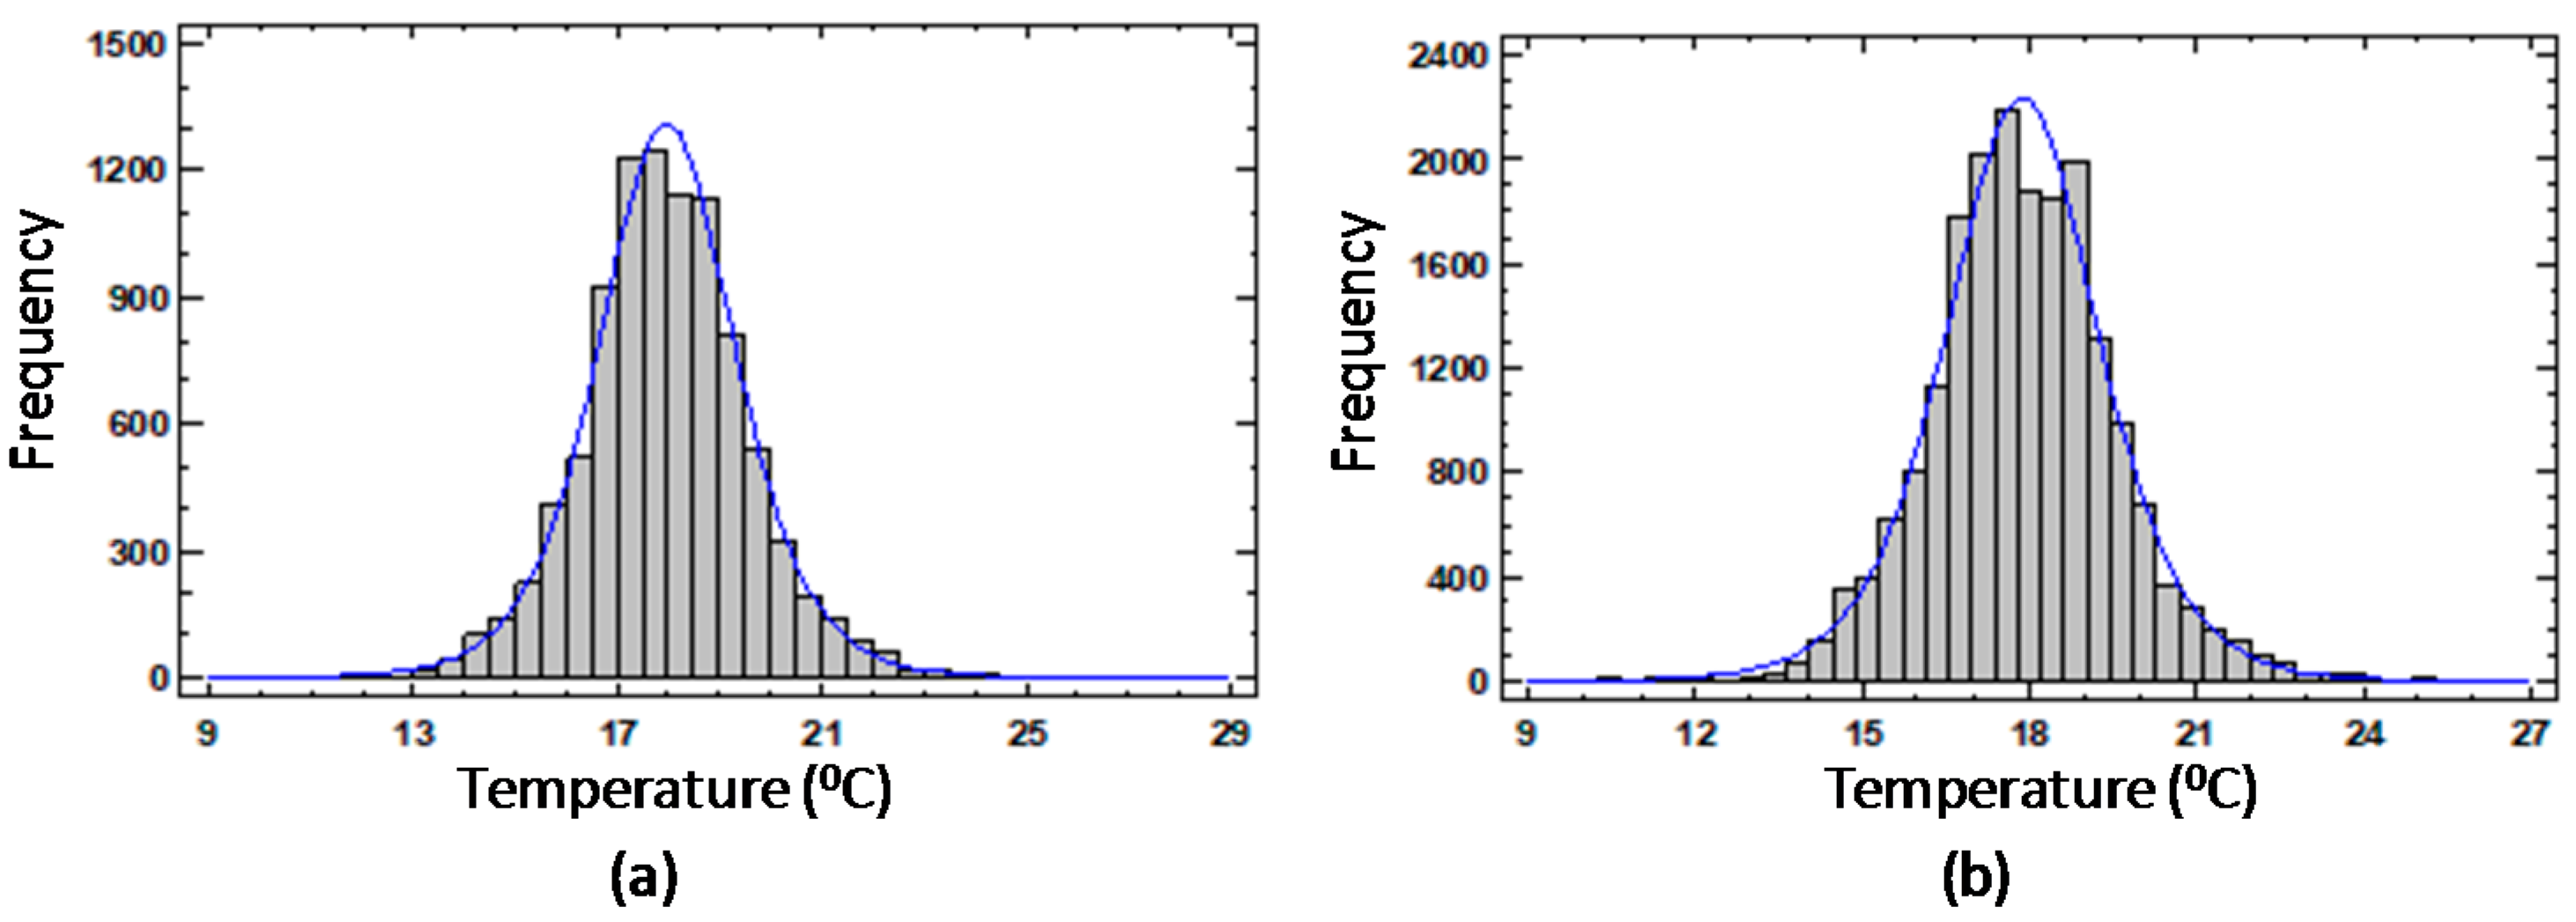
There is a probability of over 80% of temperatures below 20 °C, with a probability of over 60% for 19 °C, both during the night and day period. This is particularly significant compared to the usual standards of comfort. The basic procedure control base temperature is not reached for the rooms overall in more than 40% of the hours in this period (
Figure 4).
3.1.2. Summer
For an analysis of the summer months, the sample was divided into monitored dwellings with and without cooling systems, in order to compare user behaviour.
Figure 5 shows the evolution of daytime temperatures during summer for the post-1979 housing group, taking as reference the setpoint temperatures (three periods) established to assess demand and the basic procedure for energy rating.
Figure 5 shows how the heat accumulated during the day is dissipated during the night (fundamentally by means of night-time natural induced ventilation processes, without any sudden reductions being noticed) through the beginning of a new day, at which point the dwelling starts to accumulate energy again, therefore raising its temperature. In winter, as can be seen, the temperature down slope (discharge) during night time is more pronounced than the temperature ascent period (load), which is much more spread out over time. In this case, the action of the occupants is barely noticeable.
The current minimum temperatures in the dwelling are reached early in the morning, shortly before 8:00 a.m., with a mean value of 28.8 °C (SD = ±1.6 °C), at which point the temperature rises until maximum temperature is reached at the end of the day (29.55 °C about 10:00 p.m.) and begins to drop again. A turning point in the model can be observed around 4:00 p.m., when the temperature increase trend changes; this can be associated with the start of discontinued operation of the cooling systems, which modulate temperature increases despite the arrival of the external thermal wave.
These profiles indicate no continuous use of mechanics (cooling) systems, since the variations are slight between periods which are theoretically free-running and those when systems may be used. Moreover, as temperatures are very far from those expected in standards, the temperature measurement shows that cooling systems are used rather sporadically as a way of resolving peak moments of excess temperature.
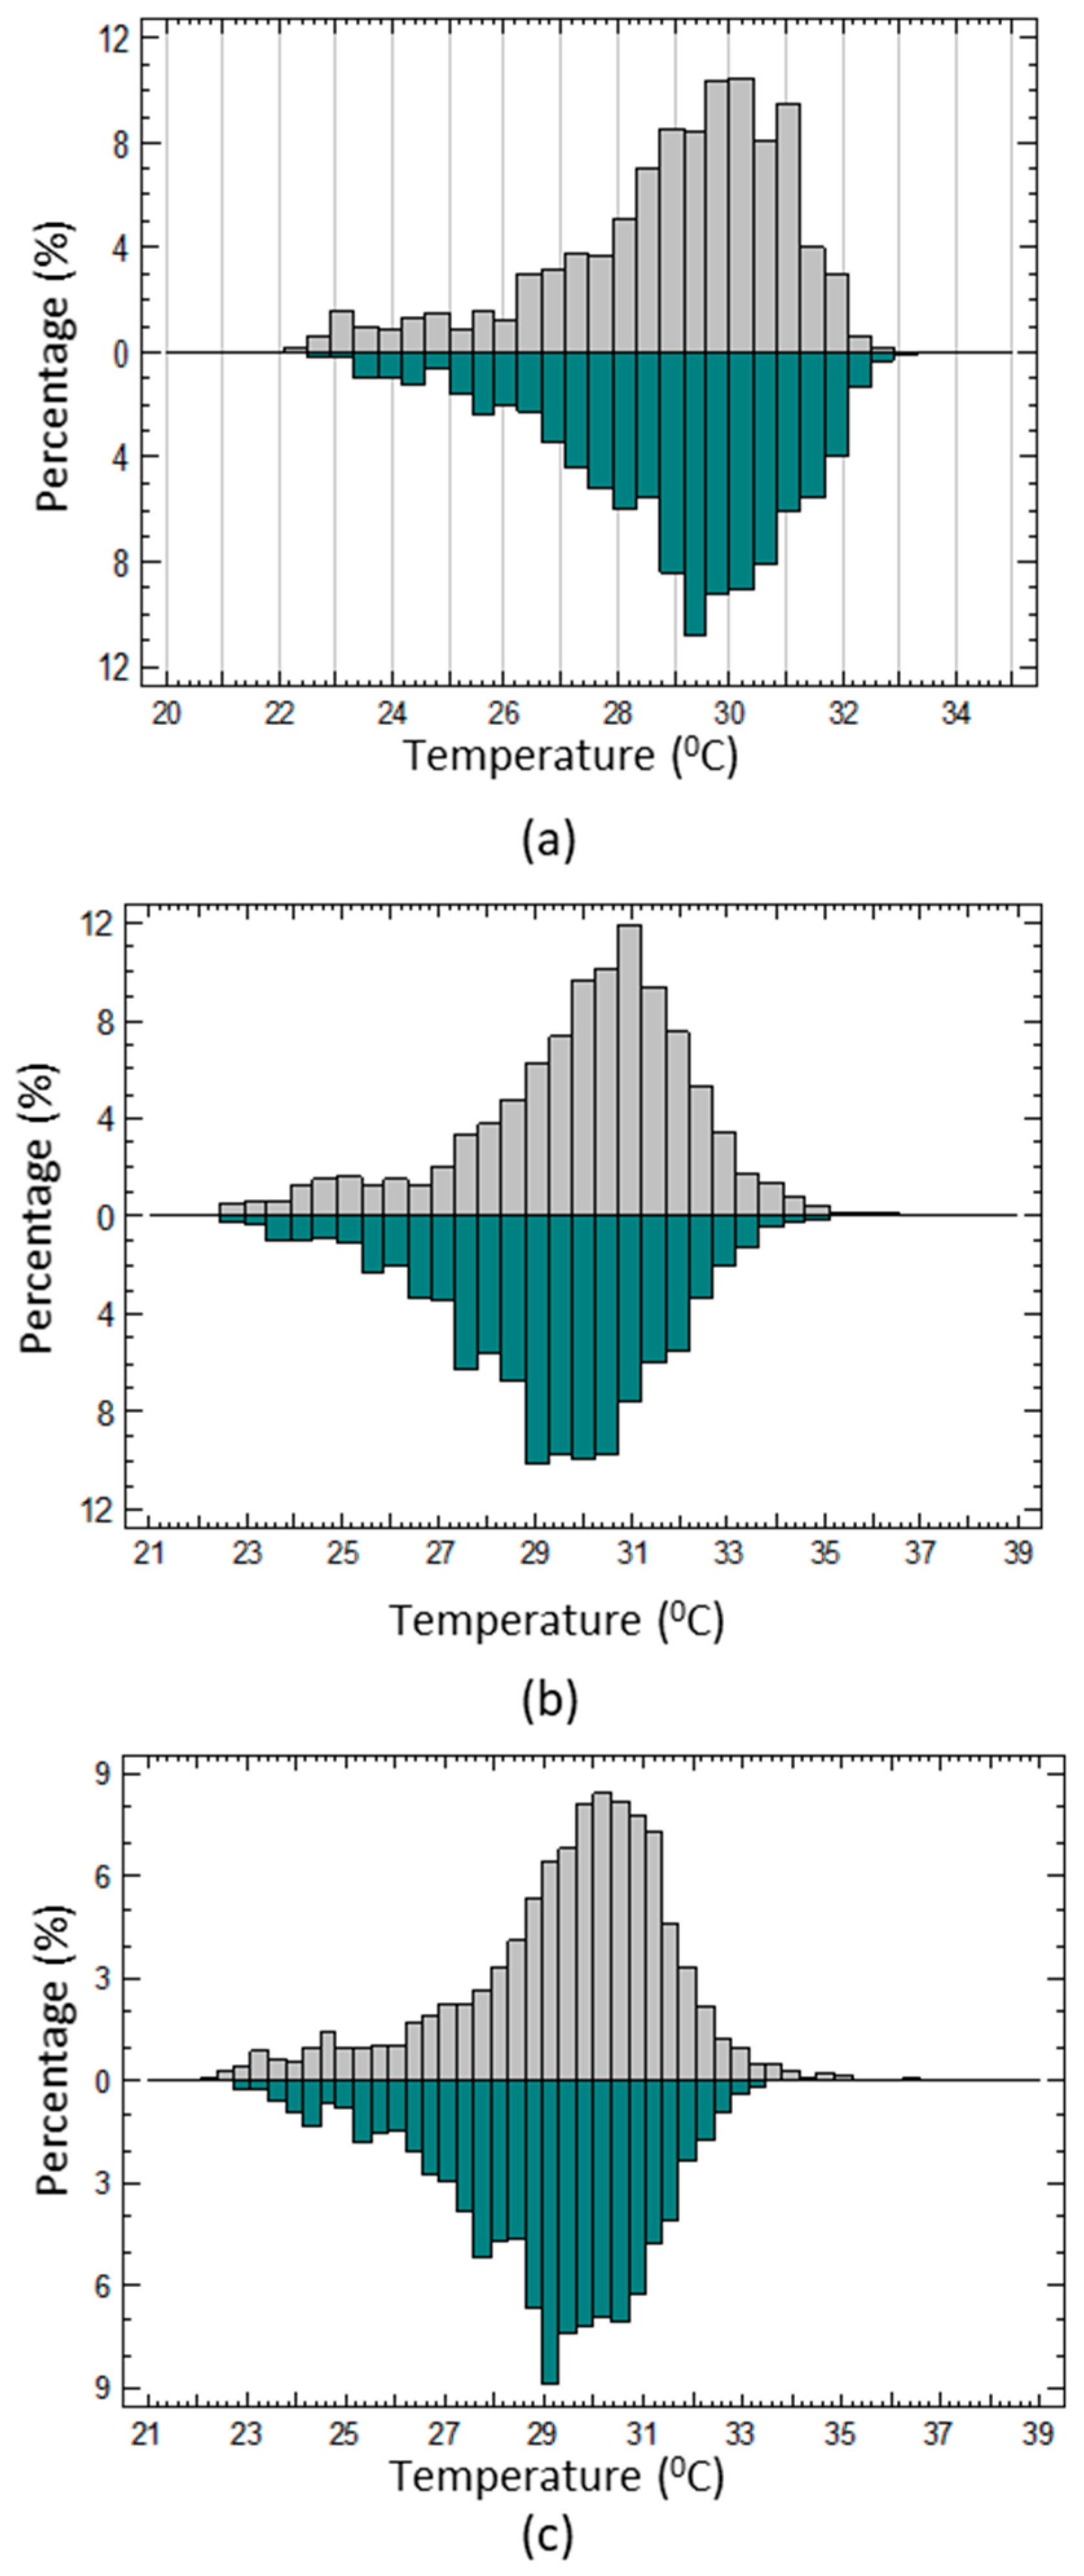
As regards the probability distribution for summer temperatures of the dwellings fitted with cooling systems, this shows how even though the dwellings have cooling systems in at least one of the rooms, the temperatures are generally high. In all of these, there is a significant presence of temperatures above 30 °C (generally occurring with a relative frequency of more than 50%), which indicates a very low intensity of use.
It should also be pointed out that the evening control temperature (25 °C) is exceeded in practically the entire period. In fact, in only a few dwellings is this probability around 5%, showing that it is not representative of the setpoints used by the inhabitants of the dwelling (
Figure 6—green).
The probability distribution for dwellings without cooling systems is shown in
Figure 6—grey. In this case, although the temperatures are also high, the difference between the different distributions (greater grouping than in the case of dwellings fitted with climate-control equipment) is smaller. 50% relative frequency is around 30 °C, and it is very rare for these dwellings to be below 26 °C (distribution curve inflexion). Exceeding 31.5 °C is generally infrequent for most rooms (90% of time below).
3.2. Pre-1979 Group Temperature
In this group, the analysis was developed for winter and summer models.
3.2.1. Winter
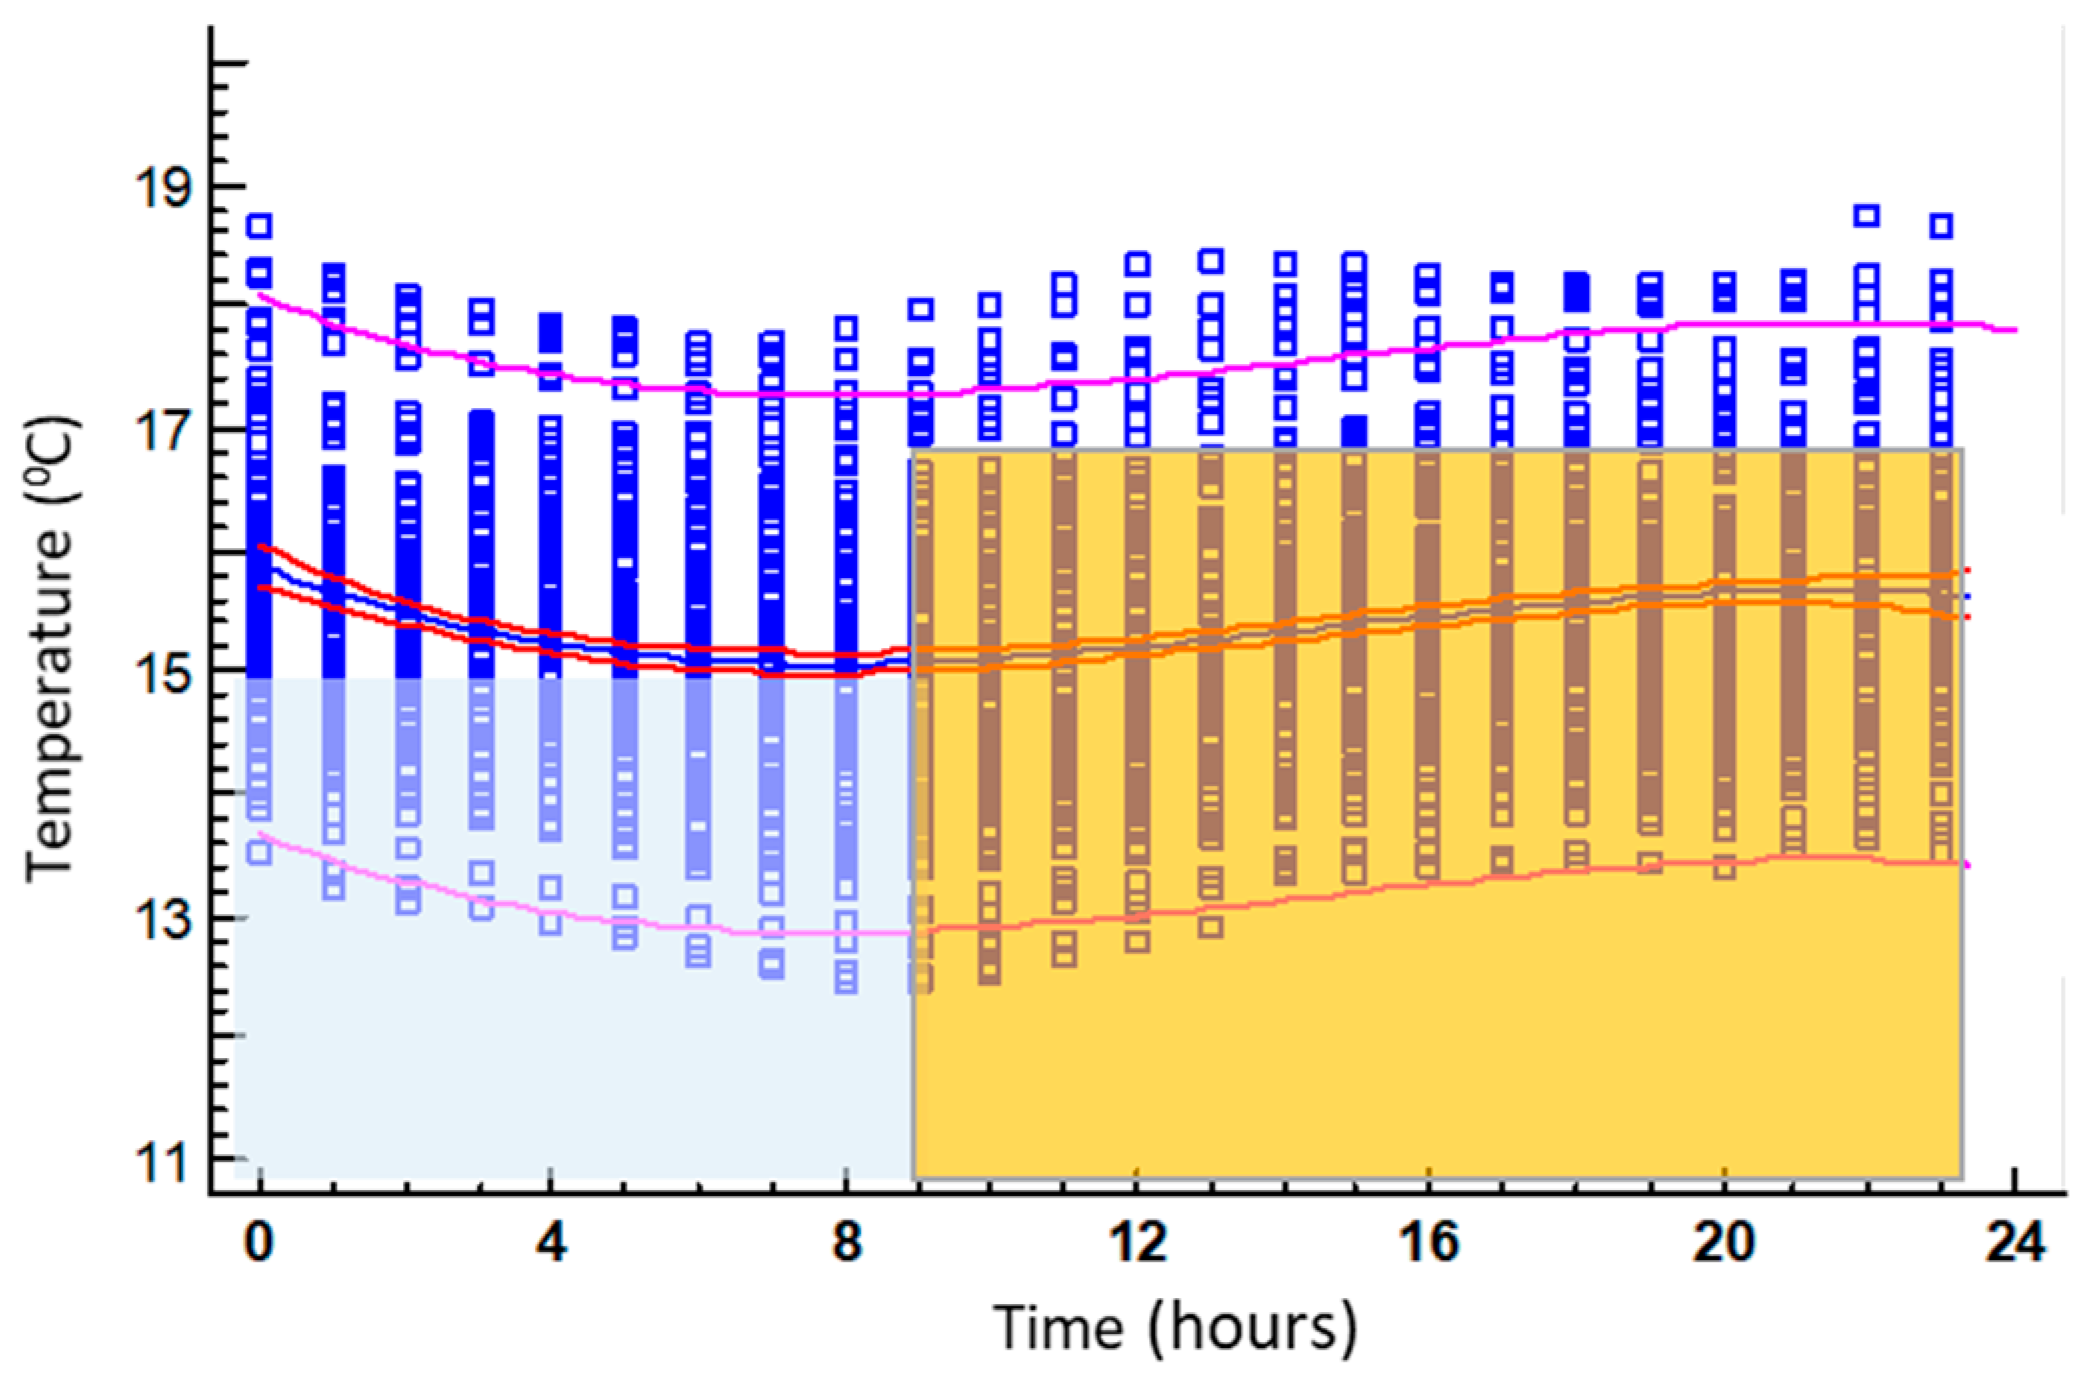
The evolution of daytime temperatures during winter for the pre-1979 housing group is represented in
Figure 7. The important presence of low temperatures (below 19 °C) during night and day should be stressed.
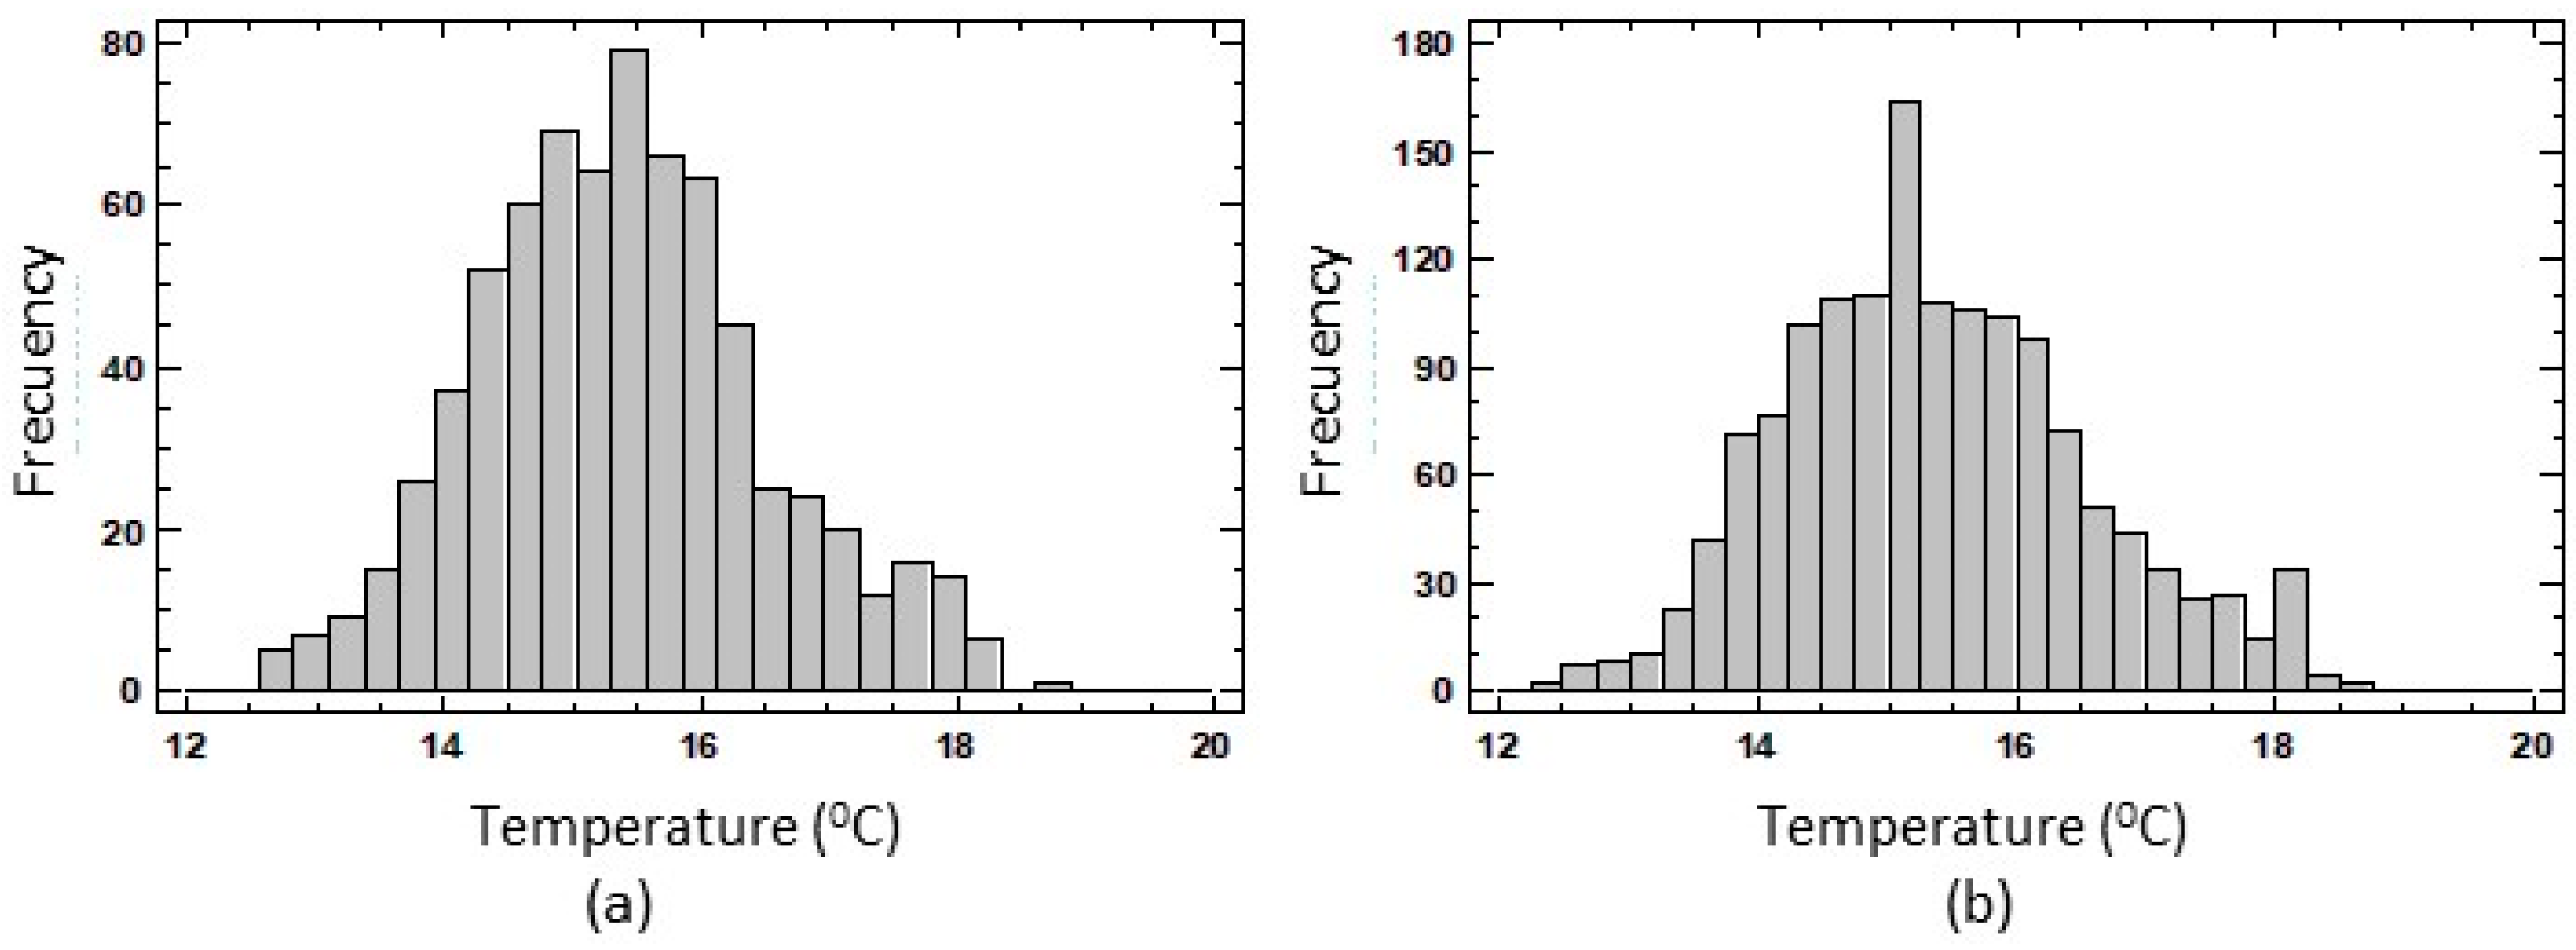
There is a 100% probability of temperatures below 19 °C, both during the night and day period, which is particularly significant compared to the usual standards of comfort. The basic procedure control base temperature is not reached for the rooms in the overall period (
Figure 8).
3.2.2. Summer
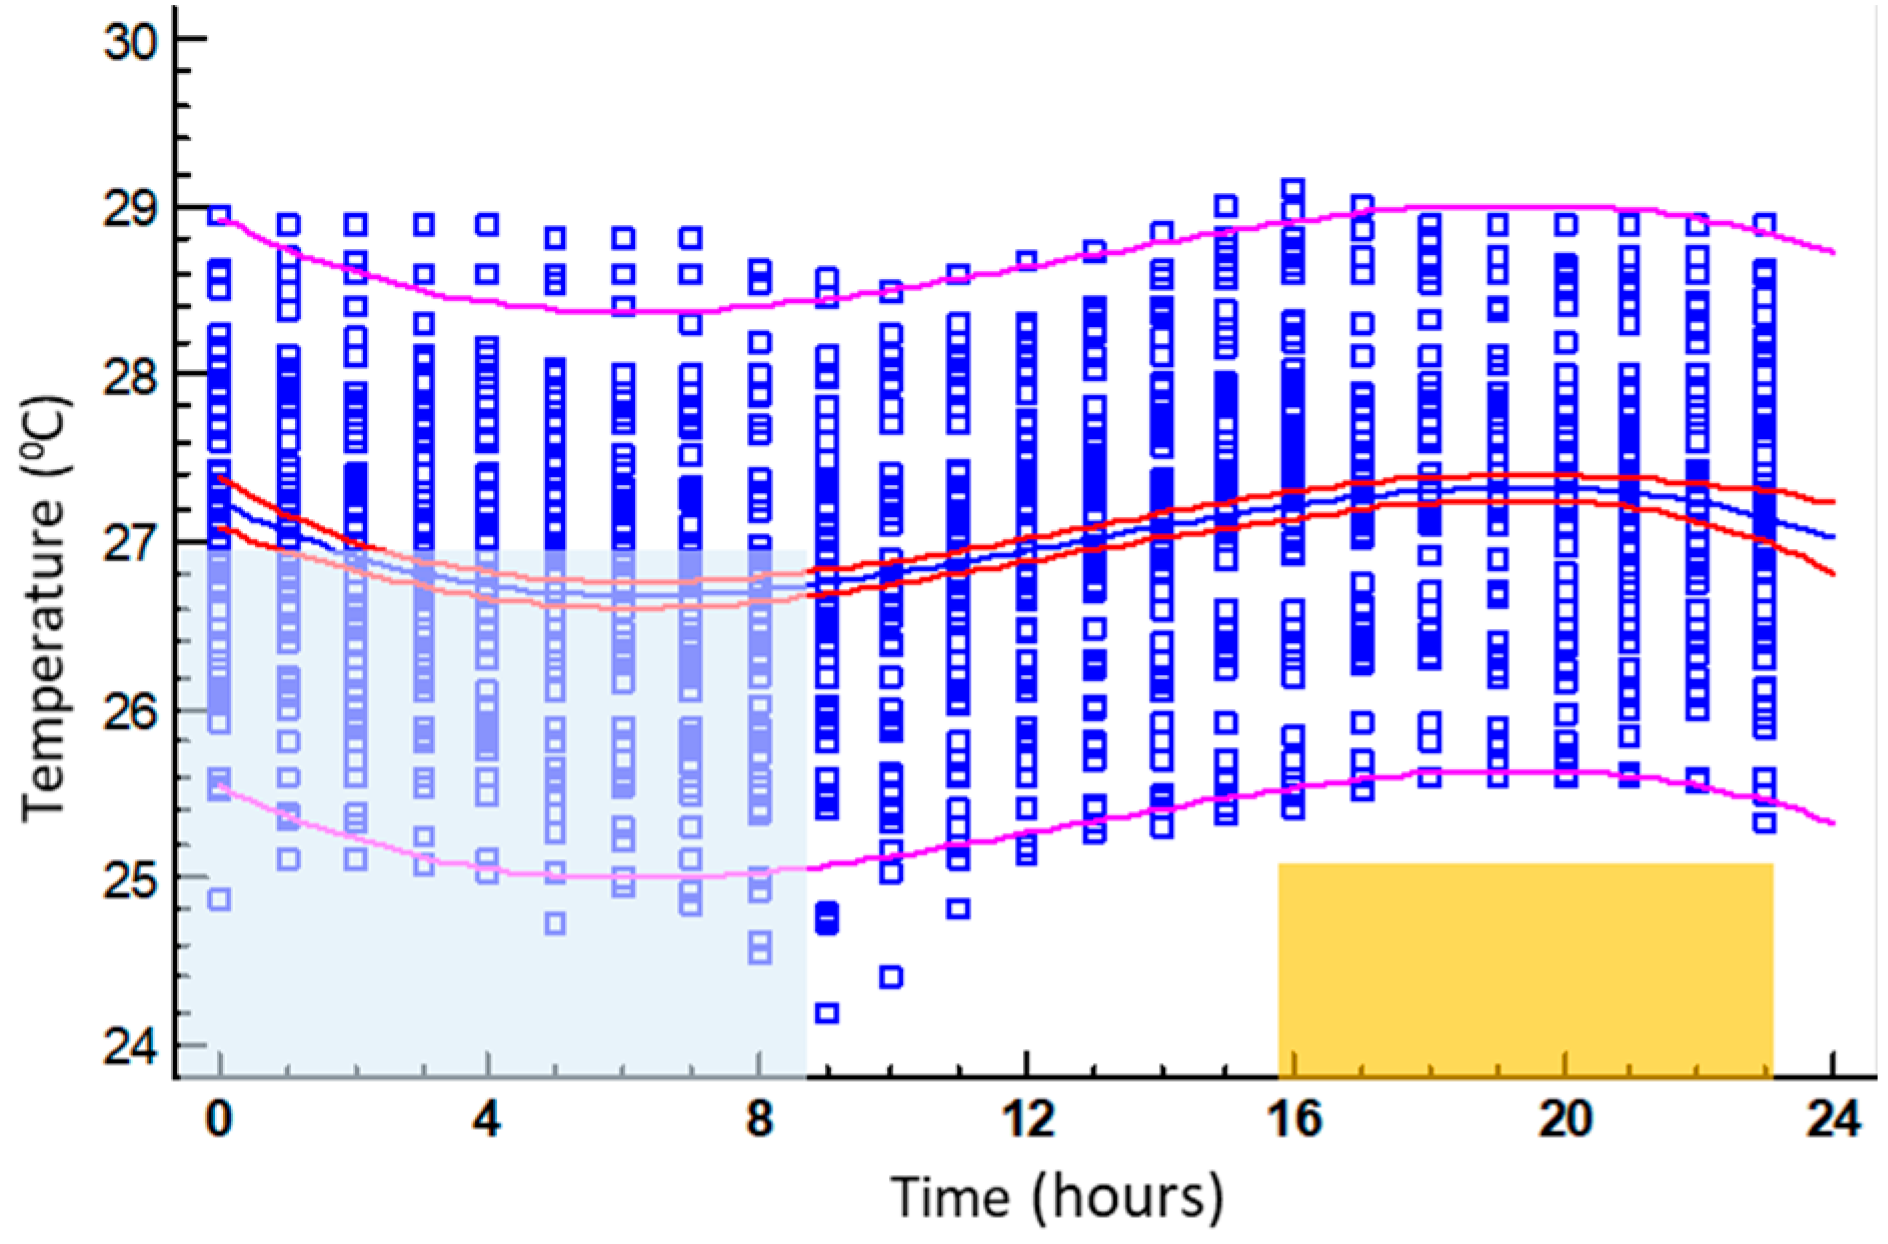
Figure 9 shows how the heat accumulated during the day dissipates during the night, similarly to the post-1979 group of dwellings, but with a lower mean temperature.
As in the previous group, the current minimum temperatures in the dwelling are reached early in the morning, shortly before 8:00 a.m., with a value of 26.7 °C (SD = ±1.4 °C); the inner temperature then rises until maximum temperature is reached at the end of the day (27.4 °C about 8:00 p.m.) and begins to drop again.
3.3. CO2 Concentration
In winter, bedrooms have CO
2 concentrations above 900 ppm for longer periods than living rooms. However, in the intervening season these percentages are reversed. In the summer, the concentration of CO
2 in bedrooms is diluted due to night-time ventilation (
Table 2).
3.4. Surveys on Patterns of Use of Thermal Systems and Ventilation
All the users surveyed admit that they implement passive control measures before starting up the climate-control system. In order of preference, the most popular options for winter were closing all doors and windows, followed by wearing warm clothing, turning on an auxiliary heater, and finally, turning on the main heating (only 35% of those surveyed). In summer, the most popular options were wearing light clothing and—depending on the outside temperature—opening doors and windows or turning on an auxiliary fan before starting up the cooling system.
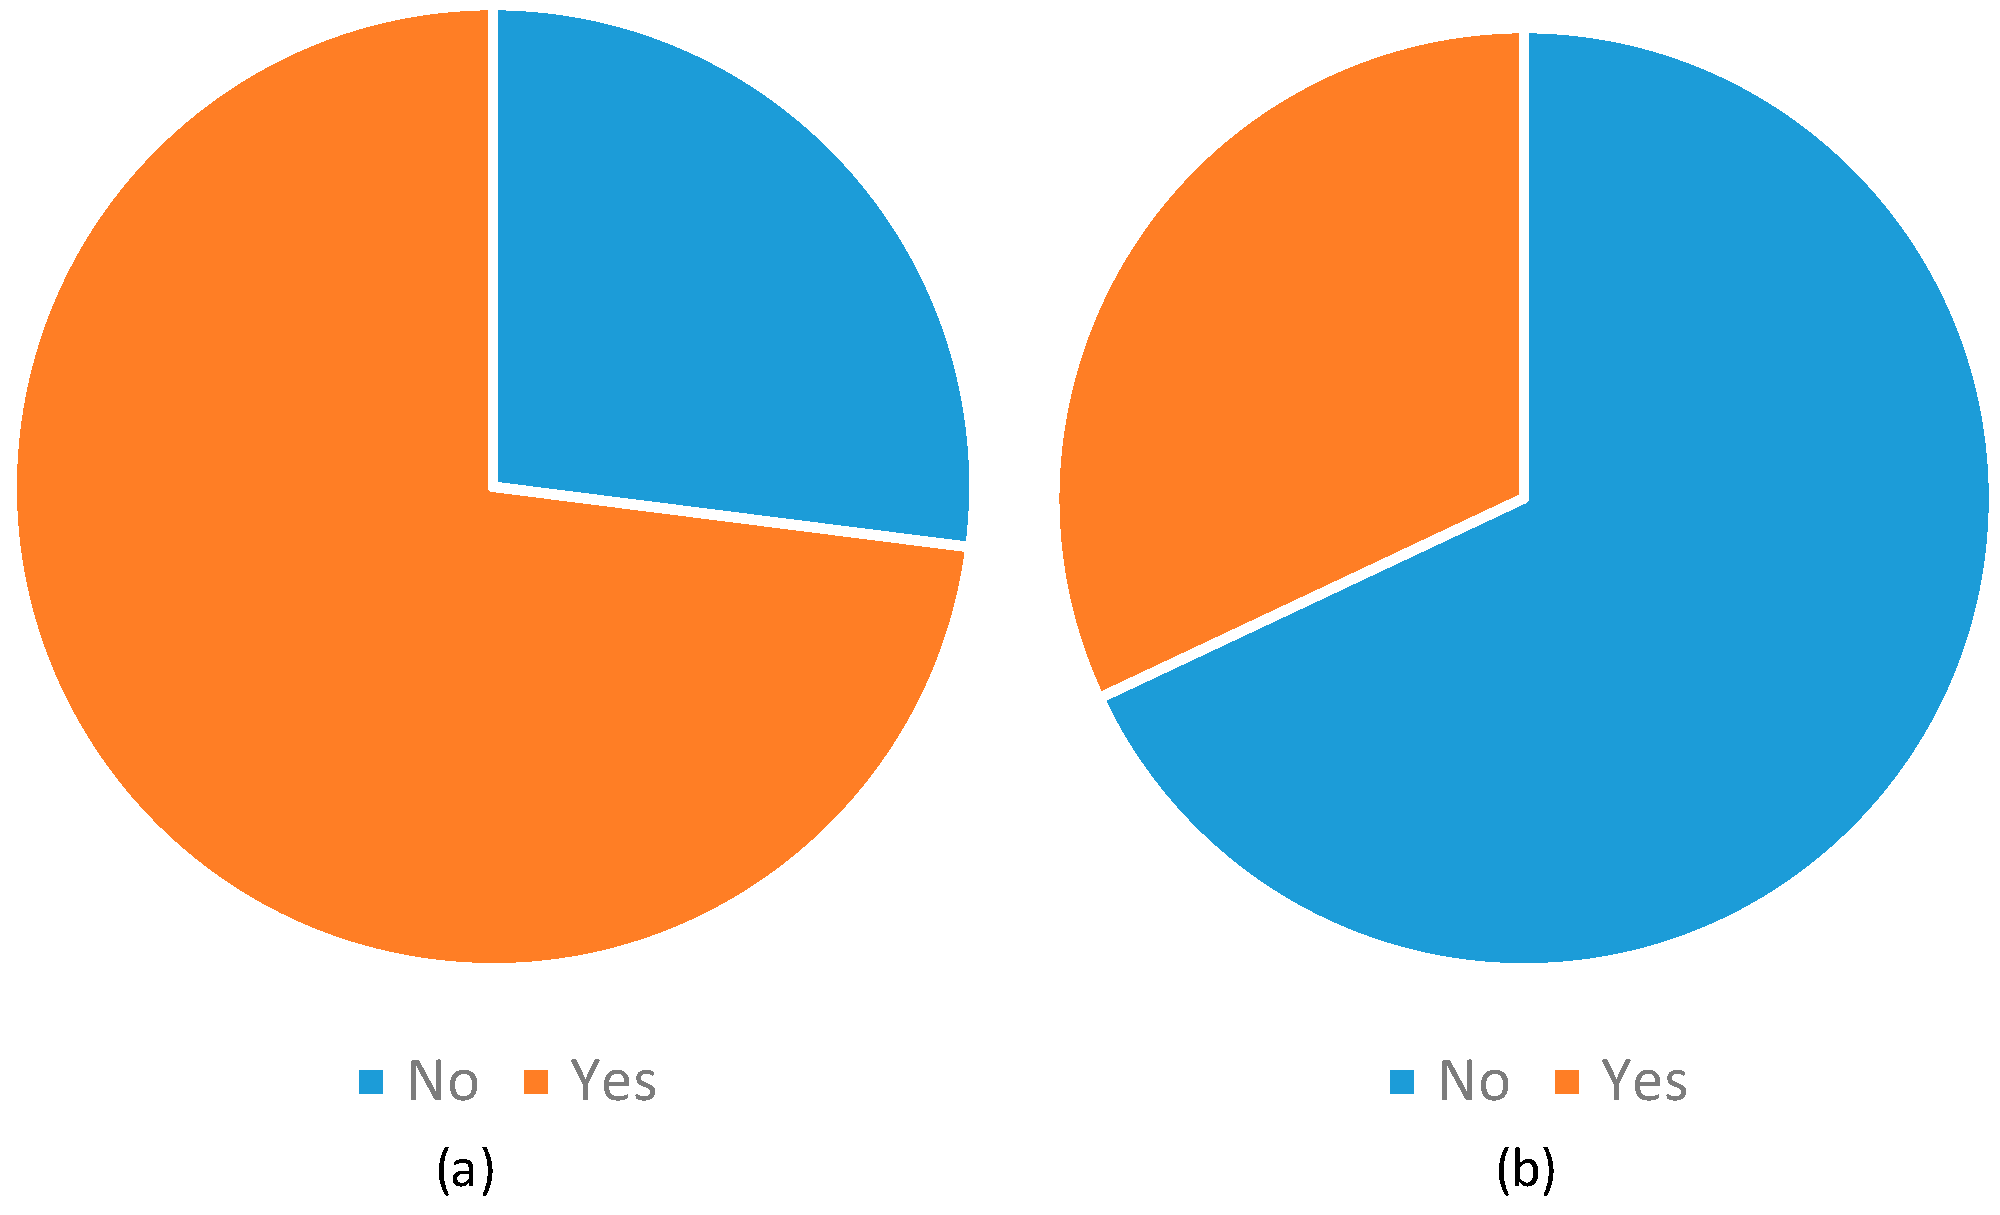
Figure 10 shows the presence of active cooling systems in the dwellings surveyed: 27% of dwellings have no cooling system, while 68% have no heating system.
Taking into account the completed analyses, it could be expected that the installation of thermal conditioning systems in the social housing of the study period would essentially be local—that is, heating units which treat a single room or can be moved about in many cases capable of being used in several rooms in the dwelling. These heating units run almost exclusively on electricity for thermal treatment of the dwelling. In addition to these prototypes, there are dwellings with no form of heating (or heating so insignificant that it is not declared) or with a single unit for the entire dwelling, generally a split heat pump system.
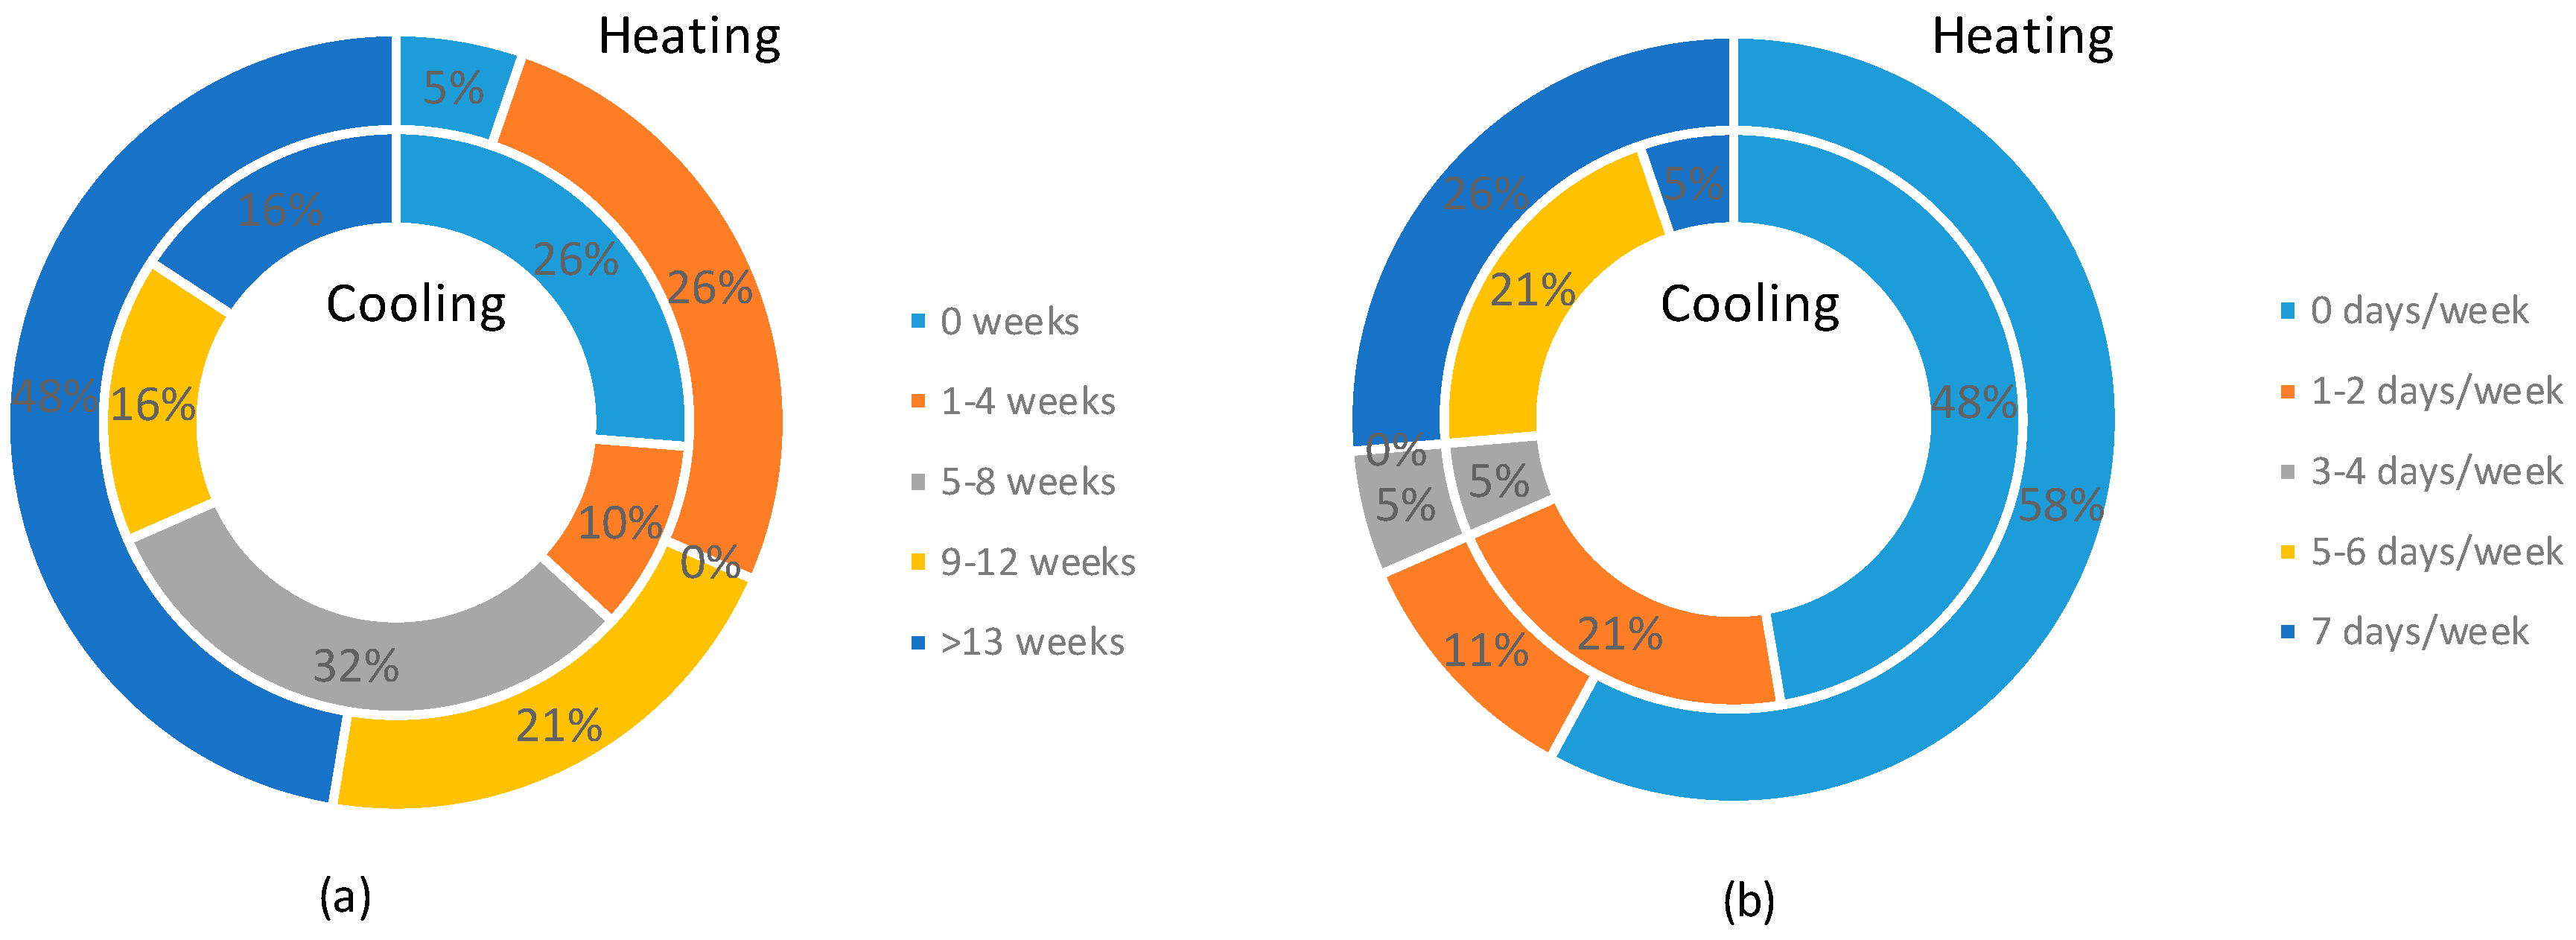
Figure 11a shows the number of weeks a year in which heating and cooling systems are in use. Here it can be seen that the heating system is used for longer than the cooling system. 5% of users surveyed admit to not using any type of heating system, compared to 26% who do not use the cooling system on any day of the year. 48% of respondents use the heating system for more than 13 weeks a year, compared to 16% for cooling.
Figure 11b shows the use of climate-control systems at night during periods of extreme temperatures in winter or summer. 58% of respondents said they did not use night-time heating, while 48% did not use the cooling system. 26% of respondents said that they turned the heating system on at night every day of the week at the coldest times of the year, while in summer only 5% use cooling every day, with 21% admitting to using it almost every day.
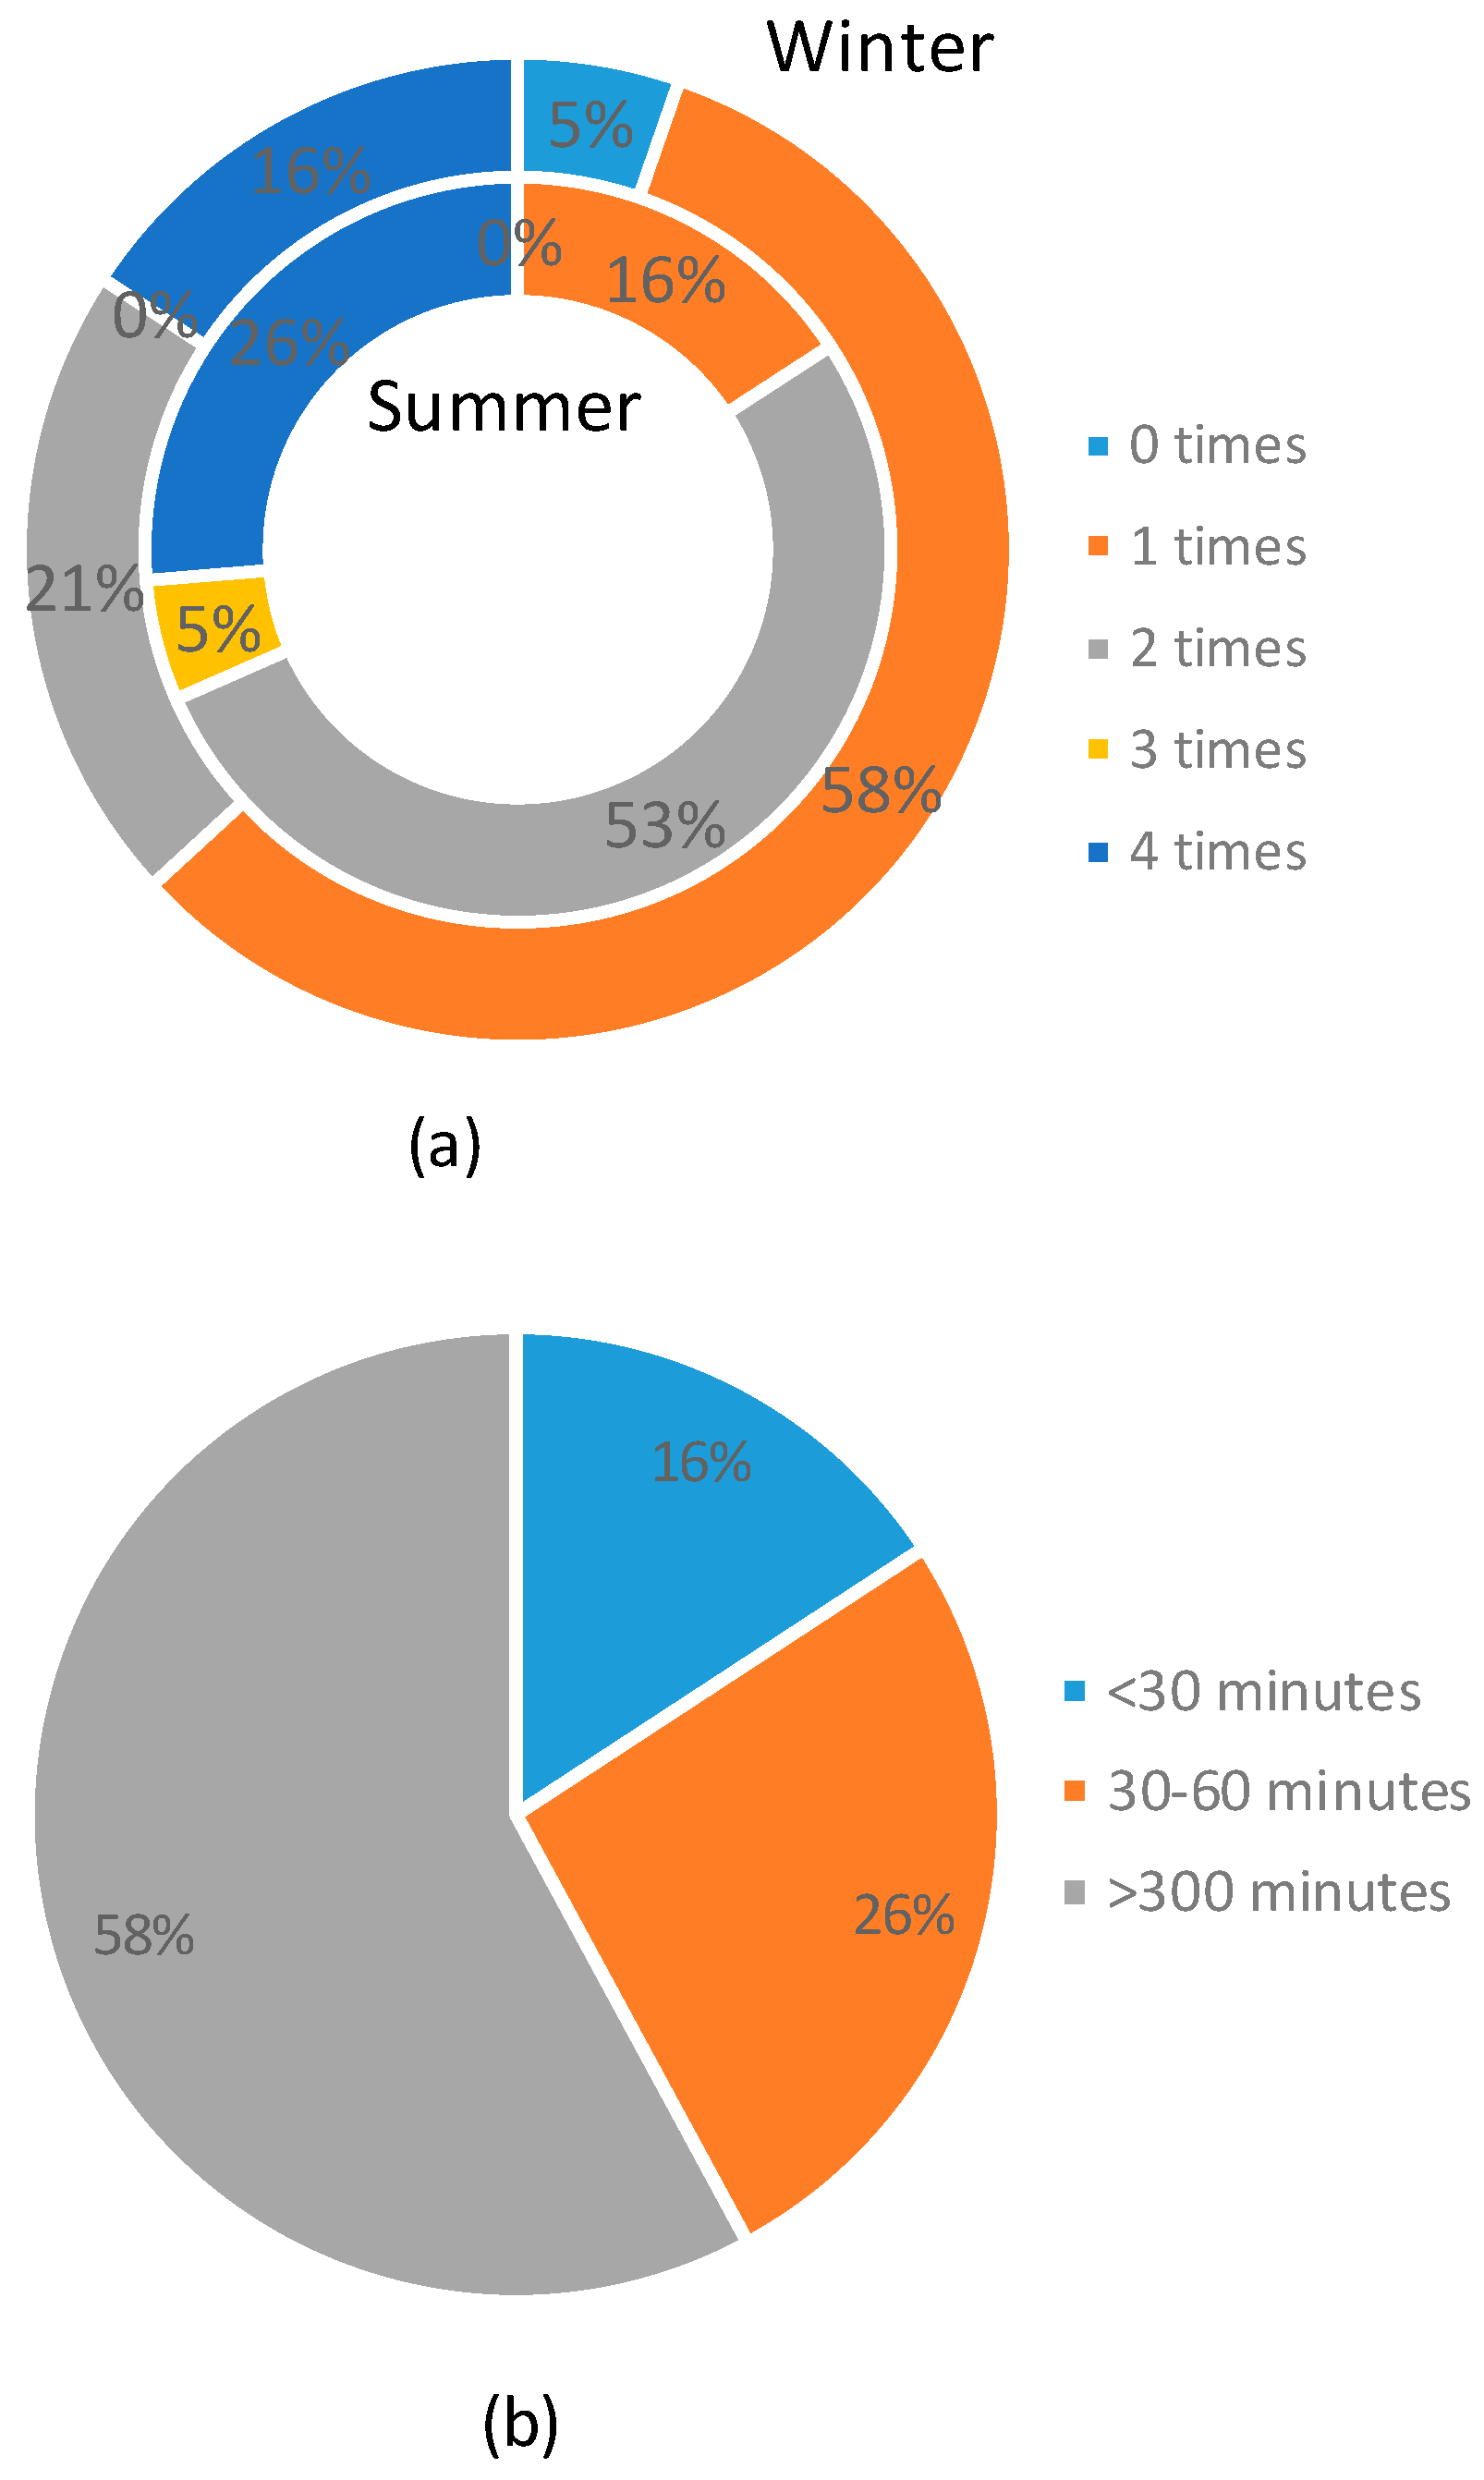
Figure 12 represents variability in the ventilation habits of users of the dwellings during the summer and winter seasons. In winter, only 5% of respondents answered that they do not ventilate their home, with the most frequent responses (58%) being that they ventilate their home once a day, followed by twice a day (21%) and four times a day (16%). However, ventilation generally takes place in very short periods, with 67% of respondents stating that they ventilate for less than 30 min overall (
Figure 12b), generally between 8:00 a.m. and 10:00 a.m.
In summer, the most frequent response is that they ventilate the dwelling twice a day (53%), although the daytime ventilation period is much longer than in winter (
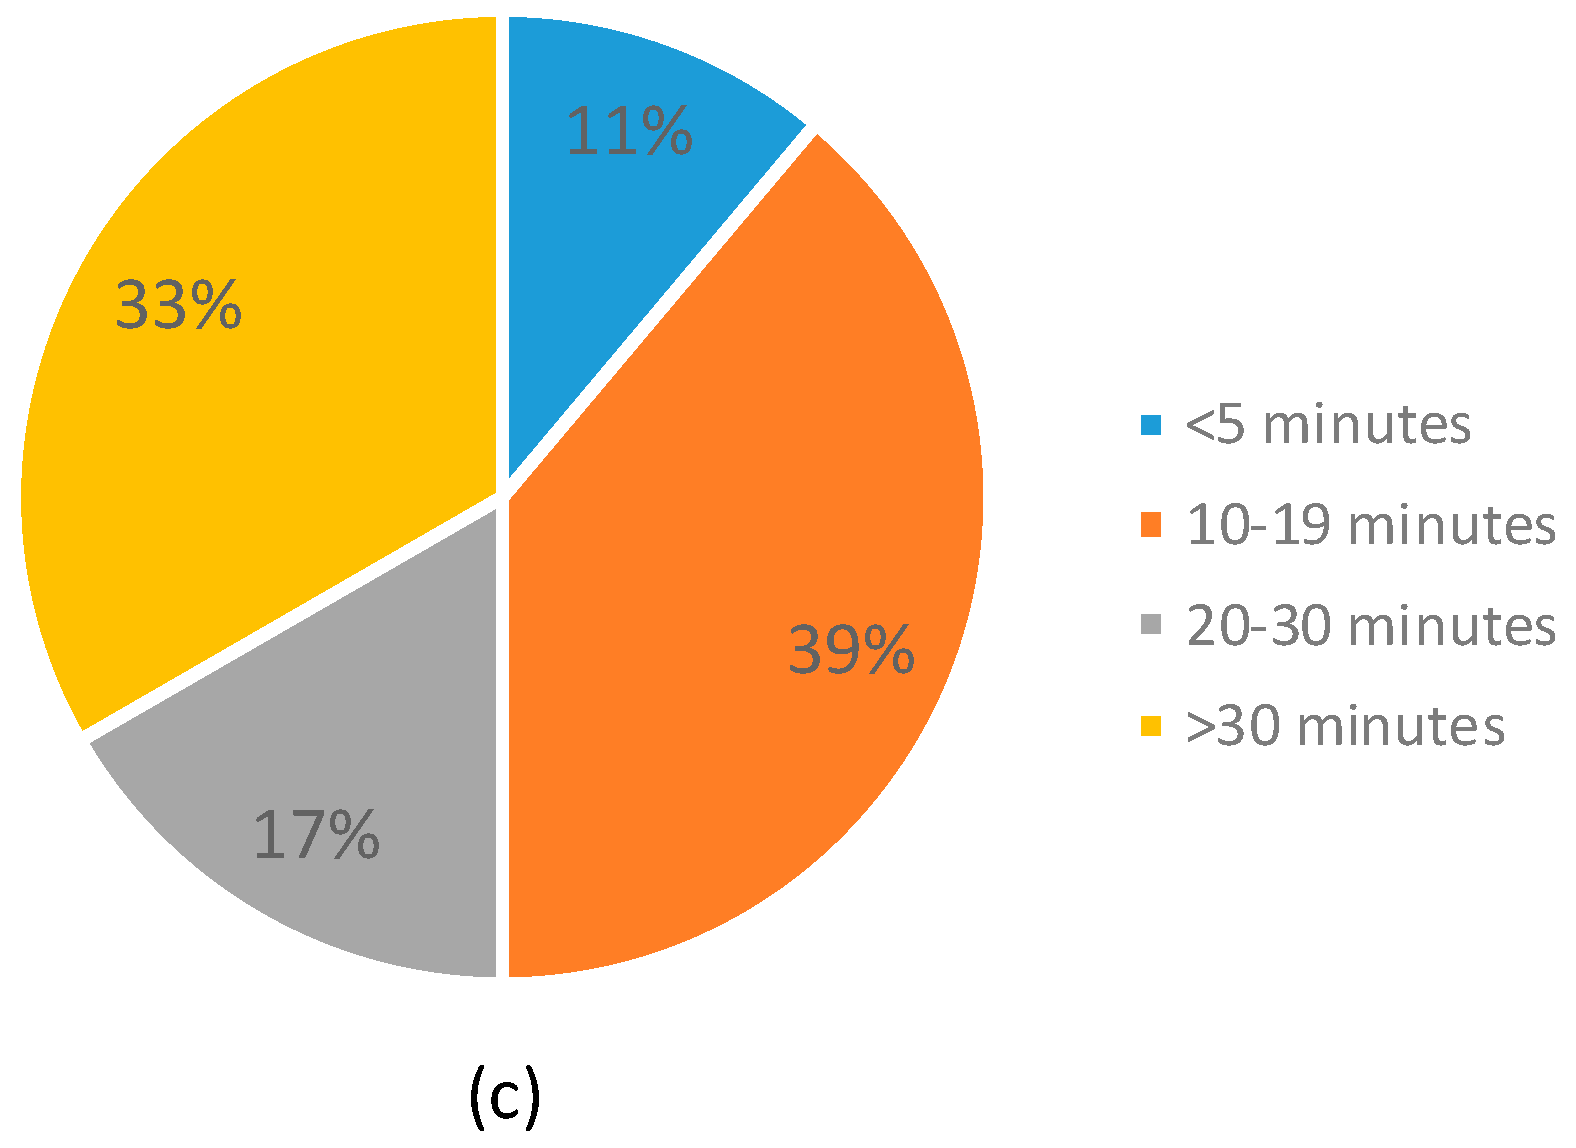
Figure 12c), with figures showing that 58% ventilate more than one hour and 26% more than 5 h. The times for ventilation are early in the morning and at dusk, with night-time ventilation removing the need to use cooling systems.
During the cold season, there is a low ventilation level of the dwelling, both voluntary and natural. This situation, which is critical to ensuring indoor health conditions, is associated with the following factors: reluctance to make openings in walls for ventilation due to inability to deal with the associated thermal load; absence of mechanical equipment which ensures air renewal; relatively high airtightness of the dwelling (when the window frames have been replaced); and low infiltration capacity to bring about the renewal of the indoor atmosphere.
In contrast, during summer the dwellings are generally over-ventilated (as a passive thermal control measure), which hinders the envelope from moderating the energy, while the absence of general cooling systems causes an increase of the mean temperatures above comfort values (adaptive comfort strategies can be applied in certain periods of time, outside the most extreme conditions). This situation mainly affects indoor comfort conditions, although the existence of repercussions on health cannot be neglected. In summer, the post-1979 group is two degrees worse than the pre-1979 group.
4. Discussion
4.1. Thermal Conditions of the Homes
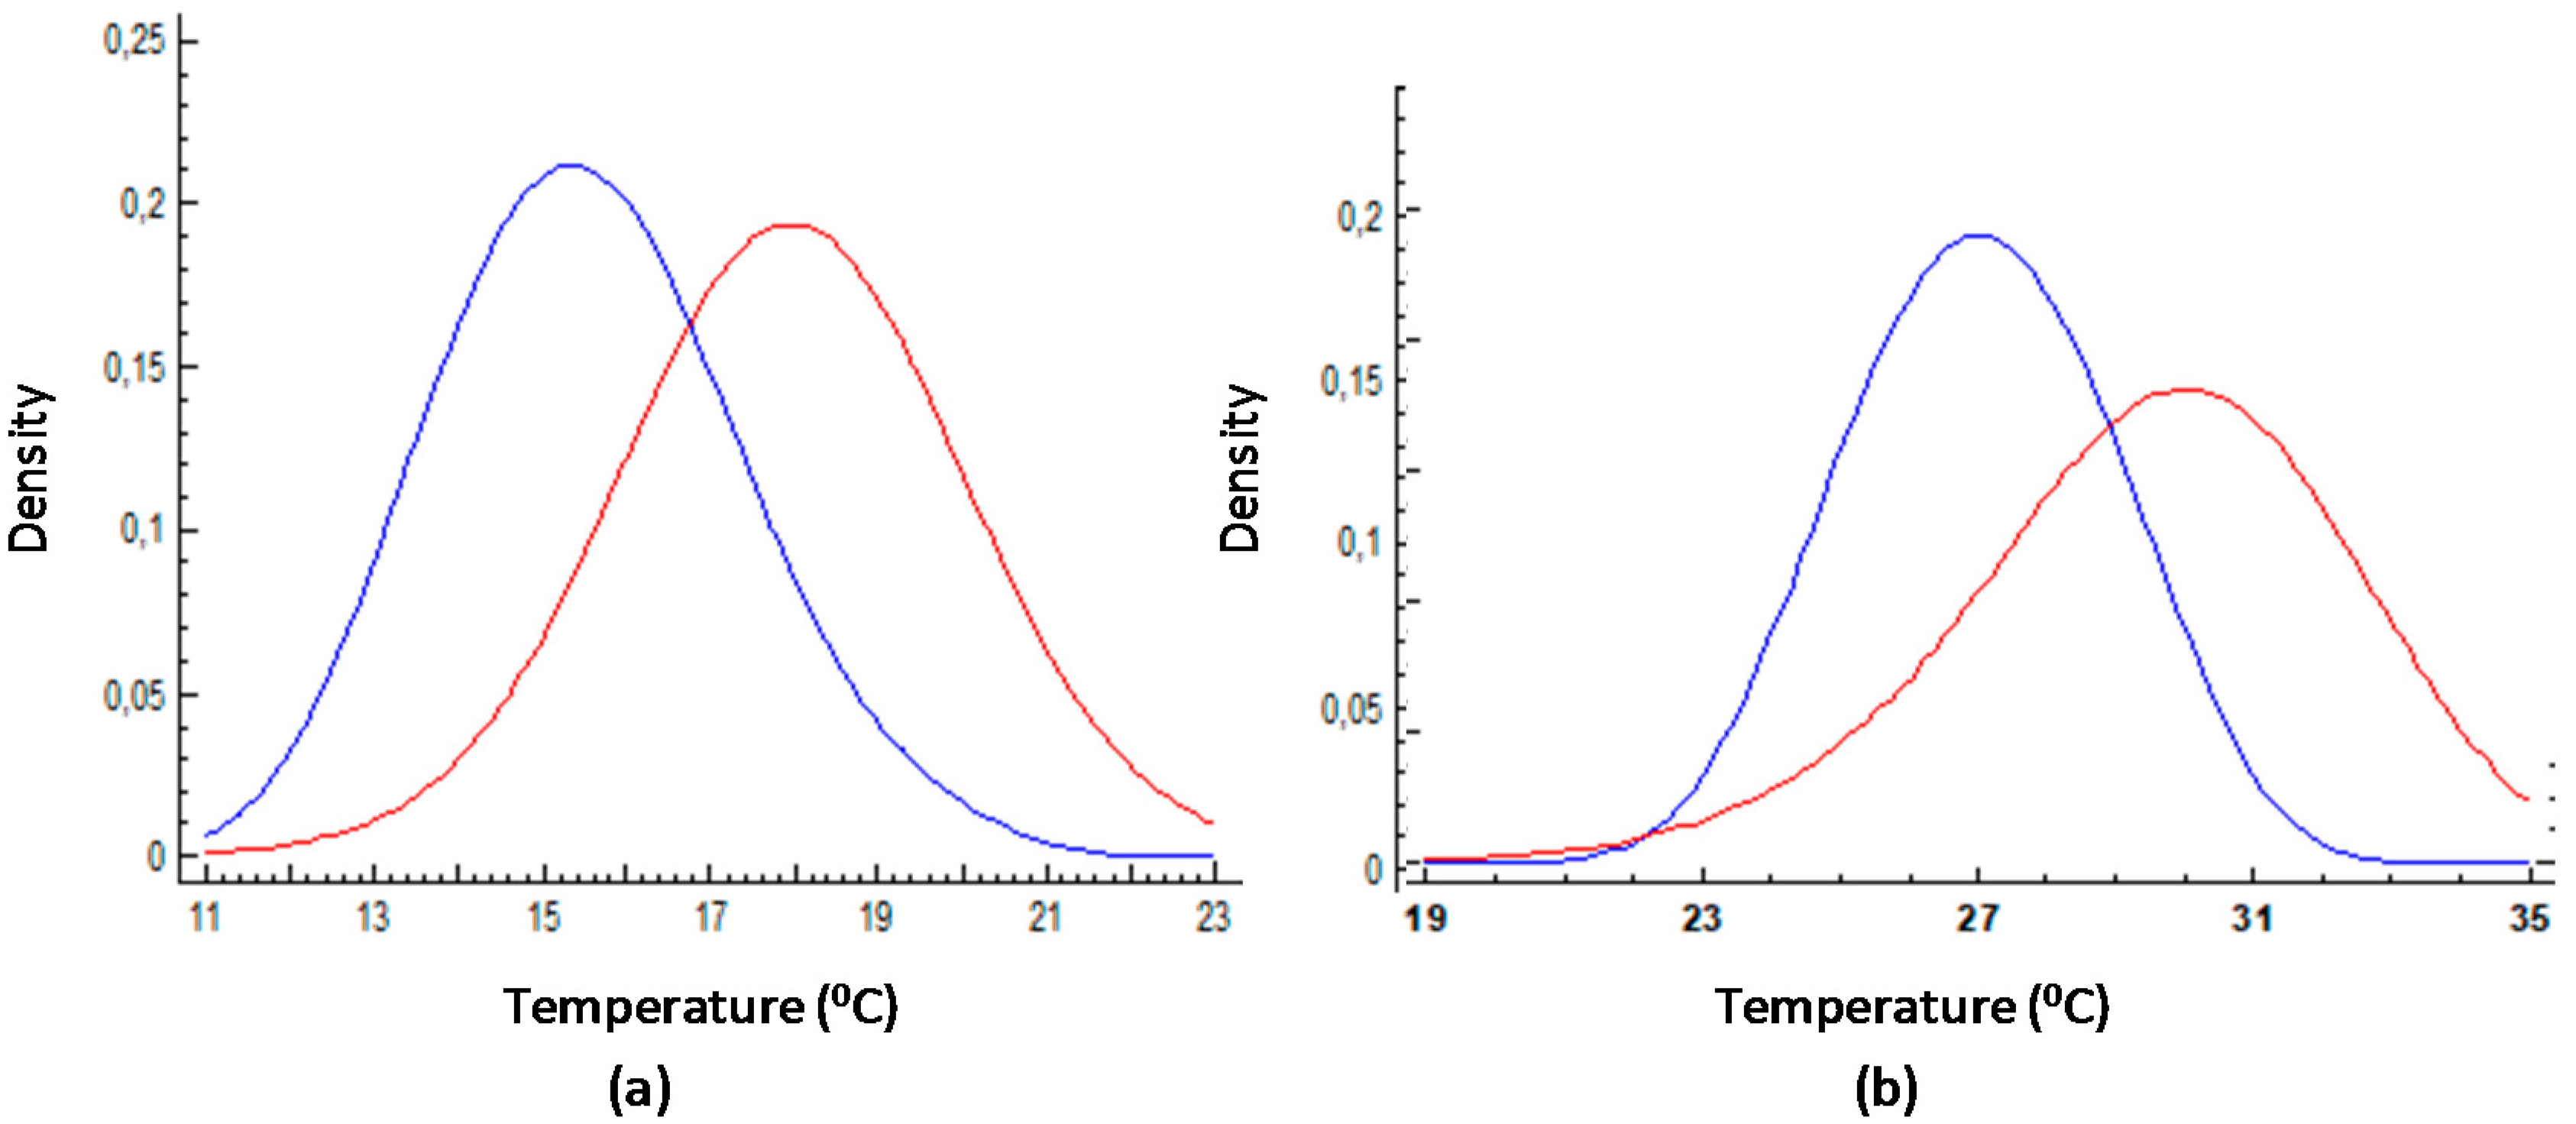
The post-1979 homes could be classified as warmer than those built prior to the year 1979. The mean temperature values in the latter are always lower, and, in general, tend to present a more stable performance with temperatures grouped around the central values. This is especially true in the case of the oldest designed property, which shows the lowest standard deviation of values for the daily period (
Figure 13).
It should be noted that the values of the properties in the pre-1979 group (the oldest) are stable but far from comfort values in winter, and despite the local action of portable heaters and similar equipment, both mean and common indoor temperature values show a huge gap in relation to desirable comfort conditions (this limit can be set for values above 20 °C). However, the post-1979 group dwellings are insulated and are equally incapable of providing a general comfortable environment, with similar intermittent action of the local heating equipment, although the difference is almost half compared to the other group.
The variability of temperatures during the winter can be seen in the higher variation ratios in the post-1979 group, and in connection with this, the temperatures of the exterior values of the thermal distribution are more extreme than in the pre-1979 group, as they undergo wider indoor thermal oscillations than pre-1979 group. This is especially noticeable in the case of the oldest housing of the pre-1979 group (case 1), with a narrower temperature distribution band. Although temperatures remain cooler, they stay above a point which is commonly surpassed by the other properties analysed.
In summer, the post-1979 group dwellings are particularly warm, providing little thermal buffering in relation to the outside, with mean temperatures far from comfort values, both for mechanically conditioned rooms [
36] and for the values proposed for natural ventilated buildings [
37,
38]. In the group of dwellings without cooling systems, large-amplitude daily waves result in high indoor temperatures which often surpass 30 °C.
This situation is mitigated, albeit only slightly, by the intermittent action of cooling equipment in post-1979 group dwellings, limiting daily oscillation to half that of properties with no cooling equipment, and preventing the model temperature from exceeding 30 °C. In both cases, night dissipation capability is small and cannot reduce mean temperatures below 29 °C. However, homes in the pre-1979 group, despite having no cooling systems, show a more stable performance with values typical of cooled spaces, generally within values suitable for adaptive or passive comfort [
11]. Daily amplitude is similar to that for the control values with cooling equipment. In the pre-1979 group, night dissipation acts quicker and with greater effect than in the post-1979 group case, allowing homes to reach indoor temperatures around 26 °C at the start of the day.
4.2. Habitability of the Indoor Environment
The dwellings in the study group—social dwellings pre-dating the incorporation of general insulation requirements—are far from the indoor parameters usually set as comfortable for mechanically conditioned spaces, and are often even outside of ranges defined for adaptive comfort strategies for naturally ventilated buildings (focused on passive mitigation of thermal excess, but poorly suited to heating needs). It can therefore be established that the occupants are exposed to unsuitable or even unhealthy habitability conditions for extended periods of time.
This situation occurs mainly during winter, when a convergence of circumstances negatively affects the indoor environment of this housing stock:
Increase in the time spent in the property during the cold season. This leads to greater exposure and increased interior vapour production bound to activities in the home (metabolic and functional).
Low mean indoor temperatures in these dwellings (except for some living rooms, where these may occasionally be higher).
Low internal surface temperature, in particular in top-floor dwellings (about 20% of the social-housing stock) and those with façade solutions with low thermal resistance (40% of the housing stock), although areas of low temperature in the other solutions cannot be excluded (presence of thermal bridges).
Limited availability or little use capability of suitable equipment for the integrated heat treatment of housing.
Low ventilation rate of the dwelling during the cold season, both manually and stack driven. This situation is critical to ensuring indoor health conditions and may be linked to inhabitants becoming discouraged from using windows due to the inability to offset the associated thermal load; absence of mechanical devices ensuring air renewal; relatively high airtightness of the property (when window frames have been replaced); and limited ability of infiltrations to drive the renewal of the indoor atmosphere.
These factors commonly lead to low quality indoor environments and the risk of exposure to indoor air pollution linked to high relative humidity: formation of surface condensation and boosting of bio-contaminants (fundamentally fungi), and exposure to high levels of CO2 and other gases associated with the indoor activity (VOCs and HAPs).
This aspect has more impact on lower-income social groups despite the limited effect on overall demand offset by milder periods. The presence of anomalous periods over a long period of time may have a severe impact on dwellings in energy poverty conditions which will be unable to respond to these episodes.
In contrast, during summer periods the dwellings are usually over-ventilated (as a passive thermal control measure), devaluating the capacity of the envelope to act as an energy buffer, whilst the absence of integral cooling systems leads to an increase in the mean indoor temperatures above mechanical-comfort values (although the application of adaptive comfort strategies is possible during some periods of time outside extreme conditions). This situation mainly affects comfort perception, while health repercussions cannot be ruled out.
A further aspect associated with climate evolution which is particularly important is the increase, intensity, and duration of pollen emissions (which is very common in cities like Seville due to its urban landscape and agrarian ecology). Dwellings are especially sensitive due to the use of natural ventilation over many hours, especially in the absence of suitable cooling devices, and this may lead to a rise in hay fever.
4.3. Actual Practice Profile
One of the aspects of greatest interest is the ability to generate user profiles as close as possible to those of actual users, with the purpose of being able to reproduce the current uses in the dwellings rather than to set as design goals, thus allowing the establishment of a starting baseline closer to the reality of the occupants: what users really do.
An alternative and complementary scenario—for comparison assessment procedures—for that established in Spanish Standards is proposed as part of the discussion of the results derived from the monitoring of variables and the analysis of user surveys.
This scenario is introduced with the aim of realistic assessment of current use of energy in the dwellings (especially in social housing), the occupational profile, and the use of thermal conditioning systems (introducing into the models those set-points more likely used by the occupants).
The values derived from observing the actual performance of dwellings are adopted, as discussed in previous sections and shown in
Table 3. This makes it possible to obtain results more in line with the current performance of the social dwelling, offering a more reliable assessment of energy saving potential when the current situation is taken as a starting point.
There is an adjustment of the heating operation temperatures during the cold season, though the timetable is the same. During the daytime period, the temperature is set to a lower value (understood as the mean temperature of the dwelling, since there may be rooms with a locally higher temperature, and vice versa, depending on the use of the heating equipment). Use of heating is not envisaged at night, which is assumed to be a free-running period. An exception has been introduced in the case of users operating a heating system in the event of extraordinary periods during which the temperature may fall below 15 °C.
There is a similar situation for the summer period, when it has been observed that there is no significant use of cooling in the mornings (given the low occupancy profile of the dwelling in this period). Cooling is only used in the after-lunch to evening period, with an adjustment of the operating temperature in accordance with the thermal tolerances observed. The use of active cooling systems has not been considered for the night-time period since typically cooling is provided through the use of natural ventilation, with the dwelling entering free-running conditions (night operation of AC is only associated with extreme heat conditions).
5. Conclusions
The clear differences observed between the profiles of use of thermal control in homes as proposed in the official standards result in a significant deviation in the behaviour predicted, as well as an overestimation of possible savings when improvement processes are undertaken. In addition, the tolerance band for indoor conditions identified is wider than usually expected, even in cases where modifications are possible, as it is generally understood that HVAC in dwellings is only used in conditions of extreme discomfort. Some health risks (inadequate ventilation, mould presence …) have been identified due to the thermal-management practices commonly adopted by users, mostly natural ventilation control, which is kept to a minimum in winter in order to maintain indoor conditions. Although ventilation during summer is a widespread practice with enormous potential, the risks derived from episodes of outdoor pollution must also be taken into account.
The inclusion of specific profiles associated with housing types—especially regarding their economic level (social or otherwise) or the climate zone where they are found—is seen as an opportunity. This is especially significant in the case of the more continental areas of the Mediterranean region.
This work proposes a profile for the assessment of current use of thermal control of homes, suited to the conditions usually found in southern European housing, especially social housing. Findings show that the intensity of use of thermal control is far from that proposed by current energy standards, which are mostly based on heat balance comfort models and highlight the ineffectiveness of the concept of investment recovery based on energy savings and the unsuitability of this approach in real situations.
The energy retrofitting of existing housing stock—with very low energy consumption and usually lacking heating or cooling systems—should aim to optimise building energy transfers, mostly through passive techniques, while also allowing users to ensure flexible indoor conditions through adaptive strategies whenever possible. Furthermore, this study paves the way for a discussion on the preferred thermal conditions of real users in these areas, where cultural and sociological factors modify expectations. Comfort assessments should follow adaptive comfort pathways as laid down in ASHRAE Standard 55 [
37] or the recent preEN16798-1 [
39], while also introducing regional and context parameters.
Author Contributions
Conceptualization, S.D.A.; Methodology, S.D.A. and J.F.-A.; Validation, S.D.A., J.F.-A., and J.J.S.; Formal analysis, S.D.A. and J.F.-A.; Investigation, S.D.A. and J.F.-A.; Data curation, S.D.A. and J.F.-A.; Writing—original draft preparation, S.D.A. and J.F.-A.; Writing—review and editing, J.J.S. and S.R.; Supervision, S.R.
Funding
This study was funded by the Spanish Ministry of Economy and Competitiveness (Government of Spain) under project BIA2012-39020-C02-01 and BES-2013-063097 support.
Acknowledgments
The authors are especially grateful to all those who collaborated in this research project, especially to those who have been the object of the different measurement campaigns who opened their homes to us. We would like to express a special gratitude to the School of Energy, Geoscience, Infrastructure and Society (EGIS) at the Heriot-Watt University (UK) for their support and advice in the development of this work, where part of this work was developed.
Conflicts of Interest
The authors declare no conflict of interest.
References
- Dominguez-Amarillo, S.; Fernández-Agüera, J.; Sendra, J.J. Rethinking user behaviour comfort patterns in the south of Spain—What users do. In Proceedings of the 10th Windsor Conference, Windsor, UK, 12–15 April 2018. [Google Scholar]
- Spanish Statistics National Institute. Censos de Población y Viviendas. 2011. Available online: http://www.ine.es/censos2011/tablas/Inicio.do (accessed on 1 January 2018).
- Presidencia del Gobierno. Real Decreto 2429/1979, de 6 de julio, por el que se aprueba la norma básica de edificación NBE-CT-79, sobre condiciones térmicas en los edificios. 1979. Available online: https://www.boe.es/buscar/doc.php?id=BOE-A-1979-24866 (accessed on 15 October 2018).
- European Commission and Parliament. Directive 2012/27/EU of the European Parliament and of the Council of 25 October 2012 on Energy Efficiency; European Commission: Brussels, Belgium, 2012.
- Spanish Government. Royal Decree RD 235/2013 of 5 April 2013; Spanish Government: Madrid, Spain, 2013.
- Branco, G.; Lachal, B.; Gallinelli, P.; Weber, W. Predicted versus observed heat consumption of a low energy multifamily complex in Switzerland based on long-term experimental data. Energy Build. 2004, 36, 543–555. [Google Scholar] [CrossRef]
- Majcen, D.; Itard, L.C.M.; Visscher, H. Theoretical vs. actual energy consumption of labelled dwellings in the Netherlands: Discrepancies and policy implications. Energy Policy 2013, 54, 125–136. [Google Scholar] [CrossRef]
- Ministerio de la Presidencia, Gobierno de España. Real Decreto 235/2013, de 5 de abril, por el que se aprueba el procedimiento básico para la certificación de la eficiencia energética de los edificios; Boletín Oficial del Estado; Ministerio de la Presidencia, Gobierno de España: Madrid, Spain, 2013.
- Sendra, J.J.; Domínguez-Amarillo, S.; Bustamante, P.; León, A.L. Energy intervention in the residential sector in the south of Spain: Current challenges. Informes de la Construcción 2013, 65, 457–464. [Google Scholar] [CrossRef]
- Santamouris, M.; Alevizos, S.M.; Aslanoglou, L.; Mantzios, D.; Milonas, P.; Sarelli, I.; Karatasou, S.; Cartalis, K.; Paravantis, J.A. Freezing the poor—Indoor environmental quality in low and very low income households during the winter period in Athens. Energy Build. 2014, 70, 61–70. [Google Scholar] [CrossRef]
- Nicol, J.F.; Humphreys, M.; Roaf, S. Adaptive Thermal Comfort: Principles and Practice; Routledge: Abingdon-on-Thames, UK, 2012. [Google Scholar]
- Nicol, J.F.; Roaf, S. Rethinking thermal comfort. Build. Res. Inf. 2017, 45, 711–716. [Google Scholar] [CrossRef]
- Tuohy, P.; Roaf, S.; Nicol, F.; Humphreys, M.; Boerstra, A. Twenty first century standards for thermal comfort: Fostering low carbon building design and operation. Archit. Sci. Rev. 2010, 53, 78–86. [Google Scholar] [CrossRef]
- Roaf, S.; Nicol, F.; Rijal, H. Designing for comfort at high temperatures. Archit. Sci. Rev. 2015, 58, 35–38. [Google Scholar] [CrossRef]
- Escandón, R.; Suárez, R.; Sendra, J.J. On the assessment of the energy performance and environmental behaviour of social housing stock for the adjustment between simulated and measured data: The case of mild winters in the Mediterranean climate of southern Europe. Energy Build. 2017, 152, 418–433. [Google Scholar] [CrossRef]
- AENOR. Norma UNE-EN ISO 7726:2002. Ergonomía de los Ambientes Térmicos; Instrumentos de Medida de las Magnitudes Físicas: Madrid, Spain, 2002. [Google Scholar]
- Sendra, J.J.; Domínguez-Amarillo, S.; León Rodríguez, A.L.; Navarro, J.; Muñoz, M.S. Proyecto EFFICACIA Project. Optimización Energética en la Vivienda Colectiva; Secretariado de Publicaciones de la Universidad de Sevilla: Seville, Spain, 2011; ISBN 978-84-472-1376-4. [Google Scholar]
- León, A.; Muñoz, S.; León, J.; Bustamante, P. Monitorización de variables medioambientales y energéticas en la construcción de viviendas protegidas: Edificio Cros-Pirotecnia en Sevilla. Informes de la Construcción 2010, 62, 67–82. [Google Scholar] [CrossRef]
- EFFICACIA Project. Reducción del Consumo Energético y del Impacto Ambiental en la Construcción de Viviendas Protegidas en Andalucía; Corporación Tecnológica de Andalucía: Sevilla, Spain, 2010; Available online: http://grupo.us.es/grupotep130/es/proyectos/historico/510-efficacia (accessed on 15 October 2018).
- RFAVIV Project. Rehabilitación energética de las fachadas de viviendas sociales deterioradas en Madrid y Sevilla, aplicando productos innovadores nacionales y europeos (DIT y DITE). Encuéntranos: Madrid, Spain, 2016. Available online: http://proyectorefaviv.ietcc.csic.es (accessed on 15 October 2018).
- Thom, H.C.S. The Rational Relationship Between Heating Degree Days and Temperature. Mon. Weather Rev. 1954, 82, 1–6. [Google Scholar] [CrossRef]
- Scapin, S.; Apadula, F.; Brunetti, M.; Maugeri, M. High-resolution temperature fields to evaluate the response of Italian electricity demand to meteorological variables: An example of climate service for the energy sector. Theor. Appl. Climatol. 2016, 125, 729–742. [Google Scholar] [CrossRef]
- Cox, R.; Drews, M.; Rode, C.; Nielsen, S.B. Simple future weather files for estimating heating and cooling demand. Build. Environ. 2015, 83, 104–114. [Google Scholar] [CrossRef]
- Valor, V. Daily air temperature and electricity load in Spain. J. Appl. Meteorol. 2001, 40, 1413–1421. [Google Scholar] [CrossRef]
- Quayle, E.D.H. Heating degree-day data applied to residential heating energy. J. Appl. Meteorol. 1979, 19, 241–246. [Google Scholar] [CrossRef]
- Pardo, E. Temperature and seasonality influences on Spanish electricity loads. Energy Econ. 2002, 24, 55–70. [Google Scholar] [CrossRef]
- Giannakopoulos, C.; Hadjinicolaou, P.; Zerefos, C.; Demosthenous, G. Changing Energy Requirements in the Mediterranean Under Changing Climatic Conditions. Energies 2009, 2, 805–815. [Google Scholar] [CrossRef]
- Giannakopoulos, C.; Le Sager, P.; Bindi, M.; Moriondo, M.; Kostopoulou, E.; Goodess, C.M. Climatic changes and associated impacts in the Mediterranean resulting from a 2 °C global warming. Glob. Planet. Chang. 2009, 68, 209–224. [Google Scholar] [CrossRef]
- Domínguez-Amarillo, S.; Sendra, J.J.; Fernández-Agüera, J.; Escandón, R. La construcción de la vivienda social en Sevilla y su catalogación 1939–1979; Editorial Universidad de Sevilla: Sevilla, Spain, 2017; ISBN 978-84-472-1829-5. [Google Scholar]
- Domínguez-Amarillo, S.; Sendra, J.J.; Oteiza, I. La envolvente térmica de la vivienda social. El caso de Sevilla, 1939 a 1979; Editorial CSIC: Madrid, Spain, 2016; ISBN 978-84-00-10124-4. [Google Scholar]
- Fernández-Agüera, J.; Domínguez-Amarillo, S.; Sendra, J.J.; Suárez Medina, R. An approach to modelling envelope airtightness in multi-family social housing in Mediterranean Europe based on the situation in Spain. Energy Build. 2016, 128, 236–253. [Google Scholar] [CrossRef]
- Fernández-Agüera, J.; Domínguez-Amarillo, S.; Sendra, J.J.; Suárez, R.; Oteiza, I. Social housing airtightness in Southern Europe. Energy Build 2018. [Google Scholar] [CrossRef]
- EN 13829:2002. Thermal Performance of Buildings—Determination of Air Permeability of Buildings—Fan Pressurization Method, (ISO 9972:1996, Modified); UNE-EN: Madrid, Spain, 2010. [Google Scholar]
- Ministerio de Fomento, Gobierno de España. Orden FOM/1635/2013, de 10 de septiembre, por la que se actualiza el Documento Básico DB-HE “Ahorro de Energía”, del Código Técnico de la Edificación, aprobado por Real Decreto 314/2006, de 17 de marzo; Boletín Oficial del Estado (B.O.E.): Madrid, Spain, 2013.
- Ministerio de la Presidencia, Gobierno de España. Real Decreto 238/2013, de 5 de abril, por el que se modifican determinados artículos e instrucciones técnicas del Reglamento de Instalaciones Térmicas en los Edificios, aprobado por Real Decreto 1027/2007, de 20 de julio; Boletín Oficial del Estado, Gobierno de España: Madrid, Spain, 2013.
- Technical Committee ISO/TC 159. Ergonomics, Subcommittee SC 5, Ergonomics of the Physical Environment, ISO 7730: 2005. Ergonomics of the Thermal Environment—Analytical Determination and Interpretation of Thermal Comfort Using Calculation of the PMV and PPD Indices and Local Thermal Comfort Criteria; International Organization for Standardization: Geneva, Switzerland, 2005. [Google Scholar]
- American Society of Heating, Refrigerating and Air-Conditioning Engineers (ASHRAE). ASHRAE 55: ANSI/ASHRAE 2017. Thermal Environmental Conditions for Human Occupancy; ASHRAE: Atlanta, GA, USA, 2017. [Google Scholar]
- AEN/CTN 100—CLIMATIZACIÓN, UNE-EN 15251:2008. Indoor Environmental Input Parameters for Design and Assessment of Energy Performance of Buildings Addressing Indoor Air Quality, Thermal Environment, Lighting and Acoustics; European Committee for Standardization: Madrid, Spain, 2008. [Google Scholar]
- preEN16798-1 EN 16798-1: Energy Performance of Buildings Part 1: Indoor Environmental Input Parameters for Design and Assessment of Energy Performance of Buildings Addressing Indoor Air Quality, Thermal Environment, Lighting and Acoustics-Module M1-6; Revision of EN 15251. 2015. Available online: https://epb.center/support/documents/m1-overarching-epb/en-16798-1 (accessed on 15 October 2018).
Figure 1.
Daily evolution of cooling needs on cooling degree days (CDD) for the city of Seville in from 2010 to 2014 (base temperature 25 °C). Source: LEZL station (San Pablo Station, Seville).
Figure 1.
Daily evolution of cooling needs on cooling degree days (CDD) for the city of Seville in from 2010 to 2014 (base temperature 25 °C). Source: LEZL station (San Pablo Station, Seville).
Figure 2.
Daily evolution of heating needs on heating degree days of (HDD) for the city of Seville from 2010 to 2014 (base temperature 15 °C). Source: LEZL station (San Pablo Station, Seville).
Figure 2.
Daily evolution of heating needs on heating degree days of (HDD) for the city of Seville from 2010 to 2014 (base temperature 15 °C). Source: LEZL station (San Pablo Station, Seville).
Figure 3.
Distribution of daytime temperatures (°C) in the winter months in the post-1979 group of dwellings compared to heating setpoint temperatures, in accordance with the energy rating procedure and characterisation of CTE-HE demand. Night temperature setpoint (blue) and day temperature setpoint (ochre).
Figure 4.
Frequency histogram of winter temperature distributions in the post-1979 group (°C) during the night from 11:00 p.m. to 8:00 a.m. (a) and day from 8:00 a.m. to 11:00 p.m. (b).
Figure 4.
Frequency histogram of winter temperature distributions in the post-1979 group (°C) during the night from 11:00 p.m. to 8:00 a.m. (a) and day from 8:00 a.m. to 11:00 p.m. (b).
Figure 5.
Distribution of daytime temperatures (°C) in the summer months in the post-1979 group of dwellings compared to cooling setpoint temperatures, in accordance with to the energy rating procedure and characterisation of CTE-HE demand without cooling systems (a) and with cooling systems (b). Night temperature setpoint (blue) and afternoon temperature setpoint (ochre).
Figure 6.
Comparison of density traces of summer temperature distributions in the post-1979 group (°C) for dwellings without cooling systems (grey) compared to dwellings with cooling equipment (green) during the day from 8:00 a.m. to 4:00 p.m. (a) from 4:00 a.m. to 11:00 p.m. (b) and at night from 11:00 p.m. to 8:00 a.m. (c).
Figure 7.
Distribution of daytime temperatures (°C) in the winter months in the pre-1979 group of dwellings compared to heating setpoint temperatures, in accordance with the energy rating procedure and characterisation of CTE-HE demand. Night temperature setpoint (blue) and day temperature setpoint (ochre).
Figure 8.
Frequency histogram of winter temperature distributions in the pre-1979 group (°C) during the night from 11:00 p.m. to 8:00 a.m. (a) and day from 8:00 a.m. to 4:00 p.m. (b).
Figure 8.
Frequency histogram of winter temperature distributions in the pre-1979 group (°C) during the night from 11:00 p.m. to 8:00 a.m. (a) and day from 8:00 a.m. to 4:00 p.m. (b).
Figure 9.
Distribution of daytime temperatures (°C) in the summer months in the pre-1979 group of dwellings compared to cooling setpoint temperatures, in accordance with the energy rating procedure and characterisation of CTE-HE demand. Night temperature setpoint (blue) and afternoon temperature setpoint (ochre).
Figure 10.
Availability of cooling (a) and heating (b) equipment in the dwellings surveyed.
Figure 10.
Availability of cooling (a) and heating (b) equipment in the dwellings surveyed.
Figure 11.
Weeks of use of climate-control systems (a) and night-time use of climate-control systems (b).
Figure 11.
Weeks of use of climate-control systems (a) and night-time use of climate-control systems (b).
Figure 12.
Number of times the dwellings are ventilated according to season (a) and daytime ventilation time in summer (b) and winter (c).
Figure 12.
Number of times the dwellings are ventilated according to season (a) and daytime ventilation time in summer (b) and winter (c).
Figure 13.
Comparison of adjusted temperature distributions (°C) of the pre-1979 group of dwellings without thermal insulation (blue line), compared to the post-1979 group of dwellings with thermal insulation (red line) for the daytime period in winter (a) and summer (b).
Figure 13.
Comparison of adjusted temperature distributions (°C) of the pre-1979 group of dwellings without thermal insulation (blue line), compared to the post-1979 group of dwellings with thermal insulation (red line) for the daytime period in winter (a) and summer (b).
Table 1.
Setpoint temperature programmed for dwellings (B).
Table 1.
Setpoint temperature programmed for dwellings (B).
| Setpoint Temperature (°C) | 1–7 h | 8 h | 9–15 h | 16–23 h | 24 h |
|---|
| January to May (lower) | 17 | 20 | 20 | 20 | 17 |
| June to September (higher) | 27 | free running | free running | 25 | 27 |
| October to December (lower) | 17 | 20 | 20 | 20 | 17 |
Table 2.
Number of hours and percentage of total hours in which dwellings have a CO2 concentration above 900 ppm.
Table 2.
Number of hours and percentage of total hours in which dwellings have a CO2 concentration above 900 ppm.
| Month | Bedroom (hours) | Living-room (hours) |
|---|
| January | 484 (65%) | 320 (43%) |
| February | 361(53%) | 191 (28%) |
| March | 285 (38%) | 172 (23%) |
| April | 0 | 106 (15%) |
| May | 239 (32%) | 320 (43%) |
| June | 290 (40%) | 320 (44%) |
| July | 222 (30%) | 0 |
| August | Holidays | Holidays |
| September | 236 (33%) | 24 (3%) |
| October | 290 (39%) | 32 (4%) |
| November | 321 (44%) | 230 (32%) |
| December | 413 (55%) | 321 (43%) |
Table 3.
Setpoint temperature program for real practice (B).
Table 3.
Setpoint temperature program for real practice (B).
| Setpoint temperature (°C) | 1–7 h | 8 h | 9–15 h | 16–23 h | 24 h |
|---|
| January to May (lower) | 15 | 19 | 19 | 19 | 15 |
| June to September (higher) | Free running | Free running | Free running | 27 | Free running |
| October to December (lower) | 15 | 19 | 19 | 19 | 15 |
© 2018 by the authors. Licensee MDPI, Basel, Switzerland. This article is an open access article distributed under the terms and conditions of the Creative Commons Attribution (CC BY) license (http://creativecommons.org/licenses/by/4.0/).
