Article

Solar and Shading Potential of Different Configurations of Building Integrated Photovoltaics Used as Shading Devices Considering Hot Climatic Conditions

Department of Architecture, King Fahd University of Petroleum and Minerals, P.O. Box 2483, Dhahran 31261, Saudi Arabia
Sustainability 2018, 10(12), 4373; https://doi.org/10.3390/su10124373
Submission received: 23 October 2018 / Revised: 20 November 2018 / Accepted: 21 November 2018 / Published: 23 November 2018
(This article belongs to the Section Energy Sustainability)

Abstract

:
This study investigates the use of building-integrated photovoltaics (BIPVs) as shading devices in hot climates, with reference to the conditions of Saudi Arabia. It used parametric numerical modelling to critically appraise the potential of eight design configurations in this regard, including vertical and horizontal shading devices with different inclination angles. The study assumed that the examined shading devices could be entirely horizontal or vertical on the three exposed facades, which is common practice in architecture. The study found that the examined configurations offered different solar and shading potentials. However, the case of horizontal BIPV shading devices with a 45° tilt angle received the highest amount of annual total insolation (104 kWh/m2) and offered effective window shading of 96% of the total window area on average in summer. The study concluded that, unlike the common recommendation of avoiding horizontal shading devices on eastern and western facades, it is possible in countries characterised with high solar altitudes such as Saudi Arabia to use them effectively to generate electricity and provide the required window shading.

1. Introduction

In recent decades, researchers have been actively engaged in studying renewable energy technologies, including their potential applications in buildings. These efforts are driven by the insecurity of fossil fuel supplies and the associated negative environmental impacts. One important renewable energy source in this regard is solar energy, which could be effectively used in buildings for water heating and electricity generation. This is even more effective in hot climates due to the abundant availability of solar radiation. One of the most promising technologies in this field is the use of building-integrated photovoltaics (BIPVs) to generate electricity in buildings. The following sections of this literature review provide some details in this regard. The main attention in this context is paid to the potential use of BIPV as shading devices in hot climatic areas such as Saudi Arabia.

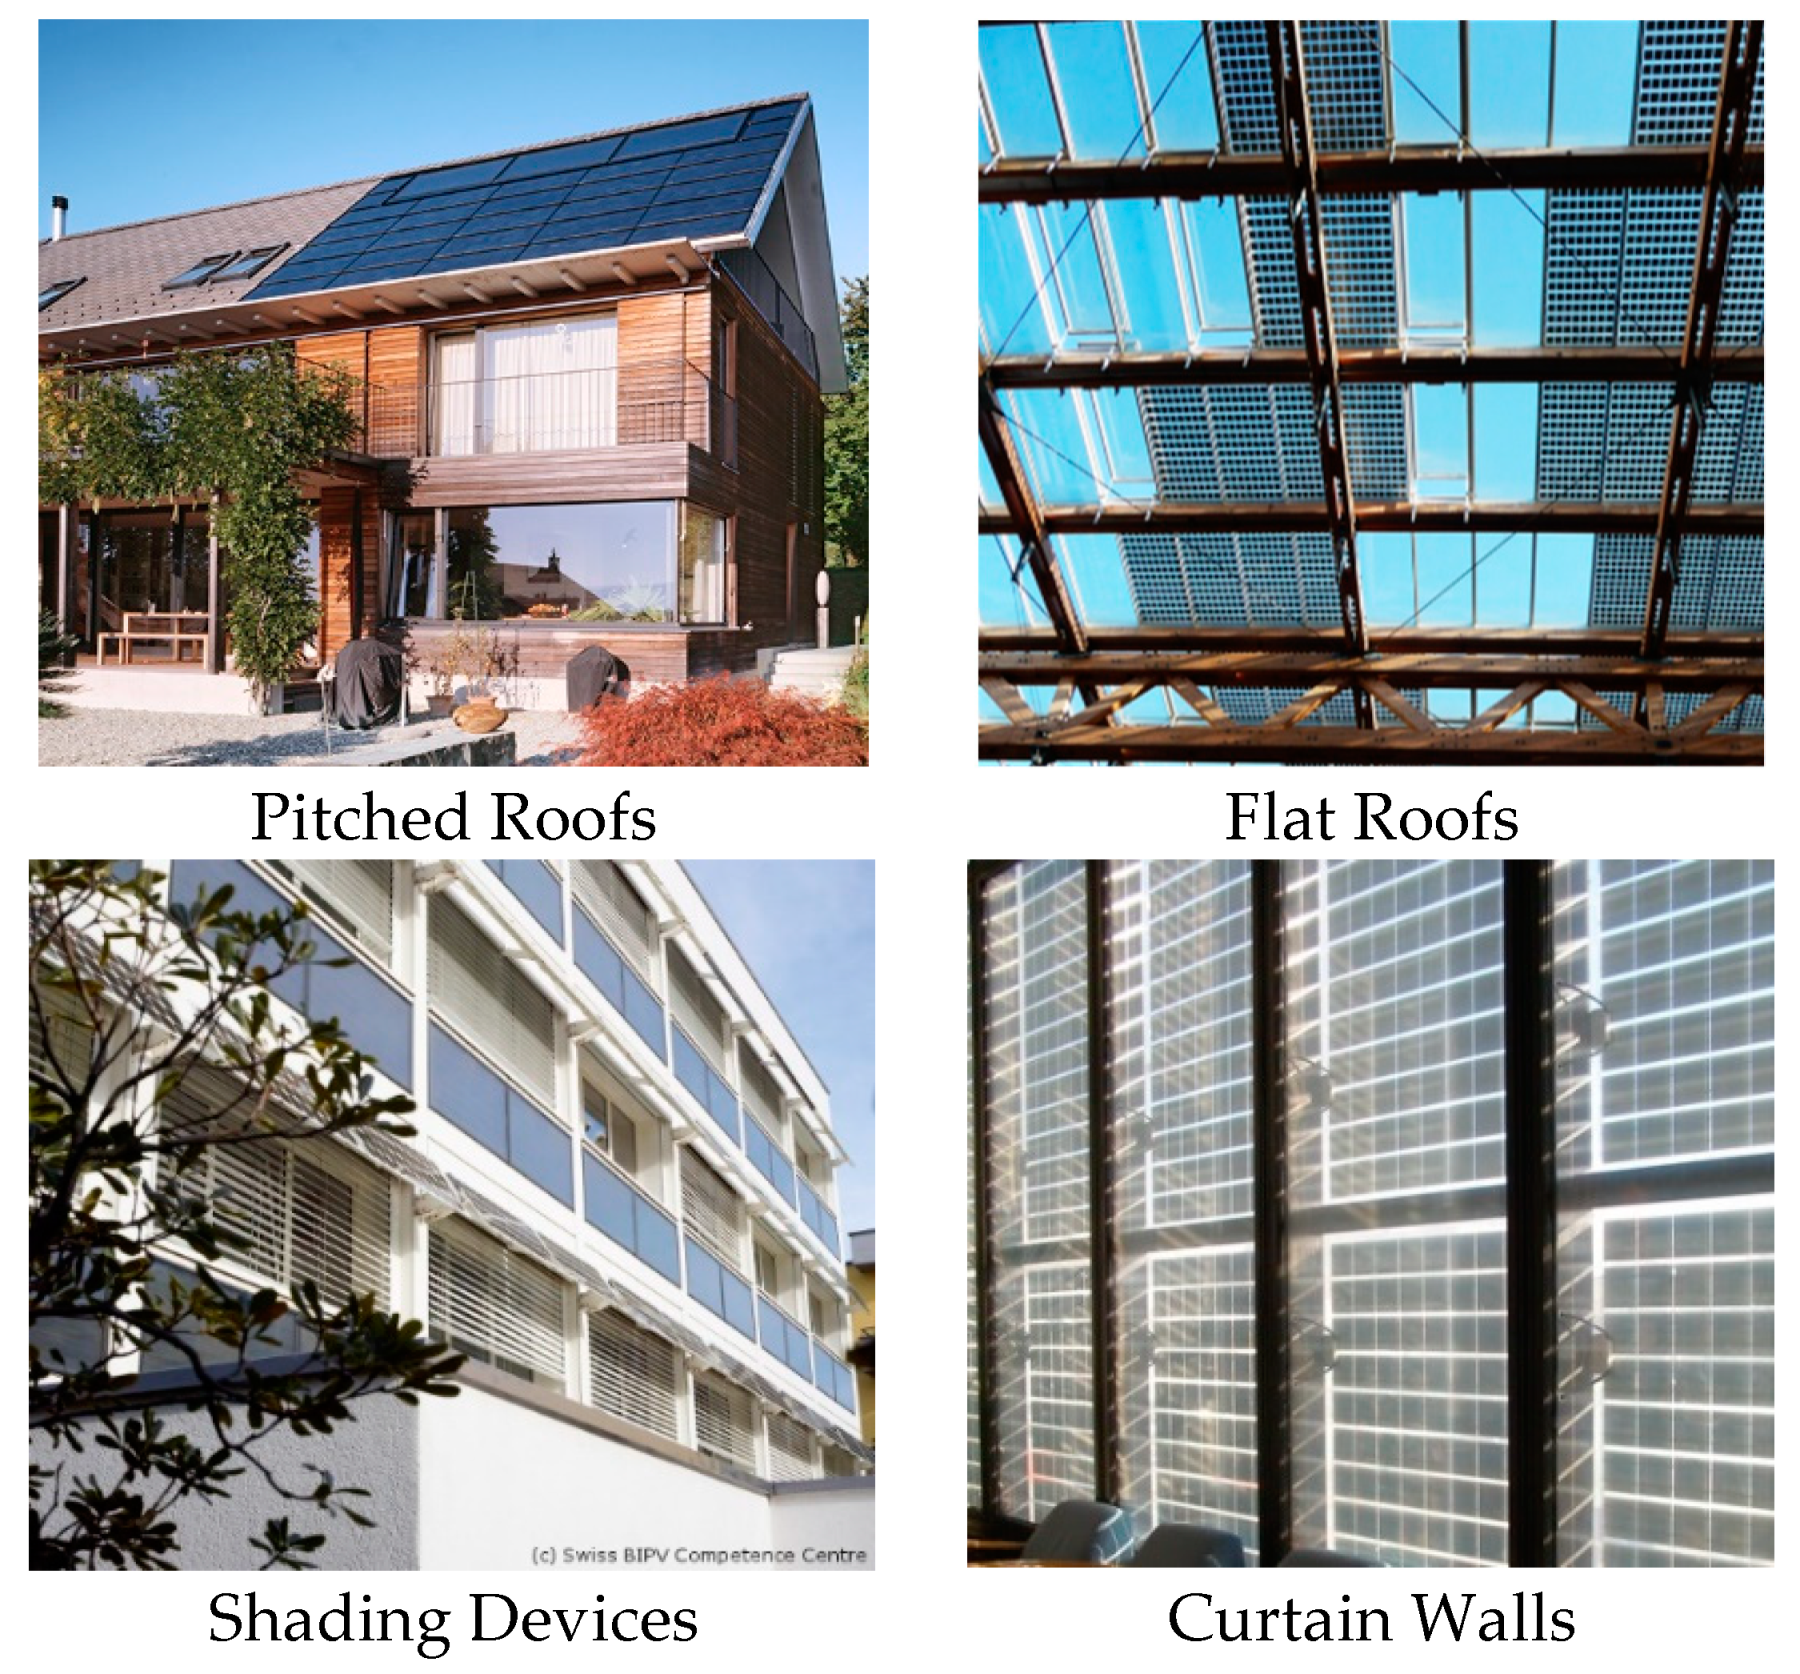
1.1. BIPVs Concept and Applications

Building-integrated photovoltaics (BIPVs), as opposed to building-applied photovoltaics (BAPVs), are simply photovoltaic (PV) systems that are used as integral parts of the building envelope. In this capacity, BIPV systems share the well-known advantages of BAPV systems such as providing an on-site renewable energy source that is silent, produces no hazardous emissions during operation, and requires relatively little maintenance during its expected lifetime of 20–25 years [1,2]. However, BIPV modules develop the PV system’s role from a mere electrical device to a construction element that could be used to enrich the architectural design instead of disturbing it [3]. BIPV may replace conventional construction materials in parts of the building envelope using different forms, including panels, foils, tiles, and glazing. However, this should be done without compromising the required functional qualities of these elements, including structural rigidity and thermal insulation [4]. One of the most common forms of BIPVs is PV integration into building roofs, see Figure 1. This is possible in a variety of forms such as roof cladding [5], roof tiling [6], and in the roofing of atria and skylights [7]. BIPVs integrated into roofs have a great potential for harvesting solar radiation. However, there are some design challenges such as partial shading, which requires a detailed shading analysis during the design phase [8]. In hot climates, BIPVs in roofs may experience excessive heat, which reduces their efficiency. In this case, a proper PV cooling mechanism should be considered at early design stages [5]. There is also the challenge of dust deposition over PV panels, especially if dust is coupled with high humidity. This necessitates the use of regular dust-cleaning techniques [9]. The use of BIPV systems in building facades is also common and could be implemented in a variety of forms. This includes window glazing [10], shading devices [11], cladding and construction of walls [12], double-skin facades [13], Trombe walls [14], etc. Some examples are presented in Figure 1. The main advantage of facade integration is that PV panels are made visible for people, which may be considered as a visual added value. However, one of the main challenges, in this case, is the issue of shading, which significantly depends on building massing. This issue has to be considered in the early design stage. Further details on the use of BIPVs as shading devices is provided in Section 1.3 of this literature review.

1.2. BIPVs Status in Saudi Arabia

The use of BIPV systems is greatly related to the local culture, architecture, and climatic conditions of each country. Several studies could be found in this context for some specific countries, such as Bahrain [9], Egypt [16], India [17], Malaysia [18], Italy [19], and Canada [20]. Saudi Arabia is an Arab country that has the largest oil reserves in the world (about 25%). It is considered the fastest growing electricity consumer in the Middle East. In 2005, it was the world’s 15th largest consumer of primary energy, of which over 60% was petroleum-based [21]. Despite the fact that oil availability is the main driving power of the Saudi economy so far, its sustainability is questioned considering the global concern over fossil fuel supplies [22]. Saudi Arabia has considered this issue through the adoption of Saudi Vision 2030. One of the main objectives of this vision is to reduce Saudi Arabia’s dependence on oil and to diversify its economy in a more sustainable way. The Vision has set an initial target of generating 9.5 gigawatts of renewable energy in this regard. It also aims to localise a significant portion of the renewable energy value chain in the Saudi economy, including research and development and manufacturing [23]. Considering the prevailing arid climatic conditions and the plentiful availability of solar radiation in Saudi Arabia, solar energy, including PV technology, can play a leading role in this regard [24]. This makes investment in the PV sector an essential strategy in Saudi Arabia, considering the continued rise of electricity demand. Despite the abundant availability of oil and electricity supplies in Saudi Arabia, the cost of solar energy will be less than the cost of fossil fuel energy, if environmental and health costs are considered [25]. However, the use of BIPV systems is still not a common practice in the architecture of Saudi Arabia. This forms a lost opportunity so far that should be invested in as soon as possible. As for research, several studies have been done in the field of solar energy use in buildings with reference to Saudi Arabia [26,27]. However, integration options of PV into the building fabric have not been highlighted. Thus, this study aims to investigate this issue with reference to the use of BIPVs as shading devices in building facades.

1.3. The Use of BIPVs as Shading Devices in Hot Climates

In general, the amount of incident solar radiation received by the PV system is the most important climatic variable that determines the performance of photovoltaic integrated shading devices. This is expressed in Equation (1) shown below [28]:
P = Asurf × factiv × GT × ηcell × ηinvert
where P is electrical power produced by photovoltaics [W], Asurf is the net area of surface [m2], factiv is the fraction of surface area with active solar cells, GT is the total solar radiation incident on the PV array [W/m2], ηcell is the module conversion efficiency, and ηinvert is the conversion efficiency from direct current (DC) to alternating current (AC). In research, it is a common practice to implement experimental measurements or simulation tools in the scope of PV performance assessment [29]. For example, Freewan [30] investigated the impact of external shading devices on the thermal and daylighting performance of offices considering hot climatic conditions. Despite the fact that this study did not consider the use of shading devices as BIPVs, it gives some insights about their shading potential considering different building configurations. The study used real-time measurements and computer simulations (IES/SunCast and Radiance) to quantify several variables, including air temperature, and window shaded area. The study considered the south-west orientation, and three configurations of fixed shading devices, namely vertical fins, diagonal fins, and egg crate. The results showed that windows protected by diagonal fins and egg crate shading devices performed better compared to the vertical fins. However, other orientations in addition to the horizontal shading device configuration were not examined.
Mandalaki, Zervas, Tsoutsos, and Vazakas [31] carried out an assessment of different configurations of fixed shading devices with integrated PV systems. The assessment aimed to compare the amount of energy produced by the investigated shading devices compared to their impact on the energy required for the heating, cooling, and lighting of internal spaces. The study investigated the energy performance of thirteen configurations of fixed shading devices. These configurations included horizontal, vertical, and combined ones incorporated in a single office room considering Mediterranean climatic conditions. The study used computer simulation for thermal assessment (Energy Plus) and PV electricity production (Autodesk Ecotect). As for lighting, the study used both computer simulation (Radiance and Autodesk Ecotect) in addition to a physical model. The study discussed the advantages of each configuration in this context. However, it was limited to the southern window orientation. Zhang, Lu, and Peng [32] carried out an evaluation of the potential benefits of integrated PVs in shading devices considering the climatic conditions of Hong Kong. The aim was to evaluate BIPV performance in terms of electricity generation and energy savings. The study used EnergyPlus for numerical simulation considering various tilt angles and orientations. The results concluded that the optimum BIPV installation position to maximise electricity generation is the south facade with a 30° tilt angle. However, the optimum angle for both electricity generation and energy savings was 20°. Despite the multiple criteria used in the analysis, the study was limited to the horizontal BIPV configuration.
It could be noted in the above-mentioned studies that horizontal shading devices are usually examined in the case of southern facades, while vertical ones are examined in the case of eastern and western facades. This is justified by the fact that horizontal shading devices are effective against high midday sun, while the vertical ones are effective against low sun. However, the terms “high” and “low” used in the literature are quite general and require some investigation to determine the resulting solar and shading performance of shading devices used in any specific climatic location. For example, some hot climatic zones are characterised by high solar altitudes in summer mornings and evenings. Table 1 shows some numerical examples, where summer solar altitude is around 60° at 10 a.m. and increases thereafter. Thus, the question arises: Is it a wise design decision to avoid horizontal shading devices on eastern and western facades in the hot climatic zones characterised by the high solar altitudes found in the summer? If they will be used as BIPVs, then what is their solar and shading potential to generate electricity and provide the required window shading compared to the vertical ones? The following investigation aims to bridge this gap found in the literature by addressing this question with reference to climatic conditions in Saudi Arabia. The study has considered two external and fixed BIPV installation configurations in this regard, which are the horizontal and vertical shading devices installed consistently. This means that they could be entirely horizontal or vertical on the three exposed facades, which is a common practice in architecture, see Figure 2.

2. Research Materials and Methods

This research is based on a quantitative analysis that utilises numerical parametric simulation as a data collection tool. The following sections present the research materials and methods implemented in this study.

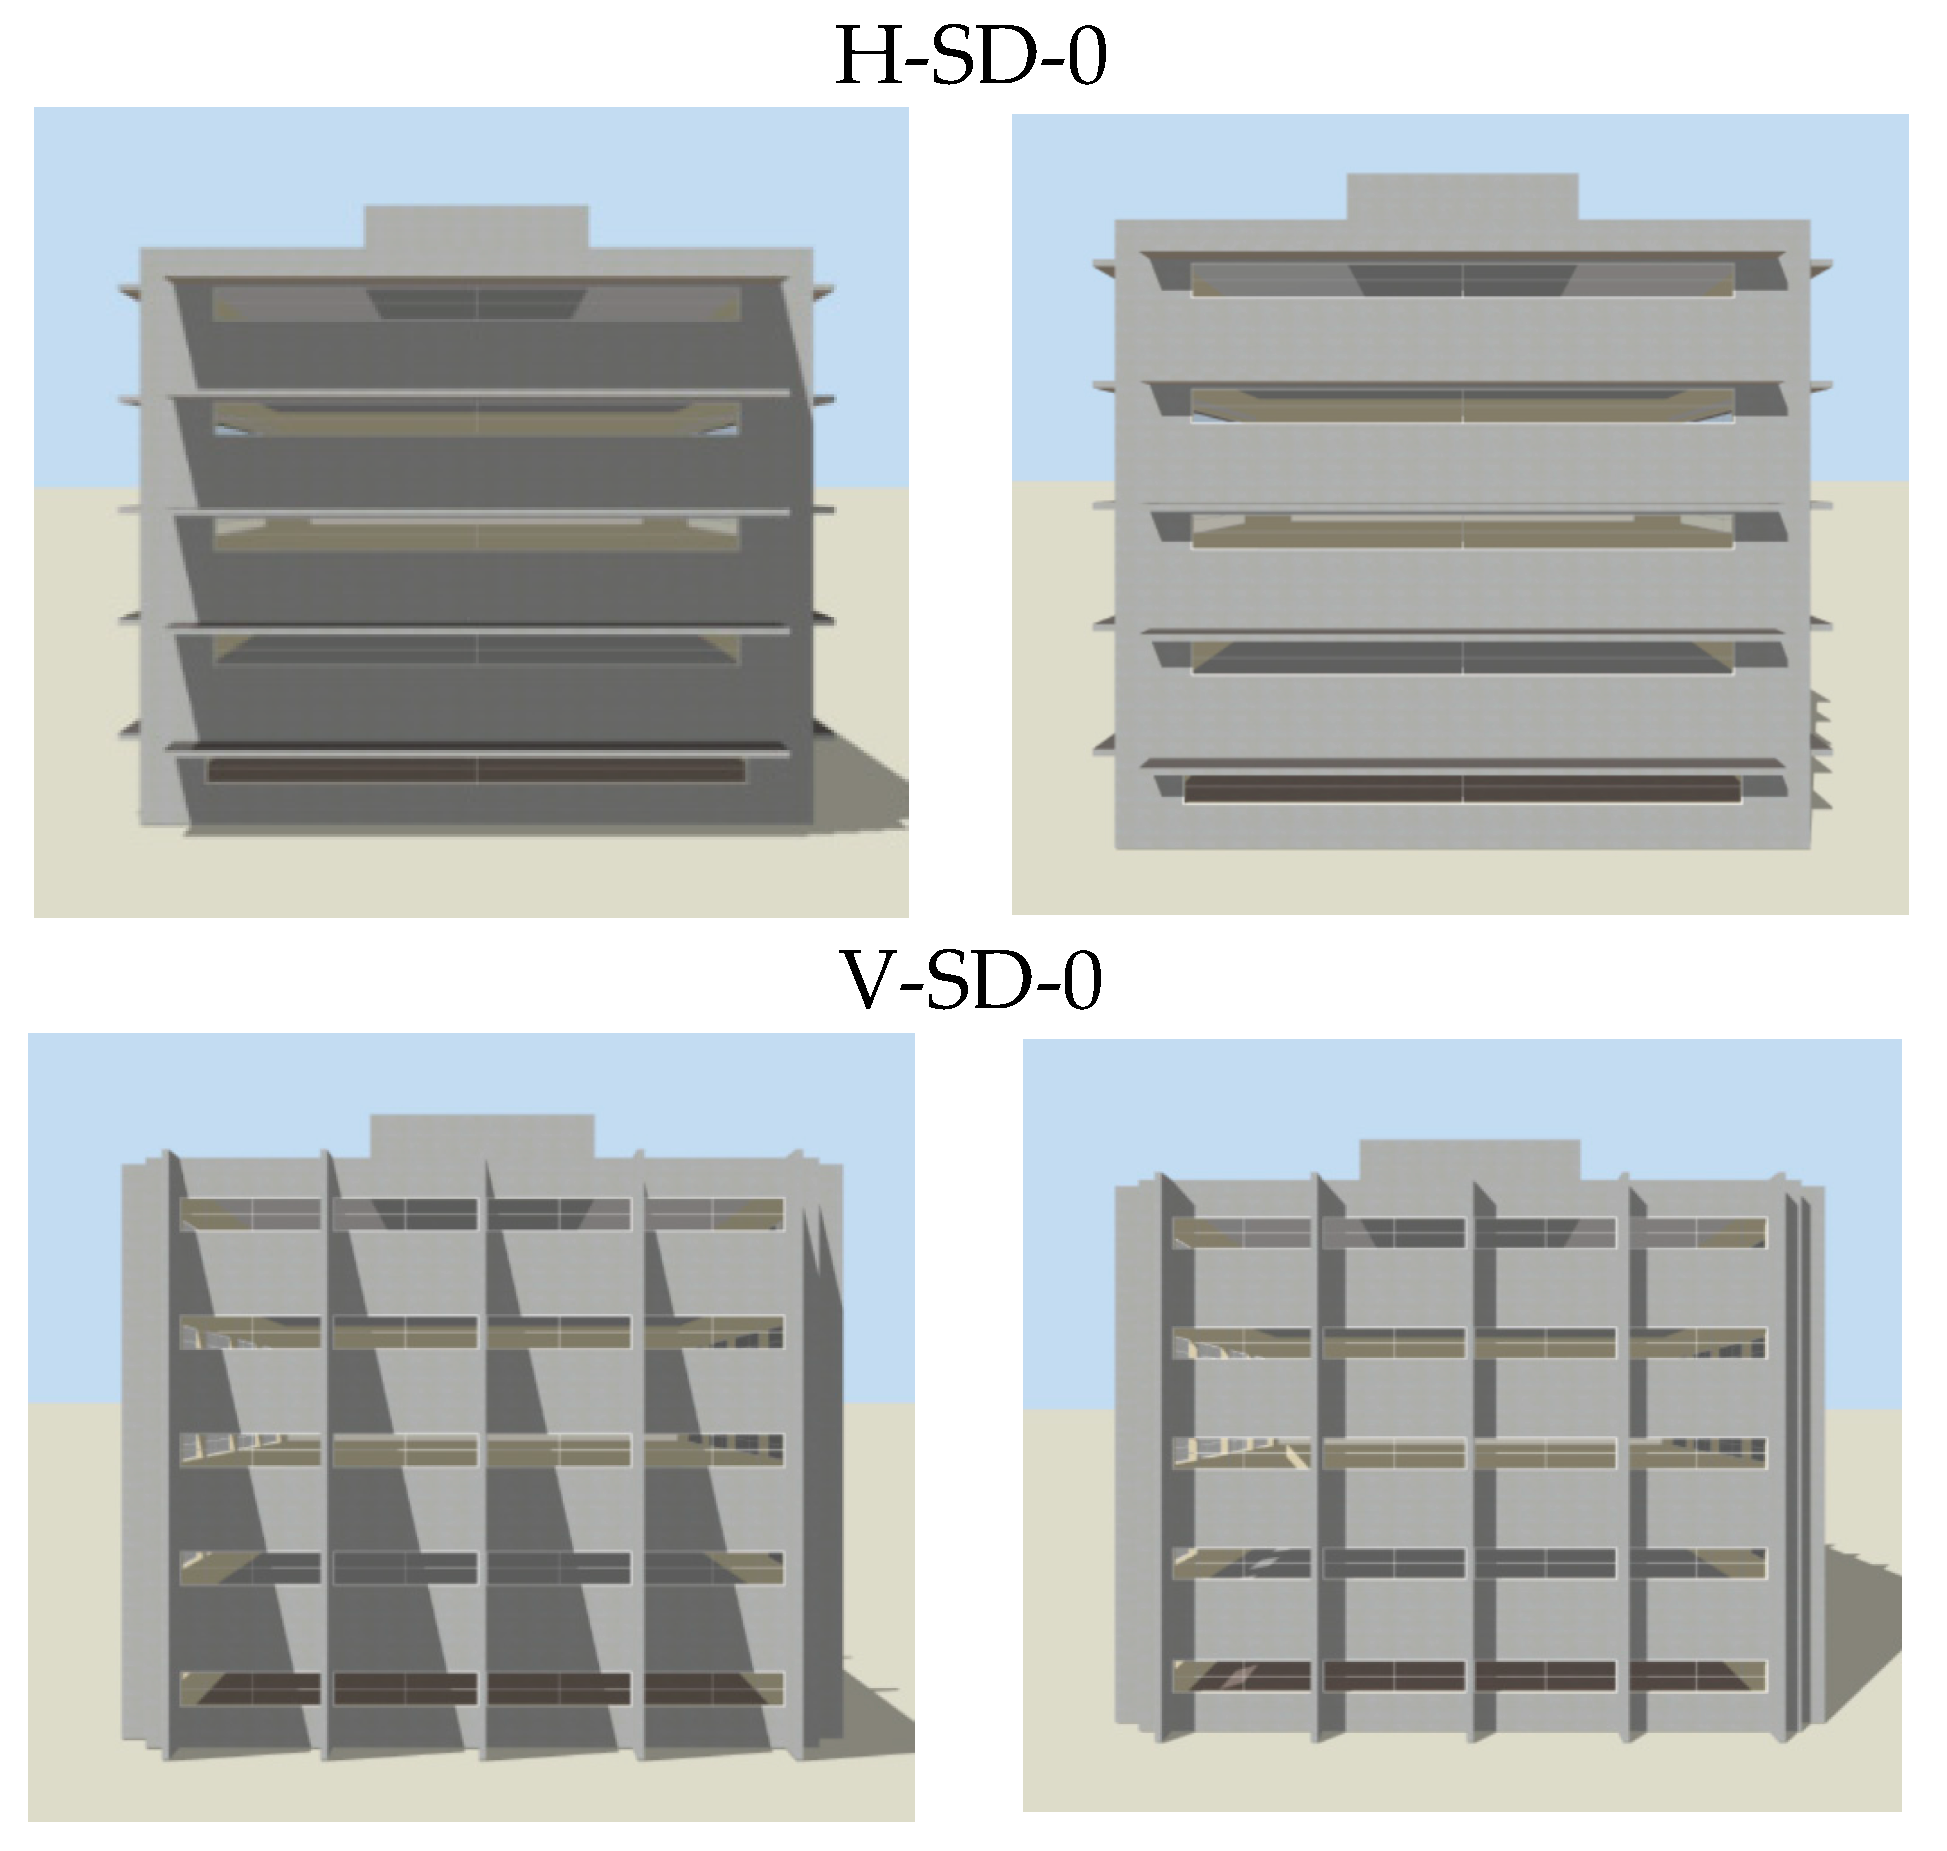
2.1. Building Geometry and Climatic Conditions

This study examines a generic 20 × 20 m open-plan office building of five floors, as shown in Figure 2. The building is oriented to normally face the four main cardinal directions. Horizontal windows are assumed in each floor, with a window area of about 25% of the floor plan. Shading devices are assumed along the windows as horizontal or vertical screens. The depth of shading devices is assumed to be similar to the standard PV panel depth, i.e., 1 m. The total PV area is assumed to be fixed in all cases. In the horizontal shading devices, PV vertical spacing is restricted by the floor height (3.5 m), while the vertical ones are normally distributed along the facade. The examined building is assumed to be in Riyadh city, Saudi Arabia. The climate of this city represents the prevailing climatic conditions in Saudi Arabia, which are hot and arid. Saudi Arabia, in general, is characterised by a high availability of solar radiation. The annual average daily Global Horizontal Irradiance (GHI) ranges from 5.7 kWh/m2 to 6.7 Wh/m2. Higher values are usually observed in inland regions and lower ones are observed along coastal areas. This indicates that PV technology would perform well at any location in Saudi Arabia [24]. Riyadh is located in the middle of Saudi Arabia (24°38′ N 46°43′ E). Its climate is marked by extreme temperatures in the summer, where the average daily high temperature is about 39 °C. Temperature varies greatly between night and day, and between summer and winter. In winter, the average daily high temperature drops to about 25 °C. The average daily incident solar radiation is also characterised by significant seasonal variation. Its value is about 7.4 kWh/m2 in summer and 5.0 kWh/m2 in winter [34].

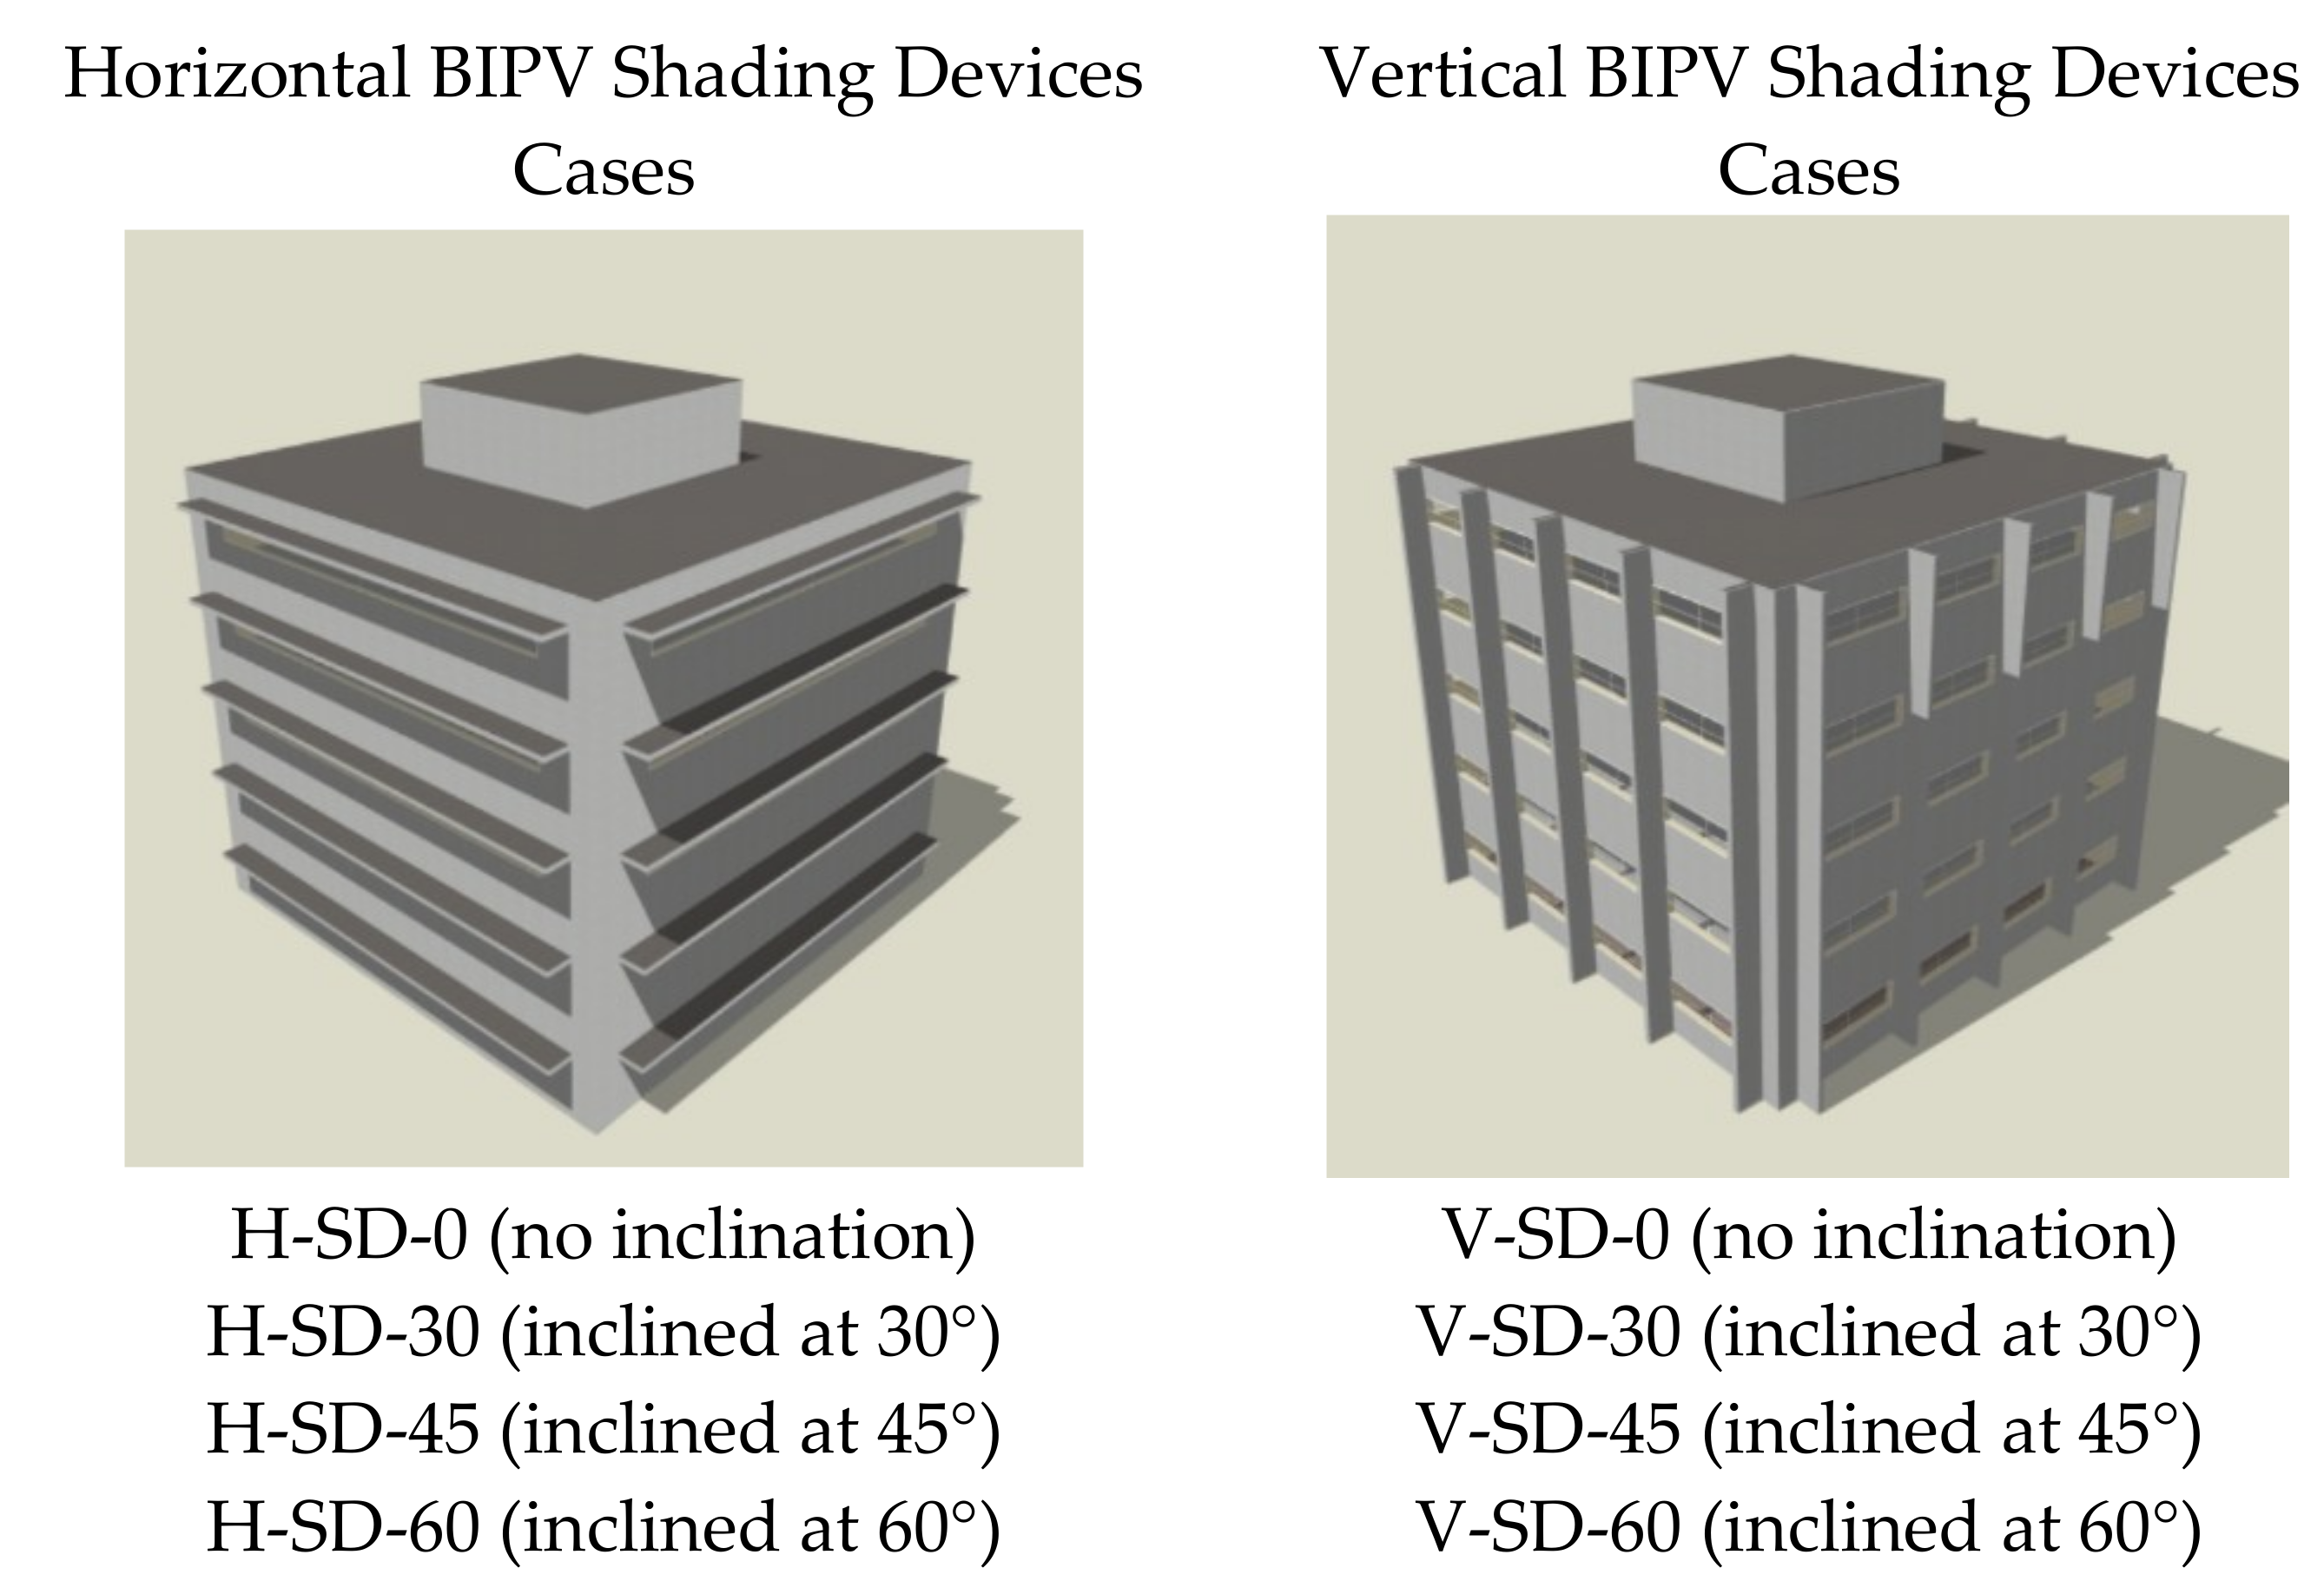
2.2. Modelling Variables and Cases

The dependent and independent variables considered in this study are as follows:
-
Dependent variable: Two variables are compared here to find out the impact of the examined BIPV shading devices in terms of solar energy harvesting, shading potential, and energy saving. These variables are:
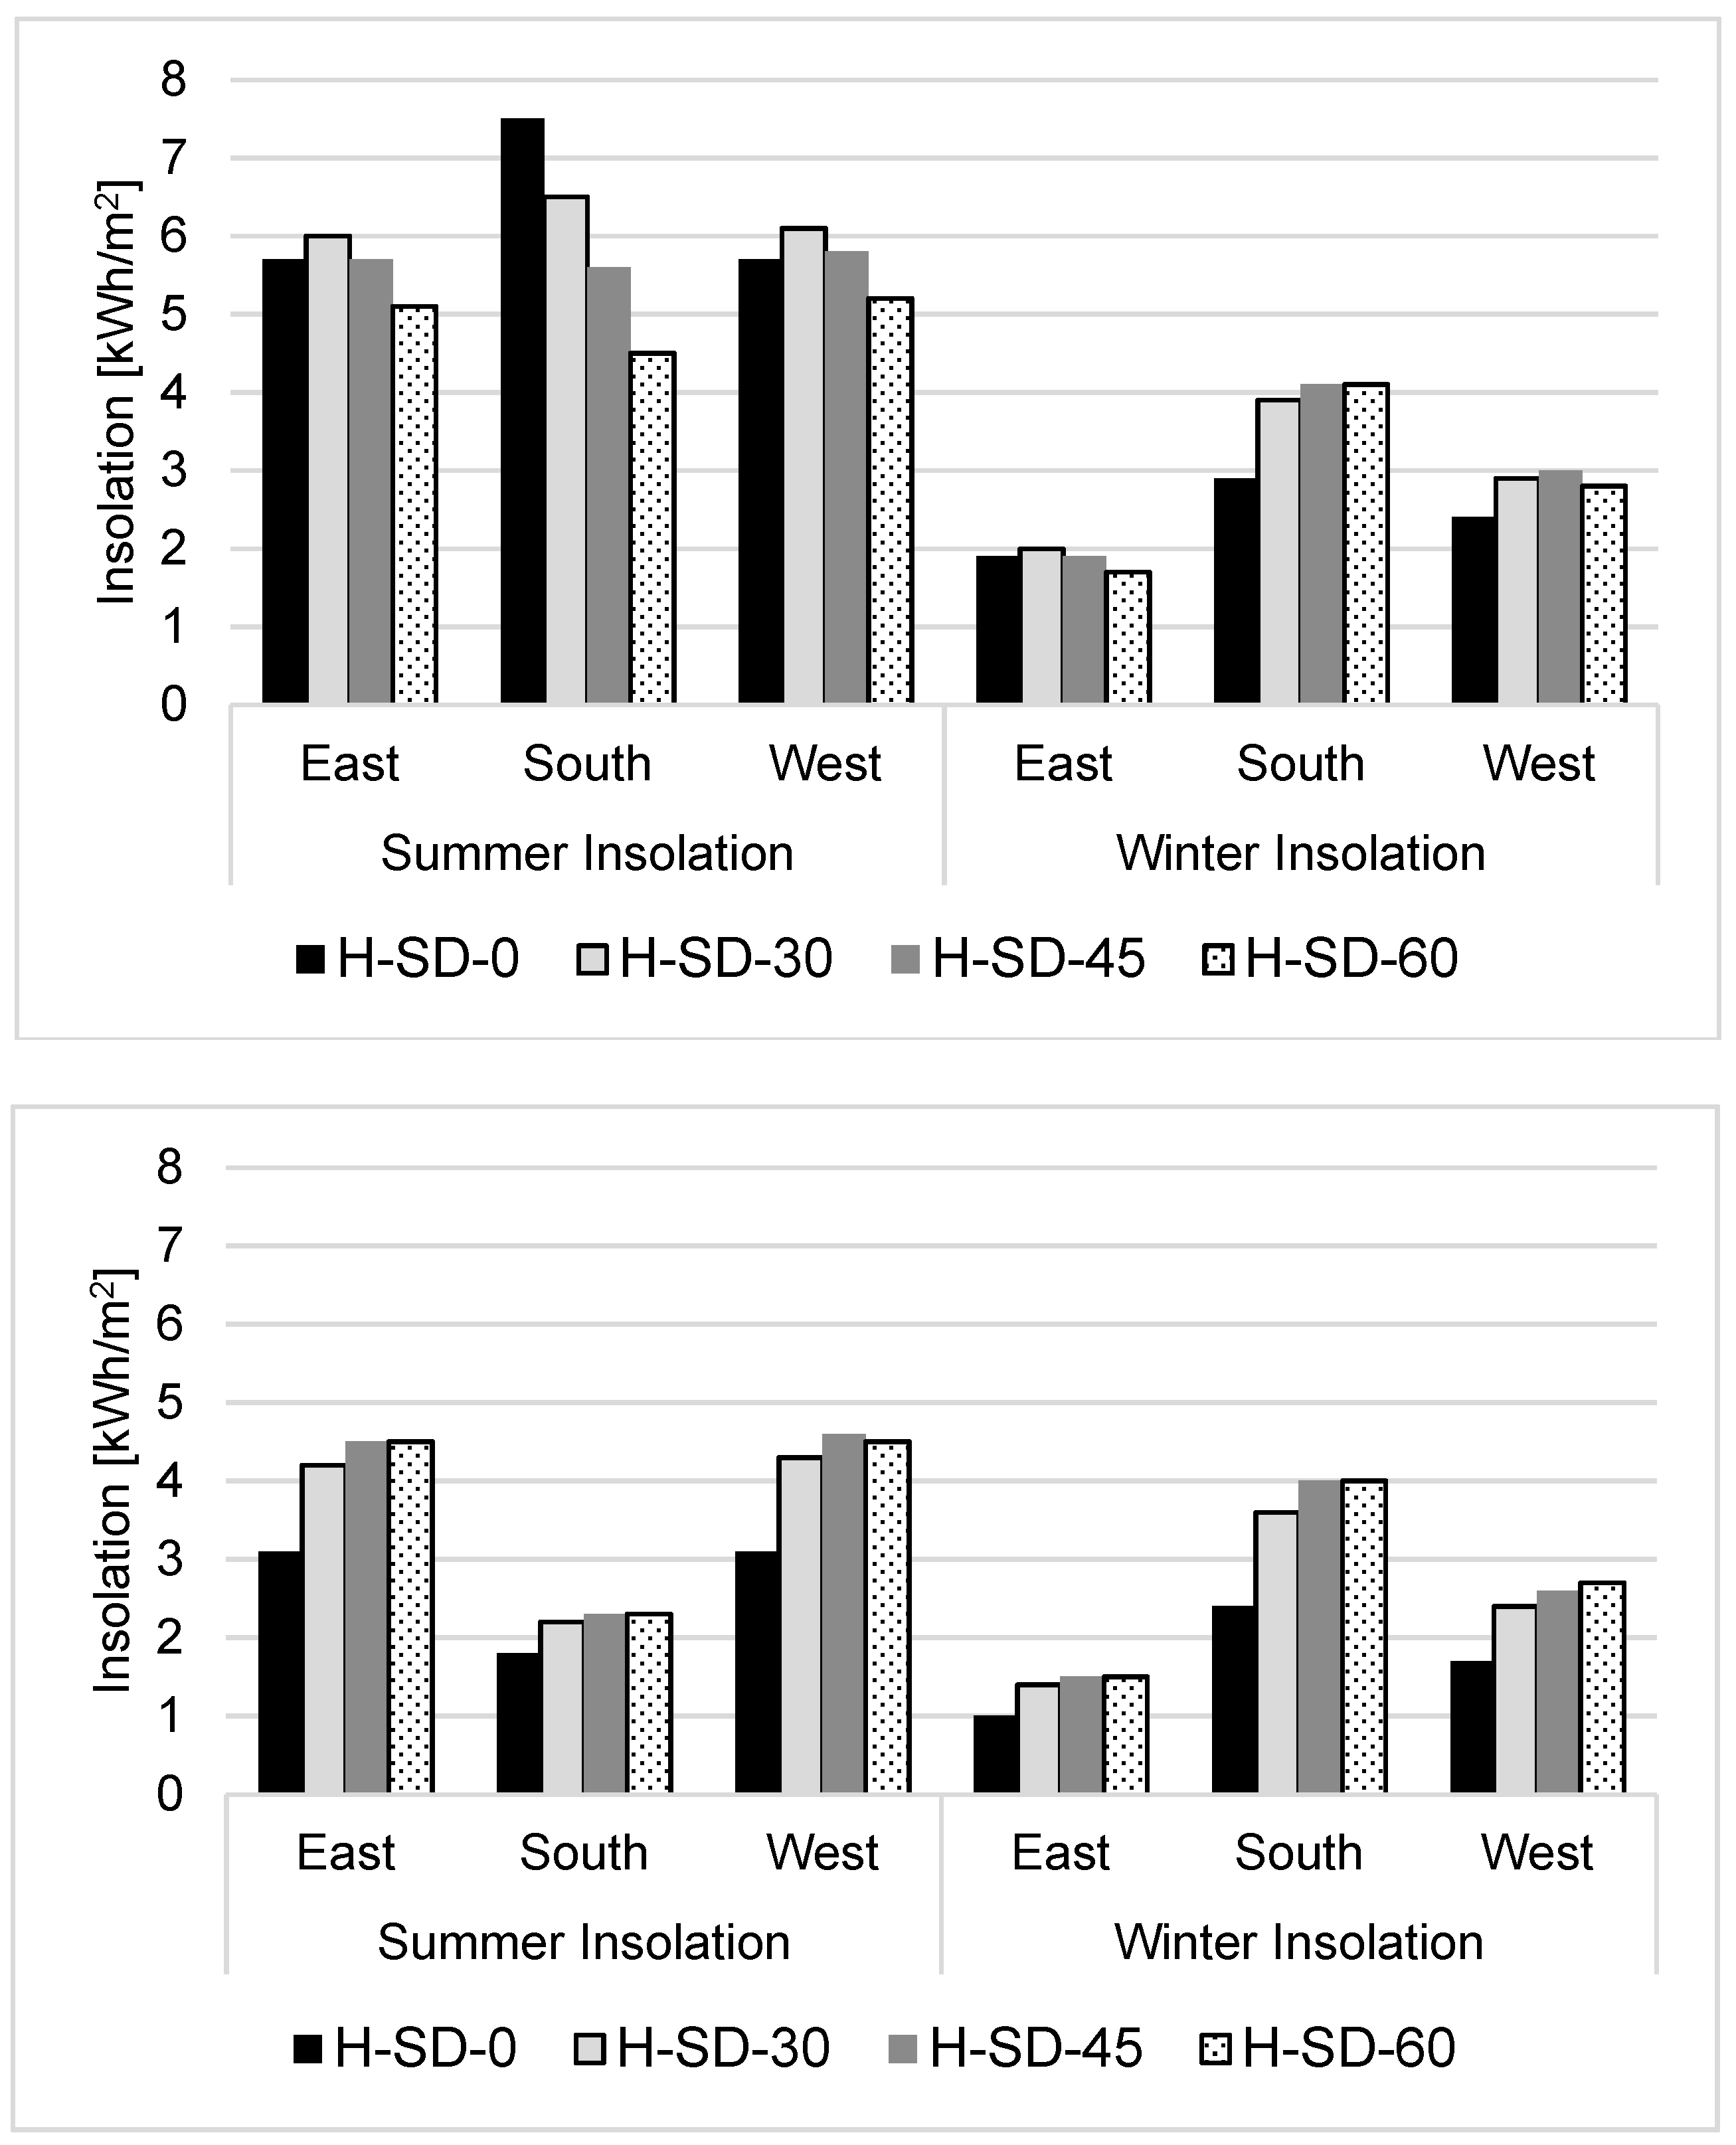
  • Incident Solar Radiation (insolation) over the examined shading device. This is averaged for both summer and winter as an average daily total and has been estimated on the external surface of each shading device as a surface-area-normalised value.
  • The Surface Outside Face Sunlit Fraction, which quantifies the fraction of window exterior surface that is illuminated by beam solar radiation. This equals the window outside face sunlit area divided by the total window area. To estimate this fraction, it is impractical to rely on the average daily value because it considers the night-time hourly values, which are out of question. Therefore, the window sunlit fraction is estimated for each facade during its exposure time as an average hourly value. This has been done considering windows of the middle floor, which experience an average solar exposure compared to the top and bottom floors.
-
Independent variables: Five independent variables are examined here as follows:
  • Climatic conditions (summer and winter conditions).
  • Direction of BIPVs (horizontal and vertical).
  • Orientation of BIPVs (east, south, and west).
  • Inclination angle of BIPVs (0°, 30°, 45°, and 60°).
  • BIPV exposure to the sun (exposed which represents the top or external shading devices; and semi-exposed which represents the internal shaded shading devices).
This resulted in a set of modelling cases that are intended to examine several parameters that are expected to significantly affect the performance of the examined BIPV shading devices. Figure 2 shows the proposed modelling cases. Each shading device was modelled considering summer and winter conditions, three main orientations, and exposed and semi-exposed conditions, which resulted in 96 modelling cases.

2.3. Simulation Tool Selection and Validation

In order to fulfil the intended parametric modelling, the performance of shading devices used as BIPVs is investigated using computerised modelling. Several reliable and validated programs are available in this regard, including DesignBuilder. DesignBuilder provides advanced modelling tools including energy, lighting, and CFD in an easy-to-use three-dimensional interface to draw the examined geometry and present the modelling results. DesignBuilder 5.4 utilises the power of EnergyPlus 8.6 for thermal modelling. EnergyPlus is a collection of several modules that work together to calculate the energy consumption in buildings [29]. In addition to the calculations of heating and cooling loads, EnergyPlus can be used to quantify incident solar radiation and the shading potential of shading devices. EnergyPlus has been validated using the analytical and comparative methods specified in the American Society of Heating, Refrigerating, and Air-Conditioning Engineers (ASHRAE) Standard 140-2014 [35]. Despite the fact that EnergyPlus is a validated simulation tool [36], it is the user’s responsibility to implement the modelling process correctly. This is usually ensured by comparing the simulation results with the experimental results. However, in studies that have no access to experimental testing facilities, it is possible to verify simulation outputs by comparing them to the outputs of mathematical models [37] or the outputs of other simulation tools implemented under similar conditions as presented in the ASHRAE Standard 140-2014 [35]. The study used two available tools in this regard, which are IES VE 2018, and Ecotect Analysis 2011. These tools are holistic simulation packages that could perform several simulation tasks, including thermal and solar simulation.
Thus, this part of the study compares the outputs of DesignBuilder 5.4 with the outputs of IES VE 2018 and Ecotect Analysis 2011 programs. Considering the climatic conditions of Riyadh, Cases H-SD-0 and V-SD-0 were modelled using the three tools under the same geometrical and thermal conditions, as explained above, considering the southern facade. Modelling was carried out for summer (June, July, and August) and for winter (December, January, and February). The study used the normalised insolation levels (kWh/m2) on the shading device as a comparison base. Table 2 shows the obtained results. It is noteworthy that the outputs of the DesignBuilder are consistent with the tools used for comparison, showing a good agreement in general. Summer discrepancy ranged between 4.6% and 7.8%, and winter discrepancy ranged between 2.0% and 7.6%. In general, this comparison, in addition to the previous validation studies mentioned above, seems to justify the use of the implemented DesignBuilder settings for the investigation proposed in this study.

3. Results and Discussion

After the completion of the simulation, the use of shading devices as BIPVs in the proposed cases was assessed depending on the DesignBuilder/EnergyPlus outputs. This has been done considering the average values of summer and winter design weeks specified by DesignBuilder from 20 to 26 July and from 22 to 28 December, respectively. The amount of Incident Solar Radiation (insolation) over the examined configurations of BIPVs is used here as the main indicator of BIPV solar performance. This depends on how much insolation falls on the BIPV and how much area of the BIPV is shaded. The first factor depends on the examined climatic conditions, facade orientation, and PV orientation and inclination angle. The second factor depends on BIPV position, e.g., on the top floor or on the typical floor. Thus, two values are used in the first section of the results discussion: insolation value over the examined configurations of BIPVs, and PV Face Sunlit Fraction. The second section of results discusses the results related to BIPV shading performance in comparison to the observed solar radiation.

3.1. Horizontal BIPV Shading Devices

Figure 3 illustrates the normalised insolation levels recorded for the different cases of the examined horizontal BIPV shading devices. It shows insolation values for each facade at summer and winter as a total daily average considering three inclination angles. Insolation was recorded over the BIPV shading devices installed on the top and typical floors in order to examine any potential shading effect of the top shading devices on the bottom ones. As for the top BIPV shading devices, these are totally exposed to sun. The highest insolation level (7.5 kWh/m2) was recorded in summer in the case of the southern facade with no inclination (H-SD-0). This is because the sun is almost perpendicular to the PV as the solar altitude at noon in summer in Riyadh is 85.9° [33]. This is also in agreement with the average incident solar radiation data of Riyadh [34]. As the inclination angle increases, summer insolation received by PV panels installed on the southern facade incrementally decreases by about 1 kWh/m2 for each case. On the contrary, the solar altitude at noon in winter in Riyadh is 41.8° [33]. This reduces the insolation value received by the horizontal PV panels installed on the southern facade to 2.9 compared to 7.5 kWh/m2 in summer. However, increasing the PV inclination angle in winter increases the PV exposure to sun, which increases the insolation value by about 1.1 kWh/m2 at all the examined inclination angles. The eastern and western facades received a relatively high amount of insolation in summer compared to the southern facade. The highest amount was 6 kWh/m2 in both the eastern and western facades in the case of a 30° inclination angle. In winter, this value drops to 1.9 kWh/m2 in the eastern facade and 2.7 kWh/m2 in the western one. In general, changing the PV inclination angle in the eastern and western facades has less effect compared to the southern facade.
In the case of BIPV shading devices installed on the typical floor, the situation dramatically changed due to BIPV self-shading. This could be observed in Table 3, which shows the Sunlit Fraction values of the examined horizontal BIPV cases. For example, the southern BIPV shading devices are significantly shaded by the upper ones, see Figure 4. The insolation level recorded at the southern facade in summer dropped from 7.5 to 1.8 kWh/m2 in the case of PV with no inclination (H-SD-0). As the inclination angle increases, the observed shading effect on the southern BIPV shading devices slightly ceases (as Sunlit Fraction increased from 0.21 to 0.34) and the summer insolation value slightly increases to about 2.3 kWh/m2. In winter, the impact of this shading effect in Case H-SD-0 is much less due to the lower solar altitude. Thus, the insolation level recorded at the southern facade in winter dropped slightly, from 2.9 in the top floor to 2.4 kWh/m2 in the typical floors. Increasing the PV inclination angle by 30° in winter significantly increases its exposure to the sun, which increases the insolation value from 2.4 to 3.6 kWh/m2. As for the eastern and western facades of the typical floors, insolation values observed at the BIPV shading devices also dropped compared to the top floor. The insolation level recorded at the eastern and western facade in summer dropped from 5.7 to 3.1 kWh/m2 in H-SD-0 as a result of the PV shading effect. As the inclination angle on the eastern and western facades increases, this shading effect ceases (Sunlit Fraction increased from 0.87 to 0.91). Thus, the summer insolation value increased from 4.2 kWh/m2 in the case of the 30° inclination angle to 4.5 kWh/m2 in the case of 60° inclination angle. Similar to the southern facade, the impact of the observed shading effect on the eastern and western facades ceases in winter. In case H-SD-0, the insolation level recorded at the eastern and western facade dropped from 1.9 and 2.4 kWh/m2 in the top floor to 1.0 and 1.7 kWh/m2 in the typical floors of the eastern and western facades, respectively. Increasing the PV inclination angle by 30° in winter slightly increases PV exposure to sun, which increases the insolation value from 1.0 and 1.7 kWh/m2 to 1.4 and 2.4 kWh/m2 for the eastern and western facades, respectively. In general, it could be noted that inclined BIPV shading devices performed better in most of the cases. On the one hand, this is because PV inclination reduces the observed shading effect of the top PV panels on the bottom ones. On the other hand, it improves the insolation intensity over PV panels mainly when the sun is low in winter.

3.2. Vertical BIPV Shading Devices

Similar to the above, Figure 5 illustrates the normalised insolation levels recorded at the different examined cases of vertical shading devices. It shows insolation values for each facade in summer and winter as a total daily average considering three examined inclination angles. Insolation was recorded over the shading devices installed at the beginning and middle of the facade in order to examine any potential shading effect between the shading devices. In general, results showed that despite the fact that vertical shading devices are not recommended on southern facades due to their limited shading potential at noon, especially in the top floors as presented in Figure 4, they could harvest a relatively good amount of insolation in summer compared to the horizontal shading devices. As for the exposed BIPV shading devices installed at the beginning of the southern facade, the normalised insolation level in case V-SD-0 in summer was 3.3 compared to 7.5 kWh/m2, which was observed in the top floor of case H-SD-0. This is about 45% of the amount received by the southern horizontal shading device. This indicates that architects can effectively use vertical louvres as BIPVs on the southern facade. However, their limited shading potential on windows, as numerically presented in Section 3.3, should be enhanced by using other shading means such as blinds. In the case of internal vertical BIPVs installed at the southern facade, the normalised insolation level in summer dropped to 1.8 kWh/m2 due to the PV self-shading effect. This shading effect occurs as a result of the shadow of the external vertical shading devices on the internal ones mainly in summer. Table 4 shows that the BIPV Sunlit Fraction value in this case is only 0.32, which means that about two-thirds of the PV is shaded. The above-mentioned normalised insolation value (i.e., 1.8 kWh/m2) is similar to the one recorded in the typical floors of case H-SD-0, which makes the semi-exposed horizontal and vertical shading devices installed on the southern facade equivalent in terms of harvesting insolation. Insolation values and Sunlit Fraction values recorded at the southern facade remained the same for all the vertical BIPV shading devices as no inclination was tested on this facade.
In winter, the normalised insolation level over the southern exposed BIPV shading devices dropped to 2.1 kWh/m2 compared to 3.3 kWh/m2, which was observed in summer. As for the semi-exposed BIPV shading devices installed in the middle of the southern facade, the insolation value dropped from 2.1 to 1.9 kWh/m2 when comparing summer and winter values. This drop is observed despite the fact that the BIPV Sunlit Fraction in winter increased from 0.32 to 0.90. This means that 32% of BIPV exposure in summer could be more effective in harvesting insolation than 90% of BIPV exposure in winter. As for the eastern and western facades, no significant difference was observed between the external and internal vertical BIPV shading devices. In addition, the insolation value recorded at the internal BIPVs installed on the eastern and western facades generally increases as the inclination angle increases. This is more significant in summer, where tilting the vertical shading devices towards the south increases their exposure to sun and therefore BIPV Sunlit Fraction as presented in Table 4. Thus, the insolation value recorded at the internal BIPVs installed at the eastern and western facades in summer increased from 1.3 in the case of no inclination angle to 2.3, 2.8, and 3.2 kWh/m2 for the inclination angles of 30°, 45°, and 60°, respectively.

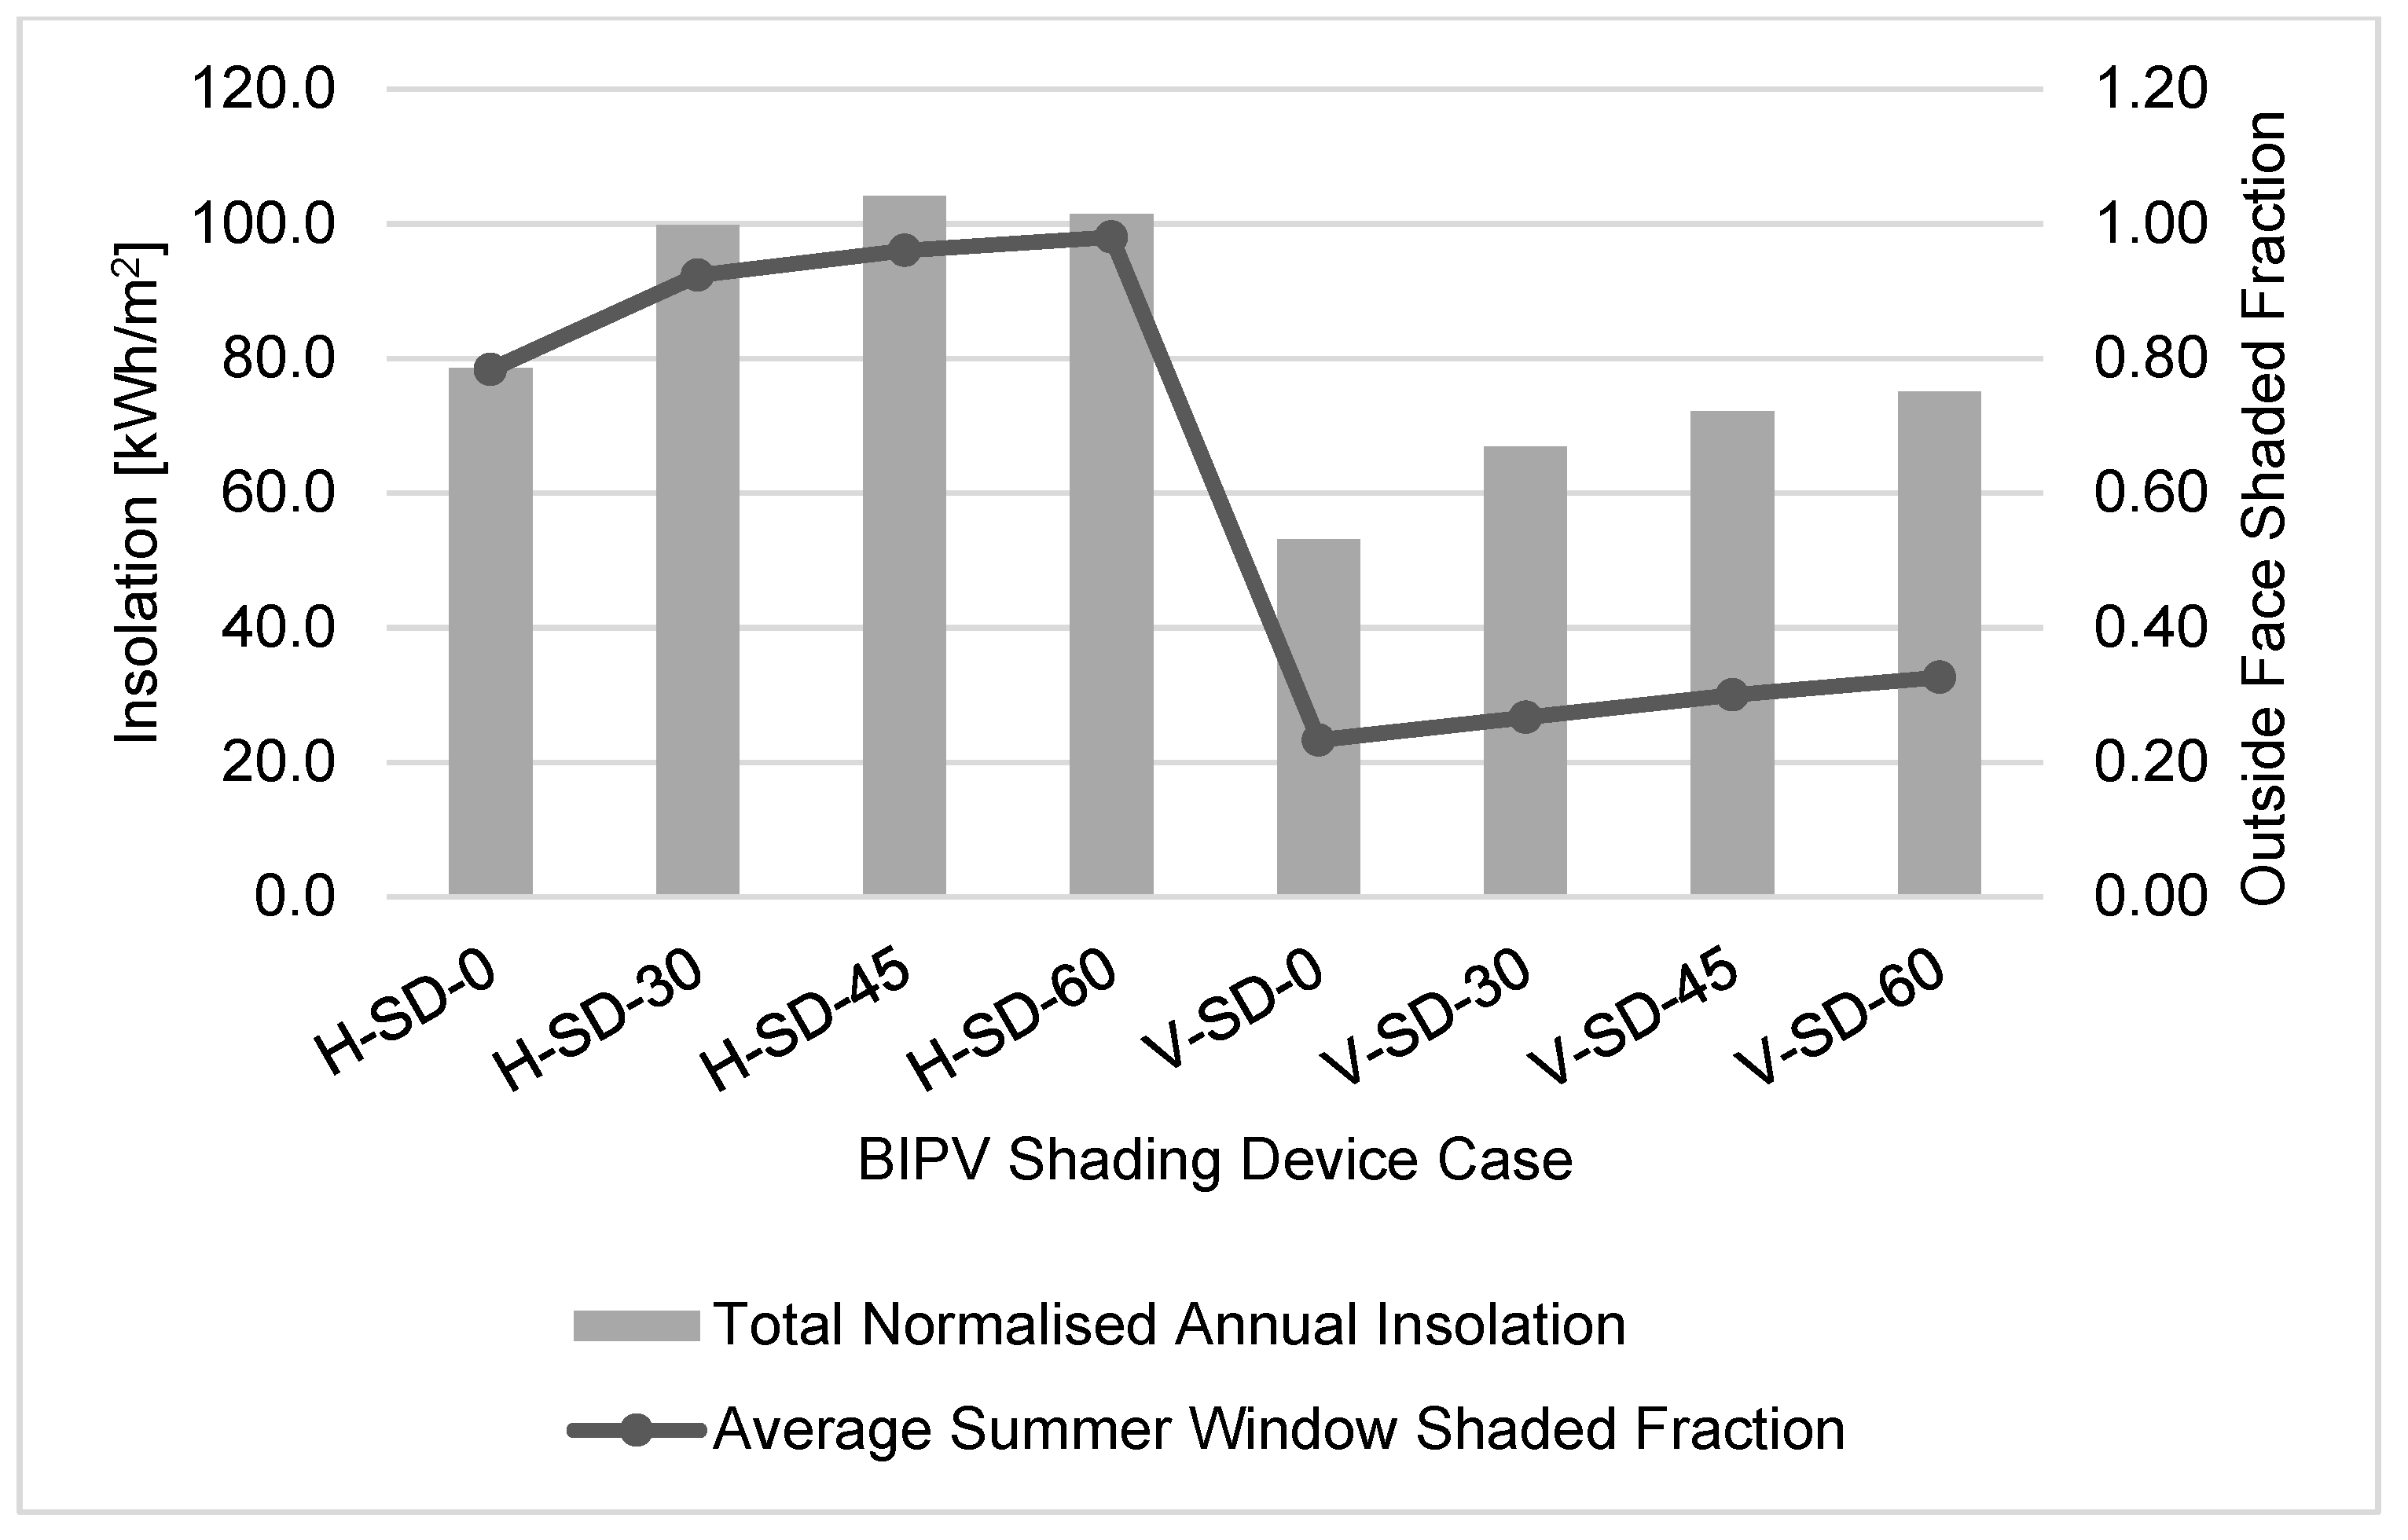
3.3. Solar and Shading Performance Assessment of BIPV Shading Devices

To assess the performance of the examined BIPV shading devices discussed above, the insolation value cannot solely be used as an indicator. This is because some of the examined configurations may provide a relatively high insolation value but may not provide the required window shading, which increases the energy required for cooling in summer considering the examined hot climatic conditions. Some studies [30,31] also suggested that it is also useful to consider the impact of the BIPV shading effect on natural lighting and, accordingly, the required lighting energy. However, the focus in this study is maintained over window shading as an advantage that helps reduce the cooling energy. This is because some estimations suggest that the energy required for lighting the building represents about 15% of the typical building total energy consumption in hot climates [38]. Some estimations also suggest that the ratio between the electricity demand required for lighting and cooling in office buildings located in hot climates is about 1:6. This is due to the current advancement in lighting technology including the use of energy-efficient lighting such as LED technology, in addition to lighting control. In such climates, the heating needs are insignificant [39]. Thus, the window Face Sunlit Fraction is used here to quantify the fraction of the window exterior surface that is illuminated by beam solar radiation. It could also be presented as Outside Face Shaded Fraction, which is adopted here. As for insolation, it is possible to sum up summer and winter insolation values for each inclination angle to find out the higher average annual total value. Given that the PV area is normally distributed over the three facades, the normalised insolation value could be used for comparison. Thus, the main aim is to find out the geometry of BIPV shading devices that offer the best integration of these two variables and the compromise that may be accepted here. Figure 6 shows the obtained results. It may be noted that horizontal BIPV shading devices installed on the eastern, southern, and western facades offered better performance in general compared to the vertical ones.
The case H-SD-45 received the highest amount of annual total insolation (104 kWh/m2) on the eastern, southern, and western facades. This was followed by case H-SD-60 (101 kWh/m2). Both cases offered effective window shading in summer by an average of 96% and 98% of the window area, respectively. On the contrary, the case V-SD-0 received the lowest amount of annual total insolation (53 kWh/m2), preceded by the case V-SD-30 (67 kWh/m2). Both cases offered relatively limited window shading in summer by an average of 23% and 27% of the window area, respectively. The detailed shading potential of BIPV shading devices on these facades is illustrated in Table 5. It shows that the recorded average window shading in summer in the case of horizontal shading devices installed on the eastern and western facades ranges from 67% to 97% of the window area. This was recorded in cases H-SD-0 and H-SD-60, respectively. This shows that as the inclination angle of the horizontal shading devices installed at the eastern and western facades increases, their shading potential increases too. This shows that unlike the common recommendation of avoiding horizontal shading devices on eastern and western facades, it is possible in countries characterised with high solar altitudes such as Saudi Arabia to use them effectively to generate electricity and provide the required window shading.

4. Conclusions

Several concerns face the world today regarding the sustainability of future energy supplies. This includes oil-producing countries such as Saudi Arabia, where oil availability has so far resulted in a limited utilisation of renewable energy sources, especially solar energy. In this context, buildings exposed to the sunny climate of Saudi Arabia could be effectively used to convert solar energy into electricity using building-integrated photovoltaics (BIPVs). Thus, this study has investigated the use of shading devices as BIPVs considering the hot climatic conditions of Saudi Arabia. The study relied on parametric numerical modelling of a generic open-plan office building to examine the potential of eight configurations of photovoltaic integrated shading devices in summer and winter. This included external vertical and horizontal shading devices with the same PV area considering inclination angles of 0°, 30°, 45°, and 60°. The study assumed that the examined horizontal and vertical shading devices are installed consistently, i.e., entirely horizontal or vertical on the three exposed facades. The study found that two performance indicators are essential in the case of BIPVs used as shading devices: the amount of insolation received by PV panels and the amount of shading secured for windows. These two indicators were measured using the area-normalised insolation level of PV panels and the Outside Face Shaded Fraction of building windows.
The study found that the horizontal BIPV shading devices installed on the top floor and the vertical ones installed at the beginning of the building facade could harvest higher insolation values. This is because they are totally exposed to the sun without any PV self-shading. Increasing the PV inclination angle helps in reducing the impact of this self-shading effect without compromising the required window shading. Despite the fact that it is commonly recommended to use horizontal shading devices on southern facades and vertical shading devices at eastern and western facades, the designer may use the same type on all three facades to satisfy some architectural requirements. This situation, in particular, was investigated in this study. The study found that it is possible in countries characterised with high solar altitudes such as Saudi Arabia to use horizontal shading devices on eastern and western facades effectively in summer and in winter to harvest solar radiation and provide the required window shading. In this regard, the case in which the BIPV horizontal shading device was inclined at 45° (H-SD-45) received the highest amount of annual total insolation (104 kWh/m2) on the eastern, southern, and western facades. This was followed by the case H-SD-60, which received 101 kWh/m2. Both cases offered effective window shading in summer by an average of 96% and 98% of the total window area, respectively. The study recommends further experimental verification of the presented results. This would be useful to examine BIPV electricity production considering real-time conditions, especially air temperature and dust deposition. An additional investigation could also be carried out to investigate the impact of the proposed BIPV configurations on natural lighting levels and lighting energy consumption. This could be used to implement an optimisation approach that combines BIPV energy production, shading effect, and impact on the building energy consumption. In addition to the investigated shading devices, there are a variety of PV integration options within the building envelope using a broad range of technologies that could also be investigated. This includes movable BIPV shading devices that have the advantage of blocking unwanted solar gains through windows in summer but not in winter. The use of this large design potential is expected to make BIPV systems a commodity building product and boost its industry and market in the future.

Funding

The work presented in this paper was funded by the Deanship of Research at King Fahd University of Petroleum and Minerals (KFUPM) under Research Project No. SR151007.

Acknowledgments

The author would like to thank King Fahd University of Petroleum and Minerals (KFUPM), Saudi Arabia, which has supported this study.

Conflicts of Interest

The author declares no conflicts of interest.

References

  1. Szokolay, S. Introduction to Architectural Science; Architectural Press: London, UK, 2004. [Google Scholar]
  2. Fath, K.; Hartmann, A.; Wilson, H.R.; Hemmerle, C.; Kuhn, T.E.; Stengel, J.; Schultmann, F.; Weller, B. Life-cycle cost assessment of photovoltaic facade panels. In Proceedings of the Energy Forum on Solar Building Skins, Bressanone, Italy, 6–7 December 2011. [Google Scholar]
  3. Ritzen, M.J.; Vroon, Z.A.E.P.; Rovers, R.; Geurts, C.P.W. Comparative performance assessment of a non-ventilated and ventilated BIPV rooftop configurations in the Netherlands. Sol. Energy 2017, 146, 389–400. [Google Scholar] [CrossRef]
  4. EU. Regulation (EU) No 305/2011 of the European Parliament and of the Council of 9 March 2011. 2011. Available online: https://eur-lex.europa.eu/eli/reg/2011/305/oj (accessed on 10 July 2018).
  5. D’Orazio, M.; Di Perna, C.; Di Giuseppe, E. Experimental operating cell temperature assessment of BIPV with different installation configurations on roofs under Mediterranean climate. Renew. Energy 2014, 68, 378–396. [Google Scholar] [CrossRef]
  6. Wanga, X.H.; Chonga, W.T.; Wong, K.H.; Sawc, L.H.; Laid, S.H.; Wange, C.; Poh, S.C. The Design, Simulation and Testing of V-shape Roof Guide Vane Integrated with an Eco-roof System. Energy Procedia 2017, 105, 750–763. [Google Scholar] [CrossRef]
  7. James, P.A.B.; Jentsch, M.F.; Bahaj, A.S. Quantifying the added value of BiPV as a shading solution in atria. Sol. Energy 2009, 83, 220–231. [Google Scholar] [CrossRef]
  8. Zomer, C.; Nobre, A.; Reindl, T.; Rüther, R. Shading analysis for rooftop BIPV embedded in a high-density environment: A case study in Singapore. Energy Build. 2016, 121, 159–164. [Google Scholar] [CrossRef]
  9. Alnaser, N.W. First smart 8.64 kW BIPV in a building in Awali Town at Kingdom of Bahrain. Renew. Sustain. Energy Rev. 2018, 82, 205–214. [Google Scholar] [CrossRef]
  10. Lee, H.M.; Yoon, J.H.; Kim, S.C.; Shin, U.C. Operational power performance of south-facing vertical BIPV window system applied in office building. Sol. Energy 2017, 145, 66–77. [Google Scholar] [CrossRef]
  11. Yoo, S.; Manz, H. Available remodeling simulation for a BIPV as a shading device. Sol. Energy Mater. Sol. Cells 2011, 95, 394–397. [Google Scholar] [CrossRef]
  12. Morini, M.; Corrao, R. Energy optimization of BIPV glass blocks: A multi-software study. Energy Procedia 2017, 111, 982–992. [Google Scholar] [CrossRef]
  13. Agathokleous, R.A.; Kalogirou, S.A. Double skin facades (DSF) and building integrated photovoltaics (BIPV): A review of configurations and heat transfer characteristics. Renew. Energy 2016, 89, 743–756. [Google Scholar] [CrossRef]
  14. Hu, Z.; He, W.; Ji, J.; Hu, D.; Lv, S.; Chen, H.; Shen, Z. Comparative study on the annual performance of three types of building integrated photovoltaic (BIPV) Trombe wall system. Appl. Energy 2017, 194, 81–93. [Google Scholar] [CrossRef]
  15. Swiss BiPV Competence Centre. Building Integrated Photovoltaics Examples. Available online: http://www.bipv.ch/index.php/en (accessed on 7 August 2018).
  16. Samir, H.; Ali, N.A. Applying building-integrated photovoltaics (BIPV) in existing buildings, opportunities and constrains in Egypt. Procedia Environ. Sci. 2017, 37, 614–625. [Google Scholar] [CrossRef]
  17. Shukla, A.K.; Sudhakar, K.; Baredar, P.; Mamat, R. Solar PV and BIPV system: Barrier, challenges and policy recommendation in India. Renew. Sustain. Energy Rev. 2018, 82, 3314–3322. [Google Scholar] [CrossRef]
  18. Goh, K.C.; Goh, H.H.; Yap, A.B.K.; Masrom, M.A.N.; Mohamed, S. Barriers and drivers of Malaysian BIPV application: Perspective of developers. Procedia Eng. 2017, 180, 1585–1595. [Google Scholar] [CrossRef]
  19. Aste, N.; Del Pero, C.; Leonforte, F. The first Italian BIPV project: Case study and long-term performance analysis. Sol. Energy 2016, 134, 340–352. [Google Scholar] [CrossRef]
  20. Asaee, S.R.; Nikoofard, S.; Ugursal, V.I.; Beausoleil-Morrison, I. Techno-economic assessment of photovoltaic (PV) and building integrated photovoltaic/thermal (BIPV/T) system retrofits in the Canadian housing stock. Energy Build. 2017, 152, 667–679. [Google Scholar] [CrossRef]
  21. Saudi Ministry of Communication and Information Technology. About KSA. Available online: https://www.saudi.gov.sa/wps/portal/snp/pages/aboutksa (accessed on 12 July 2018).
  22. Ramli, M.A.M.; Twaha, S.; Al-Hamouz, Z. Analyzing the potential and progress of distributed generation applications in Saudi Arabia: The case of solar and wind resources. Renew. Sustain. Energy Rev. 2017, 70, 287–297. [Google Scholar] [CrossRef]
  23. Saudi Vision 2030. Available online: http://vision2030.gov.sa/en/node/6 (accessed on 12 July 2018).
  24. Zell, E.; Gasim, S.; Wilcox, S.; Katamoura, S.; Stoffel, T.; Shibli, H.; Engel-Cox, J.; Al Subie, M. Assessment of solar radiation resources in Saudi Arabia. Sol. Energy 2015, 119, 422–438. [Google Scholar] [CrossRef]
  25. Almasoud, A.H.; Gandayh, H.M. Future of solar energy in Saudi Arabia. J. King Saud Univ. Eng. Sci. 2015, 27, 153–157. [Google Scholar] [CrossRef]
  26. Alrashed, F.; Asif, M. Prospects of Renewable Energy to Promote Zero-Energy Residential Buildings in the KSA. Energy Procedia 2012, 18, 1096–1105. [Google Scholar] [CrossRef]
  27. Alaidroos, A.; Krarti, M. Optimal design of residential building envelope systems in the Kingdom of Saudi Arabia. Energy Build. 2015, 86, 104–117. [Google Scholar] [CrossRef]
  28. EnergyPlus. EnergyPlus™ Version 8.6 Documentation. Available online: https://energyplus.net/sites/all/modules/custom/nrel_custom/pdfs/pdfs_v8.6.0/EngineeringReference.pdf (accessed on 28 April 2018).
  29. Assoa, Y.; Mongibello, L.; Carr, A.; Kubicek, B.; Machado, M.; Merten, J.; Misara, S.; Roca, F.; Sprenger, W.; Wagner, M.; et al. Thermal analysis of a BIPV system by various modelling approaches. Sol. Energy 2017, 155, 1289–1299. [Google Scholar] [CrossRef]
  30. Freewan, A. Impact of external shading devices on thermal and daylighting performance of offices in hot climate regions. Sol. Energy 2014, 102, 14–30. [Google Scholar] [CrossRef]
  31. Mandalaki, M.; Zervas, K.; Tsoutsos, T.; Vazakas, A. Assessment of fixed shading devices with integrated PV for efficient energy use. Sol. Energy 2012, 86, 2561–2575. [Google Scholar] [CrossRef]
  32. Zhang, W.; Lu, L.; Peng, J. Evaluation of potential benefits of solar photovoltaic shadings in Hong Kong. Energy 2017, 137, 1152–1158. [Google Scholar] [CrossRef]
  33. SunCalc. Available online: https://www.suncalc.org (accessed on 5 August 2018).
  34. Weather Spark. Average Weather in Riyadh. Available online: https://weatherspark.com/y/104018/Average-Weather-in-Riyadh-Saudi-Arabia-Year-Round (accessed on 2 August 2018).
  35. ASHRAE. Standard 140-2014—Standard Method of Test for the Evaluation of Building Energy Analysis Computer Programs; American Society of Heating, Refrigerating, and Air-conditioning Engineers: Atlanta, GA, USA, 2014. [Google Scholar]
  36. EnergyPlus. Testing and Validation. Available online: https://energyplus.net/testing (accessed on 17 May 2018).
  37. Asfour, O.S.; Gadi, M.B. A comparison between CFD and network models for predicting wind-driven ventilation in buildings. Build. Environ. 2007, 42, 4079–4085. [Google Scholar] [CrossRef]
  38. Katili, A.; Boukhanouf, R.; Wilson, R. Space cooling in buildings in hot and humid climates—A review of the effect of humidity on the applicability of existing cooling techniques. In Proceedings of the SET 2015, Nottingham, UK, 25–27 August 2015. [Google Scholar]
  39. Organization of American States (OAS). Energy Efficiency Guidelines for Office Buildings in Tropical Climates. Available online: http://www.oas.org/en/sedi/dsd/Energy/Doc/8a._Energy_Efficiency_Guidelines_for_Office_Buildings.pdf (accessed on 9 November 2018).
Figure 1. Some integration forms of photovoltaics into building facades [15].
Sustainability 10 04373 g001
Figure 2. The proposed horizontal modelling cases (H-SD) and vertical ones (V-SD), where four BIPV inclination settings are examined.
Sustainability 10 04373 g002
Figure 3. Normalised average daily total insolation levels recorded for the different cases of the examined horizontal shading devices at top floor (top) and typical floor (bottom).
Sustainability 10 04373 g003
Figure 4. Shading patterns observed in cases H-SD-0 and V-SD-0 in summer (left) and winter (right) on the southern facade at 1:00 pm.
Sustainability 10 04373 g004
Figure 5. Normalised average daily total insolation levels recorded for the different cases of the examined vertical shading devices at the beginning (top) and middle (bottom) of the building facade.
Sustainability 10 04373 g005
Figure 6. Total performance indicators of the examined cases of BIPV shading devices.
Sustainability 10 04373 g006
Table 1. Peak solar altitudes on the 1 August 2018 for three example cities characterised by hot climatic conditions [33].
CityLat.Solar Altitude
10 a.m.12 p.m.02 p.m.
Cairo, Egypt30.04° N59.9°77.9°60.5°
Riyadh, Saudi Arabia24.71° N61.4°83.3°61.3°
Sanaa, Yemen15.36° N58.9°86.5°63.5°
Table 2. Insolation values obtained from DesignBuilder compared to IES VE and Ecotect Analysis under summer and winter conditions.
Average Summer Insolation (Kwh/m2)Average Winter Insolation (Kwh/m2)
H-SD-0V-SD-0H-SD-0V-SD-0
IES VE6.873.143.882.31
Ecotect Analysis6.764.154.322.66
Average6.823.654.102.49
DesignBuilder7.143.384.022.31
Discrepancy (%)4.6−7.8−2.0−7.6
Table 3. Average summer and winter building-integrated photovoltaic (BIPV) Sunlit Fraction in the case of horizontal self-shaded BIPVs (installed on the typical floors).
CaseAverage BIPV Sunlit Fraction
SummerWinter
SouthEastWestSouthEastWest
H-SD-00.210.870.880.950.860.86
H-SD-300.240.880.880.950.860.86
H-SD-450.270.900.900.950.870.87
H-SD-600.340.910.910.950.880.88
Table 4. Average summer and winter BIPV Sunlit Fraction in the case of vertical self-shaded BIPVs (installed in the middle of the facade).
CaseAverage Photovoltaic (PV) Sunlit Fraction
SummerWinter
SouthEastWestSouthEastWest
V-SD-00.320.450.460.900.460.48
V-SD-300.320.520.520.900.470.49
V-SD-450.320.580.580.900.470.49
V-SD-600.320.580.580.900.470.49
Table 5. Detailed summer average values of Outside Face Shaded Fraction recorded at the windows of each facade.
BIPV CaseAverage Summer Outside Face Shaded Fraction of Windows
EastSouthWestAverage Total
H-SD-00.671.00.680.78
H-SD-300.881.00.890.92
H-SD-450.941.00.940.96
H-SD-600.971.00.970.98
V-SD-00.100.50.100.23
V-SD-300.150.50.150.27
V-SD-450.200.50.200.30
V-SD-600.240.50.240.33

